Embed Size (px)
Citation preview

\
\,
Neural Networks and Statistical Models or
"Neurons, Neurons everywhere and not a brain in sight"
Derek Powell and Martin Duffy, SAS Software Ltd., Marlow, Bucks, UK.
Abstract There has been much publicity about the ability of artificial neural networks to learn and generalise. In fact, the most commonly used artificial neural networks, called multilayer perceptrons, are similar to non-linear regression and discriminant models that can be implemented with statistical software. This paper explains what neural networks are, translates neural network jargon into statistical jargon and vice versa and shows the relationships between neural networks and statistical models such as generalised linear models etc.
Introduction Neural networks are a wide class of flexible non-linear regression and discriminant models, data reduction models and non-linear dynamic systems. Artificial neural networks are used in three main ways:
• as models of biological nervous systems and "intelligence"
• as real-time adaptive signal processors or controllers implemented in hardware for applications such as robots.
• as data analytic methods.
This paper is concerned with artificial neural networks for data analysis.
Following is a description of a neural network that helps us to understand the way in which a neural network functions.
The origins of neural networks have become vague due to multiple claims of invention and the reasons and methodologies used in their creation, but it is commonly believed that they were initially developed to simulate biological nervous systems by combining many simple computing elements (neurons) into a highly interconnected system in the hope that these systems could give computers some of the attributes of human "intelligence" or "creativity" . Unfortunately even the largest and most powerful computers available today cannot start to emulate the number of neurons in the human brain and this is where some believe lie the answers to intelligence and creativity, the term "superstitious behaviour" has been used to describe some of the unfathomable or incalculable results that have been observed in some of the largest neural networks produced to date.
806
- - - - - -- - - -- ---- -- .-~
- - :; :.: - " •• :.:- -' ~-:;: - < • ~ - -~.
I:

The Neural Network A neUral network is best defined as a set of simple, highly interconnected processing elements or neurons, figure A, that are capable of learning information presented to them. A neural network's ability to learn and process information classifies it as a form of artificial intelligence (AI).
A Neuron
mputs ----------~ Outputs
Figure A
An exciting feature of this technology is that it can be applied to a vast array of problems, many of which would involve a large amount of time and effort in the production of sophisticated theoretical models. This is not to say that these problems cannot be addressed using well established statistical techniques. It is also true to say that neural networks are N!r[ black boxes into which we throw any data and expect magical results to appear at the other end. Neural networks are responsible for making significant advances in the traditional AI fields of speech and visual recognition. Investment managers are creating investment models to better manage money and improve profits. Scientists and engineers use them to model and predict complex phenomena. Marketing professionals are employing neural networks to accurately target products to potential customers. Geologists can increase their probability of finding oil. Lenders use neural networks to determine the credit risk of loan applicants. Complete neurocomputing hardware systems are being built for use in everything from automobiles to manufacturing systems. The variety of problems that can be addressed effectively by neural networks is virtually endless, although the accuracy of the predictions will always depend on the data used to train the network and, as always, the interpretation of the results is as critical as ever.
The main drawback of using a neural network is that while it can give excellent predictions, it is not a formal modelling process. This means that while a model is created, it is not built to increase understanding of the system rather it has the purpose of extracting patterns and trends from the data and using these to either interpolate or extrapolate values. In this way the models created by neural networks can be regarded as being similar to ARIMA type models, in that neither method constructs a model to be explicitly interpreted. Neural networks are therefore complementary to statistical model building, and as such should be seen as another tool in data analysis and N.QI a replacement for the formal modelling process.
A neural network in its basic form is composed of several layers of neurons; an input layer, one or more hidden layers and an output layer. Each layer of neurons receives its input from the previous layer or from the input layer. The output of each neuron feeds the next layer or the output layer of the network. Figure B shows a three layer neural network.
807
, \..
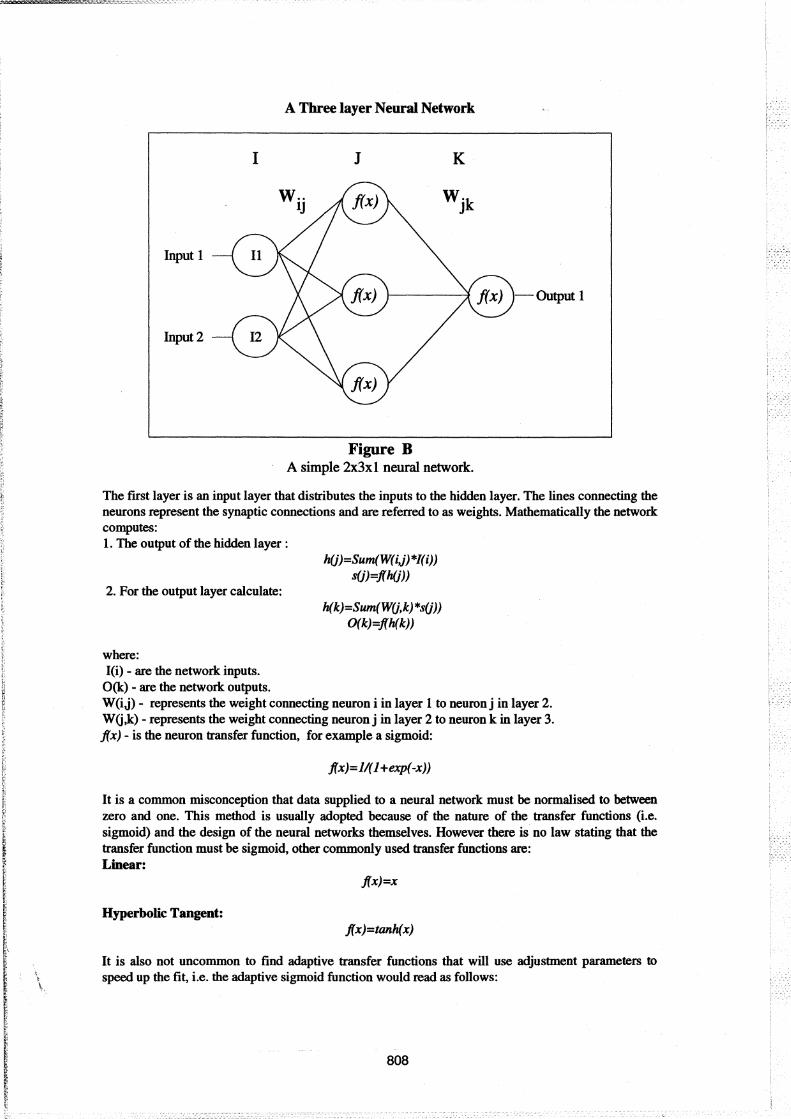
A Three layer Neural Network
I J K
Input 1
Input 2
Figure B A simple 2x3xl neural network.
The first layer is an input layer that distributes the inputs to the hidden layer. The lines connecting the neurons represent the synaptic connections and are referred to as weights. Mathematically the network computes: 1. The output of the hidden layer:
2. For the output layer calculate:
where: I(i) - are the network inputs.
O(k) - are the network outputs.
hlj)=Sum(W(iJ)*I(i» s(j)=Jfhlj»
h(k)=Sum(Wlj,k)*s(j» O(k)=Jfh(k»
W(ij) - represents the weight connecting neuron i in layer 1 to neuronj in layer 2. W(j,k) - represents the weight connecting neuron j in layer 2 to neuron k in layer 3. Jfx) - is the neuron transfer function, for example a sigmoid:
Jfx)=ll(l +exp( -x»
It is a common misconception that data supplied to a neural network must be normalised to between zero and one. This method is usually adopted because of the nature of the transfer functions (i.e. sigmoid) and the design of the neural networks themselves. However there is no law stating that the transfer function must be sigmoid, other commonly used transfer functions are: Linear:
Jfx)=x
Hyperbolic Tangent: Jfx)=tanh(x)
It is also not uncommon to find adaptive transfer functions that will use adjustment parameters to speed up the fit, i.e. the adaptive sigmoid function would read as follows:
808
~"""""""'''',.,'''"';'':''''~'"C'"'':-~--
I Adaptive Sigmoid:
f(x,T)=l/( exp( -xT»
Where T is a value that can be used to speed up the training process called Temperature.
Training such a network involves using data which are values for the inputs and outputs of the neural network. The neural network would learn by adjusting the weights to minimise the error of the outputs. The error function is the objective of the minimisation procedure and defined as:
RMS Error=Sum(Sum((t(p,k)-O(p,k»"2»
where: O(p,k) - is the neural network output k for pattern p. t(p,k) - is the output training pattern p for output k.
Neural networks use algorithms to adjust the weights throughout the network. This process is usually iterative. The data which the neural net analyses is called the "training set" and consists of input/output values which the user knows to be correct. It is from this training set that the neural network will try to generalise a mathematical relationship.
For example, take the following data set which contains three variables:
Input
Independent
0.20 0.60 0.10 1.90 0.80 0.10
or Output
Dependent
0.46 0.90 0.76
The first two variables contain A "training pair" is defined to be a particular input/output pair, e.g., (0.20,0.60) paired with (0.46) above. The experimental data is used by the neural net to estimate the mathematical relationship between training pairs. The process of calculating an error and then adjusting the weights is called "training the network". There are many methods for distributing the error throughout the weights of the network, these methods are often complex and technical, they are normally explained in terms of partial differential calculus.
So a neural network:
- bas several layers - each layer has several neurons - each neuron is connected to all neurons in the layers either side - each connection has a number assigned to it called a "weight.". These are initially
assigned random values.
The neural net trains itself by:
- reading a training pair from the training set - sending the pair through the network (forward propagating) - comparing the output of the network with the true output or dependent variable - computing an error - adjusting all weights by rationing the error throughout the network (back propagation)
This process repeats itself with the next training pair and continues until all errors are small enough. Once done, the network is "trained" and the existing weights represent the neural network's "knowledge". A statistical analogy is that the parameter estimates of a regression have been computed. In fact, if the neural network has been built without a hidden layer it is directly comparable
809
-~;---'.:.--:-------.'~~-~-".~"~ ~ , ., '<"'~.~ __ ~_, __ :;_ .. _'~_'':_: "_:"'.'_ou_

\ t \ ..
to a linear regression.
When a training pair is selected, each value in the input member becomes the "output signal" of a first layer neuron. This initialises the processing step. For example, if the input member of the first training pair is (0.20, 0.6). Thus, the output signal of the 1st neuron in the first layer is 0.20, and the signal of the 2nd neuron is 0.60. Each neuron in the next layer receives an "input signal" from the previous layer. This signal is the weighted sum of the:
- neurons' connection weights to each previous layer neuron - output signals of each neuron in the previous layer
This input signal goes through a "transfer function" whose output signal is between zero and one. This process continues for all the neurons of all hidden layers until the output layer is reached, the output values are subtracted from the target value and the error is distributed throughout the weights of the network (back propogation). Once the error is small enough we call the network "trained" ..
When the transfer function is sigmoid, a direct analogy can be drawn with logistic regression, in this case the neural network has no hidden layer and only one output neuron. The output neuron is the dependent variable in the logistic regression and the input neurons take on the role of the independent variables. Figure C shows a two layer neural network with a logistic transform function in the second layer.
Input 1
Input 2
A Two Layer Network
Figuree Logistic Regression Model
By changing the transfer function the type of regression also changes, thus the transfer function is comparable with the inverse link function for a generalised linear model (GUM). However in practice the overlap between these methods is not as great as would first appear. There are several reasons for this, most are due to the properties of the inverse link function, but also it should be borne in mind that GUMs are usually fitted by maximum likelihood methods, while neural networks are most often trained by least squares.
The form of statistical analysis that is comparable to the neural network changes as the number of layers and neurons in the network change. Take for example a network with one hidden layer and more inputs than hidden neurons as in figure D, this system will produce results that are similar to non-linear regression. However to reproduce these results from non-linear regression can be time intensive, the reason for this is that the neural network creates a linear combination of the inputs in the hidden layer. This combination while similar to principal component analysis is calculated in a different way and so the result is not the same. By following this process it is possible to generate answers close to those of the neural network, the problem is that the amount of effort required to
810
... ,.,-~,~--~- -,-~--~---,
I

develop such a model is very much greater than that required to generate the results from the neural network. On the other hand an insight into the workings of the system being modelled is far more likely to come from the formal modelling process than from the self-organising linear combinations and transforms that go to make up the neural computing view of the system.
I
Input 1 -
Input 2 -
Neural network with one hidden layer
J
FigureD Non-linear Regression
K
Neural networks are often regarded as good prediction tools; this entails extrapolating values from the system under examination. This approach is often not valid as the assumptions underlying the system cannot be extrapolated, the verification of these assumptions are common practice in statistical modelling but all too often are neglected when neural networks are modelled. Therefore it is necessary to treat neural networks with some of the same assumptions given to statistical modelling. Neural networks can do some very strange things when extrapolated; this does not mean that neural methods should not be used to "predict" values outside the range of the training set, rather that they be regarded in the same way as statistical methods always have been, that is to verify that assumptions can be extrapolated and then verify that extrapolated results do have a basis in the real world.
Neural Optimisation Methods Neural networks rely on the optimisation of the values of interconnections to produce a stable set of results, often the methods employed in this task are not as efficient as they may be. In order to produce the most effective network we must be able to train the network across a number of possible layouts. Changes in layout can involve adding or removing neurons in the input layer, most often the changes are in the number of neurons in the hidden layer. As we have already seen by removing or adding neurons in the hidden layer the type of statistical analysis that is equivalent to the network can also change, therefore it is important to have an estimation method that can allow many different forms of the network to be tested. It is only by testing neural networks that their power to predict values can be gauged.
811

It is not only changes to the layout of the neural network that have consequences for the ability of it to produce stable and accurate predictions. As each network has several parameters defining it, each one of these can have major effects on the neural network as a whole. The starting values of the interconnections are important in determining the number of iterations required to train the neural network, a bad set of starting values can drive the neural network to a local optimum from which it may never escape. The convergence criterion, how close we must get to the optimum before calculations are halted, can also effect the stability and accuracy of the network. If the convergence value is too high the network does not produce the correct answers, if the criterion is too low the number of iterations becomes excessive, thus the time taken to train the network becomes uneconomic.
Take the example of a kangaroo trying to reach the top of Mount Everest. The starting value in this case is the place were the kangaroo is released from. The kangaroo does not know where Mount Everest is or how high it is. So if we release the kangaroo in Strasbourg it will most likely climb the Alps and end-up on Mont Blanc, it would then think it had climbed Everest and stop trying to find a higher mountain. What has happened is that because the kangaroo has been given a bad starting value it has become trapped at a local optimum, in this case the highest peak in the Alps. Therefore it is necessary to begin the training process with a number of different starting values, the best starting values can only be decided by trial and error.
Once we have decided on the optimal starting values the convergence level must also be set, this value is common to neural networks and most regression type statistical analyses. For our kangaroo the convergence level is how near to the actual summit it must go, getting to the absolute peak is almost impossible, and even if the kangaroo could get there the amount of time and energy, computational resources, required to reach this point is excessive in most instances. Therefore the convergence level acts as a break point for the process, once the kangaroo is close enough it can claim to have reached it's stopping point, in practice the kangaroo will jump over the peak several times and then have to take smaller backward leaps until it is within the convergence level. The use of such a convergence level is standard practice in most numerical optimisation algorithms.
f--Globaloptimum
Local optimum
\.
FigureE Local and Global optima
Neural computing has created its own methods to optimise the values of the synaptic weights, these are the values on the interconnections between neurons, and on the bias on the neurons in the output and hidden layers. These methods have names like forward link, back propagation, counter
812

r'lOl~o:§"'"''''5\!il§~~_'''''i''''''''''''''''''''''~5=''''~''¥''v'''''-"-:''-~.~-~- .. ~
;
i I ! ; , '.
propagation and so on. While these methods are very efficient on massively parallel computers, they are not as efficient on serial processors such as PCs, this causes problems as it is mainly serial computers that neural networks are run on.
In order to address this problem recall the function that we wish to minimise :
RMS Error=Sum(Sum((t(p,k)-O(p,k)Y'2»
In other words we wish to minimise the Root Mean Square error, this is a standard requirement in statistical model fitting. The theory and indeed practice of minimising RMS error has been a major area of statistical work for most of this century and the methods to minimise it have been applied to computing for almost 40 years. Thus the computational methods that are available in SAS/STAT®, SASlETS® and SAS/OR® software have been optimised to calculate the Root Mean Square error in the most efficient way possible. This reduces computational time and so speeds the training process which is the largest overhead in the process of building a neural network model of any system.
In the case of a forward link neural network, one of the most efficient methods to optimise the weights on the interconnections is to use non-linear regression. This is equivalent to the standard optimisations methods that are used with forward link networks, however non-linear regression methods do have several advantages. The primary advantage is speed, but other pros of using nonlinear regression are that confidence intervals are easily generated as well as diagnostics and prediction intervals. These statistics are standard in the world of statistical model building but tend to be either ignored or glossed over by most neural network literature.
Uses of Neural Networks Neural networks are an excellent form of data analysis as they can handle non-linear data in very efficient ways. One of the primary uses of this technology is in the area of direct marketing; here a mail-shot can be directed at the exact groups required. The standard methods used for this type of application have been CHAID analysis and logistic regression, both methods are highly successful, however even with these methods employed as standard in direct marketing we still all get junk mail, so these methods are not as successful as might be hoped. Neural networks have found a home in this area as a method of making mailing lists more accurate so only those most likely to purchase are mailed, this not only reduces the cost of such marketing exercises but helps reduce unwanted mail. The reason for their success in this area may stem from the fact that most mailing list data are very non-linear, this is because we as humans tend not to follow linear patterns. It is true to say that neural networks will never be totally accurate in this type of application but they are very good at finding patterns in data. In this context they are not a replacement for methods such as CHAID which can provide insights into the structure of the data being modelled.
A recent area of interest for neural computing is in the area of computer performance evaluation (CPE), with the increasing costs of running large computers and the seemingly relentless increase in both data and CPU usage it is now more and more important to optimise the usage of current hardware resources. Neural networks are very good for 'What ifl' analysis, this lets capacity planners run through a number of possible scenarios and see the effects on the performance of any changes to system parameters. This type of analysis is ideally suited to neural networks as computers generate a great deal of information about each operation they undertake. When coupled with a computer performance evaluation tool such as SAS/CPE® the ability to perform analysis on historical data, in
813
-_ .' ,.,_. c •• _
~ ... ',;"'-'~-~ ~--'~'-'- " '-. ,,' _ •• ~. c_ .- ~ _ ..: _ • _~ ••

\
\
order to optimise performance of hardware under a number a different scenarios, is a very powerful tool for any capacity planner. "
Risk analysis is an area of growing importance in the current business climate, this form of analysis requires tools that can model patterns that are often very subtle and highly non-linear. Historically statistical methods such as Cox's Proportional Hazard regression have been used to take account of the risks associated with a system, these methods are very powerful for quantifying risk, however by using neural networks, non-linear risks can be taken into account and thus the risk on the system can be assessed more accurately.
Conclusions Neural networks are systems of simple interconnected processing units called neurons. They are currently being applied to a wide spectrum of tasks, not least of which is the area of data analysis. It would appear that they have functionality to offer to the analyst in terms of a new method which can be used in conjunction with their existing analytical tools, however it would not be true to say that they are a replacement for established modelling techniques. Neural Networks deserve their place in the toolset of the analyst as they are powerful non-linear model fitters, they are not magical black boxes to be used as toys by the inexperienced. Rubbish in, rubbish out is still true and the skills required in the interpretation of the output is as true for neural networks as it is for any other statistical analysis/modelling technique.
Complementary Documentation
Other documents on Neural Networks in the SAS System are now available from the SUGI19 proceedings:
Papers 320, "Neural Network Implementation in SAS® Software"
321, "Neural Networks and Statistical Models"
Author: Warren S. Sarle, SAS Institute Inc., Cary, NC, USA
SAS/OR®, SASIETS®, SAS/CPE®, SAS/STAT® are registered trademarks of SAS Institute Inc.
814
"'~J~~J~O~~" __ .~<'
. ,< ,.: _ :"o-_·:;;'-'':;:''';::'·."l_~;''.''';~-~·-::~_-.<_::


![Neural Networks - Computer Sciencerlaz/prec20092/slides/NeuralNetworks.pdfwell (e.g., the weightless neural networks [93]), while for more complex models of neurons a few units will](https://img.dokumen.tips/doc/110x75/5ea9314b64081048386fd9e9/neural-networks-computer-science-rlazprec20092slides-well-eg-the-weightless.jpg)