Embed Size (px)
Citation preview

1
Network Former Mixing Effects in Alkali Germanotellurite Glasses:
A Vibrational Spectroscopic Study
N.S. Tagiara1, K.I. Chatzipanagis1, H. Bradtmüller2,3, A.C.M. Rodrigues3, D. Möncke4,
E.I. Kamitsos1,*
1Theoretical and Physical Chemistry Institute, National Hellenic Research Foundation,
48 Vassileos Constantinou Ave., 116 35 Athens, Greece.
2Institut für Physikalische Chemie, WWU Münster, Münster, Germany.
3Federal University of São Carlos, Department of Materials Engineering, CP 676,
13565-905 São Carlos, SP, Brazil.
4Inamori School of Engineering at the New York State College of Ceramics,
Alfred University, 1 Saxon Drive, Alfred 14802, New York, USA.
*Corresponding author.
E-mail address: [email protected] (E.I. Kamitsos)

2
Abstract: Alkali germanotellurite glasses of composition 0.3M2O-0.7[(1-x)GeO2-xTeO2], M=Li,
Na and 0≤x≤1, were investigated by Raman and infrared vibrational spectroscopic techniques to
search for the origins of the alkali ion-dependent network former mixing (NFM) effect in these
ion-conducting glasses. The vibrational spectra measured on mixed network-former glasses, and
the spectral comparison between equimolar-mixed glasses (x=0.5) and pellet-mixtures of the
endmember glasses, 0.3M2O-0.7GeO2 and 0.3M2O-0.7TeO2, provided evidence for the formation
of hetero-atomic Ge-O-Te linkages and structural rearrangements in the germanate and tellurite
components of glass. The mixing-induced structural rearrangements were expressed in terms of
chemical equilibria between the network-building units and were used to make qualitative
predictions for changes in the network cross-linking density and the related network-strain energy,
as well as in the binding energy part of the activation energy for ion conduction. Thus, it is
proposed that the mixing-induced structural modifications in the germanate and tellurite parts of
glass cause the cancelation of changes in the binding energy and the network-strain energy
contributions to the activation energy for ion transport. These qualitative predictions were
discussed in the context of the previously found absence of an NFM effect for M=Na and the
presence of a weak positive NFM effect for M=Li.
Keywords: Tellurite glasses, Germanate glasses, Network Former Mixing, Raman spectroscopy,
Infrared spectroscopy, Ion-conducting glasses.
1. Introduction
Mixing network formers introduces an avenue of changing the topology of glass networks while
keeping the network modifier concentrations constant. The concomitant changes of physical
properties upon variation of network former ratios, such as ion-conduction and elastic properties
are often non-linear and, thus, attract wide interest in the field [1-7]. Over the last decade, several
studies have reported network former mixing (NFM) effects in many ternary alkali oxide glass
systems [8-11]. Within such systems, an NFM effect is observed when the magnitude of a physical
property in the ternary glass deviates from the weighted average of the properties of the binary
endmember glasses.
Often, solid-state nuclear magnetic resonance (NMR) spectroscopy is exploited to study
NFM effects by offering insights into the short- and intermediate-range structure of such glasses,

3
i.e., by probing network former connectivity or alkali and alkaline-earth ion distributions.
However, there are elements among the oxide glass-formers that do not exhibit favorable NMR
properties and, therefore, spectroscopic information is sometimes only available from other
spectroscopic or diffraction methods. For instance, in a recent study of GeO2-TeO2 mixed network
former glasses with composition 0.3M2O-0.7[(1-x)GeO2-xTeO2], where M=Li, Na and 0≤ x ≤1, an
alkali-ion-dependent NFM effect was observed for the first time [12]. In particular, the ionic
conductivity was found to exhibit a weak positive NFM effect for M=Li but to correspond to the
weighted average conductivity values of the binary endmembers in the Na-glass system. The
structural origins for these different effects were explored mainly by 125Te solid-state NMR
spectroscopy; however, concrete structural evidence could not be derived from the presented NMR
data because the resolution of the 125Te NMR experiments was insufficient to obtain meaningful
structural information and 95Ge NMR experiments were completely unfeasible. Also, the absence
of spectroscopic evidence for the formation of mixed Ge-O-Te linkages led to the tentative
proposition that the alkali-ion-dependent NFM effect is related to cation-dependent
segregation/phase separation phenomena, which occur for M=Na over a wider distance range than
in the Li-containg germanotellurite glasses [12].
Besides NMR spectroscopy, infrared (IR) and Raman vibrational techniques can provide
insights into the structural characteristics of glasses and their effect on physical properties.
Examples include the probing of both the network structure and the distribution of metal ions, and
their correlation with properties like glass transition [13,14] and ion transport [15] in borate
glasses, basicity in borate [15] and germanate [16] glasses, and elastic properties in tellurite glasses
[17]. In a recent study, a different approach was taken to probe NFM effects in mixed lithium
borotellurite glasses, Li2O-B2O3-TeO2, by comparing weighted average infrared spectra of the
endmember binary glasses with the corresponding spectra measured on mixed network former
glasses [18]. A similar treatment of the Raman spectra appears promising for application in the
otherwise spectroscopically challenging mixed GeO2-TeO2 glass system [12].
In the present work, alkali germanotellurite glasses with composition 0.3M2O-0.7[(1-
x)GeO2-xTeO2], where M=Li, Na and 0≤ x ≤1, are investigated by employing Raman and IR
spectroscopy to shed light on the structures of the germanate and tellurite parts and on their
connectivity in forming the glass network. The results are discussed with reference to the recent

4
NMR study by Bradtmüller et al. on glass samples from the same batch and to the finding that the
NFM effect in ionic conductivity is weakly positive for M=Li but absent for M=Na [12].
2. Materials and methods
2.1 Glass preparation and measurements of physical properties
Alkali germanotellurite glasses 0.3M2O-0.7[(1-x)GeO2-xTeO2] (M=Li, Na and 0≤ x ≤1) were
synthesized by conventional melt quenching [12]. Glass compositions in these Li- and Na-
germanotellurite series are denoted here by MGTX where M=Li, Na, and X=100x. For each
composition, 12 g batches of finely ground Li2CO3 (Oregon L.W., 99.99%), Na2CO3 (Alfa Aesar,
99.95%), GeO2 (Alfa Aesar, 99.999%), and TeO2 (Merck, 99.5%) were mixed, homogenized, and
then melted in a platinum crucible using a bottom-loading high-temperature furnace. Melting
temperatures in the range 780–1130 °C were employed depending on the composition, and melting
times of 30–40 min were chosen. The melts were subsequently splat-quenched on a room
temperature stainless-steel plate using a copper block. The resulting glasses were then heat-treated
at an annealing temperature of 30 °C below Tg for 12 hours to relieve thermal stresses. After slow
cooling to room temperature, the obtained glass specimens were transparent with a yellowish color,
which becomes more intense for higher TeO2 contents. Sodium-containing glasses with high TeO2
content (x>0.5) were hygroscopic and prone to crystallization and thus needed to be re-melted once
at the same conditions. After synthesis, all samples were quickly stored in a dry atmosphere.
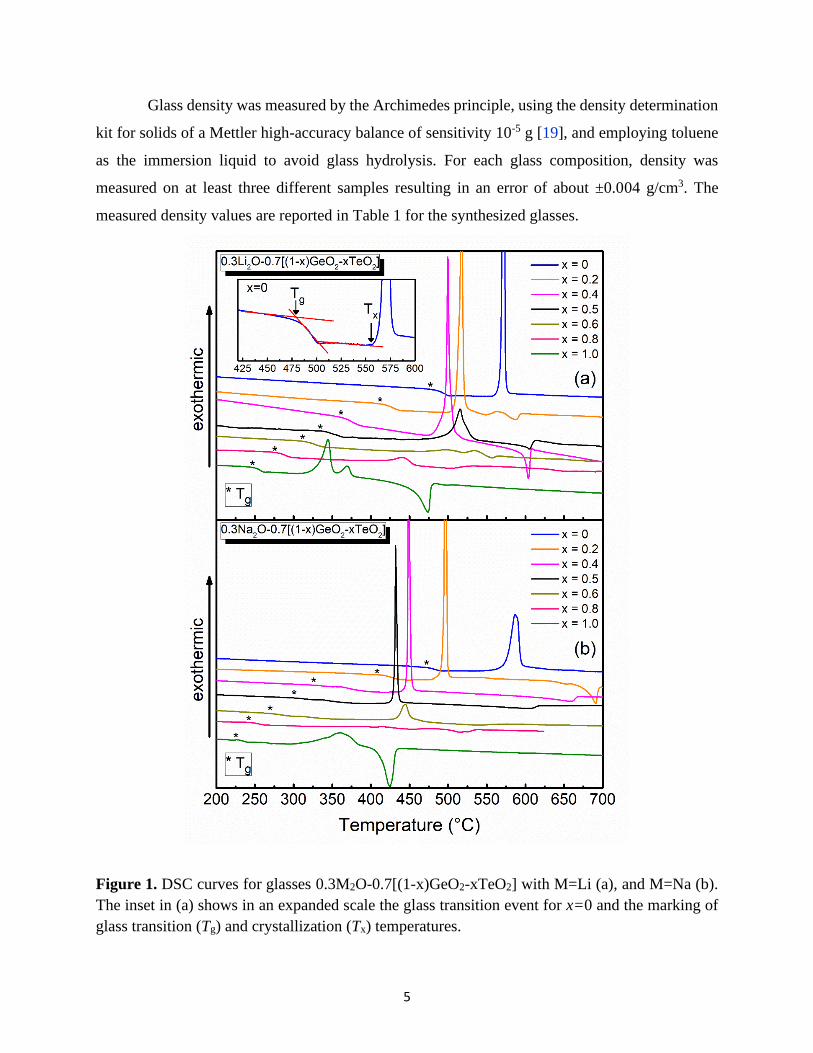
Glass transition temperatures, Tg, were determined before the annealing process by
differential scanning calorimetry (DSC) on bulk pieces in Pt sample containers using a NETZSCH
Thermalische Analyse DSC 404 cell, equipped with a TASC 414/3 controller providing a heating
rate of 10 °C/min. The measured DSC curves for the studied Li- and Na-containing glasses are
shown in Figures 1a and 1b respectively. The Tg values were determined as the onset of the heat
capacity steps during the glass transition process as shown in the inset of Figure1a, where the
crystallization temperature, Tx, is also marked. The obtained values for Tg and Tx are listed in Table
1 as a function of composition, together with values of glass stability (S) against crystallization.
The glass stability is expressed by the difference between the first crystallization onset value and
the glass transition temperature, S=Tx–Tg. The error in determining Tg and Tx is estimated to be
±1°C, leading to an error in the S value of ±1.5°C.
5
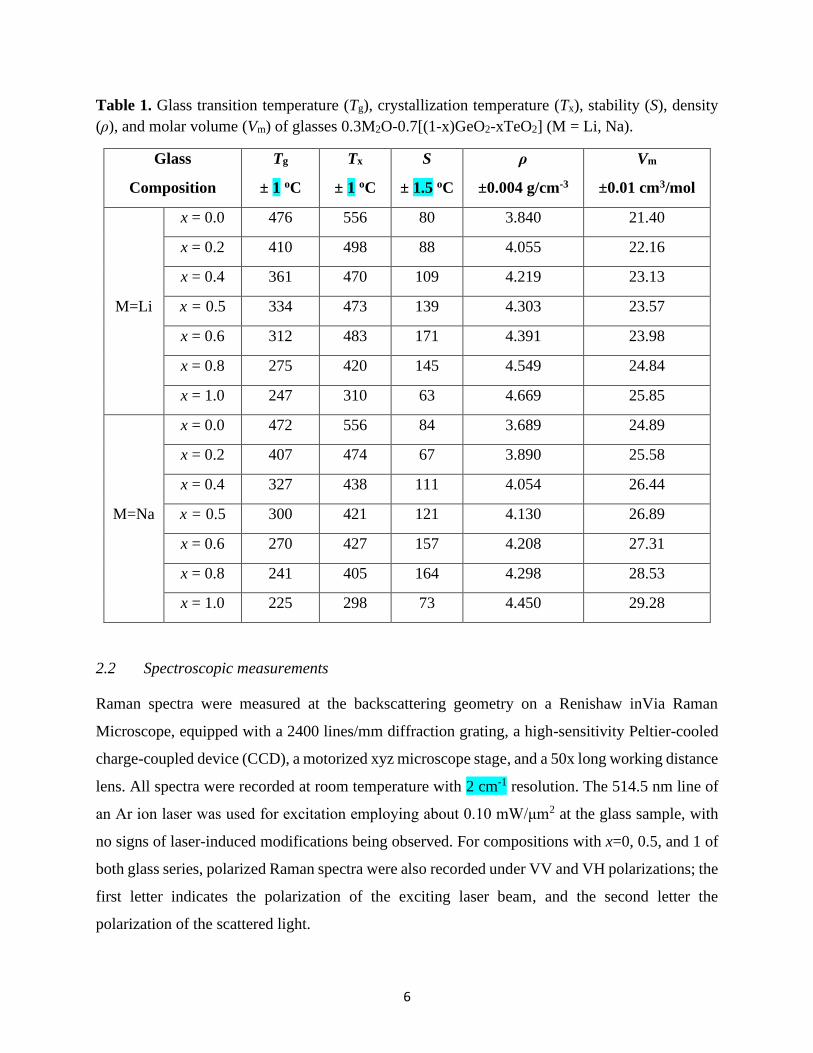
Glass density was measured by the Archimedes principle, using the density determination
kit for solids of a Mettler high-accuracy balance of sensitivity 10-5 g [19], and employing toluene
as the immersion liquid to avoid glass hydrolysis. For each glass composition, density was
measured on at least three different samples resulting in an error of about ±0.004 g/cm3. The
measured density values are reported in Table 1 for the synthesized glasses.
Figure 1. DSC curves for glasses 0.3M2O-0.7[(1-x)GeO2-xTeO2] with M=Li (a), and M=Na (b).
The inset in (a) shows in an expanded scale the glass transition event for x=0 and the marking of
glass transition (Tg) and crystallization (Tx) temperatures.
6
Table 1. Glass transition temperature (Tg), crystallization temperature (Tx), stability (S), density
(ρ), and molar volume (Vm) of glasses 0.3M2O-0.7[(1-x)GeO2-xTeO2] (M = Li, Na).
Glass
Composition
Tg
± 1 oC
Tx
± 1 oC
S
± 1.5 oC
ρ
±0.004 g/cm-3
Vm
±0.01 cm3/mol
M=Li
x = 0.0 476 556 80 3.840 21.40
x = 0.2 410 498 88 4.055 22.16
x = 0.4 361 470 109 4.219 23.13
x = 0.5 334 473 139 4.303 23.57
x = 0.6 312 483 171 4.391 23.98
x = 0.8 275 420 145 4.549 24.84
x = 1.0 247 310 63 4.669 25.85
M=Na
x = 0.0 472 556 84 3.689 24.89
x = 0.2 407 474 67 3.890 25.58
x = 0.4 327 438 111 4.054 26.44
x = 0.5 300 421 121 4.130 26.89
x = 0.6 270 427 157 4.208 27.31
x = 0.8 241 405 164 4.298 28.53
x = 1.0 225 298 73 4.450 29.28
2.2 Spectroscopic measurements
Raman spectra were measured at the backscattering geometry on a Renishaw inVia Raman
Microscope, equipped with a 2400 lines/mm diffraction grating, a high-sensitivity Peltier-cooled
charge-coupled device (CCD), a motorized xyz microscope stage, and a 50x long working distance
lens. All spectra were recorded at room temperature with 2 cm-1 resolution. The 514.5 nm line of
an Ar ion laser was used for excitation employing about 0.10 mW/μm2 at the glass sample, with
no signs of laser-induced modifications being observed. For compositions with x=0, 0.5, and 1 of
both glass series, polarized Raman spectra were also recorded under VV and VH polarizations; the
first letter indicates the polarization of the exciting laser beam, and the second letter the
polarization of the scattered light.

7
Infrared (IR) spectra were measured on a vacuum Fourier transform spectrometer (Bruker,
Vertex 80v), in quasi-specular reflectance mode (11o off-normal). Reflectance spectra were
separately recorded in the far-IR and mid-IR range and then merged to form a continuous spectrum
in the range 30–7000 cm-1. All spectra were measured against a high reflectivity gold mirror at
room temperature with 4 cm-1 resolution. Analysis of reflectance spectra by Kramers–Kronig
transformation yielded the absorption coefficient spectra, 𝑎(𝑣), from the expression 𝑎(𝑣) =
4𝜋𝑣𝑘(𝑣) where 𝑣 is the infrared frequency in cm-1 and 𝑘(𝑣) is the imaginary part of the complex
refractive index [20].
3. Results
3.1 Glass properties
Table 1 summarizes the bulk properties of the studied glasses. The presently measured densities
and glass transition temperatures for the endmember Li- and Na-tellurite glasses are in very good
agreement with the reported property values on the same glass compositions [21]. This is also the
case for reported density [22,23] and glass transition temperature [24] values for the endmember
Li- and Na-germanate glasses.
The composition dependence of thermal properties (Tg, Tx, S) and glass molar volume
(Vm=molecular weight/density) is shown in Figure 2. In both systems, Tg decreases in a non-linear
way with increasing TeO2 content (Figure 2a,b), similarly as observed in previous studies on mixed
B2O3-TeO2 glasses [25]. On the other hand, the behavior of the crystallization temperatures is more
complex; for M=Li, Tx values correspond well to the weighted average values of the endmember
compositions (endmember interpolation) for 0≤x≤0.4 and deviate to higher values for higher TeO2
contents (Figure 2a). For M=Na, Tx exhibits first a negative deviation from the interpolation of
endmember values up to x=0.5, and then a positive deviation for larger x values (Figure 2b). As a
consequence of these trends in Tg and Tx, the mixing of GeO2 and TeO2 results in a clear
enhancement of glass stability in the entire glass-forming range of the M=Li system (Figure 2c).
However, the stability of the Na-glass system first decreases for x<0.3 and then increases at higher
TeO2 contents (Figure 2d).
The molar volume is found to vary linearly with composition for M=Li (Figure 2e) and to
show a slight negative NFM effect for M=Na (Figure 2f).

8
Figure 2. Top (a, b): Glass transition (Tg) and crystallization (Tx) temperatures; Middle (c, d):
Glass stability (S), and Bottom (e, f): Molar volume (Vm) for glasses 0.3M2O-0.7[(1-x)GeO2-
xTeO2] with M=Li (a, c, e) and M=Na (b, d, f). Dashed lines connect the data points of the
endmember glasses and serve as guides to the eye in identifying network former mixing effects.
3.2 Glass structure
The Raman and infrared spectra of the sodium- and lithium-germanotellurite glasses are quite
similar and can be presented and interpreted jointly. In this context, Figure 3 shows the Raman
spectra for both glass systems MGTX (M=Na, Li), and Figure 4 shows the polarized Raman
spectra of the binary sodium (lithium) germanate and sodium (lithium) tellurite glasses, as well as
those of the mixed network former glasses at maximum mixing (NaGT50 and LiGT50). Figure 5
shows the infrared absorption spectra of MGTX glasses, derived from the specular reflectance

9
measurements after Kramer-Kronig inversion. In Figure 6 (Raman) and Figure 7 (IR) a comparison
is made between the spectra measured on the glasses NaGT50 and LiGT50 and on the equimolar
mixtures - in pellet form - of the corresponding endmember glasses (x=0 and x=1).
3.2.1 Βinary alkali-germanate glasses
Starting with the Raman spectra of the binary alkali-germanate glasses 0.3M2O-0.7GeO2 (x=0 in
Figure 3a,b), we note the presence of dominant band envelopes at 450-650 cm-1 and 700-950 cm-
1. The first broad and asymmetric envelope, with maximum intensity at 530 cm−1 (Na) and 545
cm−1 (Li), has been attributed to the symmetric stretching of Ge−O−Ge bridges, νs(Ge−O−Ge) [26-
28]. The shoulder near 605 cm-1 (Na) characterizes structures in which GeO4 tetrahedra and GeO6
octahedra link to form a three-dimensional network, in analogy to the structure of Na4Ge9O20
involving Ge4-O-Ge6 and Ge6-O-Ge6 bridges, where the subscript denotes the coordination number
of Ge [26, 27]. Besides the 605 cm-1 shoulder, the Raman spectrum of the NaGT0 glass shows
weak signals at 325 and 650 cm-1 which are also related to GeO6 octahedra. It is noted that such
Raman signatures are not seen in the spectrum of the LiGT0 glass.
The nature of Ge−O−Ge bridges giving rise to the main component of the 530-550 cm-1
envelope depends on the alkali content; for low alkali content glasses, these are Ge44-O-Ge4
4
bridges in four- or three-membered rings made of Ge44 tetrahedra, where the superscript denotes
the number of bridging oxygen atoms on Ge. For alkali-rich glasses, bridges of the type Ge44-O-
Ge43 are also formed between Ge4
4 tetrahedra with four bridging oxygen atoms and Ge43 tetrahedra
with three bridging and one non-bridging oxygen (NBO) atom; these are known also as Q4 and Q3
germanate tetrahedral sites.
The second strongest band envelope is found between 700 and 950 cm-1 with a dominant
peak at 865 cm-1 for M=Na and 850 cm-1 for M=Li. This strong peak has been assigned to the
symmetric stretching of Ge43 (Q3) units and involves mainly the stretching of Ge-NBO bonds, Ge-
O- [26-31]. The analogous stretching mode of Ge42 (Q2) units is active at a lower frequency, around
755-790 cm-1 depending on the charge balancing cation, with Q2 units forming above 20 mol%
Li2O and above ca. 30 mol% M2O for M=Na, K, Rb, Cs [23, 26-31]. For the NaGT0 glass of this
study (Figure 3a, x=0), the Q2 band could correspond to the ca. 775 cm-1 feature [23,30,31], which
appears as a shoulder of the Q3 band at 865 cm-1. The second weak shoulder at around 740 cm-1
for M=Na was assigned to Ge-O stretching in higher coordinated germanate polyhedra with Ge

10
atoms in five- and/or six-fold coordination and its intensity was primarly found to change in the
order Na>K>Rb≈Cs [31].
Figure 3. Raman spectra of sodium (a) and lithium (b) mixed network germanotellurite glass series
0.3M2O-0.7[(1-x)GeO2-xTeO2], M=Na, Li and 0≤x≤1. The spectra were normalized to their most
intense higher frequency band and offset for comparison.
Having associated GeO6 octahedra with the Raman features at 325, 605, and 650 cm-1, an
alternative assignment for the ca. 740 cm-1 shoulder for M=Na could be the asymmetric stretching
of Q3 germanate tetrahedral units. To explore this possibility and assist further in assigning Raman
and IR bands, we have measured the polarized Raman spectra presented in Figure 4 for the binary
(x={0, 1}) and ternary (x=0.5) germanotellurite glasses 0.3M2O-0.7[(1-x)GeO2-xTeO2]. As
observed in Figure 4a, the spectrum of the NaGT0 glass exhibits strongly polarized Raman features
at 325, 530, 605, 650, and 865 cm-1; this suggests their assignment to symmetric vibrational modes.

11
However, the contributions at ca. 740 and 775 cm-1 appear depolarized as they retain considerable
relative intensity in the VH spectrum, especially concerning the 865 cm-1 Q3 band. Therefore, the
740 and 775 cm-1 features may rather be attributable to asymmetric vibrational modes and, as such,
are expected to be particularly active in the infrared spectrum. Indeed, the IR spectrum of the
NaGT0 glass in Figure 5a shows its stronger band at about 775 cm-1. For Q3 germanate tetrahedral
species with C3v symmetry one would expect the asymmetric stretching mode (ν3) to split into two
components, A1(R,IR)+E(R,IR), both being Raman (R) and infrared (IR) active [32]. On these
grounds, the IR band at 775 cm-1 of NaGT0 could be the convolution of the A1 and E type
components of the ν3 mode of Q3 species, with Raman activities at about 740 and 775 cm-1.
Figure 4. Parallel-polarized (VV, blue) and cross-polarized (VH, red) Raman spectra of binary (a,
b, e, f) and ternary (c, d) Na- and Li-germanotellurite glasses 0.3M2O-0.7[(1-x)GeO2-xTeO2],
M=Na, Li. The notations NaGTX and LiGTX indicate glass compositions for M=Na and M=Li,
respectively, with X being the TeO2 content in mol%, i.e., X=100x.

12
The VH Raman spectrum of the LiGT0 endmember shows its high-frequency envelope
peaking at ca. 815 cm-1 (Figure 4b), where the corresponding IR spectrum exhibits its largest
intensity (x=0 in Figure 5b). This suggests that the ν3 mode of Q3 germanate species should be
active at 815 cm-1 for the LiGT0 glass and, thus, its Raman shoulder at about 760 cm-1 should be
of different origin. Indeed, the Raman feature developing at 760 cm-1 for Li2O contents above 20
mol% was associated with the formation of Q2 germanate species [23].
Figure 5. Infrared spectra of sodium (a) and lithium (b) mixed network germanotellurite glasses
0.3M2O-0.7[(1-x)GeO2-xTeO2] with M=Na, Li and 0≤x≤1. The spectra were normalized to their
most intense higher frequency band and offset for comparison.
The IR spectrum of the NaGT0 glass (Figure 5a, x=0) shows better-resolved features at
350 cm-1, around 575 cm-1 with a pronounced shoulder at 500 cm-1, and a high-frequency strong
envelope with distinct maxima at about 775 and 835 cm-1. Compared to NaGT0, the IR spectrum

13
of the LiGT0 glass shows considerably broader features (Figure 5b, x=0). According to previous
infrared studies on Rb- and K-germanate glasses, and the polarization characteristics of the Raman
spectra in Figure 4, the IR bands can be assigned to the rocking motion of Ge-O-Ge bridges near
350 cm-1, to the bending modes of Ge-O-Ge bridges around 450-600 cm-1, to the asymmetric
stretching of Q3 species at 775 cm-1 for M=Na and at 815 cm-1 for M=Li, and to the asymmetric
stretching of Ge-O-Ge bridges around 835 cm-1 [26,27,33]. We note also that this high-frequency
band at 835 cm-1 for NaGT0 encompasses the asymmetric stretching of Ge4-O-Ge4 and Ge4-O-Ge6
bridges.
The vibrations of Na+ and Li+ ions against their oxide sites, ν(Μ-Ο), are expected around
200 and 400 cm-1 in germanate glasses [34]. The Li-O vibration (~400 cm-1) couples with the Ge-
O-Ge rocking mode (~350 cm-1) and the Ge-O-Ge bending mode (500 cm-1) and this gives rise to
the broad envelope extending from about 250 to 650 cm-1 (Figure 5b). Coupling of vibrational
modes has been observed before in glasses with high field strength ions [35]. The Na-O vibration
is at lower frequency, around 230 cm-1, and appears as a weak shoulder of the Ge-O-Ge rocking
band (Figure 5a).
According to the Dachille and Roy approach [36], the average coordination number (CN)
of germanium can be estimated from the position of the high-frequency IR band which results
from the convolution of the νas(Ge4-O-Ge4) and νas(Ge4-O-Ge6) vibrational modes. This approach
was applied to Rb- and K-germanate glasses and resulted in the simplified expression K= 5.6𝐶𝑁
𝜆2
where 𝜆 is the wavelength (in µm) corresponding to νas(Ge−O−Ge) and K takes the value K=0.172
[26,27,33]. Using for νas(Ge-O-Ge) the band maximum observed at 835 cm-1 for the NaGT0 glass
(Figure 5a), we estimate an average Ge coordination number of CN(Ge)=4.4. Although our Raman
spectrum of this glass indicates that the higher coordination state of Ge is six-fold, the presence of
five-fold coordinated germanate species cannot be excluded. The IR spectrum of the LiGT0 glass
has no resolved component at the high-frequency side of the 815 cm-1 band (Figure 5b), suggesting
the absence of Ge4-O-Ge6 bridges or a very small content of GeO6 units in this glass. This is in
agreement with the absence of Raman features at about 325, 605, and 650 cm-1 which would
designate the presence of GeO6 species (Figure 3b).
As presented above, the presence of Ge in six-fold coordination in glass NaGT0 was
inferred from the IR spectrum by considering the influence of Ge6 on the νas(Ge−O−Ge) mode.
The stretching modes of Ge-O bonds in GeO6 octahedra in the infrared are expected at frequencies

14
similar to the bending mode of Ge-O-Ge bridges, i.e. around 500 to 650 cm-1 [37,38]. In the
infrared study of crystalline LiCrGeO4, a band at 447 cm-1 was assigned to Li-O stretching for
tetrahedral coordinated Li+ ions, and bands at 526 and 623 cm-1 were associated with GeO6
octahedral units. The absence of IR bands at higher frequencies was taken to indicate the absence
of tetrahedral GeO4 species in this germanate crystal.
In summary, the Raman and IR spectra of the 0.3Na2O-0.7GeO2 glass (NaGT0) show that
the germanate network involves tetrahedral Q3 units and octahedral GeO6 units, while the results
for the 0.3Li2O-0.7GeO2 glass (LiGT0) are consistent with the presence of tetrahedral Q3 and Q2
units. The preferences of Na+ ions for GeO6 units and of Li+ ions for Q2 units reflect their difference
in ionic field strength.
3.2.2 Binary alkali-tellurite glasses
The Raman spectra of the pure sodium- and lithium-tellurite glasses 0.3M2O-0.7TeO2 (x=1 in
Figures 3a and 3b) agree well with published spectra on the same or similar tellurite glass
compositions [17-19, 39]. They exhibit a high-frequency envelope with peaks at 668/680 cm-1 and
777/760 cm-1 for M=Na/Li, and bands with lower intensity at 470/465 cm-1 and ca. 300 cm-1. Band
assignments follow earlier publications and reflect a partially modified tellurite network [17-19,
39-43]. In particular, the highly polarized peak at 668/677 cm-1 (Figures 4e and 4f) is due to the
remaining TeO4 trigonal pyramids (tbp’s), as it results from the symmetric stretching/breathing
mode of Te-O2-Te double bridges, νs(Te-O2-Te), connecting TeO4 units [43]. The higher intensity
peaks at 775/767 cm-1 are also polarized and are due to the symmetric stretching of TeO3+1
polyhedra with contribution from TeO32– trigonal pyramids (tp’s) with three terminal oxygen
atoms. The notation TeO3+1 indicates a tbp unit with one terminal oxygen atom and three bridging
oxygen atoms, with one bridging Te-O bond being comparatively longer than the other three Te-
O bonds [44]. The weaker component at 470/462 cm-1 arises from the stretching-bending vibration
of Te-O-Te single bridges, and the very weak contribution at about 300 cm-1 from O-Te-O bending
[43]. As observed in Figures 4e and 4f, the above Raman peaks are also polarized suggesting their
association with symmetric vibrational modes.
While the Raman spectra of Na- and Li-tellurite glasses are dominated by symmetric
stretching and bending vibrations of tellurite species, the corresponding asymmetric vibrational
modes are strongly active in the infrared (x=1 in Figures 5a and 5b). Thus, the presence of TeO4

15
units is signaled by the 620/630 cm-1 peak, TeO3+1 units by the ca. 700/720 cm-1 feature, and TeO32–
units by the higher-frequency contribution at 765/763 cm-1. The asymmetric stretching-bending
mode of Te-O-Te bridges is observed around 360 cm-1 for M=Na. The analogous mode for the Li-
tellurite glass overlaps with the Li-oxygen vibration at a higher frequency, resulting in the broad
envelope peaking at about 430 cm-1.
3.2.3 Ternary alkali-germanotellurite glasses
The Raman spectra of mixed former glasses 0.3M2O-0.7[(1-x)GeO2-xTeO2] show that the most
pronounced changes occur when the second former oxide is added to the binary glass, that is for
0≤x≤0.2 and 0.6≤x≤1.0 (Figure 3). Starting with TeO2 addition, a quite drastic decrease in intensity
is noted for the Q3 germanate band at 865/850 cm-1 with the parallel appearance of a
disproportionally strong tellurite band at 767/773 cm-1 (x=0.2 in Figures 3a and 3b). Such large
differences in Raman intensity between the tellurite and germanate species should result from the
considerably higher polarizability, α, of the Te4+ ion compared to Ge4+, with 𝛼Te4+=1.595 Å3 and
𝛼Ge4+=0.137 Å3 [45]. Since the Raman intensity is proportional to the square of the polarizability
derivative with respect to the normal coordinate of the mode, the Raman cross-section of tellurite
vibrations would be significantly larger compared to germanate-related modes. Consequently,
even a small number of tellurite species in a germanate matrix is expected to give relatively strong
Raman signals. Likewise, small to medium GeO2 contents in mixed germanotellurite glasses would
be easily overlooked in the Raman spectra. Indeed, the signature of the Q3 germanate band at
865/850 cm-1 is not noticed for glasses 0.6≤x<1.0, i.e. for germanate contents lower than about
50% GeO2 (Figure 3).
In addition to polarizability-related effects, the Raman spectra of the Te-rich glasses show
that incorporation of GeO2 induces significant changes in the tellurite speciation for both glass
series. This is manifested by the reduction in intensity of the TeO4 band at 668/680 cm-1 relative
to the envelope at about 770 cm-1. The latter becomes progressively more symmetric with
increasing GeO2 content, and for M=Na it shifts from 777 to 767 cm-1 (Figure 3a). Of interest is
also the composition dependence of the tellurite band at 470/465 cm-1 (bending of Te–O–Te
linkages) which is observed already at x=0.2 as shoulder of the germanate band at 530/545 cm-1,
thus signaling the build-up of the tellurite sub-network.

16
Similar trends are seen in the IR spectra, where the 620/630 cm-1 TeO4 band loses intensity
and the high-frequency envelope (700-765 and 720-763 cm-1) gains relative intensity upon GeO2
addition (Figures 5a and 5b). Also, the high-frequency envelopes appear to shift to lower
frequencies by losing progressively intensity from their high-frequency side. These changes in
Raman and IR spectra point to a progressive restructuring of the tellurite sub-network upon
addition of GeO2. The combined spectroscopic results indicate the conversion of TeO4 to TeO3+1
and the parallel reduction in the population of TeO32– units in the presence of GeO2.
Focusing again on the germanate part of the network, we note for both glass-series that
even small additions of TeO2 (x=0.2) result in pronounced intensity reduction for the bands at
865/850 cm-1 (Q3) and 530/545 cm-1 (Ge−O−Ge). While this manifests the more than 10 times
higher polarizability of Te4+ over Ge4+ ions, the Raman spectra of the Na-series (Figure 3a)
demonstrate also a contrasting relative enhancement of the GeO6-related bands at ca. 325 and 605
and 650 cm-1 upon increasing TeO2 content. Remarkably, the 325 and 605 cm-1 bands are clearly
observable even at x=0.6, whereas the 650 cm-1 germanate feature merges with the remaining TeO4
intensity at about 670 cm-1. On the contrary, the 865 cm-1 (Q3) band has almost vanished at x=0.6.
These findings suggest that GeO6 octahedra are favored over Q3 tetrahedral units when TeO2 is
present in the Na-glass series.
As noted above, GeO6-related bands were not observed in the Raman spectra of the Li-
series. Instead, Li+ ions favor their isomeric Q2 tetrahedral units which give Raman scattering at
about 760 cm-1. However, the intensity development at about 760 cm-1 upon TeO2 addition (Figure
3b) cannot be attributed entirely to the creation of Q2 germanate units because tellurite species also
scatter at the same frequency range.
The IR spectra of the mixed germanotellurite glasses show mostly the expected evolution
as TeO2 replaces GeO2. In addition, we note the gradual emergence of the 497 cm-1 feature in the
Na-series which is seen at maximum mixing (x=0.5, Figure 5a). Considering that the bending
vibration of Te-O-Te bridges is active at 360 cm-1 and that for Ge-O-Ge bridges at 575 cm-1, it is
reasonable to associate the 497 cm-1 feature with the formation of mixed Ge-O-Te bridges upon
network former mixing. The situation is less clear in the Li-series because the IR spectra of the
corresponding binary glasses show much broader bands in the bridge-bending regions compared
to Na-glasses (Figure 5b). Nevertheless, the evolution of absorption at about 487 cm-1 upon mixing
is compatible with the formation of Ge-O-Te bridges in the Li-series as well.

17
In summary, the Raman and infrared spectra of the mixed alkali-germanotellurite glasses
demonstrate the development of interactions between the GeO2 and TeO2 components which lead
to structural rearrangements in the germanate and tellurite subnetworks. In addition, infrared
spectroscopy gives evidence for mixed Ge–O–Te bonding in both glass series.
3.2.4 Equimolar-mixed alkali-germanotellurite glasses
In the context of the present findings, it is clear that mixing the two network former oxides triggers
structural rearrangements within the tellurite and germanate sub-networks in both glass series. To
explore this aspect further we focus here on the glasses with equimolar mixing and compare spectra
measured on the glasses NaGT50 and LiGT50 against pellet-samples made from equimolar
amounts of the endmember glasses (x=0 and x=1). For the latter samples we prepared equimolar
mixtures of the corresponding binary glasses, i.e. (0.3Na2O-0.7TeO2)+(0.3Na2O-0.7GeO2) and
(0.3Li2O-0.7TeO2)+(0.3Li2O-0.7GeO2). For each sample, weighted equimolar amounts of the
binary glasses were ground to fine powder and mixed very thoroughly. Each mixture was then
pressed into a free-standing pellet with fairly smooth surface. Raman and IR spectra were
measured on the pellets and are compared in Figures 6 and 7 with the corresponding spectra of
glasses NaGT50 and LiGT50.
The most profound effect of network mixing on the Raman spectra is the intensity
reduction of the 667/680 cm-1 band from pellets to glasses (Figure 6), indicating an analogous
reduction in the relative population of TeO4 units. Due to polarizability differences, germanate-
relate peaks are weak in the Raman spectra of both pellets and glasses. Nevertheless, the Raman
spectrum of the NaGT50 glass in Figure 6a shows the 325 and 607 cm-1 peaks enhanced relative
to the 865 cm-1 shoulder in comparison to glass NaGT0, thus suggesting an increased population
of GeO6 octahedral units relative to Q3 tetrahedral units. A comparison shows that the TeO4 band
at 680 cm-1 for glass LiGT50 (Figure 6b) is not reduced to the same extent as for glass NaGT50.
This suggests a smaller reduction in the population of TeO4 units and/or an enhanced scattering at
about 760 cm-1 due to creation of additional Q2 germanate units in glass LiGT50.

18
Figure 6. Comparison of the Raman spectra measured on the synthesized glasses and pellets of
equimolar mixtures of the corresponding endmember glasses for NaGT50 (a), and LiGT50 (b).
The spectra were normalized to their most intense higher frequency band. For details see text.
The infrared spectra of pellet samples in Figure 7 show a band at 600/610 cm-1 which is
not observed as a distinct band in the spectra of the individual endmember glasses (x=0 and 1 in
Figure 5). This band may result from the convolution of the TeO4 band at 620/630 cm-1 and the
Ge-O-Ge band at 575/583 cm-1, and its near absence in the spectra of glasses NaGT50 and LiGT50
signals the population reduction of TeO4 units and/or Ge-O-Ge bridges upon mixing the two
network formers. The destruction of Ge-O-Ge bridges is in line with the intensity reduction at
835/875 cm-1 from pellets to glasses (Figure 7). Similar destruction of Te-O-Te bridges in glass

19
NaGT50 is suggested by the intensity reduction at 355 cm-1 (Figure 7a). On the other hand, the
spectrum of this glass shows intensity enhancement at 495 cm-1 which would be consistent with
the formation of mixed Ge-O-Te bridges upon mixing. Analogous observations cannot be made
for glass LiGT50 because of the broad nature of the 200-600 cm-1 envelope. Finally, the high-
frequency IR peak at 774/790 cm-1 for pellets shows a clear downshift to 755 cm-1 in glasses. This
shift signals the decrease in the population of different germanate structure units like Ge-O-Ge
bridges and Q3 germanate tetrahedra. It is consistent also with the destruction of TeO32- in favor
TeO3+1 units, considering that TeO3+1 units absorb at lower frequency compared to TeO32-.
Figure 7. Comparison of the IR spectra measured on glasses and pellets of equimolar mixtures of
the corresponding endmember glasses for NaGT50 (a), and LiGT50 (b). The spectra were
normalized to their most intense higher frequency band. For details see text.

20
In summary, the Raman and IR spectra of equimolar-mixed alkali-germanotellurite glasses
have shown that the structure of mixed glass networks cannot be described as weighted averages
of the structures of the binary endmember glasses.
4. Discussion
4.1 Germanate-tellurite interactions in Li(Na)-germanotellurite glasses
The recent NMR study of mixed Li(Na)-germanotellurite glasses indicated a proportional sharing
of the alkali cations between the two network former components [12]; this implies a constant
degree of modification for each network former across the ternary glass series (0<x<1). The
consideration of the Raman and infrared spectra of these glasses (Figures 3, 5) and of the
equimolar-mixed NaGT50 and LiGT50 glasses and pellets (Figures 6, 7) have demonstrated the
development of interactions between the germanate and tellurite components. As a result, the
structure of a mixed Li(Na)-germanotellurite glass cannot be described as a weighted average of
the structures of the binary endmember glasses. The interactions between the two glass
components lead to the formation of mixed Ge-O-Te linkages and the parallel destruction of homo-
atomic Ge-O-Ge and Te-O-Te bridges. This tendency promotes the formation of homogeneous
glasses upon mixing rather than segregation or phase separation phenomena, at least with length
scales detectable by Raman and IR spectroscopy.
Mixing was found to cause also redistribution in the population of germanate and tellurite
units in both glass series. Specifically, the addition of TeO2 was found to favor the transformation
of tetrahedral Q3 units to octahedral GeO6 units in mixed NaGTX glasses, and to tetrahedral Q2
units in mixed LiGTX glasses. On the other hand, addition of GeO2 leads to the conversion of
TeO4 units to TeO3+1 polyhedra and to population reduction of TeO32- units. Considering that the
stoichiometry of the TeO4 unit is TeO4/2 and TeO3+1=(TeO2.5)-, and the stoichiometry of germanate
units is (GeO2.5)- for Q3, (GeO6/2)
2- for GeO6 and (GeO2/2O2)2- for Q2, the observed structural
changes upon mixing can be expressed by the chemical equilibria:
O3/2Ge-O-GeO3/2 + O3/2Te-O-TeO3/2 ⇌ 2[O3/2Ge-O-TeO3/2] (1)
TeO4/2 + (TeO3)2-…2M+ ⇌ 2[(TeO2.5)
-…M+] (2)
(TeO3)2-…2M+ + (GeO2.5)
-…M+ ⇌ (TeO2.5)-…M+ + (GeO3)
2-…2M+ (3)

21
Equation (1) describes the formation of mixed Ge-O-Te bridges, Eq. (2) expresses the mixing-
induced rearrangement among tellurites units, and Eq. (3) manifests the change in the degree of
modification of the two components; the changes in modification expressed by Eq. (3) is in line
with the basicity difference between the two glass-forming oxides; i.e., TeO2 is considerably more
basic than GeO2. In fact, TeO2 is the most basic among the known glass-forming oxides having
Λ(TeO2)=0.99 [45], where Λ is the optical basicity. On the other hand, GeO2 is less basic and its
basicity depends on the coordination number of Ge, with Λ(GeO2)=0.61 for CN(Ge)=4 and
Λ(GeO2)=0.40 for CN(Ge)=6 [16].
The (GeO3)2- species in Eq. (3) represents the GeO6 or the Q2 unit, noting that the latter
units are chemical isomers:
(GeO6/2)2- ⇌ (GeO2/2O2)
2- (4)
The above equilibrium is shifted to the left for M=Na and to the righr for M=Li.
4.2 Structure-ionic conductivity correlation in Li(Na)-germanotellurite glasses
As noted in the introduction, the composition dependence of ionic conductivity in glasses MGTX
(M=Li, Na) shows a weak positive network former mixing (NFM) effect for M=Li and a nearly
linear variation for M=Na, i.e. absence of NFM effect, with the conductivity of NaGTX glasses
following the weighted average values of the binary endmembers [12]. The difference in the
coordination number of germanium in the isomers of Eq. (4) has a direct consequence on the
distribution of the two formal negative charges; they are delocalized on the entire octahedral
(GeO6/2)2- unit i.e. over the six germanium-oxygen bonds but are localized on the two non-bridging
oxygen atoms of the (GeO2/2O2)2- tetrahedral unit. A redistribution of the negative charge over
larger network segments will reduce the Coulomb forces between M+ ions and their anionic sites
and, thus, this will facilitate ion transport in mixed M-germanotellurite glasses. An analogous
mechanism was discussed for Na- and Li-borophosphate glasses, where replacement of non-
bridging P–O- bonds by the tetrahedral (BO4)- groups was found to favor Na/Li ion conduction [2,
3]. On these grounds, the presence of (GeO6/2)2- species for M=Na is suggested to be beneficial for
ionic conduction in contrast to (GeO2/2O2)2- species for M=Li. For the same reasoning, and given
22
Eqs. (2) and (3), the transformation of the doubly charged (TeO3)2- tellurite species to singly
charged (TeO2.5)- species is expected to have a positive effect on ionic conduction in both glass
series.
According to the Anderson and Stuart model for ion conduction in glasses [46], there are
two main contributions to the activation energy for conductivity, Eσ; the Coulomb binding energy
of the ion in its site, EB, and the elastic strain energy, ES, associated with the distortion of the glass
network as the ion jumps from one equilibrium site to the next one. Based on the previous
discussion, the structural changes induced by mixing of GeO2 with TeO2 are expected to reduce EB
for the tellurite part in both glass systems and the germanate part of the Na-containing glasses, but
to increase EB for the germanate part of the Li-containing glasses. The network strain energy, ES,
is given from the expression:
ES = 4πGrD(r-rD)2 (5)
where G is the shear modulus of the glass and rD is a doorway radius that needs to be enlarged to
accommodate an ion of radius r. In the absence of measured values of the shear modulus that would
allow the calculation of ES, we discuss here changes in the network strain energy in terms of
changes in the cross-linking density of the glass network by comparing the structural units found
in the two glasses series and their efficiency in cross-linking the network. This is because the shear
modulus G increases with increasing cross-linking density of the glass network [47, 48].
The structural changes involved in Eq. (1) show no variation in network cross-linking upon
mixing. Considering that the number of bridging Te-O bonds (Te-Ob) in units TeO4/2,
TeO3+1=(TeO2.5)- and (TeO3)
2- is four, three, and zero respectively, the combination of Eqs. (2) and
(3) indicates that the number of Te-Ob bonds increases from 4(Te-Ob)/3Te to 9(Te-Ob)/3Te, thus
predicting an increased tellurite cross-linking upon mixing for both glass series. In Eq. (3) the
germanate speciation changes from to (GeO2.5)- to (GeO3)
2-, and thus the change in germanate
connectivity will be eventually dictated by Eq. (4). For M=Na, the change from (GeO2.5)- to
(GeO6/2)2- will increase the number of bridging Ge-Ob bonds by 3(Ge-Ob)/Ge. The opposite effect
is foreseen for M=Li, i.e., a decrease by one (Ge-Ob) per Ge. Taken together the changes in the
tellurite and germanate connectivity, mixing the two glass former-oxides will leave the network
cross-linking density practically unaffected for M=Li but clearly increased for M=Na. Variations

23
in network cross-linking density are usually reflected in the composition dependence of molar
volume, Vmol. It was found that Vmol varies linearly with composition for M=Li and shows negative
deviation from additivity for M=Na (Figures 2e and 2f); this provides support for the predicted
change in the network cross-linking density of the two glass series.
A study of ionic conductivity in alkali-germanate glasses has shown that the strain energy
component of Eσ is relatively more important for germanate glasses than for the analogous silicates
[49, 50]. It was also discussed that the conversion of GeO4 to GeO6 units, and the subsequent
changes in the medium-range structure, correlate with the increased strain of the network and the
reduction in the volume available for the diffusion of the alkali ions; these factors contribute to the
increase in Eσ. The importance of the strain energy was also discussed for sodium tellurite glasses,
and its contribution to the activation energy for ion conduction was found considerably larger than
that of the binding energy [44]. Similarly, the decrease in Ca ion diffusivity with increasing Na
content in Na2O-CaO-B2O3 glasses was correlated with the increase in the atomic packing density
as BO3 units are converted into BO4 units; this leads to the increase in the mechanical strain of the
network and affects the ionic transport [51]. In line with this is also the composition dependence
of the glass hardness, which was found to follow closely the formation of BO4 units in the same
glass system [51]. Finally, a thorough investigation of sodium-borosilicate and sodium-
borogermanate mixed glass systems showed that ionic conductivity and bulk modulus exhibit
opposite trends in terms of slopes and extrema in their composition dependence [6], and
highlighted the fact that high network cross-linking density and mechanical stiffness is likely
related to low ion mobility.
Based on the previous discussion and related literature reports, we summarize for
convenience in Table 2 our predictions for the effect of mixing on the electrostatic part, EB, and
the network-strain part, ES, of the activation energy for ion conduction, Eσ=EB+ES, with reference
to both the tellurite and germanate parts in glasses MGTX (M=Li, Na). Taking as an example the
Na-containing glasses, Table 2 shows that glass-former mixing will decrease EB for the tellurite
part and increase ES, thus leaving Eσ (i.e. EB+ES) practically unchanged for tellurite species.
Similarly, the effect of mixing on the germanate part for M=Na will be the decrease in EB and the
increase in ES and thus Eσ will be practically unchanged for germanate species. While the actual
magnitudes of the energy changes are not known in these glasses and the presented description is
purely qualitative, the predicted changes in EB and ES appear to cancel out for both glass series,

24
although for different structural reasons. This prediction is in accordance with the experimental
finding for the absence of a strong network former mixing effect in both glass systems; the effect
is absent in glasses NaGTX and very weak in glasses LiGTX [12].
Table 2. Qualitative description of the mixing-induced changes in the electrostatic, EB, and
network-strain, ES, part of the activation energy for ion conduction, Eσ, for glasses 0.3M2O-0.7[(1-
x)GeO2-xTeO2] (M=Li, Na). The predicted energy changes refer to the tellurite and germanate
parts of glass and are designated by arrows to indicate the increase (↑) and decrease (↓) in energy.
For details, please refer to the text.
Glass Component ΔEB ΔES ΔEσ
M=Li tellurite
germanate
↓
↑
↑
↓ ≈ 0
M=Na tellurite
germanate
↓
↓
↑
↑ ≈ 0
5. Conclusions
Lithium and sodium germanotellurite glasses with composition 0.3M2O-0.7[(1-x)GeO2-xTeO2],
where M=Li, Na, and 0≤x≤1, were investigated by density and glass transition temperature
measurements and by Raman and IR spectroscopy to probe the structure of the germanate and
tellurite units, and their (inter)connectivity in building up the mixed glass network. The aim of this
work was to search for the underlying origins of the alkali ion-dependent network former mixing
(NFM) effect in ionic conductivity of the investigated glasses.
The results of the complementary Raman and IR spectroscopic techniques show mixing-
induced interactions between the GeO2 and TeO2 oxides, which lead to formation of mixed Ge-O-
Te linkages and changes in the degree of modification of both network-forming oxides.
Specifically, it was found that structural rearrangements in the tellurite part are related to the
destruction of TeO4/2 trigonal bipyramids and (TeO3)2- trigonal pyramids in favor of TeO3+1
polyhedra. The corresponding changes in the germanate part involve the transformation of
tetrahedral Q3 units to octahedral GeO6 units for M=Na and to tetrahedral Q2 units for M=Li. These
structural changes were expressed in terms of chemical equilibria which demonstrate the decrease
25
of modification in the tellurite part and its increase in the germanate part, in line with the basicity
difference between the two glass-forming oxides.
The knowledge developed for the structures of the germanate and tellurite units in the
studied binary and ternary germanotellurite glasses was employed to predict changes in the
network cross-linking density upon mixing. It was found that the crosslinking density remains
practically the same for M=Li and increases for M=Na. Such variations in network cross-linking
were correlated with the composition dependence of the glass molar volume, which changes
linearly for M=Li and shows a negative deviation from additivity for M=Na.
In addition, consideration of changes in the negative charge distribution and the network
cross-linking density among the germanate and tellurite units allowed predictions, albeit of
qualitative nature, for changes in the electrostatic, EB, and the network-strain, ES, parts of the
activation energy for ion conduction. It was found that, for different structural reasons, the
predicted changes in EB and ES appear to cancel out for both glass series. This is in line with the
absence of a pronounced NFM effect in ionic conductivity in the studied glasses; the M=Li series
shows a weak positive NFM effect whereas the M=Na series shows practically no NFM effect.
CRediT author contribution statement
N.S. Tagiara: Investigation, Writing - review & editing. K.I. Chatzipanagis: Investigation,
Writing - review & editing. H. Bradtmüller: Investigation, Writing - review & editing. A.C.M.
Rodrigues: Conceptualization, Investigation, Writing - review & editing, Funding acquisition.
Doris Möncke: Conceptualization, Investigation, Writing - review & editing. Efstratios I.
Kamitsos: Conceptualization, Supervision, Funding acquisition, Formal analysis, Writing -
review & editing, Project administration.
Declaration of competing interest
The authors declare that they have no known competing financial interests or personal
relationships that could have appeared to influence the work reported in this paper.
Acknowledgements

26
This work was supported by the project “National Infrastructure in Nanotechnology, Advanced
Materials and Micro-/Nanoelectronics” (MIS 5002772), which is funded by the Operational
Program “Competitiveness, Entrepreneurship and Innovation” (NSRF 2014-2020) and co-
financed by Greece and the EU (European Regional Development Fund). We also acknowledge
the financial support of FAPESP grant (São Paulo Research Foundation, number 2017/02953-6
and 2013/07793, CeRTEV-CEPID program. HB is grateful for support from the São Paulo
Research Foundation (FAPESP) (grant number 2019/26399-3), as well as the Deutsche
Forschungsgemeinschaft (DFG).
References
[1] M. Schuch, C.R. Müler, P. Maass, and S.W. Martin, Mixed barrier model for the mixed
glass former effect in ion conducting glasses, Phys. Rev. Lett. 102 (2008) 145902/1-4.
[2] D. Zielniok, H. Eckert, and C. Cramer, Direct correlation between nonrandom ion hopping
and network structure in ion-conducting borophosphate glasses, Phys. Rev. Lett. 100 (2008)
35901/1-4.
[3] L.M. Funke, H. Bradtmüller, and H. Eckert, Recoupling dipolar interactions with multiple
I=1 quadrupolar nuclei: A 11B{6Li} and 31P{6Li} rotational echo double resonance study
of lithium borophosphate glasses, Solid State Nucl. Magn. Reson. 84 (2017) 143–150
[4] J.C. Mauro, Statistics of modifier distributions in mixed network glasses, J. Chem. Phys.
138 (2013) 12A522/1-8.
[5] C. Hermansen, X. Guo, R.E. Youngman, J.C. Mauro, M.M. Smedskjaer, and Y. Yue,
Structure-topology-property correlations of sodium phosphosilicate glasses, J. Chem.
Phys. 143 (2015) 064510/1-10.
[6] W. Wang, R. Christensen, B. Curtis, S.W. Martin, and J. Kieffer, A new model linking
elastic properties and ionic conductivity of mixed network former glasses, Phys. Chem.
Chem. Phys. 20 (2018) 1629-1641.
[7] P. Liu, K. Januchta, L.R. Jensen, M. Bauchy, and M.M Smedskjaer, Competitive effects
of free volume, rigidity, and self‐adaptivity on indentation response of silicoaluminoborate
glasses. J. Am. Ceram. Soc. 103 (2020) 944–954.
[8] B. Raguenet, G. Tricot, G. Silly, M. Ribes, A. Pradel, The mixed glass former effect in
twin-roller quenched lithium borophosphate glasses, Solid State Ionics 208 (2012) 25–30.

27
[9] D. Larink, H. Eckert, M. Reichert, S.W. Martin, Mixed network former effect in ion-
conducting alkali borophosphate glasses: Structure/property correlations in the system
[M2O]1/3[(B2O3)x(P2O5)1-x]2/3 (M=Li, K, Cs), J. Phys. Chem. C. 116 (2012) 26162–26176.
[10] Q.J. Zheng, R.E. Youngman, C.L. Hogue, J.C. Mauro, M. Potuzak, M.M. Smedskjaer, and
Y.Z. Yue, Structure of boroaluminosilicate glasses: Impact of [Al2O3]/[SiO2] ratio on the
structural role of sodium, Phys. Rev. B 86 (2012) 054203/1-12.
[11] H. Eckert, Network former mixing (NFM) effects in ion-conducting glasses.
Structure/property correlations studied by modern solid-State NMR techniques, Diffusion
Foundations 6 (2015) 144-193.
[12] H. Bradtmüller, A.C.M Rodrigues, H. Eckert, Network former mixing (NFM) effects in
alkali germanotellurite glasses, J. Alloys Compd. 873 (2021) 159835.
[13] E.I. Kamitsos, A.P. Patsis, and G.D. Chryssikos, Infrared reflectance investigation of alkali
diborate glasses, J. Non-Cryst. Solids 152 (1993) 246-257.
[14] A. Winterstein-Beckmann, D. Möncke, D. Palles, E.I. Kamitsos, and L. Wondraczek,
Structure-property correlations in highly modified Sr, Mn-borate glasses, J. Non-Cryst.
Solids 376 (2013)165-174.
[15] E.I. Kamitsos, G.D. Chryssikos, A.P. Patsis, J.A. Duffy, Metal ion sites in oxide glasses.
Relation to glass basicity and ion transport, J. Non-Cryst. Solids 196 (1996) 249-254.
[16] E.I. Kamitsos, Y.D. Yiannopoulos, and J.A. Duffy, Optical basicity and refractivity of
germanate glasses, J. Phys. Chem. B 106 (2002) 8988-8993.
[17] N.S. Tagiara, E. Moayedi, A. Kyritsis, L. Wondraczek, and E.I. Kamitsos, Short-range
structure, thermal and elastic properties of binary and ternary tellurite glasses, J. Phys.
Chem. B 123 (2019) 7905-7918.
[18] K.I. Chatzipanagis, N.S. Tagiara, D. Möncke, S. Kundu, A.C.M. Rodrigues, E.I. Kamitsos,
Vibrational study of lithium borotellurite glasses, J. Non-Cryst. Solids 540 (2020) 120011.
[19] N.S. Tagiara, D. Palles, E.D. Simandiras, V. Psycharis, A. Kyritsis, E.I. Kamitsos,
Synthesis, thermal and structural properties of pure TeO2 glass and zinc-tellurite glasses,
J. Non-Cryst. Solids 457 (2017) 116–125.
[20] E.I. Kamitsos, Infrared spectroscopy of glasses, in: M. Affatigato (Ed.), Modern Glass
Characterization, John Wiley & Sons, New York, 2015, pp. 32-73 (Chapter 2).
[21] N. Mochida, K. Takahashi, K. Nakata, S. Shibusawa, Properties and structure of binary
tellurite glasses containing mono- and di-valent cations, J. Ceram. Soc. Jpn. 86 (1978) 316-
326.

28
[22] M.K. Murthy and J. Ip, Some physical properties of alkali germanate glasses, Nature 201
(1964) 285-286.
[23] G.S. Henderson and H.M. Wang, Germanium coordination and the germanate anomaly,
Eur. J. Mineral. 14 (2002) 733-744.
[24] O.V. Mazurin, M.V. Streltsina, T.P. Shvaiko-Shvaikovskaya, Handbook of glass data. Part
B, Single-component and binary non-silicate glasses, Elsevier, Amsterdam 1985.
[25] M. de Oliveira, J.S. Oliveira, S. Kundu, N.M.P. Machado, A.C.M. Rodrigues, H. Eckert,
Network former mixing effects in ion-conducting lithium borotellurite glasses:
Structure/property correlations in the system (Li2O)y[2(TeO2)x(B2O3)1-x]1-y, J. Non-Cryst.
Solids 482 (2018) 14–22.
[26] E.I. Kamitsos, Y.D. Yiannopoulos, M.A. Karakassides, G.D. Chryssikos, and H. Jain,
Raman and infrared structural investigation of xRb2O-(1−x)GeO2 glasses, J. Phys. Chem.
100 (1996) 11755-11765.
[27] Y.D. Yiannopoulos, E.I. Kamitsos, and H. Jain, Structure of potassium germanate glasses
by vibrational spectroscopy, in Physics and Applications of Non-Crystalline
Semiconductors in Optoelectronics, A. Andriesh and M. Bertolotti (Eds.), NATO ASI
Series/High Technology, Kluwer Academic Publ., Dordrecht, 1997, vol. 36, pp. 317-325.
[28] T.N. Ivanova and V.N. Bykov, Raman spectroscopy of glasses and melts of the Na2O-
GeO2 system, Russian Metallurgy (Metally) 2010 (2010) 678-680.
[29] T. Furukawa, and W.B. White, Raman spectroscopic investigation of the structure and
crystallization of binary alkali germanate glasses, J. Mater. Sci. 15 (1980) 1648-1662.
[30] G.S. Henderson and M.E. Fleet, The structure of glasses along the Na2O-GeO2 join, J.
Non-Cryst. Solids 134 (1991) 259-269.
[31] G.S. Henderson, L.G. Soltay, and H.M. Wang, Q speciation in alkali germanate glasses, J.
Non-Cryst. Solids 356 (2010) 2480-2485.
[32] K. Nakamoto, Infrared and Raman Spectra of Inorganic and Coordination Compounds,
Wiley, New York, 1978, p. 142.
[33] E.I. Kamitsos, Y.D. Yiannopoulos, C.P. Varsamis and H. Jain, Structure-property
correlations in glasses by infrared reflectance spectroscopy, J. Non-Cryst. Solids 222
(1997) 59-68.

29
[34] E.I. Kamitsos, Y.D. Yiannopoulos, H. Jain and W.C. Huang, Far-infrared spectra of alkali
germanate glasses and correlation with electrical conductivity, Phys. Rev. B 54 (1996)
9775-9783.
[35] L.L. Velli, C.P. Varsamis, E.I. Kamitsos, D. Möncke and D. Ehrt, Structural investigation
of metaphosphate glasses, Phys. Chem. Glasses 46 (2005) 178-181.
[36] F. Dachille and R. Roy, The use of infra-red absorption and molar refractivities to check
coordination, Z. Kristallogr. 111 (1959) 462-470.
[37] P. Tarte, Infra-red spectrum and tetrahedral coordination of lithium in the spinel LiCrGeO4,
Acta Crystallogr. 16 (1963) 228-228.
[38] P. Tarte and A.E. Ringwood, Infra-red spectrum and germanium co-ordination in some
high-pressure meta-germanates, Nature 201 (1964) 819-819.
[39] T. Sekiya, N. Mochida, A. Ohtsuka, and M. Tonokawa, Raman spectra of MO1/2-TeO2
(M=Li, Na, K, Rb, Cs and Tl) glasses, J. Non-Cryst. Solids 144 (1992) 128-144.
[40] N. Ghribi, M. Dutreihl-Colas, J.-R. Duclére, T. Hayakawa, J. Carreaud, R. Karray, A.
Kabadou, and P. Thomas, Thermal, optical and structural properties of glasses within the
TeO2-TiO2-ZnO system, J. Alloys Comp. 622 (2015) 333-340.
[41] A. Kaur, A. Khanna, M. González-Berriuso, F. González, and B. Chen, Short-range
structure and thermal properties of alumino-tellurite glasses, J. Non-Cryst. Solids 470
(2017) 14-18.
[42] P. Mosner, O. Kupetska, L. Koudelka, and P. Kalenda, Physical properties and structural
studies of lithium borophosphate glasses containing TeO2, J. Solid State Chem. 270 (2019)
547-552.
[43] A.G. Papadopoulos, N.S. Tagiara, E.D. Simandiras, E.I. Kamitsos, On the absence of
doubly bonded Te═O groups in TeO2 glass, J. Phys. Chem. B 124 (2020) 5746-5753.
[44] A. Pan and A. Ghosh, Activation energy and conductivity relaxation of sodium tellurite
glasses, Phys. Rev. B 59 (1999) 899- 904.
[45] V. Dimitrov, S. Sakka, Electronic oxide polarizability and optical basicity of simple oxides,
J. Appl. Phys. 79 (1996) 1736-1740.
[46] O.L. Anderson, D.A. Stuart, Calculation of activation energy of ionic conductivity in silica
glasses by classical methods, J. Am. Ceram. Soc. 37 (1954) 573-580.
[47] H. Unuma, S. Sakka, Electrical conductivity in Na-Si-O-N oxynitride glasses, J. Mater. Sci.
Lett. 6 (1987) 996-998.

30
[48] M. Dussauze, E.I. Kamitsos, P. Johansson, A. Matic, C.P. Varsamis, D. Cavagnat, P.
Vinatier, and Y. Hamon, Lithium ion conducting boron-oxynitride amorphous thin films:
Synthesis and molecular structure by infrared spectroscopy and density functional theory
modelling, J. Phys. Chem. C 117 (2013) 7202-7213.
[49] W.C. Huang, H. Jain, Correlation between local structure and electrical response of Rb and
(Rb,Ag) germanate glasses: dc conductivity, J. Non-Cryst. Solids 188 (1995) 254-265.
[50] H. Jain, W.C. Huang, E.I. Kamitsos, and Y.D. Yiannopoulos, Significance of intermediate
range structure for electrical conduction in alkali germanate glasses, J. Non-Cryst. Solids
222 (1997) 361-368.
[51] M.M. Smedskajaer, J.C. Mauro, S. Se, J. Deubener, and Y. Yue, Impact of network
topology on cationic diffusion and hardness of borate glass surfaces, J. Chem. Phys. 133
(2010) 154509/1-6.
![Four-wave mixing in potassium vapor with off- resonant ... · Studying four-wave mixing (FWM) in alkali vapor is of the essential value for generating new states of light [1], important](https://img.dokumen.tips/doc/110x75/5be30e3009d3f284098c92e2/four-wave-mixing-in-potassium-vapor-with-off-resonant-studying-four-wave.jpg)


![Alkali & alkali tanah [yunusthariqrizky]](https://img.dokumen.tips/doc/110x75/555d0f95d8b42ac4258b46d7/alkali-alkali-tanah-yunusthariqrizky.jpg)