Embed Size (px)
Citation preview

NeuroImage: Clinical 10 (2016) 96–106
Contents lists available at ScienceDirect
NeuroImage: Clinical
j ourna l homepage: www.e lsev ie r .com/ locate /yn ic l
Network community structure alterations in adult schizophrenia:identification and localization of alterations
Dov B. Lerman-Sinkoff a,e,⁎, Deanna M. Barch b,c,d
aDepartment of Biomedical Engineering, Washington University in St. Louis, 1 Brookings Dr., Saint Louis, MO 63130, United StatesbNeuroscience Program, Washington University in St. Louis, 660 S. Euclid Ave., Saint Louis, MO 63110, United StatescDepartment of Psychological & Brain Sciences, Washington University in St. Louis, 1 Brookings Dr., Saint Louis, MO 63130, United StatesdDepartment of Psychiatry & Radiology, Washington University in St. Louis, 660 S. Euclid Ave., Saint Louis, MO 63110, United StateseMedical Scientist Training Program, Washington University in St. Louis, 660 S. Euclid Ave., Saint Louis, MO 63110, United States
⁎ Corresponding author at: Campus Box 1125, 1 BrookUnited States.
E-mail address: [email protected] (D.B. Lerman-Sin
http://dx.doi.org/10.1016/j.nicl.2015.11.0112213-1582/© 2015 The Authors. Published by Elsevier Inc
a b s t r a c t
a r t i c l e i n f oArticle history:Received 20 August 2015Received in revised form 30 October 2015Accepted 15 November 2015Available online 18 November 2015
Keywords:Community structureSchizophreniaResting state functional connectivityNormalized mutual informationScrubbing
A growing body of literature suggests functional connectivity alterations in schizophrenia. While findings havebeen mixed, evidence points towards a complex pattern of hyper-connectivity and hypo-connectivity. This al-tered connectivity can be represented and analyzed using the mathematical frameworks provided by graphand information theory to represent functional connectivity data as graphs comprised of nodes and edges linkingthe nodes. One analytic technique in this framework is the determination and analysis of network communitystructure, which is the grouping of nodes into linked communities or modules. This data-driven techniquefinds a best-fit structure such that nodes in a given community have greater connectivity with nodes in theircommunity than with nodes in other communities. These community structure representations have beenfound to recapitulate known neural-systems in healthy individuals, have been used to identify novel functionalsystems, and have identified and localized community structure alterations in a childhood onset schizophreniacohort. In the present study, we sought to determine whether community structure alterations were presentin an adult onset schizophrenia cohort while stringently controlling for sources of imaging artifacts. Grouplevel average graphs in healthy controls and individuals with schizophrenia exhibited visually similar networkcommunity structures and high amounts of normalized mutual information (NMI). However, testing of individ-ual subject community structures identified small but significant alterations in community structure with alter-ations being driven by changes in node community membership in the somatosensory, auditory, default mode,salience, and subcortical networks.
© 2015 The Authors. Published by Elsevier Inc. This is an open access article under the CC BY-NC-ND license(http://creativecommons.org/licenses/by-nc-nd/4.0/).
1. Introduction
A growing body of literature suggests that persons with schizo-phrenia exhibit altered functional brain connectivity (Fornito et al.,2012; Pettersson-Yeo et al., 2011; van den Heuvel and Fornito,2014), as well as altered anatomical connectivity (Ellison-Wrightand Bullmore, 2009; Patel et al., 2011). These findings lend furthercredence to the “dysconnectivity” theory of this disease (Friston,1998; Stephan et al., 2006). As such, a better understanding of thepatterns of dysconnectivity may yield clinically relevant diagnosticpredictors (Sheffield et al., 2015) or improve models of psychosisthrough explication of subtypes or dimensional models of the dis-ease (Cuthbert and Kozak, 2013) leading to new or improved treat-ment approaches.
ings Dr., Saint Louis, MO 63130,
koff).
. This is an open access article under
One promising approach to link functional brain connectivity withpathophysiology and etiology is through the use of graph theory andcomplex network analysis. In these analyses, the data are transformedinto a graph by representing locations in the brain as nodes and usingmeasures of connectivity (such as Pearson's correlation) as the connec-tions (also known as ties or edges) between those regions (Bullmoreand Sporns, 2009). The graph can then be studied by computing andcomparing measures of properties of the graph (see (Rubinov andSporns, 2010) for an excellent treatment). These approaches havebeen used to examine brain organization in schizophrenia at the levelof the whole brain and within and/or between specific networks andregions. As will be described below, many of these studies point to thesuggestion that the organization of brain networks may be altered inschizophrenia. However, few studies have directly tested this hypothe-sis, which is the goal of the current study.
Several studies of schizophrenia at the whole brain level havesuggested that resting state networks in schizophrenia exhibit overallreductions in functional connectivity as compared to healthy controls(Pettersson-Yeo et al., 2011; van den Heuvel and Fornito, 2014).
the CC BY-NC-ND license (http://creativecommons.org/licenses/by-nc-nd/4.0/).

97D.B. Lerman-Sinkoff, D.M. Barch / NeuroImage: Clinical 10 (2016) 96–106
Graph theoretic analyses at thewhole brain level have found significantdifferences in graph properties between persons with schizophreniaand healthy controls (Fornito et al., 2012; Jiang et al., 2013). For exam-ple, multiple studies have found decreased overall local efficiency(Alexander-Bloch et al., 2010; Liu et al., 2008), and decreased clusteringand small-worldness in schizophrenia (Alexander-Bloch et al., 2010;Bassett et al., 2012; Liu et al., 2008; Lynall et al., 2010; Ma et al., 2012).While informative, these analyses aggregate across different networksin the brain that themselves may show varying levels of alteration,and thus may mask important psychosis-related differences betweennetworks.
To avoid this issue, a number of studies have examined the proper-ties of specific networks in schizophrenia. Generally, these studies relyon network definitions generated through study of healthy brains(Dosenbach et al., 2007; Fox et al., 2005).While results across such stud-ies are somewhat mixed, a number of studies have found reduced con-nectivity among regions in the dorsal frontal–parietal network (Coleet al., 2011;Woodward et al., 2011; Zhou et al., 2007) or between dorsalfrontal regions and other networks (Cole et al., 2011; Repovs et al.,2011; Zhou et al., 2007). In addition, a number of studies have examinedconnectivity within the default mode network. While results are againvariable, some work suggests increased connectivity within the defaultmode network (Jafri et al., 2008; Öngür et al., 2010; Whitfield-Gabrieliet al., 2009), as compared to thedecreased connectivity found for frontalnetworks.
Alternatively, rather than studying specific networks, some studieshave examined specific types of connections, such as connections with“hub” regions that are thought to be critical for integrating between di-verse brain systems (Rubinov and Bullmore, 2013). Two studies(Bassett et al., 2012; Lynall et al., 2010) found evidence for overall de-creased probability of hubs or strength of hubs in schizophrenia(Bassett et al., 2012) and localized decreases to temporal associationand limbic areas (Rubinov and Bullmore, 2013). Alexander-Bloch andcolleagues found that individuals with childhood onset schizophrenia(COS) had similar spatial patterns of hub locations, but that there wassignificantly increased hub strength in the bilateral dorsolateral pre-frontal cortex, right anterior medial cortex, and right inferior parietallobule (Alexander-Bloch et al., 2012). Thus, a growing body of evidencesuggests that there are differential patterns of dysconnectivity acrossdifferent brain networks in schizophrenia.
Taken together, the results from the whole brain, specific network,and specific connections studies suggest that the underlying communi-ty structure (how nodes organize into tightly connected modules orcommunities) of brain networks in schizophrenia might be fundamen-tally altered. However, few studies have directly examined communitystructure alterations. In a series of two studies, Alexander-Blochand colleagues found evidence in COS demonstrating significantdecreases in network modularity (Alexander-Bloch et al., 2010)as well as fundamental differences in community structure(Alexander-Bloch et al., 2012). Their work was the first to demon-strate alterations in community structure of brain functional net-works, but used an atypical (COS) population of individuals withschizophrenia. Thus, the present study assesses whether alter-ations in community structure are unique to COS or are present ina more typical schizophrenia population.
It is important to consider subject head motion when applying net-work analyses to resting state fMRI data. Recent discoveries by severalindependent groups have revealed that head motion induces a non-linear and distance-dependent artifact into resting state data (Poweret al., 2012; Satterthwaite et al., 2012; Van Dijk et al., 2012). Increasedsubject head motion causes an artifactual increase in the measures ofcorrelation between areas that are spatially close and an artifactual de-crease in the measures of correlation between areas that are spatiallydistant (Power et al., 2012). These findings are especially worrisome,as persons with schizophrenia tend to exhibit greater amounts of headmotion during scans than controls. Thus, the present study employed
a “scrubbing” strategy (Power et al., 2014) in order to reduce the effectsof motion upon measures of network community structure.
Here, we present the results of our study of the alterations in brainnetwork organization in adults with stable schizophrenia while strin-gently controlling for sources of imaging artifacts. We combined twosimilar but separately collected resting state fMRI datasets in order tomaximize our ability to examine community structure alterations inschizophrenia compared to demographically matched healthy controls.Resting state data were pre-processed using “scrubbing” methods tostringently control for sources of imaging artifacts and other artifacts(Power et al., 2014). The resultant correlation matrices were analyzedusing graph theory and information theory analyses similar to those inAlexander-Bloch et al. (2012). We examined the question of whetherthe community structure of resting state brain networks in schizophre-nia is altered compared to healthy, demographically matched controls.
2. Materials and methods
2.1. Participants
There were two groups of participants: individuals with schizophre-nia (SCZ) and demographically similar healthy controls (CON). The par-ticipants were drawn from two separately collected resting statefunctional magnetic resonance imaging (rs-fMRI) data sets. One dataset was reported on in 2011 (Repovs et al., 2011). The other was notpreviously published. The study inclusion and exclusion criteria weresimilar across the two data sets: SCZ participants all met DSM-IV diag-nostic criteria for schizophrenia, were in outpatient treatment, andwere on a stablemedication regimen for at least twoweeks. CON partic-ipants had no lifetime or history of Axis I psychotic or mood disordersand no first-degree family members with psychotic mood disorders.CON and SCZ participants were excluded if they: 1) met DSM-IV diag-nostic criteria for substance dependence or severe/moderate abuse dur-ing the prior threemonths; 2)metDSM-IV diagnostic criteria formentalretardation; 3) had a clinically unstable or severe medical disorder; or4) had current or past head trauma with documented neurologicalsequelae or loss of consciousness. This resulted in a combined initial83 SCZ participants and 91 CON participants. Participants were furtherexcluded for several reasons, including: a) 30 CON and 37 SCZ excludeddue to motion scrubbing (see below); b) 12 CON and 1 SCZ excludeddue to age; c) 7 CON for within-group relatedness (see below); and,d) 1 CONand 1 SCZdue to irrecoverable data corruption during process-ing. This yielded a final count of n = 41 CON and n = 44 SCZ. Table 1presents the demographic and clinical characteristics of the retainedparticipants. Participants excluded due to motion were significantlyolder than the participants that were retained post-scrubbing(Table S1), but did not differ on gender or parental years of education.
In one of the studies described above (Repovs et al., 2011), we re-cruited healthy controls and their first degree siblings. Prior researchhas shown that some aspects of functional connectivity are heritable(Glahn et al., 2010). Thus, because only one group contained related in-dividuals, potentially biasing results, only one sibling from a pair of sib-lings was included in the control group. The sibling with the greatestamount of data remaining after motion scrubbing (described below)was included and data from the second sibling excluded. This resultedin the exclusion of an additional 7 CON participants that had data thatwould otherwise meet all other inclusion requirements.
2.2. fMRI pre-processing
Both studies were acquired on the same Siemens 3T Tim Trio(Siemens, Erlangen, Germany) scanner at the Washington Universityin St. Louis Neuroimaging Laboratory facility. Resting state functionalmagnetic imaging (rs-fMRI) images using blood oxygenation level-dependent (BOLD) contrast were acquired using an asymmetricalspin-echo, echo-planar T2* sequence with (TR = 2200 ms or 2000 ms

Table 1Demographics, clinical assessments, and motion parameters from participants.
Group CON (N = 41) SCZ (N = 44) Stats
Mean SD Mean SD
Age (years) 28.10 8.08 31.59 9.34 F(1,83) = 0.993, p = 0.322Gender (% male) 54% 75% Fishers exact Χ2 test p = .045Highest parental years of education 14.54 1.60 13.61 3.59 F(1,83) = 2.319, p = 0.132Subject years of education 14.07 1.72 13.11 2.10 F(1,83) = 5.245, p = 0.025IQ — WAIS scaled score 10.51 3.10 8.95 3.65 F(1,83) = 4.470, p = 0.037SAPS positive symptoms 0.049 0.22 3.43 2.82 F(1,83) = 58.49, p b 0.000SAPS disorganized symptoms 1.37 1.34 3.11 2.62 F(1,83) = 14.705, p b 0.000SANS negative symptoms 1.07 1.77 8.34 3.28 F(1,83) = 158.06, p b 0.000Olanzapine equivalents – – 19.86 18.82Mean frames lost in subjects retained after scrubbing 93.63 66.62 105.66 105.66 F(1,83) = 0.993, p = 0.322Mean frames remaining after scrubbing 254.9 62.5 244.2 53.6 F(1,83) = 0.723, p = 0.397Mean pre-scrubbing FD (framewise displacement) in mm 0.16 0.13 0.16 0.10 F(1,83) = 0.161, p = 0.689
98 D.B. Lerman-Sinkoff, D.M. Barch / NeuroImage: Clinical 10 (2016) 96–106
depending on study, TE = 27 ms, FoV = 256 mm, 90° flip angle,4 × 4 × 4 mm3 voxels). Participants were presented with a fixationcrosshair and data were collected in two eyes-open runs of 164 or 180frames each, depending on study. Each resting-state scan was pre-processed by correcting slice-timing, realigning to compensate forrigid body movement, normalizing to a whole-brain mode intensity of1000, linearly transforming to Talairach atlas space, and resampling to333 space. Pre-processing was completed using a set of in-house toolswritten by Avi Snyder in the Washington University in St. Louis Neuro-imaging Labs.
Anatomical T1 images were collected using a magnetizationprepared rapid gradient echo (MPRAGE) sequence with either1.2 × 1 × 1 mm or 1 × 1 × 1 mm voxels, depending on study.These images were segmented using Freesurfer-5.3 on theWashington University Center for High Performance Computingsupercomputer. These segmentations were then resampled to 333space and used to generate subject-specific nuisance regressorseed masks for white matter, ventricular, and global signals.
Participants' rs-fMRI scan runs were then pre-processed accordingto the methodology presented in Power et al. (2014) using a suite ofMATLAB (The Mathworks, Natick, MA) tools developed by JonathanPower in the Petersen and Schlaggar labs at Washington University inSt. Louis. The first five frames of each scanning run were removed toallow BOLD signal dynamics to reach steady state. Each run was then:(1) demeaned and detrended to compensate for scanner offset anddrift; (2) nuisance signals were regressed out using the Freesurfer gen-erated seed masks and rigid-body motion estimates generated by a 24parameter Volterra expansion (Friston et al., 1996; (3) frequency fil-tered using a zero phase, second order Butterworth filter with pass-band 0.009 Hz b f b 0.08; and (4) spatially blurred using a 6 mmFWHM Gaussian filter.
Motion-derived artifact was “scrubbed” by generating temporalmasks censoring frames exceeding a framewise displacement (FD) ofgreater than 0.2 mm. Frames were additionally censored if there werenot 5 contiguous frames. That is, if scrubbing censored frames resultedin a set of 1–4 non-censored frames that were discontinuous fromother frames, then those 1–4 frames were additionally censored. Entireruns were censored if there were not at least 50 frames per run, and aparticipant had to have at least 100 usable frames to be included inthe analyses. The entire dataset was then reprocessed using the stepsdescribed above excluding the censored frames and interpolating be-tween epochs of low (uncensored) motion and high (censored)motionin order to prevent spread of motion-related artifact into adjacent non-censored frames. This resulted in the exclusion of 30 CON and 37 SCZparticipants leaving a final N = 41 CON and N = 44 SCZ participantswith analyzable data. Two less stringent FD criteria (0.5 mm and1.0mm)were also examined and assessed for effects upon downstreamanalyses of community structure (described below) (Figs. S4, S5 andTables S4, S5). The less stringent FD criteria yielded higher NMI values
in general and somewhat diminished significance of the strongest re-sults of the Phi-test (see below). It is possible that this might reflectmotion-induced structured artifact, or alternatively, increased struc-tured signal content in the data. Overall, the findings with the less strin-gent FD criteria did not substantively alter our conclusions and thus inthe manuscript we focus on the most conservative approach (FD =0.2 mm).
2.3. Region of interest selection
Regions of interest (ROIs) were selected by generating masks corre-sponding to spheres with 10 mm diameters centered at the set of 264Talairach coordinates described in Power et al. (2011). These regionswere generated by combing two approaches: 1) a set of 151 stably acti-vating and non-overlapping regions were identified from a meta-analysis of task fMRI studies, and 2) a set of 193 non-overlapping ROIsgenerated using a resting state functional connectivity mapping ap-proach in forty young, healthy adults. When analyzed using a networkanalysis approach, these regions were found to organize and recapitu-late many known neural systems and thus represent a reasonable andvalidated choice for exploring the changes in neural functional connec-tivity in schizophrenia. For each subject, timecourses corresponding toeach of the 264 ROIs were extracted and cross-correlated to generatea 264 × 264 matrix of Pearson's ρ correlation coefficients. This matrixrepresents the correlation between any two ROIs from a given subject'srs-fMRI data. The effect of excluding ties between nodes within closeproximity (20 mm) was also examined due to concern in the literature(Power et al., 2011) for these ties to be more affected bymotion artifactand non-biological noise (Fig. S3, Table S3). While this resulted in somemodest alterations in node significance in the Phi-test (describedbelow) and a decrease in shared structure (e.g., overall reduced similar-ity in community structure), the overall results were similar and did notalter our conclusions. As such, we present the results with the closeproximity ties included.
2.4. Group-level analyses of community structure
While development of algorithms to determine community struc-ture is an active area of research (Fortunato, 2010), several methods,such as Newman's spectral modularity (Newman, 2006) and Infomap(Rosvall and Bergstrom, 2008), have emerged and have been used inthe neural imaging literature to develop maps of normative humanbrain organization (Blumensath et al., 2013; Power et al., 2011;Rubinov and Sporns, 2010). We chose to use Infomap because it hasbeen successfully used to characterize the functional organization ofthe healthy human brain (Power et al., 2011) as well as its high perfor-mance in detecting communities in graphs (Fortunato, 2010; Rosvalland Bergstrom, 2008).

99D.B. Lerman-Sinkoff, D.M. Barch / NeuroImage: Clinical 10 (2016) 96–106
To examine group level community structure, 264 × 264 group-level mean correlation matrices were generated by taking themean edge correlation coefficient (the correlation between twoROIs) of participants' Fisher R-to-Z transformed data for eachgroup. This group average correlation matrix was then sparsifiedand binarized at a range of thresholds and then processed withInfomap to generate a partitioning of the graph into communities.Sparsification was accomplished by taking the 264 × 264 groupmean correlation coefficient matrix and removing the weakest cor-relation coefficients until the density of remaining correlations(also known as tie-density) reached a specific value. Sparsificationin this manner allows for comparison between different graphsthat may have different mean levels of correlation and wasperformed such that each group had ten graph representations oftheir data at the strongest 10% to 1% correlation values in 1%-densitysteps. The matrices were then binarized for each tie-density level bysetting all remaining correlations to a value of one. Communitystructure was then determined for each group's ten sparsified graphsusing the Infomap algorithm (Rosvall and Bergstrom, 2008). This re-sulted in a 10 × 264 (tie-density × ROI) matrix for each group com-prised of integer values representing community assignments ateach element. Communities that were comprised of less than fiveunique ROIs at a given tie-density were censored from further anal-ysis due to the lack of plausible biological explanations for such com-munities. Weighted sparsified graphs were also examined andresults can be found in the supplement (Table S6 and Fig. S6).These analyses resulted in some modest alterations in node signifi-cance in the Phi-test (described below) and a decrease in sharedstructure (e.g., overall reduced similarity in community structure).However the overall results were similar and did not alter ourconclusions.
Group-level community structure was visualized by assigning acolor to each community's set of ROIs. This was then graphed in twoways: (1) as a two dimensional graph with the x axis representing de-creasing tie density percentages and the y axis representing the ROI asnumbered in the Power, 2011 atlas; and (2) by overlaying 10mmdiam-eter spheres colored by community and placed at the appropriate coor-dinates on the PALS-B12 atlas using Caret 5.65 (Van Essen, 2005; VanEssen andDierker, 2007; VanEssen et al., 2001). Nodes thatwerewithin5 mm of midline were reflected to the contralateral hemisphere to ac-count for errors in MRI alignment and registration.
Because the integer value and color representing a community as-signment is stochastically assigned by Infomap, visual comparisonacross groups was simplified by recoloring matching networks acrossgroups. The CON group was chosen as a template and the color ofROIs of matching communities in SCZ were recolored to match CON,without changing community assignments. For example, if ROIs the inthe visual network were colored green in CON, then the ROIs in thevisual network in SCZ were also colored green, even if the ROIs werenot identical across groups.
In order to quantitatively determine the extent to which group-level network structures were similar across groups, normalizedmutual information metrics (described below) were computed be-tween the CON and SCZ groups in the current study, as well as be-tween the CON and SCZ groups in the current study and the twocohorts of normative participants described in Power et al. (2011).This pairwise similarity measure, normalized mutual information(NMI), varies between zero (complete dissimilarity) and one (iden-tical community assignments). MATLAB tools provided by JonathanPower (available at http://www.nitrc.org/projects/graphtools/)were used to compute NMI using information theory definitions(see Eqs. (16.2)–(16.6) for reference, (Manning et al., 2008)). Xand Y are individual graphs with X = {x1, x2, …, xn}, and Y = {y1,y2, …, yn} representing community assignments of node xn and yn;I(X, Y) is the mutual information between X and Y; and, H(X) andH(Y) are the entropy of X and Y. These computations were
performed per tie-density and resulted in a NMI value of similaritybetween community assignments for each tie-density.
I X;Yð Þ ¼Xn
k
Xn
j
P xk ∩ yj
� �� log
P xk ∩ yj
� �
P xkð Þ � P yj
� �
H Xð Þ ¼ −∑kP xkð Þ � log P xkð Þð Þ NMIðX; YÞ ¼ IðX;YÞðHðXÞ þ HðYÞ=2
2.5. Subject-level analyses of community structure
The above methods are useful for qualitatively describing the grouplevel differences between CONand SCZ. However, they do not allow sta-tistical evaluation of the degree of variability among individuals withina group nor do they allow for determination of whether the communitystructure differs significantly between groups. To do so, graphs weregenerated and community detection performed as described aboveexcept that graphs were generated for each individual subject at eachtie-density rather than group average graphs at each tie-density. Asabove, communities with less than five nodes were censored fromdownstream analyses.
The normalized mutual information (NMI) pairwise similarity met-ric can be extended to test for group differences. If some variance inthe community structure data is reliably explained by group member-ship greater than chance, then the mean NMI between all possiblepairs of participants within that group should be higher than themean NMI of pairs of participants chosen from random groups. As theunderlying distribution of group mean NMI is unknown, statisticaltests upon the mean NMI require generation of a null-distributionthrough a permutation method. The method developed by Alexander-Bloch et al. (2012) was modified to run in MATLAB. This method usedgroup label permutation to determine when participants within a diag-nostic group were more similar than participants across diagnosticgroup. An NMI value was calculated for each pair of participants at alltie-densities and used to calculate the true mean within-group NMI aswell as the true mean NMI for all between-group pairs. Group labelswere then randomly shuffled 10,000 times and the permuted mean“within-group” NMI was calculated at each tie-density. p-Values werethen calculated separately for each tie-density as the count of the num-ber of instanceswhen thepermutedmeanwithin-groupNMIwas great-er than the true mean within-group NMI, divided by the number ofpermutations.
2.6. Phi-test and heat maps of community structure
The NMI permutation test described above indicates whether groupmembership makes a significant difference for community structure.However, it does not reveal how community structures may differacross groups or how the community assignment of specific ROIs maydiffer across groups. To identify the ROIs responsible for group differ-ences in NMI, we used a second permutation test developed byAlexander-Bloch et al. (2012). This tested whether an ROI's participa-tion in a given community varied between participants more whenthey belonged to different diagnostic groups than when they belongedto the same diagnostic group. For each subject and tie-density, a264 × 264 binary-valued matrix was generated corresponding towhether, for a given ROI, all other ROIs shared the same community.ROIs were marked as either participating (1) or not participating(0) in the given ROI's community. For example, Fig. 1 shows three9-ROI toy graphs generated on the same ROIs and their correspondingbinary community assignmentmatrices. The binary community assign-mentmatriceswere then used to generate subject-by-subject node sim-ilarity measures using Pearson's Phi (similar to Pearson's correlationcoefficient, but for binary values). The community membership column

Fig. 1. Example schematic of generation of ROI and subject pair Phi values. Left column: illustration of three toy graphs comprised of the same set of ROIs but with different communitystructures. Middle column: the binarymatrix corresponding to which ROIs belonged to the same community. Right column: each subject's data (capital letter) are comprised of the set ofcolumn vectors from the subject's binarymatrix of communitymembership. The value of Pearson's Phi is computed for all subjects' nodes across the corresponding columns (e.g.: a1withb1, but not a1 with a2).
100 D.B. Lerman-Sinkoff, D.M. Barch / NeuroImage: Clinical 10 (2016) 96–106
for each subject's ROI 1 was correlated to each other subject's ROI 1 col-umnusing Pearson's Phi, and so forth for all other ROIs. AswithNMI, thepair-wise similarity metric was extended to test for group differencesthrough permutation of group labels. The true within-group mean Phiwas calculated for all within-group subject-by-subject ROI pairs, thenlabels were shuffled 10,000 times, and mean permuted within-groupPhi values were calculated and compared with the real data to generatea p-value. Values returned from this procedure were similar to NMI inthat they are both pairwise similarity metrics, but Phi provides per-ROI resolution. Thus, for each tie-density, a set of 264 p-values wasgenerated corresponding to whether a given ROI's community wasmore similar for participants from the same group than permutedgroups. The set of 264 p-values generated at each tie-density werecorrected for multiple comparisons using FDR (Benjamini andHochberg, 1995) with MATLAB tools available at (http://www.mathworks.com/matlabcentral/fileexchange/27418).
2.7. Seed map verification of Phi-test results
The Phi-test identified nodes whose community assignmentsignificantly varied across the two groups. To validate these results,traditional seed map analyses were performed using ROIs thatwere identified as significant across two or more tie density thresh-olds. In-house software (FIDL 2.65, http://www.nil.wustl.edu/labs/fidl/index.html) was used to perform group t-tests for differencesin connectivity for “CON–SCZ” using an unequal assumption of var-iance and a Monte-Carlo correction factor for significance requiring
a cluster of 35 ormore voxelswith a Z-score greater than or equal to 2.5.Test results were visualized using Connectome Workbench software(http://www.humanconnectome.org/software/connectome-workbench.html) at a threshold of Z N 2.5 and Z b −2.5.
3. Results
3.1. Demographics
Following scrubbing and exclusions (detailed in Table 1), N =41 CON and N = 44 SCZ participants retained sufficient data foranalysis. The retained participants did not differ on the number ofretained or lost frames, pre-scrubbing mean framewise displace-ment, age, or parental years of education. Participants did signifi-cantly differ on gender (more males in SCZ), personal years ofeducational attainment (less in SCZ), IQ (less in SCZ), and clinicalsymptoms (more in SCZ).
3.2. Group level analyses
Qualitative examination of group average network structure (Fig. 2)as well as the full unthresholded correlation matrices (Fig. S2) revealedthat overall, resting state connectivity and network structure wasrelatively well preserved in SCZ. This visual similarity was quantifiedusing normalized mutual information (NMI) between the mean CONand SCZ network structures (Table 2). This revealed a high level of sharedinformation confirming the overall visual similarity of network structures

Fig. 2. Group level community structure revealed overall similar structure between CON and SCZ cohorts. Panel A: ROI numbers corresponding to the Power 264 atlas are on the verticalaxis and tie densities are on the horizontal axis. Regions are colored by community assignment and white regions correspond to communities with less than five ROIs. Panel B: CON ROIscolored by communities detected at the 4% tie density and superimposed on the very inflated PALS-B12 atlas. Panel C: SCZ ROIs colored by communities detected at the 4% tie density andsuperimposed on the very inflated PALS-B12 atlas.
101D.B. Lerman-Sinkoff, D.M. Barch / NeuroImage: Clinical 10 (2016) 96–106
(across tie density mean NMI = 0.74, std = 0.03). Additionally, NMI be-tween our CON and SCZ groups was computed with the two cohorts ofhealthy controls described in Power et al. (2011) revealing a high levelof agreement between our participants and the healthy participants de-scribed in Power et al. (2011). The average NMI between our CON andSCZ groups (0.74) was as high as the average NMI between our CONgroup and the two CON groups from Power et al. (2011) (0.73). Thus,the overall network structure differences between our controls andschizophrenia participants were on the same order as differences be-tween our community control participants and the healthy WashingtonUniversity community population used in the Power 2011 study.
3.3. Subject level analyses
Subject level community detection generated ten sets of networkstructures for each subject, one at each tie density. Although the group
Table 2NMI values between CON, SCZ, and the Power 2011 healthy cohorts exhibited high level of sim
Tie density CON × SCZ JP_MAIN × CON
10% 0.79 0.819% 0.78 0.798% 0.72 0.787% 0.73 0.726% 0.74 0.685% 0.70 0.694% 0.72 0.693% 0.74 0.702% 0.71 0.671% 0.77 –Mean across tie density 0.74 0.73Standard deviation 0.03 0.05
JP_MAIN is the main cohort used in Power et al. (2011); JP_REP is the replication cohort used i
level community structure analyses suggested very similar patterns,the NMI permutation on these individual subject network structuresrevealed that the mean of all within-group subject pairings was signifi-cantly higher than themeanof all between-group subject pairings for allbut one tie-density (Table 3). Thus, the community structurewas signif-icantly less similar in the permuted groups than within the real groups.Additionally, at all tie densities, the mean within-CON NMI was greaterthan the mean within-SCZ NMI, implying possibly greater heterogene-ity (i.e., less overall shared information) of network structure in theSCZ group.
While NMI permutation is able to assess whether there are signifi-cant differences in community structure, it does not indicate the regionsresponsible for the differences. Follow-up permutation tests of commu-nity assignments (Fig. 3), described by Alexander-Bloch et al. (2012),were used to reveal ROIs whose community assignments varied signif-icantly between groups and across most tie densities. Two images were
ilarity of network structure across all three cohorts.
JP_REP × CON JP_MAIN × SCZ JP_REP × SCZ
0.81 0.75 0.750.82 0.72 0.740.82 0.70 0.700.75 0.70 0.760.69 0.67 0.690.70 0.72 0.700.68 0.73 0.710.67 0.72 0.680.66 0.70 0.68– – –0.73 0.71 0.710.07 0.02 0.03
n Power et al. (2011).

Table 3NMI permutation testing revealed significant differences between CON and SCZ networkstructures.
Tiedensity
p-value:real Npermuteddata
Mean of allwithin-groupNMI pairings
Mean of allbetween-groupNMI pairings
Meanwithin-CONNMI
Meanwithin-SCZNMI
10% 0.0009 0.256 0.251 0.271 0.2439% 0.0006 0.273 0.268 0.280 0.2678% 0.0075 0.291 0.287 0.301 0.2817% 0.0044 0.314 0.310 0.330 0.3006% 0.0062 0.331 0.328 0.344 0.3195% 0.0194 0.356 0.353 0.371 0.3434% 0.0306 0.370 0.368 0.386 0.3573% 0.0171 0.380 0.378 0.399 0.3642% 0.1574 0.373 0.372 0.395 0.3541% 0.0143 0.315 0.312 0.339 0.294
102 D.B. Lerman-Sinkoff, D.M. Barch / NeuroImage: Clinical 10 (2016) 96–106
generated to visualize the pattern of significance across ROIs and acrosstie-densities. First, nodes were first grouped into their (Power et al.,2011) networks using FDR corrected p b 0.05 as the significance criteri-on, and the percent of significant nodeswithin a networkwere counted.As shown in Fig. 3, therewas variability across groups in the communityassignments of a relatively high percentage of ROIs in the subcorticalnetwork across all tie density levels. In addition, there was variabilityacross groups in the somatosensory hand and mouth, auditory, defaultmode, and salience networks for a small percentage of nodes. To furtherillustrate the pattern of significant ROIs, an aggregate “heatmap” of sig-nificance was generated by summing the number of tie-densities forwhich a given ROI was significant at an FDR corrected p b 0.05. TheseROIs, colored by the count of significant tie-densities, were overlaid onthe PALS-B12 atlas using Caret and each ROIwas surroundedwith a col-ored circle corresponding to its a priori network from the Power atlas(Power et al., 2011). This map (Fig. 4) illustrates the spatial locationand relative consistency across tie densities of ROIs contributing to dif-ferences in NMI and community structure differences between CON andSCZ. This map revealed ROIs showing significant group effects at multi-ple tie densities in bilateral thalamus, as well as significant effects in thebilateral paracentral lobules, left anterior cingulate, and the right insulaand pulvinar (see Table S6 for full details).
Fig. 3.Phi test results exhibited alterations innode communitymembership in the subcortical, safraction of nodes with significant (FDR corrected p b 0.05) alterations at that tie density.
To validate the results of the Phi-test, nodes that were found to besignificant sources of variation in community participation at two ormore tie-densities were identified and used to perform seed map anal-yses. These ROIs included the left (Fig. 5) and right (Fig. S7) medial dor-sal nuclei, the left paracentral lobule (Fig. 6), as well as several others(see Table S7 and Figs. S8–S11). Examination of the ROI in the left medi-al dorsal thalamic nucleus revealed clear differences in connectivity be-tween CON and SCZ (Fig. 5) with SCZ exhibiting bilaterally symmetrichyper-connectivity with somatomotor and somatosensory regions andhypo-connectivity with prefrontal, striatal, and cerebellar regions. Thecorresponding ROI in the right medial dorsal nucleus exhibited similarresults (Fig. S7). Examination of the left paracentral lobule/BA 31 exhib-ited significant dysconnectivity (Fig. 6), with SCZ exhibiting cerebellardysconnectivity, hypo-connectivity with somatomotor, right insular,and left posterior cingulate, as well as hyper-connectivity with the infe-rior parietal lobule and frontal gyri.
4. Discussion
The goal of the current studywas to determinewhether the commu-nity structure of resting state functional connectivity networks was al-tered in adults with schizophrenia. Our results suggested that whilenetwork structures were overall quite similar, especially at the grouplevel, there are small but significant changes in functional network com-munity structure in persons with schizophrenia. Specifically, groupaverage network structures exhibited highly visually similar communi-ty structure across tie densities between the two groups. Quantitativefollow-up examining NMI between group average network structuresconfirmed the visual similarities at matched tie densities. However, sta-tistical evaluation across individual participants revealed evidence forsmall but significant differences in network community structure.Follow-up analyses revealed that alterations in node community partic-ipation in the subcortical, somatosensory, auditory, default mode, andsalience networkswere the strongest contributors to differences in net-work community structure. Finally, the nodes that were most stronglyresponsible for alterations in community participation exhibited statis-tically significant patterns of dysconnectivity in a seed map analysis.
As described above, the group-level analyses suggested that thenetwork community structure was relatively intact in adults with
lience, auditory, somatomotor, anddefaultmodenetworks. Each network is colored by the

Fig. 4. Phi test heatmap at FDR corrected p b .05 revealed significant community assignment alterations in ROIs including the somatosensory, insular, anterior cingulate, and thalamic re-gions. ROIs are colored by number of significant (FDR corrected p b 0.05) tie densities. Significant ROIs are surrounded by a colored ring corresponding to their a-priori network definitionsfrom the Power et al. (2011) atlas.
103D.B. Lerman-Sinkoff, D.M. Barch / NeuroImage: Clinical 10 (2016) 96–106
schizophrenia. Further, at the group level, both controls and individualswith schizophrenia had near-equal amounts of shared informationwithboth sets of network structures generated using data from two different
Fig. 5. Left medial dorsal nucleus exhibited significant dysconnectivity in schizophrenia. Contrablue voxels correspond to statistically significant SCZ N CON connectivity.
samples of healthyWashingtonUniversity students previously reportedin Power et al. (2011). Thus, at the group level, the amount of variationbetween the present community controls and participants with
st CON–SCZ. Red voxels correspond to statistically significant CON N SCZ connectivity and
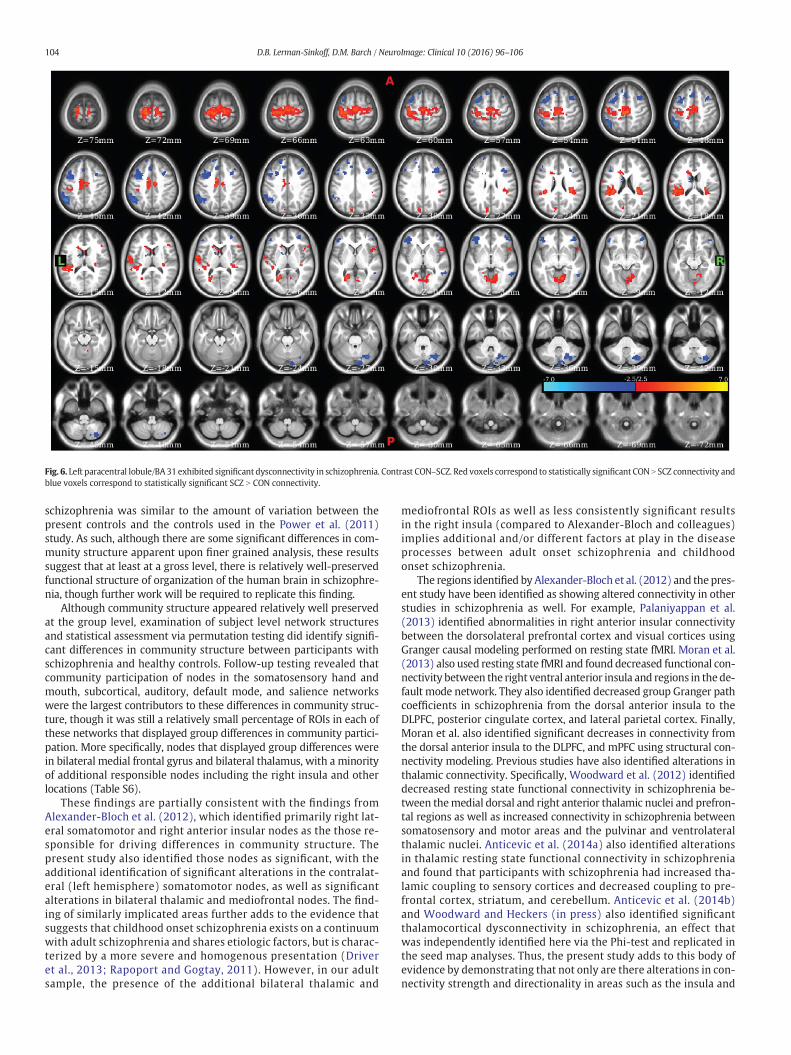
Fig. 6. Left paracentral lobule/BA31 exhibited significant dysconnectivity in schizophrenia. Contrast CON–SCZ. Red voxels correspond to statistically significant CON N SCZ connectivity andblue voxels correspond to statistically significant SCZ N CON connectivity.
104 D.B. Lerman-Sinkoff, D.M. Barch / NeuroImage: Clinical 10 (2016) 96–106
schizophrenia was similar to the amount of variation between thepresent controls and the controls used in the Power et al. (2011)study. As such, although there are some significant differences in com-munity structure apparent upon finer grained analysis, these resultssuggest that at least at a gross level, there is relatively well-preservedfunctional structure of organization of the human brain in schizophre-nia, though further work will be required to replicate this finding.
Although community structure appeared relatively well preservedat the group level, examination of subject level network structuresand statistical assessment via permutation testing did identify signifi-cant differences in community structure between participants withschizophrenia and healthy controls. Follow-up testing revealed thatcommunity participation of nodes in the somatosensory hand andmouth, subcortical, auditory, default mode, and salience networkswere the largest contributors to these differences in community struc-ture, though it was still a relatively small percentage of ROIs in each ofthese networks that displayed group differences in community partici-pation. More specifically, nodes that displayed group differences werein bilateral medial frontal gyrus and bilateral thalamus, with a minorityof additional responsible nodes including the right insula and otherlocations (Table S6).
These findings are partially consistent with the findings fromAlexander-Bloch et al. (2012), which identified primarily right lat-eral somatomotor and right anterior insular nodes as the those re-sponsible for driving differences in community structure. Thepresent study also identified those nodes as significant, with theadditional identification of significant alterations in the contralat-eral (left hemisphere) somatomotor nodes, as well as significantalterations in bilateral thalamic and mediofrontal nodes. The find-ing of similarly implicated areas further adds to the evidence thatsuggests that childhood onset schizophrenia exists on a continuumwith adult schizophrenia and shares etiologic factors, but is charac-terized by a more severe and homogenous presentation (Driveret al., 2013; Rapoport and Gogtay, 2011). However, in our adultsample, the presence of the additional bilateral thalamic and
mediofrontal ROIs as well as less consistently significant resultsin the right insula (compared to Alexander-Bloch and colleagues)implies additional and/or different factors at play in the diseaseprocesses between adult onset schizophrenia and childhoodonset schizophrenia.
The regions identified by Alexander-Bloch et al. (2012) and the pres-ent study have been identified as showing altered connectivity in otherstudies in schizophrenia as well. For example, Palaniyappan et al.(2013) identified abnormalities in right anterior insular connectivitybetween the dorsolateral prefrontal cortex and visual cortices usingGranger causal modeling performed on resting state fMRI. Moran et al.(2013) also used resting state fMRI and found decreased functional con-nectivity between the right ventral anterior insula and regions in thede-fault mode network. They also identified decreased group Granger pathcoefficients in schizophrenia from the dorsal anterior insula to theDLPFC, posterior cingulate cortex, and lateral parietal cortex. Finally,Moran et al. also identified significant decreases in connectivity fromthe dorsal anterior insula to the DLPFC, and mPFC using structural con-nectivity modeling. Previous studies have also identified alterations inthalamic connectivity. Specifically, Woodward et al. (2012) identifieddecreased resting state functional connectivity in schizophrenia be-tween themedial dorsal and right anterior thalamic nuclei and prefron-tal regions as well as increased connectivity in schizophrenia betweensomatosensory and motor areas and the pulvinar and ventrolateralthalamic nuclei. Anticevic et al. (2014a) also identified alterationsin thalamic resting state functional connectivity in schizophreniaand found that participants with schizophrenia had increased tha-lamic coupling to sensory cortices and decreased coupling to pre-frontal cortex, striatum, and cerebellum. Anticevic et al. (2014b)and Woodward and Heckers (in press) also identified significantthalamocortical dysconnectivity in schizophrenia, an effect thatwas independently identified here via the Phi-test and replicated inthe seed map analyses. Thus, the present study adds to this body ofevidence by demonstrating that not only are there alterations in con-nectivity strength and directionality in areas such as the insula and

105D.B. Lerman-Sinkoff, D.M. Barch / NeuroImage: Clinical 10 (2016) 96–106
the thalamus, but that these areas may also be contributing to differ-ences in network community structure observed in persons withschizophrenia.
5. Limitations and future directions
First, participants with schizophrenia were on a stable medicationregimen at the time of scanning and it is possible thatmedications influ-ence the patterns of functional connectivity. Second, we did not controlfor structural brain differences in SCZ beyond standard image registra-tion to an atlas space. Further, there were demographic differencesbetween the groups such that SCZ had lower measures of IQ and de-creased years of education, though the groups were not different in pa-rental education, a proxy measure of developmental exposure toeducational resources. Such differences in personal IQ and educationare often present among individuals who have illnesses that can strikein adolescence and impair academic achievement. Nonetheless, futurework with larger samples should examine the degree to which IQ oreducation effects may influence outcomes. Additionally, while everyeffort was made to remove headmotion derived artifact, such stringen-cy forced the exclusion of 67 of participants and large number of framesfrom some of the participants that exceeded the minimum inclusioncriteria. The stringent removal of motion artifact by censoring affectedframes resulted in slightly different distributions of contiguous framesbetween the two groups (Fig. S1). This may have differentially affectedour ability to fully resolve high-frequency signal components in thedata. Future studies will need to address these issues by increasing sub-ject recruitment, aggregating across multiple studies, matching fornumber of contiguous frames removed, or collectingmore data per sub-ject through additional resting state scans or by regressing out of taskstructure (Cole et al., 2014) to generate pseudo-resting state data. Re-cruitment of larger studies will have an added benefit of allowing forthe investigation of increased variability in connectivity seen across in-dividualswith schizophrenia (reflected in the lowermeanwithin-groupNMI in SCZ). This could allow for the study of whether certain aspects ofcommunity structure correlate with specific symptom or behavioral di-mensions of psychosis (Cuthbert and Insel, 2010). Additionally, thepresent study examined binarized and thresholded network structuresrather than full weighted network structures. While this approachyields analyses that are more computationally tractable than weightednetwork structures, thresholding the data focuses upon a core set ofstrongest edges (i.e.: in this study, the edges which were among thestrongest 10% to 1% of edges) and may fail to detect effects in edgesthat are in a lower strength range of the distribution. However, thesemethods have been informative when applied to the healthy brain(e.g.: (Power et al., 2011)), and thus represent a valid approach tostudying how the brain changes with psychopathology. Related tothis, the selection of a threshold at which to exclude edges from thegraph is a required step and an unsolved issue in the neuroimaginggraph theory field.While it is common to examine a range of thresholds,this results in a set of non-independent tie densities, which makes thetesting for significance across densities a non-trivial problem.
6. Conclusions
Our findings indicate that while overall network community struc-ture is broadly preserved in adult schizophrenia, there is evidence forstatistically significant alterations in the community participation ofspecific brain regions. These differences were localized to the somato-sensory, auditory, default mode, salience, and subcortical networks.These alterations in adult schizophrenia community structure wereconsistent with alterations observed in childhood-onset schizophrenia,pointing towards some shared etiology between the disorders (Driveret al., 2013; Rapoport and Gogtay, 2011). However, the presence of dif-ferences in thefindings showing altered connectivity between adult andchildhood onset schizophrenia implies that there may be additional
and/or different factors involved in the adult formof thedisease. Furtherstudies are required to answer these questions and help explain hownetwork structures evolve over time and over the course of this debili-tating disease.
Funding
D.B.LS. was supported by the Washington University MSTP Pro-gram grant 5T32GM007200; the Cognitive, Computational, and Sys-tems Neuroscience pathway grant 5T32NS073547, and NIH grants5R01MH066031 and P50MH071616 to D.M.B.. Computations wereperformed using the facilities of the Washington University Centerfor High Performance Computing, which were partially providedthrough grant NCRR 1S10RR022984-01A1.
Conflicts of interest
D.B.LS. reported no conflicts of interest. Dr. Barch consults for Pfizer,Roche, Amgen, and Takeda.
Acknowledgments
We thank: Steve Petersen, Jonathan Power, and BabatundeAdeyemo for creating and sharing MATLAB software tools for restingstate fMRI preprocessing and graph theory analyses; Ben Acland andSachin Dixit for assistance with Freesurfer; and Jo Etzel and MalcolmTobias for assistance in the use of the Washington University Centerfor High Performance Computing resources.
Appendix A. Supplementary data
Supplementary data to this article can be found online at http://dx.doi.org/10.1016/j.nicl.2015.11.011.
References
Alexander-Bloch, A.F., Gogtay, N., Meunier, D., Birn, R., Clasen, L., Lalonde, F., Lenroot, R.,Giedd, J., Bullmore, E.T., 2010. Disrupted modularity and local connectivity of brainfunctional networks in childhood-onset schizophrenia. Front. Syst. Neurosci. 4.
Alexander-Bloch, A., Lambiotte, R., Roberts, B., Giedd, J., Gogtay, N., Bullmore, E., 2012. Thediscovery of population differences in network community structure: new methodsand applications to brain functional networks in schizophrenia. NeuroImage 59 (4),3889–3900.
Anticevic, A., Cole, M.W., Repovs, G., Murray, J.D., Brumbaugh, M.S., Winkler, A.M., Savic,A., Krystal, J.H., Pearlson, G.D., Glahn, D.C., 2014a. Characterizing thalamo-cortical dis-turbances in schizophrenia and bipolar illness. Cereb. Cortex 24 (12), 3116–3130.
Anticevic, A., Yang, G., Savic, A., Murray, J.D., Cole, M.W., Repovs, G., Pearlson, G.D., Glahn,D.C., 2014b. Mediodorsal and visual thalamic connectivity differ in schizophreniaand bipolar disorder with and without psychosis history. Schizophr. Bull. 40 (6),1227–1243.
Bassett, D.S., Nelson, B.G., Mueller, B.A., Camchong, J., Lim, K.O., 2012. Altered resting statecomplexity in schizophrenia. NeuroImage 59 (3), 2196–2207.
Benjamini, Y., Hochberg, Y., 1995. Controlling the false discovery rate: a practical andpowerful approach to multiple testing. J. R. Stat. Soc. Ser. B Methodol. 57 (1),289–300.
Blumensath, T., Jbabdi, S., Glasser, M.F., Van Essen, D.C., Uğurbil, K., Behrens, T.E.J., Smith,S.M., 2013. Spatially constrained hierarchical parcellation of the brain with resting-state fMRI. NeuroImage 76, 313–324.
Bullmore, E., Sporns, O., 2009. Complex brain networks: graph theoretical analysis ofstructural and functional systems. Nat. Rev. Neurosci. 10 (3), 186–198.
Cole, M.W., Anticevic, A., Repovs, G., Barch, D., 2011. Variable global dysconnectivity andindividual differences in schizophrenia. Biol. Psychiatry 70 (1), 43–50.
Cole, M.W., Bassett, D.S., Power, J.D., Braver, T.S., Petersen, S.E., 2014. Intrinsic and task-evoked network architectures of the human brain. Neuron 83 (1), 238–251.
Cuthbert, B.N., Insel, T.R., 2010. Toward new approaches to psychotic disorders: the NIMHresearch domain criteria project. Schizophr. Bull. 36 (6), 1061–1062.
Cuthbert, B.N., Kozak, M.J., 2013. Constructing constructs for psychopathology: the NIMHresearch domain criteria. J. Abnorm. Psychol. 122 (3), 928–937.
Dosenbach, N.U.F., Fair, D.A., Miezin, F.M., Cohen, A.L., Wenger, K.K., Dosenbach, R.A.T.,Fox, M.D., Snyder, A.Z., Vincent, J.L., Raichle, M.E., Schlaggar, B.L., Petersen, S.E.,2007. Distinct brain networks for adaptive and stable task control in humans. Proc.Natl. Acad. Sci. U. S. A. 104 (26), 11073–11078.
Driver, D.I., Gogtay, N., Rapoport, J.L., 2013. Childhood onset schizophrenia and early onsetschizophrenia spectrum disorders. Child Adolesc. Psychiatr. Clin. N. Am. 22 (4),539–555.

106 D.B. Lerman-Sinkoff, D.M. Barch / NeuroImage: Clinical 10 (2016) 96–106
Ellison-Wright, I., Bullmore, E., 2009. Meta-analysis of diffusion tensor imaging studies inschizophrenia. Schizophr. Res. 108 (1–3), 3–10.
Fornito, A., Zalesky, A., Pantelis, C., Bullmore, E.T., 2012. Schizophrenia, neuroimaging andconnectomics. NeuroImage 1–19.
Fortunato, S., 2010. Community detection in graphs. Phys. Rep. 486 (3–5), 75–174.Fox, M.D., Snyder, A.Z., Vincent, J.L., Corbetta, M., Van Essen, D.C., Raichle, M.E., 2005. The
human brain is intrinsically organized into dynamic, anticorrelated functional net-works. Proc. Natl. Acad. Sci. 102 (27), 9673–9678.
Friston, K.J., Williams, S., Howard, R., Frackowiak, R.S., Turner, R., 1996. Movement-relatedeffects in fMRI time-series. Magn. Reson. Med. 35, 346–355.
Friston, K.J., 1998. The disconnection hypothesis. Schizophr. Res. 30 (2), 115–125.Glahn, D.C., Winkler, A.M., Kochunov, P., Almasy, L., Duggirala, R., Carless, M.A., Curran,
J.C., Olvera, R.L., Laird, A.R., Smith, S.M., Beckmann, C.F., Fox, P.T., Blangero, J., 2010.Genetic control over the resting brain. Proc. Natl. Acad. Sci. 107 (3), 1223–1228.
Jafri, M.J., Pearlson, G.D., Stevens, M., Calhoun, V.D., 2008. A method for functional net-work connectivity among spatially independent resting-state components in schizo-phrenia. NeuroImage 39 (4), 1666–1681.
Jiang, T., Zhou, Y., Liu, B., Liu, Y., Song, M., 2013. Brainnetome-wide association studiesin schizophrenia: the advances and future. Neurosci. Biobehav. Rev. 37 (10),2818–2835.
Liu, Y., Liang, M., Zhou, Y., He, Y., Hao, Y., Song, M., Yu, C., Liu, H., Liu, Z., Jiang, T., 2008.Disrupted small-world networks in schizophrenia. Brain 131 (4), 945–961.
Lynall, M.E., Bassett, D.S., Kerwin, R., McKenna, P.J., Kitzbichler, M., Muller, U., Bullmore, E.,2010. Functional connectivity and brain networks in schizophrenia. J. Neurosci. 30(28), 9477–9487.
Ma, S., Calhoun, V.D., Eichele, T., Du, W., Adalı, T., 2012. Modulations of functional connec-tivity in the healthy and schizophrenia groups during task and rest. NeuroImage 62(3), 1694–1704.
Manning, C.D., Raghavan, P., Schutze, H., 2008. Introduction to Information Retrieval.Cambridge University Press.
Moran, L.V., Tagamets, M.A., Sampath, H., O'Donnell, A., Stein, E.A., Kochunov, P., Hong,L.E., 2013. Disruption of anterior insula modulation of large-scale brain networks inschizophrenia. Biol. Psychiatry 74 (6), 467–474.
Newman, M.E.J., 2006.Modularity and community structure in networks. Proc. Natl. Acad.Sci. 103 (23), 8577–8582.
Öngür, D., Lundy, M., Greenhouse, I., Shinn, A.K., Menon, V., Cohen, B.M., Renshaw, P.F.,2010. Default mode network abnormalities in bipolar disorder and schizophrenia.Psychiatry Res. 183 (1), 59–68.
Palaniyappan, L., Simmonite, M., White, T.P., Liddle, E.B., Liddle, P.F., 2013. Neural primacyof the salience processing system in schizophrenia. Neuron 79 (4), 814–828.
Patel, S., Mahon, K., Wellington, R., Zhang, J., Chaplin, W., Szeszko, P.R., 2011. A meta-analysis of diffusion tensor imaging studies of the corpus callosum in schizophrenia.Schizophr. Res. 129 (2–3), 149–155.
Pettersson-Yeo, W., Allen, P., Benetti, S., McGuire, P., Mechelli, A., 2011. Dysconnectivity inschizophrenia: where are we now? Neurosci. Biobehav. Rev. 35 (5), 1110–1124.
Power, J.D., Cohen, A.L., Nelson, S.M., Wig, G.S., Barnes, K.A., Church, J.A., Vogel, A.C.,Laumann, T.O., Miezin, F.M., Schlaggar, B.L., Petersen, S.E., 2011. Functional networkorganization of the human brain. Neuron 72 (4), 665–678.
Power, J.D., Barnes, K.A., Snyder, A.Z., Schlaggar, B.L., Petersen, S.E., 2012. Spurious but sys-tematic correlations in functional connectivity MRI networks arise from subject mo-tion. NeuroImage 59 (3), 2142–2154.
Power, J.D., Mitra, A., Laumann, T.O., Snyder, A.Z., Schlaggar, B.L., Petersen, S.E., 2014.Methods to detect, characterize, and remove motion artifact in resting state fMRI.NeuroImage 84, 320–341.
Rapoport, J.L., Gogtay, N., 2011. Childhood onset schizophrenia: support for a progressiveneurodevelopmental disorder. Int. J. Dev. Neurosci. 29 (3), 251–258.
Repovs, G., Csernansky, J.G., Barch, D.M., 2011. Brain network connectivity in individualswith schizophrenia and their siblings. Biol. Psychiatry 69 (10), 967–973.
Rosvall, M., Bergstrom, C.T., 2008. Maps of random walks on complex networks revealcommunity structure. Proc. Natl. Acad. Sci. 105 (4), 1118–1123.
Rubinov, M., Bullmore, E., 2013. Schizophrenia and abnormal brain network hubs.Dialogues Clin. Neurosci. 15 (3), 339–349.
Rubinov, M., Sporns, O., 2010. Complex networkmeasures of brain connectivity: uses andinterpretations. NeuroImage 52 (3), 1059–1069.
Satterthwaite, T.D., Wolf, D.H., Loughead, J., Ruparel, K., Elliott, M.A., Hakonarson, H., Gur,R.C., Gur, R.E., 2012. Impact of in-scanner head motion on multiple measures of func-tional connectivity: relevance for studies of neurodevelopment in youth. NeuroImage60 (1), 623–632.
Sheffield, J.M., Repovs, G., Harms, M.P., Carter, C.S., Gold, J.M., MacDonald III, A.W., DanielRagland, J., Silverstein, S.M., Godwin, D., Barch, D.M., 2015. Fronto-parietal andcingulo-opercular network integrity and cognition in health and schizophrenia.Neuropsychologia 73, 82–93.
Stephan, K.E., Baldeweg, T., Friston, K.J., 2006. Synaptic plasticity and dysconnection inschizophrenia. BPS 59 (10), 929–939.
van den Heuvel, M.P., Fornito, A., 2014. Brain networks in schizophrenia. Neuropsychol.Rev. 24 (1), 32–48.
Van Dijk, K.R.A., Sabuncu, M.R., Buckner, R.L., 2012. The influence of head motion on in-trinsic functional connectivity MRI. NeuroImage 59 (1), 431–438.
Van Essen, D.C., 2005. A population-average, landmark- and surface-based (PALS) atlas ofhuman cerebral cortex. NeuroImage 28 (3), 635–662.
Van Essen, D.C., Dierker, D.L., 2007. Surface-based and probabilistic atlases of primate ce-rebral cortex. Neuron 56 (2), 209–225.
Van Essen, D.C., Drury, H.A., Dickson, J., Harwell, J., Hanlon, D., Anderson, C.H., 2001. Anintegrated software suite for surface-based analyses of cerebral cortex. J. Am.Med. In-form. Assoc. 8 (5), 443–459.
Whitfield-Gabrieli, S., Thermenos, H.W., Milanovic, S., Tsuang, M.T., Faraone, S.V.,McCarley, R.W., Shenton, M.E., Green, A.I., Nieto-Castanon, A., LaViolette, P., Wojcik,J., Gabrieli, J.D.E., Seidman, L.J., 2009. Hyperactivity and hyperconnectivity of the de-fault network in schizophrenia and in first-degree relatives of persons with schizo-phrenia. Proc. Natl. Acad. Sci. U. S. A. 106 (4), 1279–1284.
Woodward, N.D., Heckers, S., 2015. Mapping thalamocortical functional connectivity inchronic and early stages of psychotic disorders. Biol. Psychiatry http://dx.doi.org/10.1016/j.biopsych.2015.06.026 (in press).
Woodward, N.D., Rogers, B., Heckers, S., 2011. Functional resting-state networks aredifferentially affected in schizophrenia. Schizophr. Res. 130 (1–3), 86–93.
Woodward, N.D., Karbasforoushan, H., Heckers, S., 2012. Thalamocortical dysconnectivityin schizophrenia. Am. J. Psychiatry 169 (10), 1092–1099.
Zhou, Y., Liang, M., Jiang, T., Tian, L., Liu, Y., Liu, Z., Liu, H., Kuang, F., 2007. Functionaldysconnectivity of the dorsolateral prefrontal cortex in first-episode schizophreniausing resting-state fMRI. Neurosci. Lett. 417 (3), 297–302.


![COMMUNITY STRUCTURE IN ONLINE COLLEGIATE ... Papers 2008...one’s social network to provide important services (such as effective recommendation systems [105]). 1.1. Network Science](https://img.dokumen.tips/doc/110x75/5fbb83a8427c381339178f6a/community-structure-in-online-collegiate-papers-2008-oneas-social-network.jpg)