Embed Size (px)
Citation preview
Predicting Successful Memes using Network and Community Structure
Lilian Weng and Filippo Menczer and Yong-Yeol AhnCenter for Complex Networks and Systems Research
School of Informatics and ComputingIndiana University, Bloomington, USA
Abstract
We investigate the predictability of successful memes usingtheir early spreading patterns in the underlying social net-works. We propose and analyze a comprehensive set of fea-tures and develop an accurate model to predict future popu-larity of a meme given its early spreading patterns. Our pa-per provides the first comprehensive comparison of existingpredictive frameworks. We categorize our features into threegroups: influence of early adopters, community concentra-tion, and characteristics of adoption time series. We find thatfeatures based on community structure are the most powerfulpredictors of future success. We also find that early popular-ity of a meme is not a good predictor of its future popularity,contrary to common belief. Our methods outperform otherapproaches, particularly in the task of detecting very popularor unpopular memes.
IntroductionA meme is a piece of information that replicates amongpeople (Dawkins 1989). Memes bear similarities to infec-tious diseases, as both travel through social ties from oneperson to another (Daley and Kendall 1964; Goffman andNewill 1964). The wide adoption of online social networksnot only makes Internet memes possible, but also providesus with valuable data on the spreading of memes and userbehavior (Vespignani 2009; Lazer et al. 2009). Although nu-merous memes are created everyday, only a few go viral,prompting a question that has attracted attention across dis-ciplines including marketing, advertisement, and social me-dia analytics, as well as machine learning and network sci-ence: can we predict successful memes at their early stage?
What makes a meme viral? First, a meme may becomeviral simply because the meme appeals to many (Berger andMilkman 2009; Cataldi, Caro, and Schifanella 2010). At thesame time, given the competition between memes and socialinfluence, innate appeal alone may not be able to paint thewhole picture (Salganik, Dodds, and Watts 2006; Kitsak etal. 2010; Yang, Sun, and Mei 2012). The success of a memealso depends on timing, network structure, randomness, andmany other factors (Centola 2010; Weng et al. 2012; Pinto,Almeida, and Goncalves 2013).
Copyright c© 2014, Association for the Advancement of ArtificialIntelligence (www.aaai.org). All rights reserved.
We identify two major approaches to meme virality pre-diction: time series analysis and feature-based classifica-tion. Time series analyses focus on the patterns of earlypopularity fluctuation of a meme, assuming that the pat-terns of a meme’s growth and decay tell us whether itwill go viral in the future (Jamali and Rangwala 2009;Asur et al. 2011; Yang and Leskovec 2011). Classifica-tion approaches commonly aim to discover distinguishingfeatures of successful memes by applying supervised ma-chine learning techinques with labled datasets. A varietyof features have been proposed and tested to differenti-ate viral memes from others; examples include comments,votes, and user-defined groups (Lerman and Hogg 2010;Jamali and Rangwala 2009; Suh et al. 2010; Hong, Dan, andDavison 2011; Yang, Sun, and Mei 2012). However, moststudies have paid little attention to the role of the under-lying network structure (Romero, Tan, and Ugander 2013;Ma, Sun, and Cong 2013) even though it is natural to expectnetwork topology to affect information diffusion, as memesspread through social ties.
Here we demonstrate that features based on networkstructure, particularly communities—defined as denselyconnected clusters of people (Fortunato 2010)—provide cru-cial insights into virality. We offer the first comprehensivecomparative analysis of three categories of features: The firstcategory includes features that capture the audience size. Asmany studies on social influence have assumed, the neigh-bors of an individual in the network can be considered astheir potential audience (Kitsak et al. 2010; Cha et al. 2010;Suh et al. 2010; Bakshy et al. 2011). For example, one of thecommon beliefs is that star users with lots of followers aremore influential than others with fewer followers. Second,we examine the predictive power of community structure, asit was shown that the spreading pattern of a meme acrosscommunities reveals the general appeal of the meme (Weng,Menczer, and Ahn 2013). Finally, we take into account thespeed of growth in early meme adoption.
By comparing with multiple representative predictionmodels, we show that our model can accurately predict thepopularity of memes (to an order of magnitude) two monthsin advance, with knowledge of only a small number of earlytweets. Our model outperforms random guessing, majorityguessing, and three regression models that use early popu-larity or expected influence of early adopters.
BackgroundThe virality of memes has been examined from various per-spectives, including their innate attractiveness and the roleof influentials along with their adoption patterns.
The innate appeal of a meme is commonly believed tocontribute to its virality. Berger and Milkman (2009) stud-ied emotion hidden in the content of news articles and foundthat, for instance, articles that evoke arousal are more vi-ral. Guerini, Strapparava, and Ozbal (2011) characterizedvarious aspects that indicate the virality of text-based con-tent, based on the assumption that virality is an intrinsictrait of content. Tsur and Rappoport (2012) analyzed a richset of content-based features extracted from hashtags, suchas the number of words contained, spelling, lexical items,location in tweets, emotional and cognitive dimensions, inorder to predict future popularity of the hashtags. Yet, ran-domized experiments on music choices and social news fil-tering suggested that innate quality may play only a minorrole in determining future popularity due to the strong ef-fect of social influence (Salganik, Dodds, and Watts 2006;Muchnik, Aral, and Taylor 2013).
User behaviors and characteristics are other importantaspects. Limited individual attention causes competitionamong memes, inducing strong heterogeneity in meme pop-ularity and longevity (Weng et al. 2012). Each user hasdifferent interests affecting adoption preference and memepopularity (Yang, Sun, and Mei 2012). Many methodsfor quantifying user influence and identifying influentialusers—influentials—have been proposed. User influence isoften quantified in terms of high degree or retweetabil-ity (Cha et al. 2010; Suh et al. 2010), topical similarity (Tanget al. 2009; Weng et al. 2010), information forwarding ac-tivity (Romero et al. 2011; Suh et al. 2010), or size of cas-cades (Kitsak et al. 2010; Bakshy et al. 2011). Here we eval-uate our model against a baseline built upon social influence.
The structure of the underlying networks has been shownto have a significant impact on the spreading process in gen-eral (Daley and Kendall 1964; Goffman and Newill 1964;Barrat, Barthelemy, and Vespignani 2008; Pastor-Satorrasand Vespignani 2001) and vice versa (Weng et al. 2013).The existence of hubs—nodes with lots of neighbors—isknown to affect the persistence of infections, the distributionof cascade sizes, and the vulnerability of the system (Pastor-Satorras and Vespignani 2001; Watts 2002). Other impor-tant network structures present in most real networks aredense subgraphs called communities (Newman 2006; Ros-vall and Bergstrom 2008; Ahn, Bagrow, and Lehmann 2010;Fortunato 2010). Communities are believed to constrain in-formation flow or the spreading of diseases (Granovetter1973; Onnela et al. 2007; Rosvall and Bergstrom 2008;Colbaugh and Glass 2012; Weng, Menczer, and Ahn 2013).
The spread of memes is often considered as social con-tagion, commonly defined as the spread of information orbehavior on social networks where an individual serves asthe stimulus for the imitative actions of another (Lindzeyand Aronson 1985; Goffman and Newill 1964; Daley andKendall 1964). However, studies have shown that infor-mation contagion may spread differently from diseases, asmultiple exposures can significantly increase the chances
of adoption (Granovetter 1978; Centola 2010; Romero,Meeder, and Kleinberg 2011). The speed and ease of memetransmission is affected by characteristics of social ties.Strong and homophilous ties are often seen as more effectivethan weak ties for spreading messages (Brown and Reingen1987), while weak ties are expected to transmit novel infor-mation (Granovetter 1973). In viral marketing and consumerstudies, researchers actively apply network approaches toanalyze and model local and global structural patterns ofsocial networks (Leskovec, Adamic, and Huberman 2007;Mason, Jones, and Goldstone 2008; Aral and Walker 2011).
One of the common approaches to detect viral memesis time series analysis, which examines temporal patternssuch as growth, bursts, and decay (Wu and Huberman 2007;Romero, Meeder, and Kleinberg 2011; Asur et al. 2011). Acommon finding is that temporal patterns of memes can bewell summarized into a few categories, and they have pre-dictive power to spot trendy or bursty memes (Yang andLeskovec 2011; Lehmann et al. 2012). Classification of tem-poral patterns can be seen as an extended application of tra-jectory clustering (Gaffney and Smyth 1999; Lee, Han, andWhang 2007). Existing virality prediction algorithms try toforecast time series based on past values (McNames 1998;Lenser and Veloso 2005; Kaltenbrunner, Gomez, and Lopez2007). Some event detection methods group memes togetherto form topics and use temporal activity to detect trendingtopics (Becker, Naaman, and Gravano 2011; Cataldi, Caro,and Schifanella 2010).
In another approach, the prediction problem is treatedas a classification task. Multiple studies have claimed thatthe early popularity of online content is strongly corre-lated with its future popularity (Jamali and Rangwala 2009;Szabo and Huberman 2010; Lerman and Hogg 2010). Szaboand Huberman (2010) proposed a model that predicts fu-ture popularity based on early popularity. Jamali and Rang-wala (2009) used daily user activities, user interest peak, andcomment information attached to each Digg story to esti-mate future usage. Design elements of a website are shownto be informative as well; Lerman and Hogg (2010) foundthat incorporating design features of the website can im-prove the outcomes of their stochastic prediction model. Thenumbers of URLs and hashtags in a tweet are suggested tobe strongly correlated with its retweetability, while the num-ber of followers, followees, and the account age have a weakeffect (Suh et al. 2010). Yang, Sun, and Mei (2012) quan-tified how a user selects content tags using individual in-terests, relevance, and behavior of neighbors; however, thefeatures are proposed for predicting whether a single userwill adopt a given hashtag, not applicable for foretelling thefuture popularity of hashtags. Some other notable featuresinclude content properties such as terms, language, seman-tics, and category (Tsur and Rappoport 2012), user influ-ence (Bakshy et al. 2011; Salganik, Dodds, and Watts 2006),source authority (Bandari, Asur, and Huberman 2012), andthe graph topology of early adopters (Romero, Tan, andUgander 2013; Ma, Sun, and Cong 2013). In a recent paper,Cheng et al. (2014) formulated social virality prediction as asequence of binary classification problems, while a cascadeis tracked over time. In spite of the different problem formu-
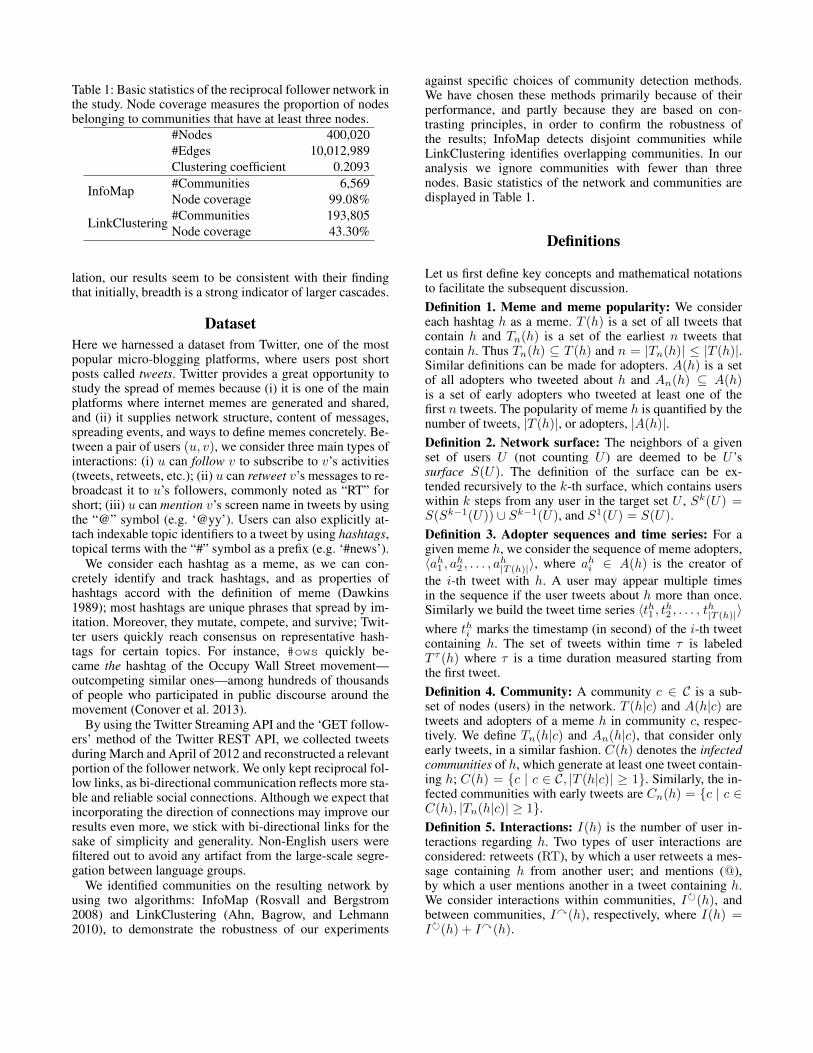
Table 1: Basic statistics of the reciprocal follower network inthe study. Node coverage measures the proportion of nodesbelonging to communities that have at least three nodes.
#Nodes 400,020#Edges 10,012,989Clustering coefficient 0.2093
InfoMap #Communities 6,569Node coverage 99.08%
LinkClustering #Communities 193,805Node coverage 43.30%
lation, our results seem to be consistent with their findingthat initially, breadth is a strong indicator of larger cascades.
DatasetHere we harnessed a dataset from Twitter, one of the mostpopular micro-blogging platforms, where users post shortposts called tweets. Twitter provides a great opportunity tostudy the spread of memes because (i) it is one of the mainplatforms where internet memes are generated and shared,and (ii) it supplies network structure, content of messages,spreading events, and ways to define memes concretely. Be-tween a pair of users (u, v), we consider three main types ofinteractions: (i) u can follow v to subscribe to v’s activities(tweets, retweets, etc.); (ii) u can retweet v’s messages to re-broadcast it to u’s followers, commonly noted as “RT” forshort; (iii) u can mention v’s screen name in tweets by usingthe “@” symbol (e.g. ‘@yy’). Users can also explicitly at-tach indexable topic identifiers to a tweet by using hashtags,topical terms with the “#” symbol as a prefix (e.g. ‘#news’).
We consider each hashtag as a meme, as we can con-cretely identify and track hashtags, and as properties ofhashtags accord with the definition of meme (Dawkins1989); most hashtags are unique phrases that spread by im-itation. Moreover, they mutate, compete, and survive; Twit-ter users quickly reach consensus on representative hash-tags for certain topics. For instance, #ows quickly be-came the hashtag of the Occupy Wall Street movement—outcompeting similar ones—among hundreds of thousandsof people who participated in public discourse around themovement (Conover et al. 2013).
By using the Twitter Streaming API and the ‘GET follow-ers’ method of the Twitter REST API, we collected tweetsduring March and April of 2012 and reconstructed a relevantportion of the follower network. We only kept reciprocal fol-low links, as bi-directional communication reflects more sta-ble and reliable social connections. Although we expect thatincorporating the direction of connections may improve ourresults even more, we stick with bi-directional links for thesake of simplicity and generality. Non-English users werefiltered out to avoid any artifact from the large-scale segre-gation between language groups.
We identified communities on the resulting network byusing two algorithms: InfoMap (Rosvall and Bergstrom2008) and LinkClustering (Ahn, Bagrow, and Lehmann2010), to demonstrate the robustness of our experiments
against specific choices of community detection methods.We have chosen these methods primarily because of theirperformance, and partly because they are based on con-trasting principles, in order to confirm the robustness ofthe results; InfoMap detects disjoint communities whileLinkClustering identifies overlapping communities. In ouranalysis we ignore communities with fewer than threenodes. Basic statistics of the network and communities aredisplayed in Table 1.
Definitions
Let us first define key concepts and mathematical notationsto facilitate the subsequent discussion.Definition 1. Meme and meme popularity: We considereach hashtag h as a meme. T (h) is a set of all tweets thatcontain h and Tn(h) is a set of the earliest n tweets thatcontain h. Thus Tn(h) ⊆ T (h) and n = |Tn(h)| ≤ |T (h)|.Similar definitions can be made for adopters. A(h) is a setof all adopters who tweeted about h and An(h) ⊆ A(h)is a set of early adopters who tweeted at least one of thefirst n tweets. The popularity of meme h is quantified by thenumber of tweets, |T (h)|, or adopters, |A(h)|.Definition 2. Network surface: The neighbors of a givenset of users U (not counting U ) are deemed to be U ’ssurface S(U). The definition of the surface can be ex-tended recursively to the k-th surface, which contains userswithin k steps from any user in the target set U , Sk(U) =S(Sk−1(U)) ∪ Sk−1(U), and S1(U) = S(U).Definition 3. Adopter sequences and time series: For agiven meme h, we consider the sequence of meme adopters,〈ah1 , ah2 , . . . , ah|T (h)|〉, where ahi ∈ A(h) is the creator ofthe i-th tweet with h. A user may appear multiple timesin the sequence if the user tweets about h more than once.Similarly we build the tweet time series 〈th1 , th2 , . . . , th|T (h)|〉where thi marks the timestamp (in second) of the i-th tweetcontaining h. The set of tweets within time τ is labeledT τ (h) where τ is a time duration measured starting fromthe first tweet.Definition 4. Community: A community c ∈ C is a sub-set of nodes (users) in the network. T (h|c) and A(h|c) aretweets and adopters of a meme h in community c, respec-tively. We define Tn(h|c) and An(h|c), that consider onlyearly tweets, in a similar fashion. C(h) denotes the infectedcommunities of h, which generate at least one tweet contain-ing h; C(h) = {c | c ∈ C, |T (h|c)| ≥ 1}. Similarly, the in-fected communities with early tweets are Cn(h) = {c | c ∈C(h), |Tn(h|c)| ≥ 1}.Definition 5. Interactions: I(h) is the number of user in-teractions regarding h. Two types of user interactions areconsidered: retweets (RT), by which a user retweets a mes-sage containing h from another user; and mentions (@),by which a user mentions another in a tweet containing h.We consider interactions within communities, I�(h), andbetween communities, Iy(h), respectively, where I(h) =I�(h) + Iy(h).
A
BC
D
E
F
GA
BC
D
E
F
G
(a) Small surface (b) Large surface
(c) Short-range diffusion (d) Long-range diffusion
JI
JI
K
L
K
L
H H
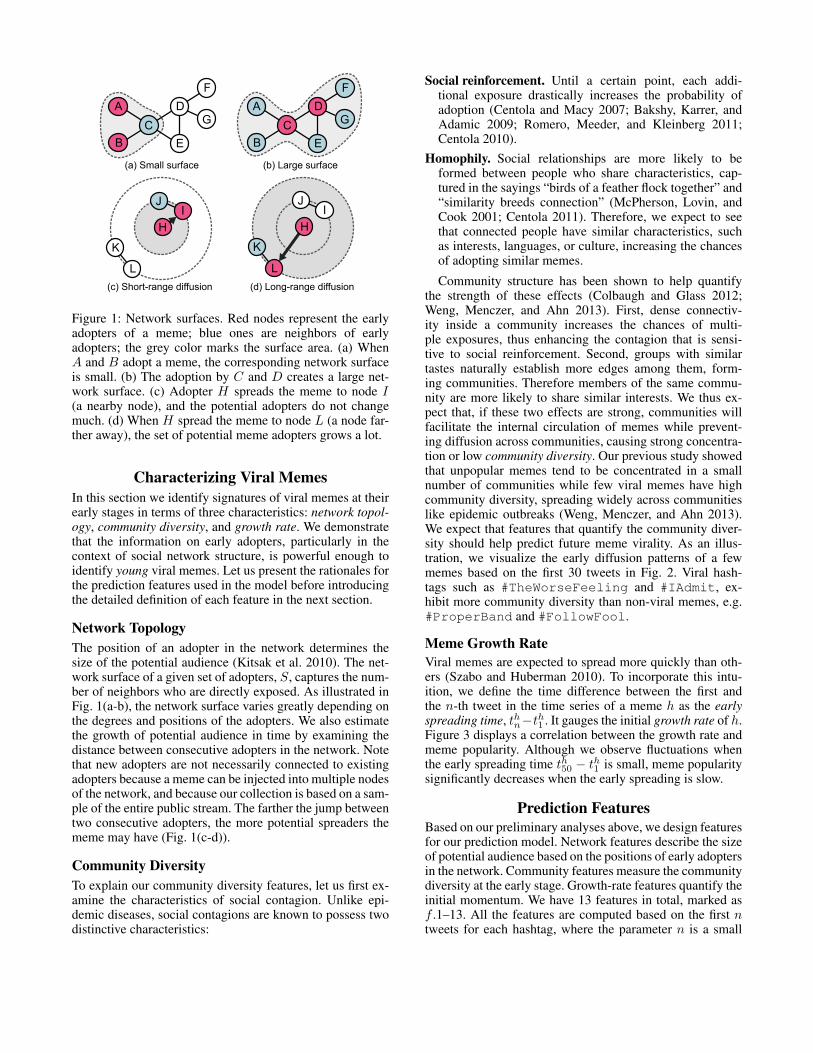
Figure 1: Network surfaces. Red nodes represent the earlyadopters of a meme; blue ones are neighbors of earlyadopters; the grey color marks the surface area. (a) WhenA and B adopt a meme, the corresponding network surfaceis small. (b) The adoption by C and D creates a large net-work surface. (c) Adopter H spreads the meme to node I(a nearby node), and the potential adopters do not changemuch. (d) When H spread the meme to node L (a node far-ther away), the set of potential meme adopters grows a lot.
Characterizing Viral MemesIn this section we identify signatures of viral memes at theirearly stages in terms of three characteristics: network topol-ogy, community diversity, and growth rate. We demonstratethat the information on early adopters, particularly in thecontext of social network structure, is powerful enough toidentify young viral memes. Let us present the rationales forthe prediction features used in the model before introducingthe detailed definition of each feature in the next section.
Network TopologyThe position of an adopter in the network determines thesize of the potential audience (Kitsak et al. 2010). The net-work surface of a given set of adopters, S, captures the num-ber of neighbors who are directly exposed. As illustrated inFig. 1(a-b), the network surface varies greatly depending onthe degrees and positions of the adopters. We also estimatethe growth of potential audience in time by examining thedistance between consecutive adopters in the network. Notethat new adopters are not necessarily connected to existingadopters because a meme can be injected into multiple nodesof the network, and because our collection is based on a sam-ple of the entire public stream. The farther the jump betweentwo consecutive adopters, the more potential spreaders thememe may have (Fig. 1(c-d)).
Community DiversityTo explain our community diversity features, let us first ex-amine the characteristics of social contagion. Unlike epi-demic diseases, social contagions are known to possess twodistinctive characteristics:
Social reinforcement. Until a certain point, each addi-tional exposure drastically increases the probability ofadoption (Centola and Macy 2007; Bakshy, Karrer, andAdamic 2009; Romero, Meeder, and Kleinberg 2011;Centola 2010).
Homophily. Social relationships are more likely to beformed between people who share characteristics, cap-tured in the sayings “birds of a feather flock together” and“similarity breeds connection” (McPherson, Lovin, andCook 2001; Centola 2011). Therefore, we expect to seethat connected people have similar characteristics, suchas interests, languages, or culture, increasing the chancesof adopting similar memes.
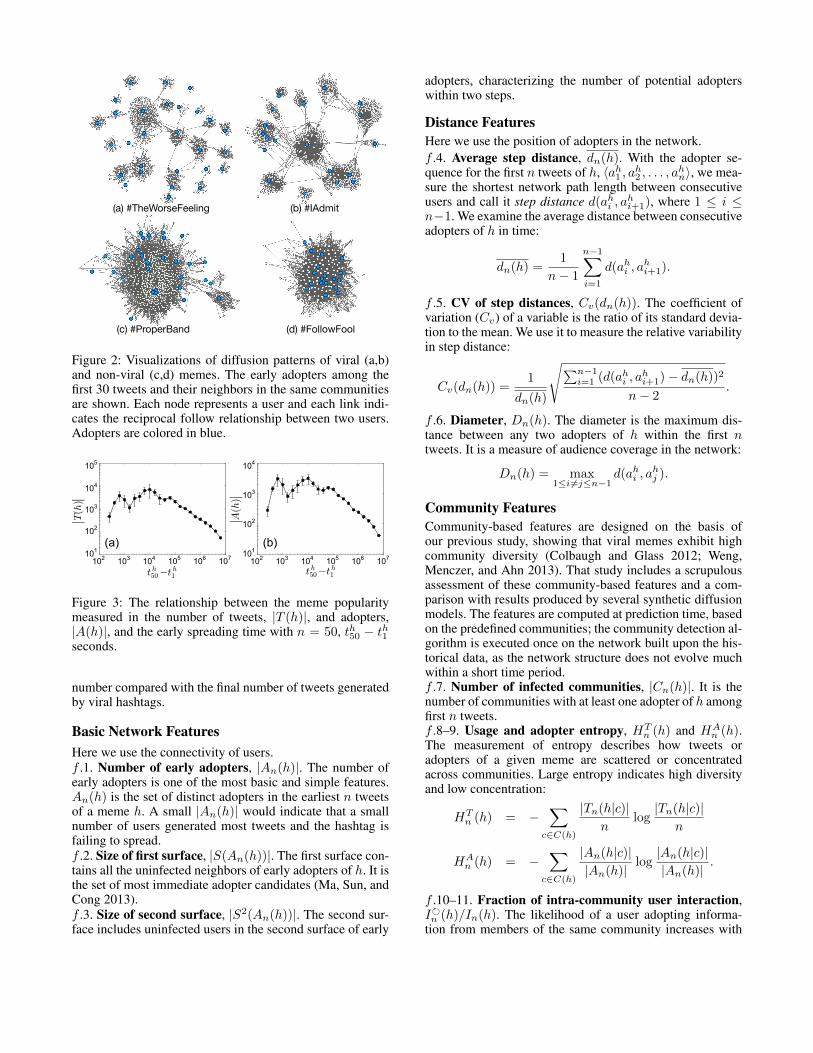
Community structure has been shown to help quantifythe strength of these effects (Colbaugh and Glass 2012;Weng, Menczer, and Ahn 2013). First, dense connectiv-ity inside a community increases the chances of multi-ple exposures, thus enhancing the contagion that is sensi-tive to social reinforcement. Second, groups with similartastes naturally establish more edges among them, form-ing communities. Therefore members of the same commu-nity are more likely to share similar interests. We thus ex-pect that, if these two effects are strong, communities willfacilitate the internal circulation of memes while prevent-ing diffusion across communities, causing strong concentra-tion or low community diversity. Our previous study showedthat unpopular memes tend to be concentrated in a smallnumber of communities while few viral memes have highcommunity diversity, spreading widely across communitieslike epidemic outbreaks (Weng, Menczer, and Ahn 2013).We expect that features that quantify the community diver-sity should help predict future meme virality. As an illus-tration, we visualize the early diffusion patterns of a fewmemes based on the first 30 tweets in Fig. 2. Viral hash-tags such as #TheWorseFeeling and #IAdmit, ex-hibit more community diversity than non-viral memes, e.g.#ProperBand and #FollowFool.
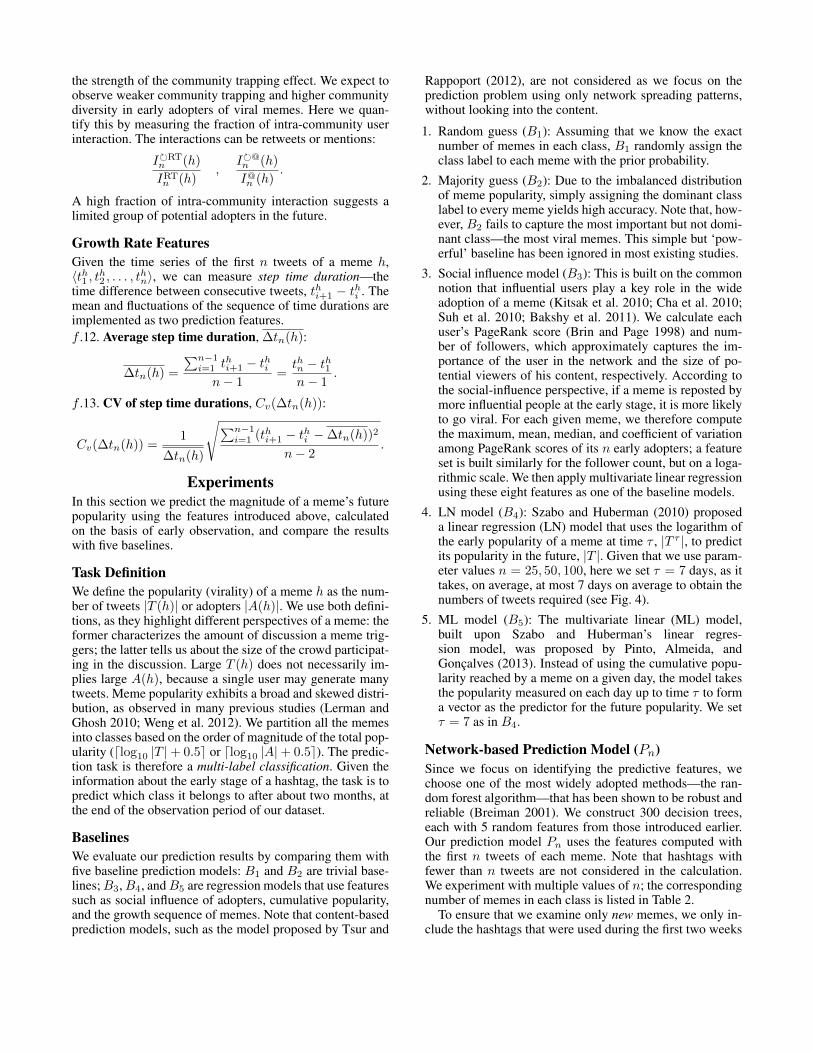
Meme Growth RateViral memes are expected to spread more quickly than oth-ers (Szabo and Huberman 2010). To incorporate this intu-ition, we define the time difference between the first andthe n-th tweet in the time series of a meme h as the earlyspreading time, thn−th1 . It gauges the initial growth rate of h.Figure 3 displays a correlation between the growth rate andmeme popularity. Although we observe fluctuations whenthe early spreading time th50 − th1 is small, meme popularitysignificantly decreases when the early spreading is slow.
Prediction FeaturesBased on our preliminary analyses above, we design featuresfor our prediction model. Network features describe the sizeof potential audience based on the positions of early adoptersin the network. Community features measure the communitydiversity at the early stage. Growth-rate features quantify theinitial momentum. We have 13 features in total, marked asf .1–13. All the features are computed based on the first ntweets for each hashtag, where the parameter n is a small
(c) #ProperBand
(a) #TheWorseFeeling (b) #IAdmit
(d) #FollowFool
Figure 2: Visualizations of diffusion patterns of viral (a,b)and non-viral (c,d) memes. The early adopters among thefirst 30 tweets and their neighbors in the same communitiesare shown. Each node represents a user and each link indi-cates the reciprocal follow relationship between two users.Adopters are colored in blue.
(a) (b)
Figure 3: The relationship between the meme popularitymeasured in the number of tweets, |T (h)|, and adopters,|A(h)|, and the early spreading time with n = 50, th50 − th1seconds.
number compared with the final number of tweets generatedby viral hashtags.
Basic Network FeaturesHere we use the connectivity of users.f .1. Number of early adopters, |An(h)|. The number ofearly adopters is one of the most basic and simple features.An(h) is the set of distinct adopters in the earliest n tweetsof a meme h. A small |An(h)| would indicate that a smallnumber of users generated most tweets and the hashtag isfailing to spread.f .2. Size of first surface, |S(An(h))|. The first surface con-tains all the uninfected neighbors of early adopters of h. It isthe set of most immediate adopter candidates (Ma, Sun, andCong 2013).f .3. Size of second surface, |S2(An(h))|. The second sur-face includes uninfected users in the second surface of early
adopters, characterizing the number of potential adopterswithin two steps.
Distance FeaturesHere we use the position of adopters in the network.f .4. Average step distance, dn(h). With the adopter se-quence for the first n tweets of h, 〈ah1 , ah2 , . . . , ahn〉, we mea-sure the shortest network path length between consecutiveusers and call it step distance d(ahi , a
hi+1), where 1 ≤ i ≤
n−1. We examine the average distance between consecutiveadopters of h in time:
dn(h) =1
n− 1
n−1∑i=1
d(ahi , ahi+1).
f .5. CV of step distances, Cv(dn(h)). The coefficient ofvariation (Cv) of a variable is the ratio of its standard devia-tion to the mean. We use it to measure the relative variabilityin step distance:
Cv(dn(h)) =1
dn(h)
√∑n−1i=1 (d(ahi , a
hi+1)− dn(h))2
n− 2.
f .6. Diameter, Dn(h). The diameter is the maximum dis-tance between any two adopters of h within the first ntweets. It is a measure of audience coverage in the network:
Dn(h) = max1≤i 6=j≤n−1
d(ahi , ahj ).
Community FeaturesCommunity-based features are designed on the basis ofour previous study, showing that viral memes exhibit highcommunity diversity (Colbaugh and Glass 2012; Weng,Menczer, and Ahn 2013). That study includes a scrupulousassessment of these community-based features and a com-parison with results produced by several synthetic diffusionmodels. The features are computed at prediction time, basedon the predefined communities; the community detection al-gorithm is executed once on the network built upon the his-torical data, as the network structure does not evolve muchwithin a short time period.f .7. Number of infected communities, |Cn(h)|. It is thenumber of communities with at least one adopter of h amongfirst n tweets.f .8–9. Usage and adopter entropy, HT
n (h) and HAn (h).
The measurement of entropy describes how tweets oradopters of a given meme are scattered or concentratedacross communities. Large entropy indicates high diversityand low concentration:
HTn (h) = −
∑c∈C(h)
|Tn(h|c)|n
log|Tn(h|c)|
n
HAn (h) = −
∑c∈C(h)
|An(h|c)||An(h)|
log|An(h|c)||An(h)|
.
f .10–11. Fraction of intra-community user interaction,I�n (h)/In(h). The likelihood of a user adopting informa-tion from members of the same community increases with
the strength of the community trapping effect. We expect toobserve weaker community trapping and higher communitydiversity in early adopters of viral memes. Here we quan-tify this by measuring the fraction of intra-community userinteraction. The interactions can be retweets or mentions:
I�RTn (h)
IRTn (h),
I�@n (h)
I@n (h).
A high fraction of intra-community interaction suggests alimited group of potential adopters in the future.
Growth Rate FeaturesGiven the time series of the first n tweets of a meme h,〈th1 , th2 , . . . , thn〉, we can measure step time duration—thetime difference between consecutive tweets, thi+1 − thi . Themean and fluctuations of the sequence of time durations areimplemented as two prediction features.f .12. Average step time duration, ∆tn(h):
∆tn(h) =
∑n−1i=1 t
hi+1 − thi
n− 1=thn − th1n− 1
.
f .13. CV of step time durations, Cv(∆tn(h)):
Cv(∆tn(h)) =1
∆tn(h)
√∑n−1i=1 (thi+1 − thi −∆tn(h))2
n− 2.
ExperimentsIn this section we predict the magnitude of a meme’s futurepopularity using the features introduced above, calculatedon the basis of early observation, and compare the resultswith five baselines.
Task DefinitionWe define the popularity (virality) of a meme h as the num-ber of tweets |T (h)| or adopters |A(h)|. We use both defini-tions, as they highlight different perspectives of a meme: theformer characterizes the amount of discussion a meme trig-gers; the latter tells us about the size of the crowd participat-ing in the discussion. Large T (h) does not necessarily im-plies large A(h), because a single user may generate manytweets. Meme popularity exhibits a broad and skewed distri-bution, as observed in many previous studies (Lerman andGhosh 2010; Weng et al. 2012). We partition all the memesinto classes based on the order of magnitude of the total pop-ularity (dlog10 |T |+ 0.5e or dlog10 |A|+ 0.5e). The predic-tion task is therefore a multi-label classification. Given theinformation about the early stage of a hashtag, the task is topredict which class it belongs to after about two months, atthe end of the observation period of our dataset.
BaselinesWe evaluate our prediction results by comparing them withfive baseline prediction models: B1 and B2 are trivial base-lines;B3,B4, andB5 are regression models that use featuressuch as social influence of adopters, cumulative popularity,and the growth sequence of memes. Note that content-basedprediction models, such as the model proposed by Tsur and
Rappoport (2012), are not considered as we focus on theprediction problem using only network spreading patterns,without looking into the content.
1. Random guess (B1): Assuming that we know the exactnumber of memes in each class, B1 randomly assign theclass label to each meme with the prior probability.
2. Majority guess (B2): Due to the imbalanced distributionof meme popularity, simply assigning the dominant classlabel to every meme yields high accuracy. Note that, how-ever, B2 fails to capture the most important but not domi-nant class—the most viral memes. This simple but ‘pow-erful’ baseline has been ignored in most existing studies.
3. Social influence model (B3): This is built on the commonnotion that influential users play a key role in the wideadoption of a meme (Kitsak et al. 2010; Cha et al. 2010;Suh et al. 2010; Bakshy et al. 2011). We calculate eachuser’s PageRank score (Brin and Page 1998) and num-ber of followers, which approximately captures the im-portance of the user in the network and the size of po-tential viewers of his content, respectively. According tothe social-influence perspective, if a meme is reposted bymore influential people at the early stage, it is more likelyto go viral. For each given meme, we therefore computethe maximum, mean, median, and coefficient of variationamong PageRank scores of its n early adopters; a featureset is built similarly for the follower count, but on a loga-rithmic scale. We then apply multivariate linear regressionusing these eight features as one of the baseline models.
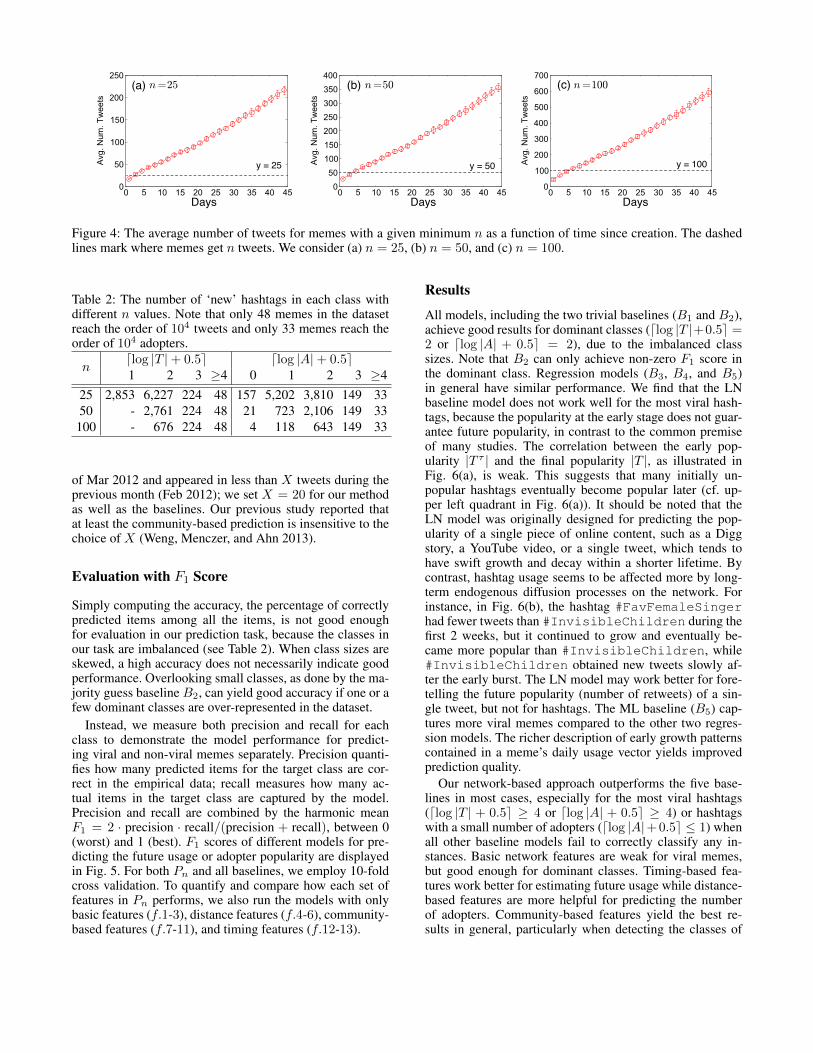
4. LN model (B4): Szabo and Huberman (2010) proposeda linear regression (LN) model that uses the logarithm ofthe early popularity of a meme at time τ , |T τ |, to predictits popularity in the future, |T |. Given that we use param-eter values n = 25, 50, 100, here we set τ = 7 days, as ittakes, on average, at most 7 days on average to obtain thenumbers of tweets required (see Fig. 4).
5. ML model (B5): The multivariate linear (ML) model,built upon Szabo and Huberman’s linear regres-sion model, was proposed by Pinto, Almeida, andGoncalves (2013). Instead of using the cumulative popu-larity reached by a meme on a given day, the model takesthe popularity measured on each day up to time τ to forma vector as the predictor for the future popularity. We setτ = 7 as in B4.
Network-based Prediction Model (Pn)Since we focus on identifying the predictive features, wechoose one of the most widely adopted methods—the ran-dom forest algorithm—that has been shown to be robust andreliable (Breiman 2001). We construct 300 decision trees,each with 5 random features from those introduced earlier.Our prediction model Pn uses the features computed withthe first n tweets of each meme. Note that hashtags withfewer than n tweets are not considered in the calculation.We experiment with multiple values of n; the correspondingnumber of memes in each class is listed in Table 2.
To ensure that we examine only new memes, we only in-clude the hashtags that were used during the first two weeks
(a) (b) (c)
y = 25 y = 50 y = 100
Days Days Days
Figure 4: The average number of tweets for memes with a given minimum n as a function of time since creation. The dashedlines mark where memes get n tweets. We consider (a) n = 25, (b) n = 50, and (c) n = 100.
Table 2: The number of ‘new’ hashtags in each class withdifferent n values. Note that only 48 memes in the datasetreach the order of 104 tweets and only 33 memes reach theorder of 104 adopters.
ndlog |T |+ 0.5e dlog |A|+ 0.5e1 2 3 ≥4 0 1 2 3 ≥4
25 2,853 6,227 224 48 157 5,202 3,810 149 3350 - 2,761 224 48 21 723 2,106 149 33100 - 676 224 48 4 118 643 149 33
of Mar 2012 and appeared in less than X tweets during theprevious month (Feb 2012); we set X = 20 for our methodas well as the baselines. Our previous study reported thatat least the community-based prediction is insensitive to thechoice of X (Weng, Menczer, and Ahn 2013).
Evaluation with F1 Score
Simply computing the accuracy, the percentage of correctlypredicted items among all the items, is not good enoughfor evaluation in our prediction task, because the classes inour task are imbalanced (see Table 2). When class sizes areskewed, a high accuracy does not necessarily indicate goodperformance. Overlooking small classes, as done by the ma-jority guess baseline B2, can yield good accuracy if one or afew dominant classes are over-represented in the dataset.
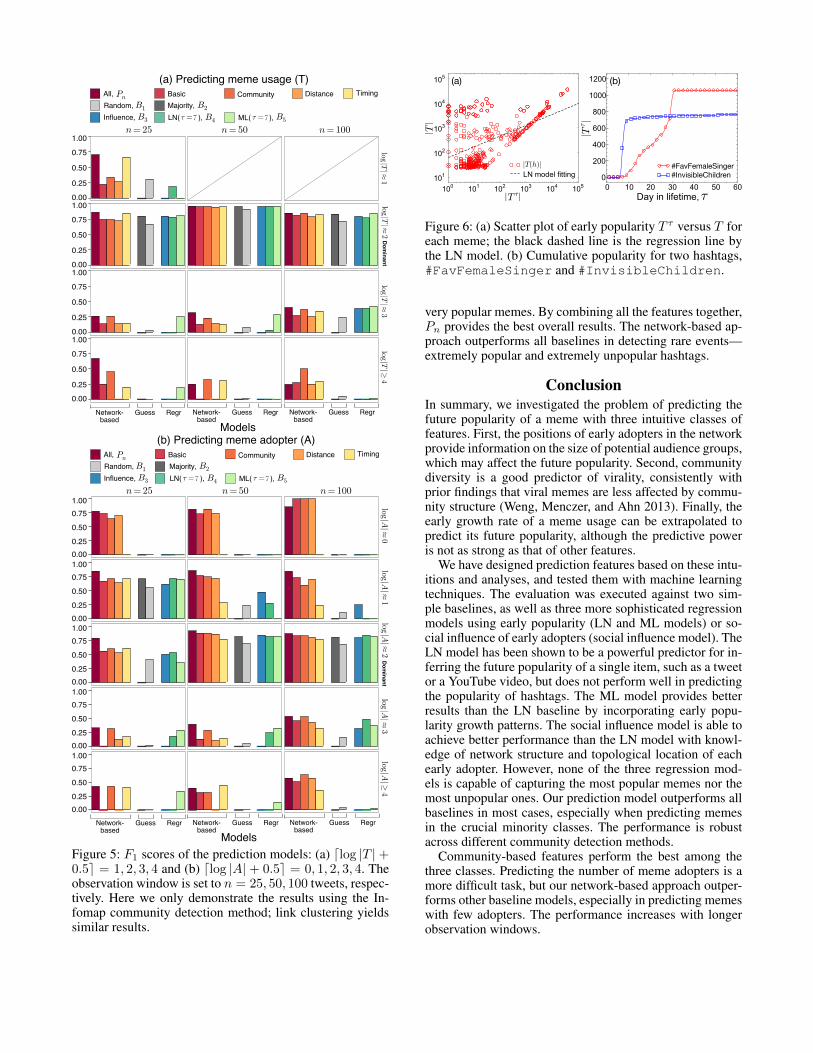
Instead, we measure both precision and recall for eachclass to demonstrate the model performance for predict-ing viral and non-viral memes separately. Precision quanti-fies how many predicted items for the target class are cor-rect in the empirical data; recall measures how many ac-tual items in the target class are captured by the model.Precision and recall are combined by the harmonic meanF1 = 2 · precision · recall/(precision + recall), between 0(worst) and 1 (best). F1 scores of different models for pre-dicting the future usage or adopter popularity are displayedin Fig. 5. For both Pn and all baselines, we employ 10-foldcross validation. To quantify and compare how each set offeatures in Pn performs, we also run the models with onlybasic features (f.1-3), distance features (f.4-6), community-based features (f.7-11), and timing features (f.12-13).
Results
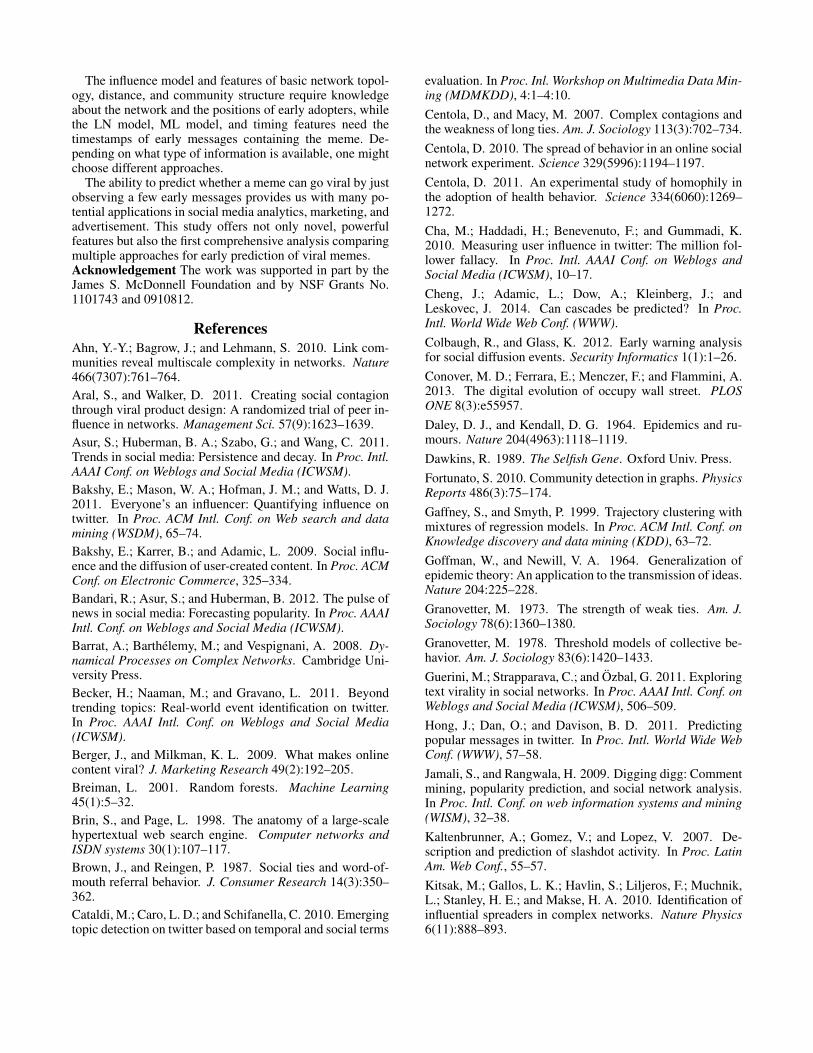
All models, including the two trivial baselines (B1 and B2),achieve good results for dominant classes (dlog |T |+0.5e =2 or dlog |A| + 0.5e = 2), due to the imbalanced classsizes. Note that B2 can only achieve non-zero F1 score inthe dominant class. Regression models (B3, B4, and B5)in general have similar performance. We find that the LNbaseline model does not work well for the most viral hash-tags, because the popularity at the early stage does not guar-antee future popularity, in contrast to the common premiseof many studies. The correlation between the early pop-ularity |T τ | and the final popularity |T |, as illustrated inFig. 6(a), is weak. This suggests that many initially un-popular hashtags eventually become popular later (cf. up-per left quadrant in Fig. 6(a)). It should be noted that theLN model was originally designed for predicting the pop-ularity of a single piece of online content, such as a Diggstory, a YouTube video, or a single tweet, which tends tohave swift growth and decay within a shorter lifetime. Bycontrast, hashtag usage seems to be affected more by long-term endogenous diffusion processes on the network. Forinstance, in Fig. 6(b), the hashtag #FavFemaleSingerhad fewer tweets than #InvisibleChildren during thefirst 2 weeks, but it continued to grow and eventually be-came more popular than #InvisibleChildren, while#InvisibleChildren obtained new tweets slowly af-ter the early burst. The LN model may work better for fore-telling the future popularity (number of retweets) of a sin-gle tweet, but not for hashtags. The ML baseline (B5) cap-tures more viral memes compared to the other two regres-sion models. The richer description of early growth patternscontained in a meme’s daily usage vector yields improvedprediction quality.
Our network-based approach outperforms the five base-lines in most cases, especially for the most viral hashtags(dlog |T | + 0.5e ≥ 4 or dlog |A| + 0.5e ≥ 4) or hashtagswith a small number of adopters (dlog |A|+ 0.5e ≤ 1) whenall other baseline models fail to correctly classify any in-stances. Basic network features are weak for viral memes,but good enough for dominant classes. Timing-based fea-tures work better for estimating future usage while distance-based features are more helpful for predicting the numberof adopters. Community-based features yield the best re-sults in general, particularly when detecting the classes of
0.00
0.25
0.50
0.75
1.00
0.00
0.25
0.50
0.75
1.00
0.00
0.25
0.50
0.75
1.00
0.25
0.50
0.75
1.00
(a) Predicting meme usage (T)Basic Community Distance Timing
Random, Majority,Influence,
All,
LN( ), ML( ),77
0.00
Dom
inantModels
Network-based
Guess Regr Network-based
Guess Regr Network-based
Guess Regr
0.000.25
0.50
0.751.00
0.000.25
0.50
0.751.00
0.000.25
0.50
0.751.00
0.000.25
0.50
0.751.00
0.000.25
0.50
0.751.00
Basic Community Distance TimingRandom, Majority,Influence,
All,
LN( ), ML( ),77
(b) Predicting meme adopter (A)D
ominant
ModelsNetwork-
basedGuess Regr Network-
basedGuess Regr Network-
basedGuess Regr
Figure 5: F1 scores of the prediction models: (a) dlog |T |+0.5e = 1, 2, 3, 4 and (b) dlog |A| + 0.5e = 0, 1, 2, 3, 4. Theobservation window is set to n = 25, 50, 100 tweets, respec-tively. Here we only demonstrate the results using the In-fomap community detection method; link clustering yieldssimilar results.
(a)
#FavFemaleSinger#InvisibleChildren
(b)
Figure 6: (a) Scatter plot of early popularity T τ versus T foreach meme; the black dashed line is the regression line bythe LN model. (b) Cumulative popularity for two hashtags,#FavFemaleSinger and #InvisibleChildren.
very popular memes. By combining all the features together,Pn provides the best overall results. The network-based ap-proach outperforms all baselines in detecting rare events—extremely popular and extremely unpopular hashtags.
ConclusionIn summary, we investigated the problem of predicting thefuture popularity of a meme with three intuitive classes offeatures. First, the positions of early adopters in the networkprovide information on the size of potential audience groups,which may affect the future popularity. Second, communitydiversity is a good predictor of virality, consistently withprior findings that viral memes are less affected by commu-nity structure (Weng, Menczer, and Ahn 2013). Finally, theearly growth rate of a meme usage can be extrapolated topredict its future popularity, although the predictive poweris not as strong as that of other features.
We have designed prediction features based on these intu-itions and analyses, and tested them with machine learningtechniques. The evaluation was executed against two sim-ple baselines, as well as three more sophisticated regressionmodels using early popularity (LN and ML models) or so-cial influence of early adopters (social influence model). TheLN model has been shown to be a powerful predictor for in-ferring the future popularity of a single item, such as a tweetor a YouTube video, but does not perform well in predictingthe popularity of hashtags. The ML model provides betterresults than the LN baseline by incorporating early popu-larity growth patterns. The social influence model is able toachieve better performance than the LN model with knowl-edge of network structure and topological location of eachearly adopter. However, none of the three regression mod-els is capable of capturing the most popular memes nor themost unpopular ones. Our prediction model outperforms allbaselines in most cases, especially when predicting memesin the crucial minority classes. The performance is robustacross different community detection methods.
Community-based features perform the best among thethree classes. Predicting the number of meme adopters is amore difficult task, but our network-based approach outper-forms other baseline models, especially in predicting memeswith few adopters. The performance increases with longerobservation windows.
The influence model and features of basic network topol-ogy, distance, and community structure require knowledgeabout the network and the positions of early adopters, whilethe LN model, ML model, and timing features need thetimestamps of early messages containing the meme. De-pending on what type of information is available, one mightchoose different approaches.
The ability to predict whether a meme can go viral by justobserving a few early messages provides us with many po-tential applications in social media analytics, marketing, andadvertisement. This study offers not only novel, powerfulfeatures but also the first comprehensive analysis comparingmultiple approaches for early prediction of viral memes.Acknowledgement The work was supported in part by theJames S. McDonnell Foundation and by NSF Grants No.1101743 and 0910812.
ReferencesAhn, Y.-Y.; Bagrow, J.; and Lehmann, S. 2010. Link com-munities reveal multiscale complexity in networks. Nature466(7307):761–764.Aral, S., and Walker, D. 2011. Creating social contagionthrough viral product design: A randomized trial of peer in-fluence in networks. Management Sci. 57(9):1623–1639.Asur, S.; Huberman, B. A.; Szabo, G.; and Wang, C. 2011.Trends in social media: Persistence and decay. In Proc. Intl.AAAI Conf. on Weblogs and Social Media (ICWSM).Bakshy, E.; Mason, W. A.; Hofman, J. M.; and Watts, D. J.2011. Everyone’s an influencer: Quantifying influence ontwitter. In Proc. ACM Intl. Conf. on Web search and datamining (WSDM), 65–74.Bakshy, E.; Karrer, B.; and Adamic, L. 2009. Social influ-ence and the diffusion of user-created content. In Proc. ACMConf. on Electronic Commerce, 325–334.Bandari, R.; Asur, S.; and Huberman, B. 2012. The pulse ofnews in social media: Forecasting popularity. In Proc. AAAIIntl. Conf. on Weblogs and Social Media (ICWSM).Barrat, A.; Barthelemy, M.; and Vespignani, A. 2008. Dy-namical Processes on Complex Networks. Cambridge Uni-versity Press.Becker, H.; Naaman, M.; and Gravano, L. 2011. Beyondtrending topics: Real-world event identification on twitter.In Proc. AAAI Intl. Conf. on Weblogs and Social Media(ICWSM).Berger, J., and Milkman, K. L. 2009. What makes onlinecontent viral? J. Marketing Research 49(2):192–205.Breiman, L. 2001. Random forests. Machine Learning45(1):5–32.Brin, S., and Page, L. 1998. The anatomy of a large-scalehypertextual web search engine. Computer networks andISDN systems 30(1):107–117.Brown, J., and Reingen, P. 1987. Social ties and word-of-mouth referral behavior. J. Consumer Research 14(3):350–362.Cataldi, M.; Caro, L. D.; and Schifanella, C. 2010. Emergingtopic detection on twitter based on temporal and social terms
evaluation. In Proc. Inl. Workshop on Multimedia Data Min-ing (MDMKDD), 4:1–4:10.Centola, D., and Macy, M. 2007. Complex contagions andthe weakness of long ties. Am. J. Sociology 113(3):702–734.Centola, D. 2010. The spread of behavior in an online socialnetwork experiment. Science 329(5996):1194–1197.Centola, D. 2011. An experimental study of homophily inthe adoption of health behavior. Science 334(6060):1269–1272.Cha, M.; Haddadi, H.; Benevenuto, F.; and Gummadi, K.2010. Measuring user influence in twitter: The million fol-lower fallacy. In Proc. Intl. AAAI Conf. on Weblogs andSocial Media (ICWSM), 10–17.Cheng, J.; Adamic, L.; Dow, A.; Kleinberg, J.; andLeskovec, J. 2014. Can cascades be predicted? In Proc.Intl. World Wide Web Conf. (WWW).Colbaugh, R., and Glass, K. 2012. Early warning analysisfor social diffusion events. Security Informatics 1(1):1–26.Conover, M. D.; Ferrara, E.; Menczer, F.; and Flammini, A.2013. The digital evolution of occupy wall street. PLOSONE 8(3):e55957.Daley, D. J., and Kendall, D. G. 1964. Epidemics and ru-mours. Nature 204(4963):1118–1119.Dawkins, R. 1989. The Selfish Gene. Oxford Univ. Press.Fortunato, S. 2010. Community detection in graphs. PhysicsReports 486(3):75–174.Gaffney, S., and Smyth, P. 1999. Trajectory clustering withmixtures of regression models. In Proc. ACM Intl. Conf. onKnowledge discovery and data mining (KDD), 63–72.Goffman, W., and Newill, V. A. 1964. Generalization ofepidemic theory: An application to the transmission of ideas.Nature 204:225–228.Granovetter, M. 1973. The strength of weak ties. Am. J.Sociology 78(6):1360–1380.Granovetter, M. 1978. Threshold models of collective be-havior. Am. J. Sociology 83(6):1420–1433.Guerini, M.; Strapparava, C.; and Ozbal, G. 2011. Exploringtext virality in social networks. In Proc. AAAI Intl. Conf. onWeblogs and Social Media (ICWSM), 506–509.Hong, J.; Dan, O.; and Davison, B. D. 2011. Predictingpopular messages in twitter. In Proc. Intl. World Wide WebConf. (WWW), 57–58.Jamali, S., and Rangwala, H. 2009. Digging digg: Commentmining, popularity prediction, and social network analysis.In Proc. Intl. Conf. on web information systems and mining(WISM), 32–38.Kaltenbrunner, A.; Gomez, V.; and Lopez, V. 2007. De-scription and prediction of slashdot activity. In Proc. LatinAm. Web Conf., 55–57.Kitsak, M.; Gallos, L. K.; Havlin, S.; Liljeros, F.; Muchnik,L.; Stanley, H. E.; and Makse, H. A. 2010. Identification ofinfluential spreaders in complex networks. Nature Physics6(11):888–893.
Lazer, D.; Pentland, A.; Adamic, L.; Aral, S.; Barabasi, A.-L.; Brewer, D.; Christakis, N.; Contractor, N.; Fowler, J.;Gutmann, M.; Jebara, T.; King, G.; Macy, M.; Roy, D.; andVan Alstyne, M. 2009. Computational social science. Sci-ence 323(5915):721–723.Lee, J.-G.; Han, J.; and Whang, K.-Y. 2007. Trajectoryclustering: a partition-and-group framework. In Proc. ACMIntl. Conf. on Management of data (SIGMOD), 593–604.Lehmann, J.; Goncalves, B.; Ramasco, J. J.; and Cattuto, C.2012. Dynamical classes of collective attention in twitter. InProc. Intl. World Wide Web Conf. (WWW), 251–260.Lenser, S., and Veloso, M. 2005. Non-parametric time seriesclassification. In Proc. IEEE Intl. Conf. on Robotics andAutomation (ICRA), 3918–3923.Lerman, K., and Ghosh, R. 2010. Information contagion:an empirical study of the spread of news on digg and twittersocial networks. In Proc. Intl. AAAI Conf. on Weblogs andSocial Media (ICWSM), 90–97.Lerman, K., and Hogg, T. 2010. Using a model of socialdynamics to predict popularity of news. In Proc. Intl. WorldWide Web Conf. (WWW), 621–630.Leskovec, J.; Adamic, L.; and Huberman, B. 2007. Thedynamics of viral marketing. ACM Trans. Web 1(1).Lindzey, G., and Aronson, E., eds. 1985. Handbook of So-cial Psychology: Group Psychology and the Phenomena ofInteraction. Lawrence Erlbaum Ass.Ma, Z.; Sun, A.; and Cong, G. 2013. On predicting thepopularity of newly emerging hashtags in twitter. J. Am. Soc.for Information Science and Technology 64(7):1399–1410.Mason, W.; Jones, A.; and Goldstone, R. 2008. Propaga-tion of innovations in networked groups. J. ExperimentalPsychology: General 137(3):422.McNames, J. 1998. A nearest trajectory strategy for time se-ries prediction. In Proc. Intl. Workshop on Advanced Black-Box Technique for Nonlinear Modeling, 112–128.McPherson, M.; Lovin, L.; and Cook, J. 2001. Birds of afeather: Homophily in social networks. Annu. Rev. Sociol-ogy 27(1):415–444.Muchnik, L.; Aral, S.; and Taylor, S. J. 2013. So-cial influence bias: A randomized experiment. Science341(6146):647–651.Newman, M. E. J. 2006. Modularity and community struc-ture in networks. Proc. Natl. Acad. Sci. 103(23):8577–8582.Onnela, J.; Saramaki, J.; Hyvonen, J.; Szabo, G.; Lazer, D.;Kaski, K.; Kertesz, J.; and Barabasi, A. 2007. Structure andtie strengths in mobile communication networks. Proc. Nat.Acad. Sci. 104(18):7332–7336.Pastor-Satorras, R., and Vespignani, A. 2001. Epidemicspreading in scale-free networks. Phys. Rev. Lett. 86:3200–3203.Pinto, H.; Almeida, J. M.; and Goncalves, M. A. 2013. Us-ing early view patterns to predict the popularity of youtubevideos. In Proc. ACM Intl. Conf. on Web search and datamining (WSDM), 365–374.
Romero, D. M.; Galuba, W.; Asur, S.; and Huberman, B. A.2011. Influence and passivity in social media. In Proc. Intl.World Wide Web Conf. (Companion Volume), 113–114.Romero, D. M.; Meeder, B.; and Kleinberg, J. 2011. Differ-ences in the mechanics of information diffusion across top-ics: Idioms, political hashtags, and complex contagion ontwitter. In Proc. Intl. World Wide Web Conf. (WWW).Romero, D. M.; Tan, C.; and Ugander, J. 2013. On theinterplay between social and topical structure. In Proc. Intl.AAAI Conf. on Weblogs and Social Media (ICWSM).Rosvall, M., and Bergstrom, C. T. 2008. Maps of ran-dom walks on complex networks reveal community struc-ture. Proc. Natl. Acad. Sci. 105(4):1118–1123.Salganik, M.; Dodds, P.; and Watts, D. 2006. Experimentalstudy of inequality and unpredictability in an artificial cul-tural market. Science 311(5762):854–856.Suh, B.; Hong, L.; Pirolli, P.; and Chi, E. H. 2010. Wantto be retweeted? large scale analytics on factors impactingretweet in twitter network. In Proc. IEEE Intl. Conf. on So-cial Computing, 177–184.Szabo, G., and Huberman, B. A. 2010. Predicting the pop-ularity of online content. Commun. ACM 53(8):80–88.Tang, J.; Sun, J.; Wang, C.; and Yang, Z. 2009. Social in-fluence analysis in large-scale networks. In Proc. ACM Intl.Conf. on Knowledge discovery and data mining (KDD).Tsur, O., and Rappoport, A. 2012. What’s in a hashtag?:content based prediction of the spread of ideas in microblog-ging communities. In Proc. ACM Intl. Conf. on Web searchand data mining (WSDM), 643–652.Vespignani, A. 2009. Predicting the behavior of techno-social systems. Science 325(5939):425–428.Watts, D. J. 2002. A simple model of global cascades onrandom networks. Proc. Natl. Acad. Sci. 99(9):5766–5771.Weng, J.; Lim, E.-P.; Jiang, J.; and He, Q. 2010. Twitterrank:finding topic-sensitive influential twitterers. In Proc. ACMIntl. Conf. on Web Search and Data Mining (WSDM).Weng, L.; Flammini, A.; Vespignani, A.; and Menczer, F.2012. Competition among memes in a world with limitedattention. Scientific Reports 2(335).Weng, L.; Ratkiewicz, J.; Perra, N.; Goncalves, B.; Castillo,C.; Bonchi, F.; Schifanella, R.; Menczer, F.; and Flammini,A. 2013. The role of information diffusion in the evolutionof social networks. In Proc. ACM Intl. Conf. on Knowledgediscovery and data mining (KDD), 356–364.Weng, L.; Menczer, F.; and Ahn, Y.-Y. 2013. Virality predic-tion and community structure in social networks. ScientificReports 3(2522).Wu, F., and Huberman, B. A. 2007. Novelty and collectiveattention. Proc. Natl. Acad. Sci. 104(45):17599–17601.Yang, J., and Leskovec, J. 2011. Patterns of temporal vari-ation in online media. In Proc. ACM Intl. Conf. on WebSearch and Data Mining (WSDM), 177–186.Yang, L.; Sun, T.; and Mei, Q. 2012. We Know What @You#Tag: Does the Dual Role Affect Hashtag Adoption? InProc. Intl. World Wide Web Conf. (WWW), 261–270.