Embed Size (px)
Citation preview
doi:10.1006/jcht.2001.0921Available online at http://www.idealibrary.com on
J. Chem. Thermodynamics2002, 34, 303–317
Near critical measurements ofH Em and V E
m for{xCO2 + (1 − x)SF6} and measurements madeover the pressure range 2.5 to 10.0 MPa at thetemperature T = 301.95 K
C. J. Wormald and R. W. HodgettsSchool of Chemistry, University of Bristol, Bristol, BS8 1TS, U.K.
A flow mixing calorimeter, followed by a vibrating tube densimeter, has been used to mea-sure excess molar enthalpiesHE
m and excess molar volumesVEm of {xCO2 + (1 − x)SF6}.
Measurements over a range of mole fractionx have been made at the temperaturesT =
302.15 K andT = 305.65 K at the pressures (3.76, 5.20, 6.20, and 7.38) MPa. The low-est pressure 3.76 MPa is close to the critical pressure of SF6 and the highest pressure7.38 MPa is close to the critical pressure of CO2. Measurements atx = 0.5 have been madeover the pressure range (2.5 to 10.0) MPa at the temperature 301.95 K. Some of the mea-surements are very close to the critical locus of the mixture. The measurements are com-pared with the Patel–Teja equation of state which reproduces the main features of the ex-cess function curves as well as it does for similar measurements on{xCO2 + (1 − x)C2H6}
and {xCO2 + (1 − x)C2H4}. The equation was used to calculate residual enthalpies andresidual volumes for the pure components and for the mixture, and inspection of the waythese combine to give excess enthalpies and volumes assisted the interpretation of the pres-sure scan measurements.c© 2002 Elsevier Science Ltd. All rights reserved.
KEYWORDS: excess enthalpy; excess volume; critical region; flow calorimeter; carbondioxide; sulfur hexafluoride
1. Introduction
A continuous flow apparatus which consists of a mixing calorimeter followed by avibrating tube densimeter was previously described.(1) The apparatus was operated undercomputer control and was capable of making measurements at temperatures over therange 220 K to 360 K at pressures up to 12 MPa. The calorimeter was tested by makingexcess enthalpy measurements on the mixture{xCO2 + (1 − x)C6H5CH3},(1) and thesewere found to be in good agreement with other work.(2) The apparatus has been usedto make extensive measurements ofHE
m andVEm of {xCO2 + (1 − x)C2H6} in the liquid,
two-phase, and critical regions(3–5) and similar measurements on{xCO2 + (1 − x)C2H4}
have recently been reported.(6, 7) For the mixtures (carbon dioxide+ ethane) and (carbondioxide+ ethene) the critical temperatures of the pure fluids are close together. Another
0021–9614/02 c© 2002 Elsevier Science Ltd. All rights reserved.

304 C. J. Wormald and R. W. Hodgetts
fluid with a critical temperature close to that of carbon dioxide is sulfur hexafluoride, butunlike ethane or ethene, the molecule is almost spherical, and because of the fluorine atomsit has stronger repulsive forces than either hydrocarbon. Sulfur hexafluoride is non-toxicand non-flammable, properties which make it a possible solvent, either as a pure fluid, orin admixture with carbon dioxide, for supercritical extraction technology. Excess functionsin the critical region are large. Our aim in making measurements on (carbon dioxide+
sulfur hexafluoride) was to help establish the shape of the thermodynamic surface for themixture, and to make comparisons with the thermodynamicHE
m(p, T, x) andVEm(p, T, x)
surfaces of (carbon dioxide+ ethane or ethene). One set ofHEm and VE
m measurementson {xCO2 + (1 − x)SF6} has already been reported.(8) The new measurements reported inthis paper are closer to the critical locus than the previous set.
2. Experimental
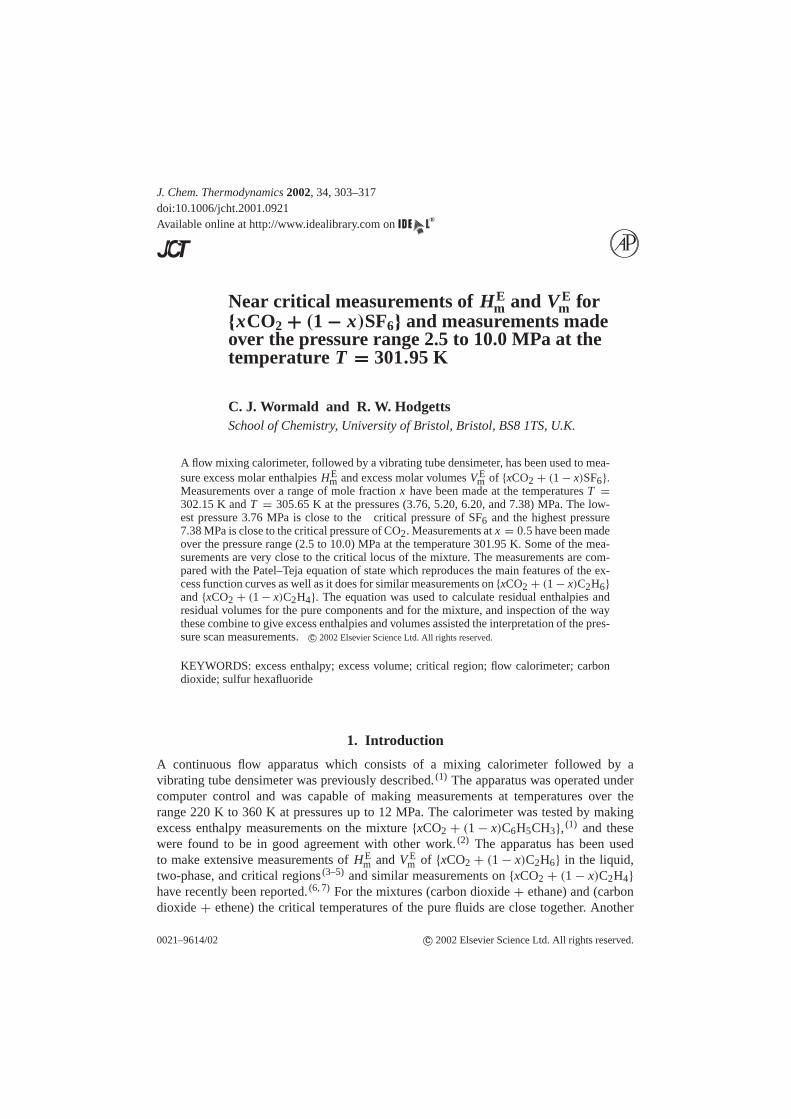
The critical temperature (x, Tc) locus and the critical pressure (x, pc) for {xCO2 + (1 − x)SF6} have been measured by Diefenbacher and Turk(9) These data generate the (pc, Tc)locus for (carbon dioxide+ sulfur hexafluoride) shown in figure1. For carbon dioxidethe critical temperature and pressure areTc = 304.19 K and pc = 7.386 MPa, andfor sulfur hexafluoride the values areTc = 318.74 K and pc = 3.755 MPa. Vapourpressure curves for the pure gases are also shown on the figure. The thermodynamic statesat which the previous(8) measurements were made are indicated by upright crosses. Theywere made over the range of temperature fromT = 250.15 K to T = 319.60 K at thepressures 3.76 MPa and 7.38 MPa, which were as close to the critical pressures of thepure components as we could reach. Measurements were also made atp = 5.20 MPa,which is close to the mean (5.57 MPa) of the two pure component critical pressures. Theaim was to measure the excess quantitiesHE
m(x) andVEm(x) at the pure component critical
pressures and through the critical region of the mixture. The new measurements are at thetemperatures 302.15 K and 305.65 K, and at the pressures (3.76, 5.20, 6.20, and 7.38) MPa,and these thermodynamic states are marked on figure1 as diagonal crosses. The chosentemperatures lie on either side of the critical temperature (304.19 K) of carbon dioxide. Thenew measurements include a pressure scan which covers the range 2.5 MPa to 10.0 MPaat the temperatureT = 301.95 K. At the time the measurements were made, the locationof the critical locus was not known, and we had to choose thermodynamic states which wethought would be on both sides of the locus.
The carbon dioxide used wasx(CO2) = 0.9999 and the sulfur hexafluoride wasx(SF6) = 0.999. The gases were used as supplied. The apparatus was operated undercomputer control, and composition scans were done automatically. The overall precisionof theHE
m(x) measurements is±2 per cent, and of theVEm(x) measurements is±4 per cent.
The uncertainty of theVEm measurements is greater than that of theHE
m measurementsbecause, to obtain an excess volume, it was first necessary to measure the density of eachof the pure components at the same pressure and temperature as the mixture. This entailedmaking three separate runs under identical conditions of temperature and pressure with theconsequent accumulation of errors, whereas the measurement ofHE
m was accomplished inone run. TheHE
m andVEm measurements listed in table1 are plotted as a function of mole
HEm andVE
m for {xCO2 + (1 − x)SF6} 305
240
4
5
6
7
260 280 300 320 340T/K
p/M
Pa
FIGURE 1. The(p, T) projection of the(p, T, x) surface of{xCO2 + (1 − x)SF6}. The figure showsthe critical locus, the vapour pressure curves for the pure components, and thermodynamics statesat which measurements ofHE
m andVEm were made. The upper critical point is that of CO2 and the
lower is that of SF6. +, thermodynamic states of the previous set ofHEm andVE
m measurements;(8)
x, thermodynamic states of the measurements listed in table1.
fractionx in figures2 to 9. The measurements made atx = 0.5 are listed in table2 and areplotted in figures10and11.
3. Discussion
As with the previous measurements,(3–7) comparison is made with the Patel–Teja equationof state:(10)
p = RT/(Vm − b) − a(T)/{Vm(Vm − b) + c(Vm − b)}, (1)
where p is the pressure,Vm is the molar volume,T is the temperature, parametersa, b,andc are substance dependent, and the parametera is a function of the temperature:
a(T) = ac · α(T), (2)
where
α(T) = {1 + F · (1 − T0.5r )}2, (3)
and
F = 0.452413+ 1.30983· ω − 0.295937· ω2. (4)
Here,Tr is the reduced temperature, andω is the acentric factor.The residual enthalpyHR
m was calculated from the equation:
HRm = RT(Z − 1) + {a − T(δa/δT)}[{1/(2N)} · ln{(Z + M)/(Z + Q)}], (5)
where
M = [{0.5 · (b + c)} − N] · (p/RT), (6)

306 C. J. Wormald and R. W. Hodgetts
TABLE 1. Experimental values of the excess molar enthalpyHEm and the excess molar volumeVE
m for{xCO2 + (1 − x)SF6}
T
K
p
MPax
HEm
J · mol−1
VEm
cm3 · mol−1x
HEm
J · mol−1
VEm
cm3 · mol−1x
HEm
J · mol−1
VEm
cm3 · mol−1
302.15 3.76 0.109 −310 −39 0.425 4200 128 0.745 2202 75
0.181 1960 45 0.505 3701 121 0.823 1526 51
0.266 4650 126 0.583 3252 113 0.901 917 30
0.345 4600 126 0.665 2710 97 0.980 193 8
302.15 5.20 0.109 −260 −19 0.426 −660 −88 0.744 1761 22
0.187 −485 −44 0.505 1367 −58 0.823 1324 17
0.266 −610 −102 0.584 2050 −2 0.903 843 10
0.348 −767 −78 0.665 2026 16 0.981 255 1
302.15 6.20 0.109 −200 −17 0.427 −840 −62 0.823 745 −6
0.174 −297 −26 0.586 −1041 −76 0.903 591 −5
0.266 −467 −39 0.635 −796 −71 0.977 190 1
0.345 −684 −49 0.744 −684 −22
302.15 7.38 0.109 385 2.4 0.426 1230 7.8 0.745 1550 13
0.188 619 3.6 0.505 1368 8.9 0.823 1420 13
0.268 884 4.9 0.585 1495 11 0.904 1047 10
0.347 1064 6.1 0.665 1560 12 0.982 243 2
305.65 3.76 0.108 −176 −50 0.424 4397 147 0.743 2333 79
0.185 2087 −14 0.505 3960 134 0.823 1708 57
0.267 4803 144 0.583 3465 121 0.904 961 30
0.356 4695 149 0.663 2927 101 0.982 239
305.65 5.20 0.107 −178 −18 0.425 1501 −20 0.745 1810 29
0.186 −301 −42 0.506 2298 12 0.824 1364 23
0.267 −364 −58 0.585 2384 28 0.903 833 15
0.346 −37 −67 0.663 2168 31 0.982 247 1
305.65 6.20 0.109 −152 −16 0.427 −643 −62 0.744 1092 −6
0.188 −253 −30 0.506 −578 −67 0.825 943 2
0.204 −500 −25 0.586 125 −53 0.903 643 1
0.345 −544 −52 0.665 923 −22 0.982 204
305.65 7.38 0.188 −6 −14 0.505 −293 −32 0.823 −367 −34
0.268 −25 −64 0.585 −422 −36 0.904 −24 −21
0.346 −121 −34 0.665 −468 −38 0.979 103 −9
0.426 −72 −183 0.745 −531 −38 0.982 112 −9

HEm andVE
m for {xCO2 + (1 − x)SF6} 307
0
0
1
2
3
4
5
0.2 0.4 0.6 0.8 1.0x
0 0.2 0.4 0.6 0.8 1.0x
− 50
0
50
100
150
HmE
/(kJ
. mol
−1)
VmE
/(cm
3. m
ol−1
)
FIGURE 2. HEm and VE
m for {xCO2 + (1 − x)SF6} plotted over a range of mole fraction atp =
3.76 MPa andT = 302.65 K:◦, table1. - - - -, calculated from the Patel–Teja equation of state withk12 = 0.05 for HE
m andk12 = 0.15 for VEm; – – –, line drawn across the two-phase region.
0
0
1
2
3
4
5
0.2 0.4 0.6 0.8 1.0x
0 0.2 0.4 0.6 0.8 1.0x
− 50
0
50
100
150
HmE
/(kJ
. mol
−1)
VmE
/(cm
3. m
ol−1
)
FIGURE 3. HEm and VE
m for {xCO2 + (1 − x)SF6} plotted over a range of mole fraction atp =
3.76 MPa andT = 305.65 K. This temperature is 1 K greater than the critical temperature of SF6.◦, table1; - - - -, calculated from the Patel–Teja equation of state withk12 = 0.05 for HE
m andk12 = 0.15 for VE
m; – – –, line drawn across the two-phase region.

308 C. J. Wormald and R. W. Hodgetts
0
−1.0
0
1.0
2.0
0.2 0.4 0.6 0.8 1.0x
0 0.2 0.4 0.6 0.8 1.0x
− 80
− 40
0
40
HmE
/(kJ
. mol
−1)
VmE
/(cm
3. m
ol−1
)
FIGURE 4. HEm and VE
m for {xCO2 + (1 − x)SF6} plotted over a range of mole fraction atp =
5.20 MPa andT = 302.15 K: ◦, table1; - - - - -, calculated from the Patel–Teja equation of statewith k12 = 0.05 for HE
m andk12 = 0.10 for VEm.
0−1.0
0
1.0
2.0
0.2 0.4 0.6 0.8 1.0x
0 0.2 0.4 0.6 0.8 1.0x
− 60
− 40
− 20
0
20
HmE
/(kJ
. mol
−1)
VmE
/(cm
3. m
ol−1
)
FIGURE 5. HEm and VE
m for {xCO2 + (1 − x)SF6} plotted over a range of mole fraction atp =
5.20 MPa andT = 305.65 K:◦, table1; - - - -, calculated from the Patel–Teja equation of state withk12 = 0.05 for HE
m andk12 = 0.10 for VEm.
N = [b · c + {0.5 · (b + c)2}]
1/2, (7)
Q = [{0.5 · (b + c)} + N] · (p/RT). (8)
The exponent 1/2 in equation (7) is positive, not negative, as stated in reference 10. Mixtureparameters were calculated by using arithmetic mean combining rules for the parametersbandc, and a quadratic rule for parametera with the cross term given by:
a12 = (1 − k12) · (a11 · a22)1/2, (9)

HEm andVE
m for {xCO2 + (1 − x)SF6} 309
0
−1.0
−0.5
0
1.0
0.2 0.4 0.6 0.8 1.0x
0 0.2 0.4 0.6 0.8 1.0x
− 60
− 80
− 40
− 20
0
HmE
/(kJ
. mol
−1)
VmE
/(cm
3. m
ol−1
)
FIGURE 6. HEm and VE
m for {xCO2 + (1 − x)SF6} plotted over a range of mole fraction atp =
6.20 MPa andT = 302.15 K:◦, table1; - - - -, calculated from the Patel–Teja equation of state withk12 = 0.08 for HE
m andk12 = 0.1 for VEm.
0
−0.5
0
0.5
1.0
0.2 0.4 0.6 0.8 1.0x
0 0.2 0.4 0.6 0.8 1.0x
− 60
− 80
− 40
− 20
0
HmE
/(kJ
. mol
−1)
VmE
/(cm
3. m
ol−1
)
FIGURE 7. HEm and VE
m for {xCO2 + (1 − x)SF6} plotted over a range of mole fraction atp =
6.20 MPa andT = 305.65 K:◦, table1; - - - -, calculated from the Patel–Teja equation of state withk12 = 0.08 for HE
m andk12 = 0.10 for VEm.
wherek12 is an adjustable parameter. To calculate the residual molar enthalpyHRm of the
mixture the quantity(δa/δT) is needed, and this was calculated from the equation:
(δa/δT) = x2(δa11/δT) + 2x(1 − x)(1 − k12) f (a) + (1 − x)2(δa22/δT), (10)
310 C. J. Wormald and R. W. Hodgetts
00
0.5
1.0
1.5
0.2 0.4 0.6 0.8 1.0x
0 0.2 0.4 0.6 0.8 1.0x
5
0
10
15
HmE
/(kJ
. mol
−1)
VmE
/(cm
3. m
ol−1
)
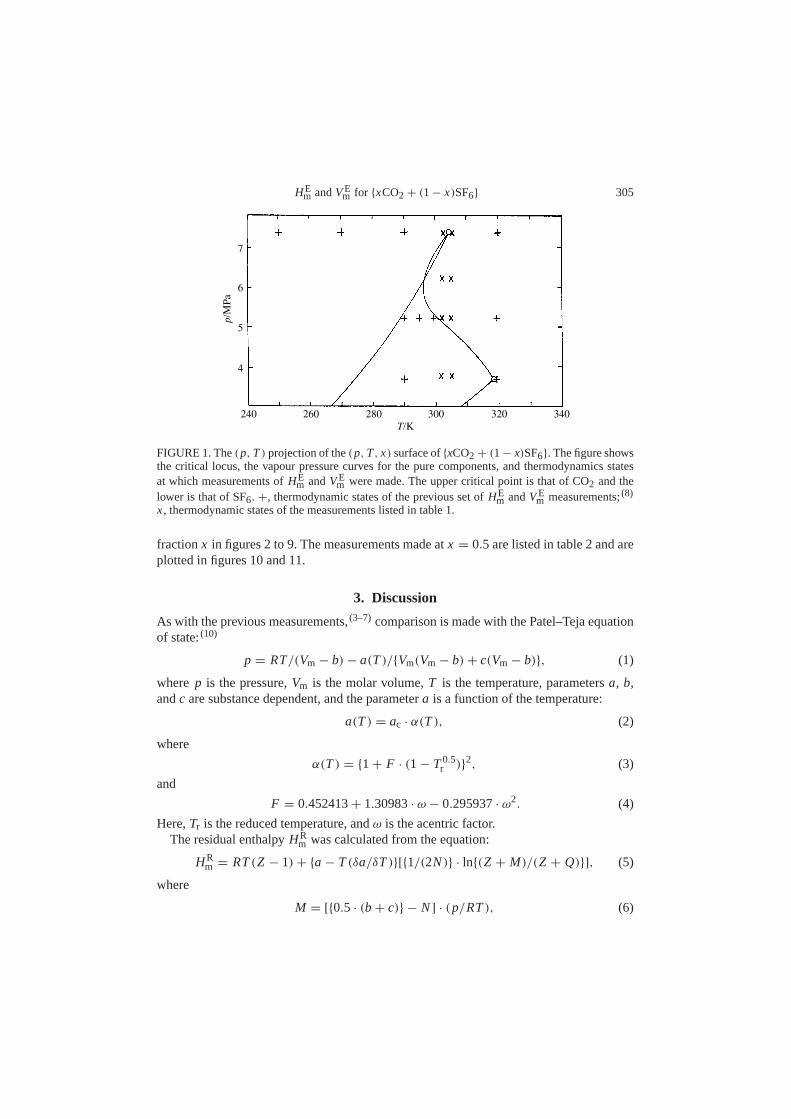
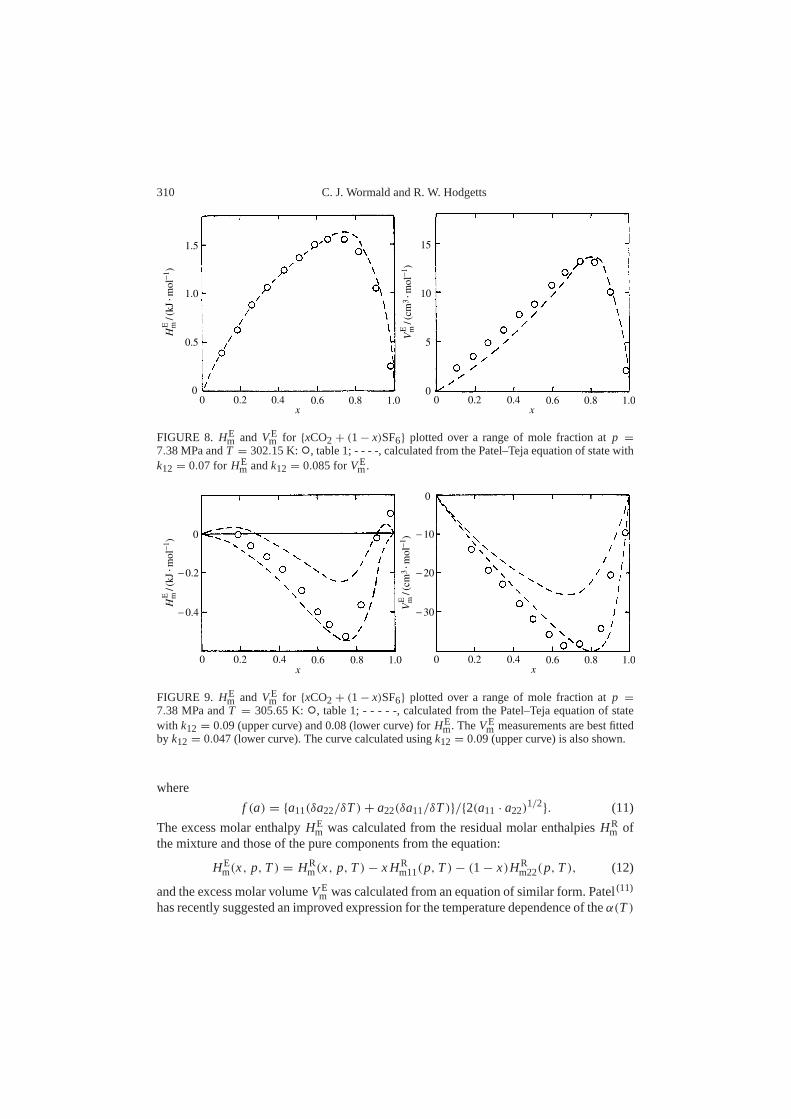
FIGURE 8. HEm and VE
m for {xCO2 + (1 − x)SF6} plotted over a range of mole fraction atp =
7.38 MPa andT = 302.15 K:◦, table1; - - - -, calculated from the Patel–Teja equation of state withk12 = 0.07 for HE
m andk12 = 0.085 forVEm.
0
− 0.4
− 0.2 − 20
− 30
− 100
0.2 0.4 0.6 0.8 1.0x
0 0.2 0.4 0.6 0.8 1.0x
0
HmE
/(kJ
. mol
−1)
VmE
/(cm
3. m
ol−1
)
FIGURE 9. HEm and VE
m for {xCO2 + (1 − x)SF6} plotted over a range of mole fraction atp =
7.38 MPa andT = 305.65 K: ◦, table1; - - - - -, calculated from the Patel–Teja equation of statewith k12 = 0.09 (upper curve) and 0.08 (lower curve) forHE
m. TheVEm measurements are best fitted
by k12 = 0.047 (lower curve). The curve calculated usingk12 = 0.09 (upper curve) is also shown.
where
f (a) = {a11(δa22/δT) + a22(δa11/δT)}/{2(a11 · a22)1/2
}. (11)
The excess molar enthalpyHEm was calculated from the residual molar enthalpiesHR
m ofthe mixture and those of the pure components from the equation:
HEm(x, p, T) = HR
m(x, p, T) − x HRm11(p, T) − (1 − x)HR
m22(p, T), (12)
and the excess molar volumeVEm was calculated from an equation of similar form. Patel(11)
has recently suggested an improved expression for the temperature dependence of theα(T)

HEm andVE
m for {xCO2 + (1 − x)SF6} 311
TABLE 2. Measurements ofHEm and VE
m for (0.5CO2 + 0.5SF6) made at the temperatureT = 301.95 K over the pressure range (2.5 to 10.0) MPa
p
MPa
HEm
J · mol−1
VEm
cm3 · mol−1
p
MPa
HEm
J · mol−1
VEm
cm3 · mol−1
p
MPa
HEm
J · mol−1
VEm
cm3 · mol−1
2.50 741 5.00 1998 −15 6.25 −1050 −61
2.61 4753 5.10 1666 −16 6.49 −978 −56
2.80 4709 5.16 1332 −26 6.60 −927 −52
2.92 4611 170 5.22 1135 −41 6.70 −865 −49
3.14 4385 162 5.28 645 −56 6.80 −773 −45
3.31 4322 140 5.32 408 −63 6.89 −671 −42
3.70 4023 104 5.37 5 −75 7.19 1394 8
3.89 3825 102 5.40 −38 −77 7.29 1401 8
4.10 3590 84 5.50 −624 −88 7.50 1378 8
4.30 3377 73 5.60 −742 −84 8.00 1438 8
4.50 3159 53 5.69 −898 −85 8.75 1414 8
4.69 2725 26 5.80 −976 −82 9.50 1402 7
4.90 2035 −1 6.00 −1044 −76 10.0 1383 7
function of equation (2). This more complex form gives a better fit to vapour pressures,liquid densities, and liquid heat capacities of both polar and non-polar compounds, and ina later publication, comparison with our results will be made. For present purposes, theoriginal form of theα(T) function is adequate.
In figures2 to 10, continuous curves through the points were drawn with a flexicurve,and where the position of the curve was uncertain long dashes were used. Short dashcurves were calculated from the Patel–Teja equation of state, and where these fit themeasurements sufficiently well no other curve is drawn. TheHE
m andVEm measurements
shown in figures2 and3 are atp = 3.76 MPa and the temperatures 302.65 K and 305.65 K.Under these conditions, carbon dioxide entering the calorimeter was in the gas phase andsulfur hexafluoride was in the liquid phase. At low values ofx, the CO2 gas dissolved inthe liquid SF6 to form a liquid mixture, and heat was liberated. At high values ofx, theSF6 dissolved in the CO2 to form a gaseous mixture, and the mixing was endothermic.Between these extremes lies a narrow two-phase region, but in the absence of a VLEdiagram it was not possible to draw the boundaries corresponding to the dew- and bubble-point compositions at the pressure 3.76 MPa. By chance, one of the measurements lies inthis region, and the best that can be done is to draw a long-dash line through this point,in approximately the correct position. The explanation of the features of theVE
m curve issimilar to that of theHE
m curve. The short-dash lines were calculated from the Patel–Tejaequation withk12 = 0.15, which is the best that can be done to fit theHE
m measurements,and withk12 = 0.05 which fits theVE
m measurements almost to within experimental error.The measurements shown in figures4 and5 are atp = 5.20 MPa and the temperatures
T = 302.15 K andT = 305.65 K. The process in the calorimeter was the mixing of

312 C. J. Wormald and R. W. Hodgetts
0
− 0.2
0.2
0.4
0.6
0
2 4 6 8 10p/MPa
HmE
/(kJ
. mol
−1)
FIGURE 10.HEm for (0.5CO2 + 0.5SF6) plotted over a range of pressure atT = 301.95 K: ◦,
table2; - - - - -, calculated from the Patel–Teja equation of state withk12 = 0.05.
0
− 100
100
200
0
2 4 6 8 10p/MPa
VmE
/(cm
3. m
ol−1
)
FIGURE 11.VEm for (0.5CO2 + 0.5SF6) plotted over a range of pressure atT = 301.95 K: ◦,
table2; - - - -, calculated from the Patel–Teja equation of state withk12 = 0.05.
gaseous carbon dioxide with liquid sulfur hexafluoride to form a mixture which was justabove the critical locus shown in figure1, and at all compositions a gaseous mixture wasformed. At low values ofx, the gaseous carbon dioxide dissolved in the liquid sulfurhexafluoride andHE
m was initially negative. At higher values ofx, the sulfur hexafluorideevaporated into the carbon dioxide gas andHE
m was then positive. TheHEm measurements at
both temperatures follow the shapes of the curves generated from the Patel–Teja equationwith the choicek12 = 0.05. TheVE
m measurements follow the shape of curves calculatedwith k12 = 0.1, and the fit to the measurements is a little better than the fit to theHE
mmeasurements.
Figures6 and7 show measurements atp = 6.20 MPa and at the temperatures 302.15 Kand 305.65 K. Again the carbon dioxide enters the calorimeter as a dense gas, the sulfurhexafluoride is a liquid, and the mixture is a supercritical fluid. TheHE
m measurements

HEm andVE
m for {xCO2 + (1 − x)SF6} 313
follow quite closely the curves generated from the Patel–Teja equation withk12 = 0.08,and theVE
m measurements follow curves generated withk12 = 0.1.Figures8 and9 show measurements atp = 7.38 MPa, which is as close to the critical
pressure of carbon dioxide as we could reach experimentally. The measurements atT =
302.15 K andT = 305.65 K lie on either side of the critical temperatureTc = 304.19 K ofcarbon dioxide. The shapes of theHE
m andVEm curves atT = 302.15 K are similar to curves
which were reported previously(3) for (carbon dioxide+ ethane). TheHEm measurements
are fitted by the Patel–Teja equationk12 = 0.07 almost to within experimental error, andtheVE
m measurements are fitted fairly well withk12 = 0.085. Whereas the excess volumesmeasured atT = 302.15 K are positive, those measured atT = 305.65 K are negative. Theshape of theVE
m curve atT = 305.65 K is reproduced fairly well by the choicek12 = 0.047.When we first saw the results forHE
m at T = 305.65 K we thought the apparatus hadmalfunctioned. We had expected that the measurements would all be negative, and thatthey would extrapolate smoothly toHE
m = 0 at the extremes of composition. Instead, wefound that betweenx = 0.2 andx = 0.4 the measurements suggest that, at lower valuesof x, HE
m will become slightly positive, and the two measurements atx > 0.9 again clearlyindicate that the excess enthalpy is positive in this region. Some encouragement to believethat the measurements are not in error is obtained from the shapes of the curves generatedby the Patel–Teja equation of state. While theHE
m measurements cannot be fitted by theequation, two choices ofk12 can be made which have interesting features. The choicek12 = 0.08 almost follows the shape of the curve suggested by the measurements in therangex = 0.4 tox = 0.85, and it almost reproduces the minimum value ofHE
m. The choicek12 = 0.09 produces the upper of the two short-dashed curves shown in the figure9. Thiscurves shows values ofHE
m which change from negative to positive at the extremes ofcomposition, as suggested by the experimental measurements. Interestingly, theVE
m curvecalculated by usingk12 = 0.09 shows no unusual features; it is of similar shape to thecurve obtained withk12 = 0.047.
4. Pressure scan of (0.5CO2 + 0.5SF6) at T = 301.95 K
The computer-controlled flow calorimetric apparatus is capable of making measurementsat a series of decreasing pressures at a chosen composition, and measurements made on{0.5CO2 + 0.5CzH6} when using the apparatus in this mode have been reported.(4) Intable2 we report 39 measurements ofHE
m and 36 measurements ofVEm at x = 0.5 made
over the pressure range 10.0 MPa to 2.5 MPa at the temperature 301.95 K. TheVEm andHE
mmeasurements are shown plotted as a function of the pressure in figures10 and11. TheTc(x) measurements of Diefenbacher and Turk(9) give Tc(x = 0.5) = (300.6±0.2) K andpc(x = 0.5) = (5.15 ± 0.5) MPa. This information was not available when our excessfunction measurements were made, but we now know that our experimental temperaturewas 1.35 K greater thanTc(0.5), 2.26 K below the critical temperature of carbon dioxide,and 16.75 K below the critical temperature of sulfur hexafluoride. Because the capacityof the cooled reservoirs in which the condensed gases were stored was 0.5 dm3, it waspossible to make about 20 measurements with one filling, and the apparatus had tobe recharged half way through the pressure scan. To obtain excess volumes it was of

314 C. J. Wormald and R. W. Hodgetts
course necessary to measure the density of the two pure components at every pressurefor which measurements on the mixture had been made. The computer-controlled systemfor adjusting the pressure allowed this to be done, and as no mixing was involved, a veryslow rate through the system was maintained and only a little material was used. At everypressure, the densimeter was calibrated with pure nitrogen and carbon dioxide. As before,the uncertainty on theHE
m measurements was about±2 per cent, and that on theVEm
measurements was about±4 per cent.The HE
m andVEm curves shown in figures10and11are compared with curves calculated
from the Patel–Teja equation of state withk12 = 0.05, and it is reassuring to note thatthe curves calculated from the equation have the same shape as the curves suggested bythe measurements. Whereas the pure-component residual enthalpies andHE
m are all zeroin the limit of p → 0, the pure component residual volumes become the second virialcoefficientsB11 andB22, andVE
m becomes equal to the excess second virial coefficient ofthe mixture.
At the initial pressure (10.0 MPa), both pure components were in the liquid phase, liquidmixture was formed, the mixing process was endothermic and the excess functions have
the valuesHEm = (1400± 20) J · mol−1 andVE
m = (8 ± 1) cm3· mol
−1. As the pressure
was reduced, these values changed by very little until the saturation pressure (7.01 MPa)of carbon dioxide atT = 301.95 K was reached. Below this pressure, the carbon dioxideentered the mixing calorimeter as a dense gas, and the mixing process can be regarded asthe dissolution of carbon dioxide gas in the liquid sulfur hexafluoride, with the liberation ofheat, to form a liquid mixture. The transition from liquid to gaseous carbon dioxide causesthe discontinuity at (7.0 ± 0.05) MPa shown in figures10 and11. A similar discontinuity,but in the reverse direction, is seen at the pressure 2.55 MPa, and this corresponds to thesaturation pressure of sulfur hexafluoride atT = 301.95 K. Above this pressure, sulfurhexafluoride enters the calorimeter in the liquid state, gaseous carbon dioxide dissolves,and the process is exothermic. Below this pressure, both components enter the calorimeterin the gaseous state and a gaseous mixture is formed.
At the pressure 5.15 MPa, there is no discontinuity in either theHEm or theVE
m shown infigures10 and11, and a smooth curve can be drawn through them. In the pressure range5.15 MPa to 7.01 MPa, it is not immediately obvious how to interpret figures10 and11.TheVE
m curve has a sharp minimum atp ≈ 5.5 MPa, and in this regionVEm decreases from
−90 cm3· mol
−1to −60 cm3
· mol−1
with increase of pressure.The HE
m curve in this same region is rounded, and the minimum is atp = 6 MPa,rather thanp = 5.5 MPa. Interpretation of this behaviour is greatly assisted by inspectionof residual molar volumeVR
m and residual molar enthalpyHRm curves calculated from the
Patel–Teja equation of state and shown in figures12 and13. The upper part of figure12shows a residual volume curve (short dashes) calculated by taking the mean of the residualvolumes of sulfur hexafluoride and carbon dioxide. This curve has discontinuities at thesaturation pressures of the two pure components at the temperature 301.95 K. The figurealso shows (long dash curve) the residual volume of the mixture atx = 0.5 calculated fromthe Patel–Teja equation with the combining rules given above and withk12 = 0.05. Theexcess molar volume, which is the difference between these two curves, is shown in the

HEm andVE
m for {xCO2 + (1 − x)SF6} 315
0
− 100
− 400
− 300
− 200
100
200
0
2 4 6 8 10p/MPa
VmE
/(cm
3. m
ol−1
)V
mR/(
cm3. m
ol−1
)
FIGURE 12. The upper part of the figure shows: - - -, the mean of the residual molar volumesVRm
of CO2 and SF6; – – –, the residual molar volumeVRm of (0.5CO2 + 0.5SF6) calculated from the
Patel–Teja equation of state withk12 = 0.05 atT = 301.95 K over a range of pressure. The lowerpart of the figure shows the excess molar volumeVE
m calculated by taking the difference between thetwo curves shown in the upper part.
lower part of the figure as a continuous line. The corresponding residual enthalpy curvesare shown in the upper part of figure13, and below them is the excess enthalpy curvecalculated in the same way as the excess volume curve. Figures12and13both make clearthat the transition from positive to negative values ofVE
m and HEm is associated with the
transition from a dense gaseous mixture to a liquid mixture. At sub-critical temperatures,this transition is from the dewpoint, across a narrow two-phase region, to the bubble point.The calculated dewpoint and bubble point for thex = 0.5 mixture are at the pressures4.6 MPa and 4.75 MPa. The discontinuity in the slope of theVE
m curve atp = 4.6 MPacorresponds to the dewpoint pressure and the sharp minimum in theVE
m curve at 4.75 MPacorresponds to the bubble point pressure. The decrease ofVE
m with increase of pressure inthe region betweenp = (5.5 and 7.0) MPa is accounted for, as is the rounded shape ofthe HE
m curve. At supercritical temperatures, the shape of the residual volume curve forthe x = 0.5 mixture differs from that shown in figure12, dew and bubble points vanish,and the residual volume against pressure curve no longer has sharp discontinuities butbecomes rounded. Such a curve still gives rise to aVE
m curve of similar shape to that shownin the lower part of figure12, but the shallow discontinuity atp = 4.6 MPa and the sharpdiscontinuity atp = 4.75 MPa are replaced by rounded curves.
Returning now to the experimentalVEm curve shown in figure11, it is evident that if
we were to interpret the curve as though it were at a subcritical temperature then theexperimental values of the dew and bubble pressures would be at(5.25 ± 0.1) MPa and(5.5 ± 0.1) MPa. The experimental temperature is however at 301.95 K, which is 1.35 K

316 C. J. Wormald and R. W. Hodgetts
0
− 0.2
− 10
− 15
− 5
0
2.04.0
0
2 4 6 8 10p/MPa
HmE
/(kJ
. mol
−1)
HmR
/(kJ
. mol
−1)
FIGURE 13. The upper part of the figure shows: - - - -, the mean of the residual molar enthalpiesHRm
of CO2 and SF6; – – –, the residual molar enthalpyHRm of (0.5CO2 + 0.5SF6), calculated from the
Patel–Teja equation of state withk12 = 0.05 atT = 301.95 K over a range of pressure. The lowerpart of the figure shows the excess molar enthalpyHE
m calculated by taking the difference betweenthe two curves shown in the upper part.
aboveTc for the x = 0.5 mixture, and is just inside the supercritical region. Belowp = 5.5 MPa, the fluid mixture is gas-like, and abovep = 5.5 MPa it is liquid-like.The rounded shape of theHE
m curve in the regionp = (5.5 to 7) MPa shown in figure10is similar to that of the calculated curve shown in figure13, and it is now clear that theminimum atp = 6 MPa has no physical significance.
The value of comparison with the cubic equation of the state is that it gives somereassurance that the shape of the excess function curves are as one might expect themto be, and some assistance in interpreting the measurements. Cubic equations fit the excessfunction measurements less than perfectly, not only because of the inadequacy of thecombining rules, but because they give a poor fit to the residual volumes and enthalpies ofthe pure components, and they do not adequately reproduce the VLE loops. The fit obtainedby using the Peng–Robinson(12) equation of state is much the same as that obtained withthe Patel–Teja equation. Measurements ofHE
m and VEm for {xCO2 + (1 − x)C2H6} and
{xCO2 + (1 − x)C2H4} reported previously(3–7) were also compared with the Patel–Tejaequation of state. The goodness-of-fit was no better and no worse than that obtained for{xCO2 + (1 − x)SF6}, a mixture which contains a fluorocompound. This suggests thatthe principle reason for the inadequacy of the fits is related to the functional form of theequation of state, and its consequent failure to fit pure-component residual enthalpies andvolumes. The combining rules are undoubtedly imperfect, but this is less of a problem thanthe inadequate functional form of the cubic equation of state.

HEm andVE
m for {xCO2 + (1 − x)SF6} 317
REFERENCES
1. Wormald, C. J.; Eyears, J. M.J. Chem. Thermodynamics1987, 19, 845–856.2. Pando, C.; Renuncio, J. A. R.; Schofield, R. S.; Izatt, R. M.; Christensen, J. J.J. Chem. Thermo-
dynamics1983, 15, 747–755.3. Wormald, C. J.; Eyears, J. M.J. Chem. Thermodynamics1988a, 20, 323–331.4. Wormald, C. J.; Eyears, J. M.J. Chem. Soc. Faraday Trans. 11988b, 84, 1437–1445.5. Wormald, C. J.; Hodgetts, R. W.J. Chem. Thermodynamics1997, 29, 75–85.6. Wormald, C. J.; Eyears, J. M.Fluid Phase Equilib.2001, 179, 139–149.7. Wormald, C. J.; Eyears, J. M.J. Chem. Thermodynamics2001, 33, 775–786.8. Wormald, C. J.; Hodgetts, R. W.Fluid Phase Equilib.2001, 188, 391–401.9. Diefenbacher, A.; Turk, M.J. Chem. Thermodynamics1999, 31, 905–919.
10. Patel, N. C.; Teja, A. S.Chem. Eng. Sci.1982, 37, 463–473.11. Patel, N. C.Int. J. Thermophys.1996, 17, 673–682.12. Peng, D. Y.; Robinson, D. B.Ind. Eng. Chem. Fundam.1976, 15, 59–64.
(Received 18 December 2000; in final form 17 April 2001)
O-876