Embed Size (px)
Citation preview

NAVAL POSTGRADUATE
SCHOOL
MONTEREY, CALIFORNIA
MBA PROFESSIONAL REPORT
The Photovoltaic Power Converter: A Technology Readiness Assessment
By: Steven R. Ansley, Jr., and
Lewis H. Phillips June 2005
Advisors: Ron B. Tudor and
Brad R. Naegle
Approved for public release; distribution is unlimited.

THIS PAGE INTENTIONALLY LEFT BLANK

i
REPORT DOCUMENTATION PAGE Form Approved OMB No. 0704-0188 Public reporting burden for this collection of information is estimated to average 1 hour per response, including the time for reviewing instruction, searching existing data sources, gathering and maintaining the data needed, and completing and reviewing the collection of information. Send comments regarding this burden estimate or any other aspect of this collection of information, including suggestions for reducing this burden, to Washington headquarters Services, Directorate for Information Operations and Reports, 1215 Jefferson Davis Highway, Suite 1204, Arlington, VA 22202-4302, and to the Office of Management and Budget, Paperwork Reduction Project (0704-0188) Washington DC 20503. 1. AGENCY USE ONLY (Leave blank)
2. REPORT DATE June 2005
3. REPORT TYPE AND DATES COVERED MBA Professional Report
4. TITLE AND SUBTITLE: The Photovolatic Power Converter: A Technology Readiness Assessment
6. AUTHOR(S) Steven R. Ansley Jr. and Lewis H. Phillips
5. FUNDING NUMBERS
7. PERFORMING ORGANIZATION NAME(S) AND ADDRESS(ES) Naval Postgraduate School Monterey, CA 93943-5000
8. PERFORMING ORGANIZATION REPORT NUMBER
9. SPONSORING / MONITORING AGENCY NAME(S) AND ADDRESS(ES) N/A
10. SPONSORING / MONITORING AGENCY REPORT NUMBER
11. SUPPLEMENTARY NOTES The views expressed in this report are those of the author(s) and do not reflect the official policy or position of the Department of Defense or the U.S. Government. 12a. DISTRIBUTION / AVAILABILITY STATEMENT Approved for public release; distribution is unlimited.
12b. DISTRIBUTION CODE
ABSTRACT (maximum 200 words) With the DoD moving towards evolutionary acquisition and incremental development of weapons systems and
soldier applications, it is important that the maturity of new technologies be properly assessed so that the probability of success, once inserted into a program, can be maximized.
The purpose of this report is to examine the Photovoltaic Power Converter (PVPC) technology, developed by Atira Technologies, as a potential Department of Defense Acquisition program/project. Specifically, the report focuses on a Technology Readiness Assessment (TRA). The report validates the PVPC technology and estimates, with 95% confidence, that the PVPC enables a solar power system to convert between 30.39% and 48.60% more solar energy into power than an identical system without the PVPC. The report also identifies and documents the required supporting information to justify a Technology Readiness Level (TRL) 5 for the PVPC. Finally, the report recommends inserting the PVPC into the DoD Acquisition System as a commercial item via horizontal technology insertion or the Advanced Concept Technology Demonstration Program.
15. NUMBER OF PAGES
147
14. SUBJECT TERMS Photovoltaic (PV), Technology Readiness Level (TRL), Atira, Photovoltaic Power Converter (PVPC), Commercial Item, Advanced Concept Technology Demonstration. 16. PRICE CODE
17. SECURITY CLASSIFICATION OF REPORT
Unclassified
18. SECURITY CLASSIFICATION OF THIS PAGE
Unclassified
19. SECURITY CLASSIFICATION OF ABSTRACT
Unclassified
20. LIMITATION OF ABSTRACT
UL

ii
THIS PAGE INTENTIONALLY LEFT BLANK
iii
Approved for public release; distribution is unlimited
THE PHOTOVOLTAIC POWER CONVERTER: A TECHNOLOGY READINESS ASSESSMENT
Steven R. Ansley Jr., Major, United States Army Lewis H. Phillips, Major, United States Army
Submitted in partial fulfillment of the requirements for the degree of
MASTER OF BUSINESS ADMINISTRATION
from the
NAVAL POSTGRADUATE SCHOOL June 2005
Authors: _____________________________________
Steven R. Ansley Jr. _____________________________________
Lewis H. Phillips Approved by: _____________________________________
Ron B. Tudor, Lead Advisor _____________________________________ Brad R. Naegle, Support Advisor _____________________________________ Douglas A. Brook, Dean
Graduate School of Business and Public Policy

iv
THIS PAGE INTENTIONALLY LEFT BLANK

v
THE PHOTOVOLTAIC POWER CONVERTER: A TECHNOLOGY READINESS ASSESSMENT
ABSTRACT
With the DoD moving towards evolutionary acquisition and incremental
development of weapons systems and soldier applications, it is important that the
maturity of new technologies be properly assessed so that the probability of success, once
inserted into a program, can be maximized.
The purpose of this report is to examine the Photovoltaic Power Converter
(PVPC) technology, developed by Atira Technologies, as a potential Department of
Defense Acquisition program/project. Specifically, the report focuses on a Technology
Readiness Assessment (TRA). The report validates the PVPC technology and estimates,
with 95% confidence, that the PVPC enables a solar power system to convert between
30.39% and 48.60% more solar energy into power than an identical system without the
PVPC. The report also identifies and documents the required supporting information to
justify a Technology Readiness Level (TRL) 5 for the PVPC. Finally, the report
recommends inserting the PVPC into the DoD Acquisition System as a commercial item
via horizontal technology insertion or the Advanced Concept Technology Demonstration
Program.

vi
THIS PAGE INTENTIONALLY LEFT BLANK

vii
TABLE OF CONTENTS
I. INTRODUCTION........................................................................................................1 A. PREFACE.........................................................................................................1 B. RESEARCH OBJECTIVES...........................................................................2 C. RESEARCH QUESTIONS.............................................................................2
1. Primary Research Question:...............................................................2 2. Secondary Research Questions:..........................................................3
D. SCOPE AND ORGANIZATION ...................................................................3 E. METHODOLOGY ..........................................................................................3 F. EXPECTED BENEFITS.................................................................................4
II. BACKGROUND ..........................................................................................................5 A. INTRODUCTION............................................................................................5 B. SOLAR ENERGY............................................................................................5
1. Passive Solar Power .............................................................................6 2. Active Solar Power.............................................................................10
C. ATIRA.............................................................................................................16 D. NAVAL POSTGRADUATE SCHOOL AND ATIRA ...............................17
1. Naval Postgraduate School ...............................................................17 2. Atira and NPS ....................................................................................18
E. THE DEPARTMENT OF DEFENSE ACQUISITION PROCESS..........21 1. The Defense Acquisition Framework...............................................21 2. Overview of the Acquisition Process Focused on Technology
Assessment ..........................................................................................22 F. TECHNOLOGICAL READINESS LEVELS.............................................27
1. TRL Purpose and Origin ..................................................................27 2. DoD Roles and Responsibilities Regarding TRA............................28 3. Statutory and Regulatory Information Requirements for TRAs..30
III. DATA ..........................................................................................................................31 A. INTRODUCTION..........................................................................................31 B. PRODUCT DESCRIPTION: CONVERTING SOLAR POWER ............31
1. Maximum Power Point Tracking (MPPT) ......................................33 2. Switch Mode Power Conversion.......................................................34 3. Relevant Range of the PVPC ............................................................35 4. Physical Description...........................................................................36 5. Next Generation of the PVPC...........................................................36 6. Summary of How It Produces Power...............................................37
C. PRODUCT TEST DATA ..............................................................................37 1. Atira Technologies Comparison Tests .............................................37 2. NPS Field Tests ..................................................................................41 3. Raven Designs Field Tests .................................................................47
D. TECHNOLOGY READINESS LEVEL DESCRIPTIONS.......................49 1. TRL 1: Basic Principles Observed and Reported..........................50

viii
2. TRL 2: Technology Concept and/or Application Formulated ......50 3. TRL 3: Analytical and Experimental Critical Function and/or
Characteristic Proof of Concept .......................................................50 4. TRL 4: Component and/or Breadboard Validation in a
Laboratory Environment ..................................................................51 5. TRL 5: Component and/or Breadboard Validation in a
Relevant Environment.......................................................................51 6. TRL 6: System/Subsystem Model or Prototype Demonstration
in a Relevant Environment ...............................................................52 7. TRL 7: System Prototype Demonstration in an Operational
Environment.......................................................................................52 8. TRL 8: Actual System Completed and Qualified Through Test
and Demonstration.............................................................................53 9. TRL 9: Actual System Proven Through Successful Mission
Operations ..........................................................................................53 E. DOD TECHNOLOGY INSERTION MEHODS ........................................54
1. Commercial Item ...............................................................................54 2. Advance Concept Technology Demonstration ................................57
IV. ANALYSIS .................................................................................................................61 A. INTRODUCTION..........................................................................................61 B. PRODUCT TEST ANALYSIS .....................................................................61
1. Atira Technologies Comparison Test...............................................61 2. NPS Field Tests ..................................................................................72 3. Raven Designs Field Tests .................................................................79 4. Summary Analysis of Quantitative Product Tests..........................80
C. TECHNOLOGY READINESS ASSESSMENT .........................................84 1. TRL 1: Basic Principles Observed and Reported..........................84 2. TRL 2: Technology Concept and/or Application Formulated ......85 3. TRL 3: Analytical and Experimental Critical Function and/or
Characteristic Proof of Concept .......................................................85 4. TRL 4: Component and/or Breadboard Validation in a
Laboratory Environment ..................................................................86 5. TRL 5: Component and/or Breadboard Validation in a
Relevant Environment.......................................................................86 6. TRL 6: System/Subsystem Model or Prototype Demonstration
in a Relevant Environment ...............................................................87 D. DOD TECHNOLOGY INSERTION METHODS......................................87
1. Commercial Item ...............................................................................87 2. Advance Concept Technology Demonstration ................................92
V. CONCLUSIONS AND RECOMMENDATIONS...................................................93 A. INTRODUCTION..........................................................................................93 B. CONCLUSIONS ............................................................................................93
1. Primary Research Questions: ...........................................................93 2. Secondary Research Questions:........................................................94
C. RECOMMENDATIONS...............................................................................95

ix
1. Overall Recommendations for the PVPC........................................95 2. Recommendations for Future Research ..........................................98
APPENDICES......................................................................................................................101 APPENDIX A – PVPC TEST PLAN .....................................................................101 APPENDIX B - SAMPLE COMMERCIAL ITEM CHECKLIST.....................121 APPENDIX C – ACRONYMS AND ABBREVIATIONS ...................................123
LIST OF REFERENCES....................................................................................................125
INITIAL DISTRIBUTION LIST .......................................................................................129

x
THIS PAGE INTENTIONALLY LEFT BLANK

xi
LIST OF FIGURES
Figure 1. The Defense Acquisition Management Framework (From: DoDI 5000.2, May 12, 2003)..................................................................................................22
Figure 2. Low Light Effect on Battery Charging (After: <http://www.solengy.com/pages/whitepapers.html>, April 2005)..................32
Figure 3. Schematic of Maximum Power Point Tracking Circuit. (From: <http://www.elecdesign.com/Articles/ArticleID/6262/6262.html>, April 2005) ................................................................................................................34
Figure 4. Digital Photograph of the PVPC......................................................................36 Figure 5. Uni-Solar LM-3 Solar Module and Ultra-Life Polymer Battery .....................38 Figure 6. Global Solar P-4 Array (From: Atira Technologies) .......................................40 Figure 7. NPS PVPC Field Test Configurations .............................................................42 Figure 8. SBR Deployed on a pack and flat on the ground. (After: Raven Designs
Product Brochure)............................................................................................48 Figure 9. Defense Acquisition Framework. (After: DoDI 5000.2, May 2003)...............54 Figure 10. LM-3 12V Test mA Comparison Graph..........................................................65 Figure 11. LM-3 12V Test mW Comparison Graph .........................................................66 Figure 12. LM-3 12V Test mA and mW Combined Comparison Graph..........................66 Figure 13. LM-3 Variable Fixed Load Test Graphics.......................................................70 Figure 14. Global Solar P-4 with Variable Fixed Load Graphics .....................................71 Figure 15. Glass Test 1: 7.4V mW Comparison Graph ...................................................73 Figure 16. Glass Test 2: 7.4V mW Comparison Graph ...................................................74 Figure 17. Glass Test 3 7.4V mW Comparison Graph .....................................................74 Figure 18. Glass Test 4 3.7V mW Comparison Graph .....................................................75 Figure 19. Flex Test with 7.4V Battery Field Test............................................................77 Figure 20. Flex Test with 3.7V Battery Field Test............................................................78 Figure 21. PP-8498/U Multi-Port Universal Battery Charger...........................................96 Figure 22. Unattended Munitions Family of Systems (After: Program Manager Unit
of Action, White Paper) ...................................................................................98

xii
THIS PAGE INTENTIONALLY LEFT BLANK

xiii
LIST OF TABLES
Table 1. Statutory and Regulation Information Requirements (After: Technology Readiness Assessment Deskbook)...................................................................30
Table 2. LM-3 12V Test, Feb 8, 2005 ...........................................................................39 Table 3. LM-3 Test with Programmable Fixed Load, Feb 20, 2005 .............................40 Table 4. Global Solar P-4 Test with Programmable Fixed Load...................................41 Table 5. Glass Test 1 With 7.4V Battery .......................................................................43 Table 6. Glass Test 2 With 7.4V Battery .......................................................................43 Table 7. Glass Test 3 With 7.4V Battery .......................................................................44 Table 8. Glass Test 4 With 3.7V Battery .......................................................................45 Table 9. Flexible Panel Test With 7.4V Battery ............................................................46 Table 10. Flexible Panel Test With 3.7V Battery ............................................................47 Table 11. LM-3 12V Test Descriptive Statistics..............................................................63 Table 12. LM3 12V Test PVPC Charging Interval .........................................................65 Table 13. LM-3 w/ Programmable Fixed Load Test Descriptive Statistics.....................68 Table 14. LM-3 Flex Test w/ Programmable Fixed Load Excerpt..................................69 Table 15. Global Solar P-4 Test with Programmable Fixed Load Descriptive
Statistics ...........................................................................................................71 Table 16. Glass Test 1-3 Descriptive Statistics................................................................73 Table 17. Glass Test 4 Descriptive Statistics...................................................................75 Table 18. Flex Test 7.4V Battery Descriptive Statistics ..................................................76 Table 19. Flexible Panel Test With 3.7V Battery Descriptive Statistics .........................78 Table 20. Test Summary of Individual Tests...................................................................80 Table 21. Test Summary with Outliers Excluded ............................................................82 Table 22. t-Test: Paired Two Sample for Means .............................................................83 Table 23. Estimated Mean Difference .............................................................................83 Table 24. DoD Regulatory Compliance Costs: Top Ten Cost Drivers...........................91 Table 25. PP-8498/U Compatible RechargeableBatteries and End Items They Power
(After Integrated Power Management Homepage, May 2005) .......................97

xiv
THIS PAGE INTENTIONALLY LEFT BLANK

xv
ACKNOWLEDGMENTS
We would like to thank our wives, Lisa and Robin, and our children for their
unending support throughout our time here at the Naval Postgraduate School, and for
their extraordinary understanding and patience during our rewarding but often
challenging military careers. Our successes in all things are directly traceable to your
love and support and the daily sacrifices you make.
In addition, we want to express our gratitude to Professors Brad Naegle and Ron
Tudor for their tireless efforts to provide critical and value-added feedback to make this a
more professional product. Your flexibility and guidance during this process is greatly
appreciated. We would like to thank Stefan Matan, founder of Atira Technologies, who
provided tremendous electrical engineering expertise and was never at a loss to explain
the concepts underpinning his product in terms we could understand. Finally, we would
like to extend our appreciation the U.S. Army for giving us the wonderful opportunity to
attend the Naval Postgraduate School.

xvi
THIS PAGE INTENTIONALLY LEFT BLANK

1
I. INTRODUCTION
A. PREFACE With the ever-increasing pace of technological evolution and the obsolescence of
previous software and hardware left in its wake, the Department of Defense (DoD) needs
a structured methodology to assess the technological maturity of what is being touted as
“state-of-the-art” in order to determine if these technologies are ready to be incorporated
into weapons systems and soldier applications. The tool the DoD uses to do this is a
Technology Readiness Assessment (TRA). The ultimate product of a TRA is a finding of
technological maturity, expressed as a numerical designation, which indicates the
Technology Readiness Level (TRL) of the product. These assigned TRLs, from 1
through 9, tell DoD leadership and Program Managers (PM) whether the technology is
ready to be moved from the Science and Technology (S&T) realm into the Acquisition
realm, or if it still needs time and developmental efforts before being incorporated into an
existing or new program. With the move towards evolutionary acquisition and
incremental development of weapons systems and soldier applications, it is even more
important that the maturity of these new technologies be properly assessed so that the
probability of success with Horizontal Technology Integration (HTI) into existing
programs can be maximized.
The focus of our project is the Photovoltaic Power Converter (PVPC), a device
developed and patented by Atira Technologies. The device incorporates new control
technology that enables a solar panel to directly power electronic devices or charge a
battery even if the power output of the solar panel drops below the device’s or battery’s
charging threshold. The PVPC converts the unusable, potential energy of the solar panel
into usable energy that can be accepted and stored by a battery. If light hits the surface of
a solar panel, potential power (Watts) is produced. However, the component
characteristics (Volts X Amps = Watts) of the energy may be such that it is unusable by
the connected device or battery. A 12-volt battery connected to a solar panel cannot use a
6-volt output produced by a solar panel under cloudy conditions. By converting the
inherent electrical characteristics of the power produced by the solar panel, the PVPC

2
produces sufficient voltage to exceed the battery’s charging threshold and thereby make
previously unusable, below-threshold power, usable. By converting the previously
unusable power produced by the panel into usable power, Atira claims the PVPC can
increase the efficiency of the charging system by as much as 25 percent.1
Although there are many benefits to using Photovoltaic (PV) technology, the
primary shortcoming is the efficiency of PV systems to convert light into electricity.
Currently, commercially available PV panels are on average about 10% efficient. For
clarification, efficiency in this context is the percentage of absorbed light that the PV cell
successfully converts into electricity. Until a technological solution is introduced that
substantially increases the efficiency of PV systems, traditional power sources such as
fossil fuel will continue to prevail as the preferred source of energy.
On October 31, 2003, a new company named Atira Technologies announced they
had developed and patented a new device, dubbed a Photovoltaic Power Converter that
could potentially address the shortfalls prevalent in the PV power industry, and enhance
the benefits derived from the use of solar energy.
B. RESEARCH OBJECTIVES The purpose of this project is to conduct a Technology Readiness Assessment
(TRA) to determine the specific Technology Readiness Level (TRL) of the PVPC to
determine its viability for incorporation into DoD applications. Further, we will
determine and recommend the appropriate insertion point into the DoD Acquisition
System for the PVPC.
C. RESEARCH QUESTIONS
1. Primary Research Question:
• Does the PVPC allow a solar power system to produce 25 percent more power than an identical system without the technology integrated?
• What is the current Technology Readiness Level of the PVPC, as
defined by DoD 5000.2-R Appendix 6?
1 Alexander Wolf, “Photovoltaic Power Conversion Technology Enhancements: Design a circuit that
will track max pwr pt,” (Unpublished Document, Atira Technologies, Los Gatos, CA: 2004), 2

3
2. Secondary Research Questions:
• What is the appropriate insertion method for the PVPC into the DoD Acquisition System?
• What organization should provide management and oversight of
PVPC development?
D. SCOPE AND ORGANIZATION The scope of this project includes: (1) a brief history of solar energy technology
and applications leading up to present day capabilities; (2) a brief overview of the DoD
acquisition framework/process; (3) an examination of the Technology Readiness Level
(TRL) concept and definitions of each level; (4) an examination of where and how new
technology can be inserted into the DoD acquisition framework/process; (5) a
presentation of data on the performance characteristics of the PVPC; (6) analysis of the
data and a determination of the PVPC’s TRL; (7) a recommendation as to where and how
the PVPC should be inserted into the DoD acquisition process; and finally (8)
recommendations for further/future research.
The paper is organized into five major sections, including this chapter. The
second section provides an overview of the history of solar energy, how Atira
Technologies became involved with NPS, an overview of the DoD Acquisition System,
and an introduction to Technology Readiness Levels. The third section contains a
detailed description of the PVPC, more detail on TRLs and how to conduct a Technology
Readiness Assessment (TRA), and the test data obtained on the PVPC. The fourth
section provides the analysis of the data collected, and the actual TRA of the Photovoltaic
Power Converter. The fifth section summarizes our findings and provides
recommendations for the insertion point of the PVPC into the DoD Acquisition System,
as well as suggestions for possible follow-on research.
E. METHODOLOGY The research methodology for this project consists of:
• A comprehensive literature search of websites, magazine articles, CD-ROM systems, and internet based materials.

4
• A comprehensive review of government reports and documents concerning the DoD acquisition process and issues associated with the energy applications and devices.
• Analysis of the development, applications, tests and evaluations for the PVPC.
• Conducting interviews, as appropriate, with DoD and Atira personnel.
F. EXPECTED BENEFITS This project provides the reader with a clear understanding of the capabilities of
the PVPC, and its level of technological maturity. Establishing the Technology
Readiness Level of the PVPC is an essential precursor to the Horizontal Technology
Integration (HTI) into a subsequent increment of capability, to an already developed,
effective, suitable, and fielded soldier application. One of the myriad applications to
which this may lend itself is the area of rechargeable batteries. The ability to lessen both
the strategic burden and tactical load of U.S. service persons by reducing the dependence
on disposable batteries in a forward deployed environment without generators or normal
building service power, offers great benefits both logistically and monetarily.2
Additionally, should the Army or DoD decide to incorporate the PVPC into existing
applications the recommended insertion point into the acquisition system may prove very
beneficial.
2 James Whitaker, Jason Hamilton, and Steven Sablan, Logistical Impact Study of Photovaoltaic
Power Converter Technology to the United States Army and United States Marine Corps, MBA Professional Report, Naval Postgraduate School, Monterey, CA: 2004

5
II. BACKGROUND
A. INTRODUCTION Chapter II provides the background information necessary to facilitate
understanding of the data, analysis and recommendations presented in Chapters III, IV,
and V respectively. The chapter is organized into six primary sections beginning with the
introduction. Section B provides a brief history of solar power and includes discussion of
passive and active solar power. Section C presents a general history of Atira
Technologies and an overview of the PVPC. Section D consists of an overview of the
Naval Postgraduate School and description of the causal factors that led to the
institution’s involvement with Atira, and a broad overview of the DoD Acquisition
Process is presented in section E. Finally, Chapter II concludes with a brief introduction
to the Technology Readiness Level (TRL) concepts to include the purpose of TRLs and
their origin.
B. SOLAR ENERGY The definition for “solar” in the Meriam-Webster Online dictionary is: 3a
“produced or operated by the action of the sun’s light or heat <solar energy> b: utilizing
the sun’s rays especially to produce heat or electricity.”3 Experts predict that our sun will
continue to burn for about the next seven billion years.4 Approximately 10 to 15
thousand times the world’s daily energy consumption strikes the surface of the Earth in
the form of solar energy every day.5 With such an abundant and, in human terms,
“infinite”, source of renewable energy it is no wonder that humankind has been using
solar energy for thousands of years.
This section provides the reader a broad familiarization with the history of solar
power from ancient through modern times. For the purposes of this report, we break the
topic of solar power into two broad categories – passive and active. We introduce the
reader to the differences in both categories and then give examples of each. We further
3 www.m-w.com, [October 2004] 4 www.encarta.msn.com/encylopedia_761562112/Sun.html, [October 2004] 5 www.solarserver.de/lexikon/sonnenenergie-e.html, [October 2004]
6
break active solar power into two main categories, those of solar thermal and
photovoltaic. We then briefly discuss the benefits of photovoltaic power and current
technological shortcomings in the process of converting sunlight directly into electricity.
Since the beginning, the sun has fascinated humankind, and many cultures around
the globe have worshiped the sun in their religions. They understood, as we do today,
that without the sun, there would be no life on Earth. Ancient people may not have
understood this as well as we do today, or the scientific reasons behind this simple truth.
However, they did understand that the sun was important to their lives and that they could
use the life-giving light it provided them to make their lives better. There are accounts as
early as fifth century BC that illustrate how the ancient Greeks used the energy from the
sun.
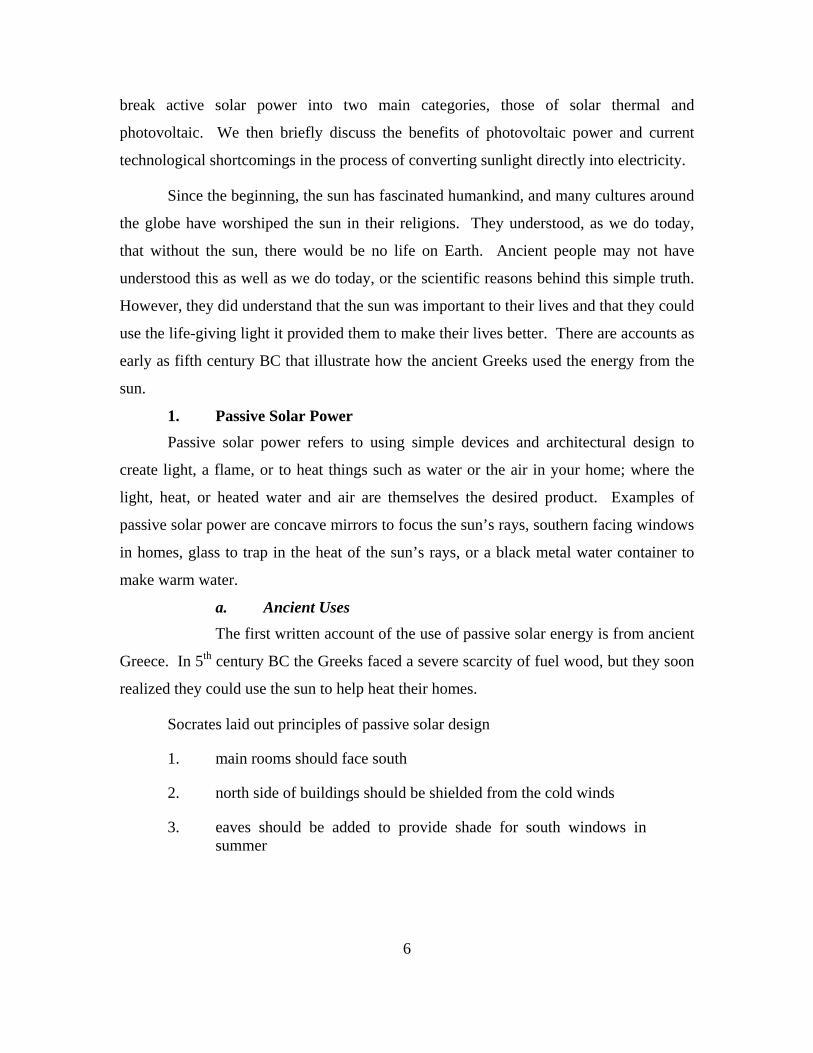
1. Passive Solar Power Passive solar power refers to using simple devices and architectural design to
create light, a flame, or to heat things such as water or the air in your home; where the
light, heat, or heated water and air are themselves the desired product. Examples of
passive solar power are concave mirrors to focus the sun’s rays, southern facing windows
in homes, glass to trap in the heat of the sun’s rays, or a black metal water container to
make warm water.
a. Ancient Uses The first written account of the use of passive solar energy is from ancient
Greece. In 5th century BC the Greeks faced a severe scarcity of fuel wood, but they soon
realized they could use the sun to help heat their homes.
Socrates laid out principles of passive solar design
1. main rooms should face south
2. north side of buildings should be shielded from the cold winds
3. eaves should be added to provide shade for south windows in summer

7
In houses that look toward the south, the sun penetrates the portico in winter, while in summer the path of the sun is right over our heads and above the roof so that there is shade.6
Archeological evidence dating from the 5th century shows that the Greeks
actually planned whole cities using this standard house plan to make the best use of the
winter sun. The city of Priene, in West Asia Minor, was designed such that all the houses
were oriented with a southern exposure on an east-west/north-south street grid to allow
the winter rays of the sun to come into the homes all day.7 This passive solar architecture
in the design of homes and buildings stayed relatively unchanged for hundreds of years,
until the Romans made some improvements and formally recognized its importance in
the law.
With the Roman’s introduction of mica or “glass” to cover the southern
facing windows, in the 1st century AD, the solar heating efficiency of the “Greek solar
oriented home” was exponentially increased.8 The Romans also recognized that the right
to the sun was of key importance to all their citizens, and in the 2nd century AD they
passed “domestic solar rights” laws “to ensure that no building blocked solar access to
nearby houses.”9 In 37 AD, the Romans constructed the first greenhouse and used it to
grow cucumbers for Tiberius Caesar.10
In the middle ages an example of solar architecture is found in the Pueblo
Indian city of Acoma, using the same classic Greek east-west running home, designed
with southern facing windows.11
Not everything about the use of solar energy involved the design of
dwellings. In 212 BC, it is reported that Archimedes magnified sunlight using “burning
mirrors” [concave mirrors that concentrated the rays of the sun] onto Roman ship sails to
6 http://www.uccs.edu/~energy/courses/160lectures/solhist.htm, [October 2004] 7 Perlin and Butti, www.californiasolarcenter.org/history_passive.html, [October 2004]
8 Ibid 9 http://www.uccs.edu/~energy/courses/160lectures/solhist.htm, [October 2004] 10 Ibid 11 www.californiasolarcenter.org/history_passive.html, [October 2004]

8
set them on fire and repel the Roman invasion of Syracuse [Sicily].12 Among the many
other weapons of war it is reported that he created to protect Syracuse, and the
mathematical principals and genius he is better remembered for, Archimedes seems to
have harnessed the power in an attempt to defend his homeland. Plutarch recounts a 1st
century BC example, “when the sacred flame of Delphi went out, it could only be re-lit
by a “pure and unpolluted ray from the sun.”13 Historians believe this was done using
Archimedes’ method of focusing the suns energy with concave mirrors.
b. Modern Uses The classic Greek solar home architecture principles are still with us today
and continued to evolve over time and expand their influence around the entire world.
During the Renaissance, in the 16th century, this style of home became popular once
again in Europe and moved to America around the 18th century.14
What was to spark the solar water heater industry in this country in the late
19th and early 20th centuries was born in 1760 when Swiss naturalist Horace de Saussure
invented what was to become know as the “hot box.”
De Saussure built a rectangular box out of half-inch pine, insulated the inside, and had the top covered with glass, and had two smaller boxes placed inside. When exposed to the sun, the bottom box heated to 228 degrees F (109 degrees C) or 16 degrees F (9 degrees C) above the boiling point of water.15
By 1891 Clarence Kemp had patented a solar water heater design that
“combined the old practice of exposing metal tanks to the sun [on the roof of a house]
with the scientific principle of the hot box…”16 Keeping the tanks inside the glass box
allowed the heat to be retained for a much longer period of time than the bare metal tanks
12 http://www.mcs.drexel.edu/~crorres/Archimedes/Mirrors/Tzetzes.html, [October 2004] 13 Norman,
http://www.eco.utexas.edu/homepages/faculty/Norman/long.extra/Student.F99/solar/car.html, [October 2004]
14 Perlin and Butti, www.californiasolarcenter.org/history_passive.html, [October 2004] 15 Perlin and Butti, http://www.californiasolarcenter.org/history_solarthermal.html, [October 2004] 16 Ibid
9
alone. There were 1,600 of Kemp’s solar water heaters installed in Southern California
homes by 1900 and by 1941 half the population of Florida used an improved version of
the solar water heater.17 By the 1920s natural gas discoveries in Southern California, and
the ensuing price reduction of this form of energy, effectively ended the solar water
heater industry in California. Similarly, by the 1950s, cheap fossil fuel and electricity
across the country made solar products relatively too expensive to continue using.18
Florida’s solar water heaters went the same way as California’s had two decades earlier.
Countries repeated the pattern of abandoning solar power for cheaper fossil fuels as these
natural resources were discovered or made readily available.
In countries with very little natural resources, extremely remote areas, or
unfriendly neighbors with which to trade, solar power is a more attractive option than
fossil fuels. This can be seen in the similar explosion of the use of solar water heaters in
Japan, Australia, and Israel from the late 1960s through the early 1980s. In 1969, four
million Japanese homes had solar water heaters, and today about 10 million Japanese heat
their water with solar energy. By 1983, nearly 60 percent of Israeli homes employed
solar water heaters, and today that figure is more than 90 percent.19
Today the most successful, yet little known, commercial application of
passive solar heating is embodied in the solar swimming pool heater. The marriage of the
pool and solar heating are a great match. The owner of the pool already owns two of the
three necessary “pieces of equipment” to make it all work. The pool and its contents are
the storage medium for the collected solar energy, while the pool’s circulation/filter
pump doubles as the engine that drives water through the solar collector. The only thing
the pool owner needs to buy is the solar collector itself. In the early 1970s, American
Freeman Ford developed low-cost plastic tubing to act as the solar collector.20 The pool
pump continuously pushes cooler pool water through the narrow, black, plastic tubing,
which the sun heats, and then pushes back into the pool. The Georgia Tech Aquatic
17 Perlin and Butti, http://www.californiasolarcenter.org/history_solarthermal.html, [October 2004] 18 http://www.uccs.edu/~energy/courses/160lectures/solhist.htm, [October 2004] 19 Ibid 20 Ibid

10
Center, the main site of the swimming competitions for the 1996 Summer Olympic
Games, used 278 such solar collectors mounted on the center’s roof.21
Not all uses of solar energy are passive. Since the mid 19th century,
people have devised ways to use solar energy in an active capacity to do work in two
general ways.
2. Active Solar Power For this paper, we refer to active solar power as using solar energy in one of two
ways to do work. The first method is called solar thermal, which uses the sun’s heat, and
the second, commonly known as photovoltaics, uses the energy in rays of light. Solar
thermal power uses the sun to heat water, or some other liquid medium, to directly or
indirectly produce vapor, which in turn drives an engine, such as a water pump, or drives
a turbine to create electricity. In contrast, the term photovoltaic refers to a method by
which sunlight is converted directly into electricity without any moving parts.
a. Solar Thermal Modern Uses In 1861, French mathematics instructor Auguste Mouchout patented the
first solar steam engine running on steam from solar heated water.22 By 1872, Mouchout
had evolved his design into an invention that continually tracked (azimuth and altitude)
and focused the sun’s rays, using a conical polished metal reflector, onto a blackened
copper cauldron enclosed in a glass enclosure. This apparatus would produce enough
steam to run a one-half horsepower motor, which was then typically connected to a water
pump.23 By 1881, the French government, who at first was quite enthusiastic about the
prospects of Mouchout’s invention, “deemed the device a technical success but a
practical failure” as the cost of coal drastically dropped and made this alternative source
of power less attractive.24
In 1878, William Adams used many of Mouchout’s ideas as a basis for his
own solar thermal invention. Adams used 72, 17x10 inch flat mirrors arranged in a
21 http://ces.iisc.ernet.in/hpg/envis/olydoc712.html, [October 2004] 22 Smith, http://www.solarenergy.com/info_history.html, [October 2004] 23 Ibid 24 Ibid, [October 2004]

11
semicircle each focused on a cauldron on a raised tower.25 The entire mirror system
could be moved to track the sun on a semicircular track. Adams’ design, which was to
become known as the Power Tower or central receiver design, was able to run a 2.5
horsepower steam engine during daylight hours for two weeks, and is the basis for many
modern, large-scale, centralized solar plants.26
From 1870 through 1888, Swedish born American, John Ericsson invented
and continued to refine a new less complex method of focusing and tracking the sun – the
parabolic trough.27 Envision the polished interior of a 55-gallon drum cut in half. This
configuration focuses the sun in a linear spread, as opposed to the more concentrated
single point produced by the semicircular, conical reflectors. Although this focused a
less concentrated beam of energy, the design provided for a simpler method to track the
sun along a single axis versus the semicircle used in the Power Tower design. The
parabolic trough design has become a standard for many of the largest modern solar
plants “because it strikes a good engineering compromise between efficiency and ease of
operation.28
In 1904, Henry Willsie designed a solar thermal solar motor that could run
both day and night. The following account describes how Willsie’s design worked and
eventually produced up to 15 horsepower,
To store the sun's energy, Willsie built large flat-plate collectors that heated hundreds of gallons of water, which he kept warm all night in a huge insulated basin. He then submerged a series of tubes, or vaporizing pipes, inside the basin to serve as boilers. When the acting medium--Willsie preferred sulfur dioxide to Tellier's ammonia--passed through the pipes, it transformed into a high-pressure vapor, which passed to the engine, operated it, and exhausted into a condensing tube, where it cooled, returned to a liquid state, and was reused.29
25 Smith, http://www.solarenergy.com/info_history.html, [October 2004] 26 Ibid, 27 Ibid, 28 Smith, 6 29 Smith, 6

12
Like many solar entrepreneurs before him, Willsie planned to market his
continuous solar power plant to the world – but with the size to power ratio so skewed,
and the technical nature of dealing with sulfur dioxide, there were no interested buyers.
Undeterred, Frank Shuman working from 1906 through 1912 coupled all
the knowledge and best practices of the past 50 years and basically set the standard for
what would become modern solar power plants 50 plus years later. In 1912, Shuman’s
company and its British investors constructed a solar power plant in Cairo, Egypt. The
plant utilized a tracking parabolic trough that focused solar energy on a double-paned
glass encased cylinder to produce water vapor. The water vapor in turn powered a
specifically designed low-pressure steam engine that generated more than 55
horsepower.30 Thermal mechanical solar power was on its way – or was it? Following
Archduke Ferdinand’s assassination two months after the final Cairo plant trials, war
soon came to Europe’s colonial possessions in Africa. 31 Because of the war, the plant
was destroyed and all the engineers returned to their respective countries to perform war
related tasks. Unfortunately, Shuman died before the war was over and his ideas
postponed for approximately 50 years.
The combination of mature and stable fossil fuels markets, a skeptical
public, and a lack of any significant crisis to precipitate massive capital investment in
renewable energy sources relegated the solar power movement to a comatose state for the
next 50 plus years.32 The OPEC energy crisis in the 1970s reinvigorated interest in solar
power.
By the mid 1980s, modern solar engineers had rediscovered that the
parabolic trough, as used by Ericsson and Shuman, offered the most economical solution
when conducting a cost/benefit analysis in most locations. From the mid 1980s until
1991, when they were forced to declare bankruptcy, the Los Angeles based Luz
Company operated nine parabolic trough, steam-powered electric plants, in the Mojave
30 Smith, 8-9. The latter two technical innovations, that of double-paned glass and the specifically
designed engine were Shuman’s own. 31 Ibid, 9 32 Smith, http://www.solarenergy.com/info_history.html, [October 2004]

13
desert, producing 355 megawatts of power or 95% of the world’s solar based
electricity.33 These plants were referred to as the SEGS plants, solar electric generating
system, and all nine, taken over by a separate investor group, are still in operation today.
During Luz’s existence, the cost of solar electricity was cut from 25 cents per kilowatthour to less than 8 cents per kilowatthour. SEGS failed economically because: (1) natural gas prices and electricity costs did not rise as expected; (2) operating and maintenance costs for the station did not decline as rapidly as had been expected; and (3) key tax incentives were expiring or uncertain.34
Around the same time-frame, Solar One, a Con Edison/government team
Power Tower type solar thermal plant, was also shut down due to its inability to compete
with fossil fuel prices and the removal of the ten and 15 percent investment and business
tax credits for independent power producers, which were subsequently restored in 1992 –
one year too late. In 1996, Solar Two, using much of the equipment form Solar One,
stood up as a government-industry pilot program using the same Power Tower concept
using the improved conversion technology of molten salt instead of high-energy oil.35
Since 1996, there have not been significant advances or adoptions in the
design or uses of solar thermal power in the United States. However, more and more
countries are coming on line and experimenting with and making use of solar thermal
power.
b. Photovoltaic: Modern Uses The term photovoltaic (PV) is a combination of the Greek word for light,
photos, with a derivative of the last name of Alessandro Volta, a pioneer in the study of
electricity.36 A PV cell converts light from the sun directly into electricity, as opposed to
using the heat from the sun, as does solar thermal power.
The direct conversion of light into electricity is explained by what was
originally called the photoelectric effect, but is now also called the photovoltaic effect. In
33 Smith, http://www.solarenergy.com/info_history.html, [October 2004] 34 Dept of Energy, Solar Energy Profile,
http://www.eia.doe.gov/cneaf/solar.renewables/page/solarthermal/solarprofile.pdf, [October 2004] 35 Ibid, 5 36 http://www.californiasolarcenter.org/photovoltaics.html, [October 2004]

14
1839, nineteen- year-old, French physicist, Edmund Bequerel first observed that certain
metals would produce small electrical currents when exposed to sunlight.37 The
explanation of this phenomenon would have to wait until 1905 when Albert Einstein
explained to the world the particle/wave duality of light and quantum physics was born.
In general, Einstein found the following: light consists of particles (photons), the energy
of which is proportional to the frequency of the light, as long as the energy of the photon
exceeds the amount of energy required to keep an electron in the target medium in place,
that electron will be ejected, the movement of all the ejected electrons towards a positive
electrode forms an electric current.38
In 1876, William Adams and his student Richard Day discovered that
solid selenium exhibited the photovoltaic effect.39 Although selenium was used to make
photovoltaic cells, the conductivity was too low to be of any practical purpose except for
using as a light meter for photographic equipment; a purpose for which it is still used
today.
A major breakthrough occurred in 1953/4 when Gerald Pearson, Daryl
Chapin, and Calvin Fuller, of Bell Labs, who, when experimenting with silicon, invented
the fist solar cells capable of converting enough solar energy into electricity to run typical
electrical appliances.40 These first silicon PV cells converted the sun’s energy into
electric energy at an inefficient rate of 4-6 percent. Further, it cost $1500 per watt to
produce a cell making it cost prohibitive.41 This was neither efficient nor cost effective
enough for the public to use.
Throughout the 1950 and early 1960s, PV cell efficiency continued to
increase while cost per watt continued to decrease. By 1958, Hoffman Electronics, the
leading manufacturer of silicon solar cells had achieved 9% efficient PV cells that
37 http://encyclobeamia.solarbotics.net/articles/photovoltaic.html, [October 2004] 38 http://www.walter-fendt.de/ph11e/photoeffect.htm, [October 2004] 39 Perlin and Butti, http://www.californiasolarcenter.org/history_pv.html, [October 2004] 40 Perlin and Butti, http://www.californiasolarcenter.org/history_pv.html, [October 2004] 41 http://inventors.about.com/library/inventors/blsolar2.htm, [October 2004]

15
produced power at less than $300 per watt. In 1958 and 1959, the United States launched
into space the first PV-powered satellites. These systems provided satellite power for
over eight years. 42
As methods of producing silicon and other types of PV cells improve and
their efficiency increases, the cost of each watt of power produced decreases. As the cost
of the cells and the power went down, more applications of PV power emerged. There
are too many applications to mention, however, a few include: Off-shore oil rigs, ocean
based meteorological and navigational buoys, nearly all the lighthouses in the U.S., all
the road-side emergency phones in California, many railroad crossing arms and lights,
and even powering entire towns. Today you can purchase PV cells with efficiency
ranges of at best 10% off the Internet; however, research cells with efficiency ranges in
excess of 30 percent are not available to the public.
c. Photovoltaic Benefits and Shortcomings Because the technology we evaluate in this project is designed to work
with PV cells, we limit our discussion of benefits and shortcomings to this specific area
of solar energy conversion.
The benefits of using PV solar power are great. Solar energy is a
continuously renewable and practically infinite source of energy, as compared to the
finite amounts of fossil fuels available. PV cells convert solar energy into electricity
without producing any noise. Another clear advantage of PV produced electricity over
fossil and nuclear power is that there are no environmental pollutants created in the
power production process. The PV process has no moving parts to breakdown, requires
little maintenance, and is a completely scaleable technology. The existence of solar
powered calculators and buildings illustrates the scalability of PV technology. In
addition, the further you get from a traditional power source the more economical PV
electricity becomes.
Although there are many benefits to using PV technology, the primary
shortcoming is the efficiency of PV systems to convert light into electricity. As indicated
42 http://inventors.about.com/library/inventors/blsolar2.htm, [October 2004]

16
previously current systems are on average about 10% efficient. For clarification,
efficiency in this context is the percentage of absorbed light that the PV cell successfully
converts into electricity. Until a technological solution is introduced that substantially
increases the efficiency of photovoltaic power systems, traditional power sources such as
fossil fuel will continue to prevail as the preferred source of energy consumption. In
early 2003 a new company named ATIRA Technologies announced they had developed a
new device, dubbed a Photovoltaic Power Converter that could potentially address the
shortfalls prevalent in the PV power industry and enhance the benefits derived from the
use of solar energy.
C. ATIRA This section presents ATIRA Technologies’ history and a general overview of the
PVPC. Stefan Matan and Marty Lettunich co-founded ATIRA Technologies in 2003.
Inserted below is Mr. Matan’s personal written account of the company’s history to
include the inspiration for the company name and its primary product.
While researching potential company names, it was clear that a technology that would have such a large impact on the environment should have a name that could coincide with our belief that our products are good for the future of the earth. It was also decided that an environmentally conscience identity is important in today’s business world and that one word names are easy to remember and can say much about a company. When we came across the name Atira, the Pawnee Goddess of Mother Earth, it was obvious we had a winner, for not only the word itself but its meaning as well. Because the earth receives the sun’s light, we exist and because of the power of the light, we survive and because man requires power to sustain society, we need resources that provide the power and do not deplete the earth. Power does not get lost-it is transferred from one kind to another.
The idea behind the technology began many years ago when I was a teenager. I was looking at clear glasses, which held water at a summer wedding party. Some of them were half-empty, some of them one third full, but all had some liquid left. I imagined the glasses as being batteries with some charge left and was thinking-what if it were possible to collect all the residue and useless energy and harness it? I was thinking about an electronic device called a switcher with PWM (Pulse Width Modulation). Today these are available everywhere. A couple of years ago, during the California energy crisis the idea came back again when a friend of mine asked me to create a noiseless generator to provide energy for houses. It

17
was a very easy task with today’s technologies, but I ran into the problem that solar panels were good only when the sun was shining. There was potential that was untapped during low-light conditions. I remembered the glasses with water from that party again and decided to create a way to take that energy and make it useful. I looked for literature on the subject, but nothing was even close to my idea. So I began with the basics, creating a new mathematical model of how to organize the electrons and retrieve the energy under low light conditions. In addition to a successful model, another outcome was the ability for the device to power itself from its own energy source. I had, to put it simply, created a pump for the electrons and the solar cube was born. Obviously, I had something new on my hands. Through a mutual friend, I was introduced to David Tinsley and Marty Lettunich and ATIRA Technologies was founded.43
As discussed previously the primary shortcoming is the efficiency of PV systems
to convert light into electricity. The result of Mr. Matan’s inspiration is a technological
solution that potentially addresses this shortcoming by increasing the usable output of the
photovoltaic conversion process. A detailed description and analysis of the technology
and the device that incorporates it is presented in Chapters III and IV.
D. NAVAL POSTGRADUATE SCHOOL AND ATIRA This section begins with an overview of the Naval Postgraduate School and
concludes with the causal factors that led to the institutions involvement with ATIRA and
the selection of the PVPCT as the topic of our MBA project.
1. Naval Postgraduate School During the early 1900s, the Navy developed and evolved a graduate education
program for the professional and educational development of its officers. Although
officially established in 1909 as a school of maritime engineering at Annapolis, it would
be close to forty years before Congress passed legislation that enabled the school to
become a fully accredited institution and grant graduate degrees for the attending
students. In 1951, Congress authorized the purchase of property to establish an
43 Mr. Matan’s personal account was edited for content and clarity.

18
independent campus for the school. As a result, the Navy purchased the Old Del Monte
Hotel and grounds in Monterey and NPS became a permanent resident of California’s
central coast.44
Over 50 years later, NPS is an internationally recognized high quality academic
institution that provides challenging graduate level studies for approximately 1800
students. The student body is comprised of officers from all branches of service as well
as Department of Defense civilians and international officers representing the services of
25 allied nations. 45 The emphasis is on study and research programs that support the
Department of Defenses’ interests that are pursuant to the national military strategy of the
United States.46
2. Atira and NPS47 The Graduate School of Business and Public Policy (BPP) is one of four schools
that organizes and conducts research projects at NPS. “BPP is responsible for eight
graduate academic programs and awards eight graduate degrees. The largest program is
the resident defense-focused Master of Business Administration (MBA) program.”48 In
2003, Professor Ron B. Tudor, a lecturer for the Graduate School of Business and Public
Policy, was working on a project involving members of the private sector when Marty
Lettunich, CEO and co-founder of ATIRA, approached him. Mr. Lettunich informed
Professor Tudor of an exciting new technology developed and patented by ATIRA. Mr.
Lettunich provided a general description of the Photo Voltaic Power Converter and
suggested that the product potentially had multiple defense related applications. He
asked Professor Tudor if NPS would be interested in becoming involved in research and
development of the product, specifically to identify potential military applications.
Although intrigued by the concept of PVPCT and potential applications, Professor Tudor
44 “A Short History of The Naval Postgraduate School”,
http://www.nps.edu/aboutnps/navigation/heritage.html, [October 2004] 45 “A Short History of The Naval Postgraduate School”,
http://www.nps.edu/aboutnps/navigation/heritage.html, [October 2004] 46“NPS At a Glance”, http://www.nps.edu/aboutnps/navigation/descNPS.html, [25 October 2004] 47 The information provided in this section was obtained from an interview conducted by the authors
with Professor Ron Tudor, 13 October 2004, GSBPP, NPS, Monterey, Ca. 48 “Programs”, 18 October 2004, <http://www.nps.navy.mil/gsbpp/programs.htm>, [25 October 2004]

19
remained skeptical of the validity of the technical application and design. Tudor
informed Lettunich that before NPS would apply institutional resources to research
ATIRA’s new product, an organization within the Department of Defense must sponsor
the research and an independent validation of the PVPCT technological conducted.
Ultimately, Lieutenant General (LTG) J.R. Vines, Commander of the U.S. Army
18th Airborne Corps, contacted Professor Tudor via email, expressing interest in potential
military applications of PVPCT and a willingness to sponsor the research. Subsequent
correspondence between NPS and LTG Vines resulted in a NPS research initiation
proposal approved by LTG Vines and endorsed by M.A. Gallagher, the Program
Manager for Expeditionary Power Systems, Marine Corps Systems Command. The
proposal specified Low-Light Solar Charging as the focus of the research and designated
a period of performance of 1 May 2004 through 30 April 2006 at an estimated cost of
$300,000.
After receiving LTG Vines initial email, Professor Tudor became intrigued by the
level of interest within the Army and by the novelty of the product. While awaiting the
signature approval from LTG Vines; Professor Tudor decided to expedite the initial
validation of the technology. He contacted Dr. Sherif Michael, a Professor of the School
of Engineering and Applied Sciences at NPS and renowned as an authority in
photovoltaics, and requested he review the PVPCT. Skeptical that the PVPCT could in
fact perform as proclaimed and the technology valid, Dr. Michaels agreed to a
demonstration. However, following the demonstration, Dr. Michaels reversed his
position and indicated that the technology was likely valid and if further testing proved
favorable, its potential applications could revolutionize the solar power industry.
With both of his requirements essentially met, Professor Tudor proposed a formal
agreement between NPS and ATIRA in the form of a Cooperative Research and
Development Agreement (CRADA). Provided below is a detailed definition of a
Cooperative Research and Development Agreement and its purpose.
A Cooperative Research and Development Agreement (CRADA) is a written agreement between a private company and a government agency to work together on a project. Created as a result of the Stevenson-Wydler

20
Technology Innovation Act of 1980, as amended by the Federal Technology Transfer Act of 1986, a CRADA allows the Federal government and non-Federal partners to optimize their resources, share technical expertise in a protected environment, share intellectual property emerging from the effort, and speed the commercialization of federally developed technology. A CRADA is an excellent technology transfer tool. It can: Provide incentives that help speed the commercialization of federally-developed technology. Protect any proprietary information brought to the CRADA effort by the partner. Allow all parties to the CRADA to keep research results emerging from the CRADA confidential and free from disclosure through the Freedom of Information Act for up to 5 years. Allow the government and the partner to share patents and patent licenses. Permit one partner to retain exclusive rights to a patent or patent license.49
The proposed CRADA between NPS and ATIRA establishes roles and
responsibilities of each organization, referred to in the CRADA as collaborators. Under
the proposed CRADA, NPS requested $400,000 from ATIRA to conduct research and
testing of ATIRA’s technology and assist ATIRA to transfer the technology into products
that can be used by the Department of Defense in both tactical and operational
environments.50
With a CRADA in the works and armed with a sponsor and initial validation for
the PVPCT, Professor Tudor began soliciting students interested in conducting research
as an MBA project. Students attending the NPS GSBPP are required to complete an
MBA project as a prerequisite to graduation. The purpose of the NPS MBA project is to
have students apply academic theory to solve DOD problems. After meeting with
multiple students, Professor Tudor approved two primary topics for research. The
abstracts for both projects are below for review:
Logistical Impact Study of Photovoltaic Power Converter Technology To The
United States Army And The United States Marine Corps
The purpose of this MBA Project was to analyze the logistical and fiscal impact of replacing selected disposable batteries with rechargeable batteries and photovoltaic power converter chargers within army and
49 www.usgs.gov/tech-transfer/what-crada.html 50 Navy Cooperative Research Agreement, NPS and ATIRA, Low-Light Solar Charger, Draft, page 7

21
Marine Corps infantry battalions. This project was conducted with the sponsorship and assistance of XVIII Airborne Corps, Marine Corps Systems Command, Fleet Numerical, and the Defense Advanced Research Projects Agency. The goal of this project was to identify how this new technology could be incorporated into current combat gear and what impact such an incorporation of the technology would have in decreasing the infantryman’s combat load, reducing expenditures on batteries, and relieving the overall logistical burden for the subject services.
The Photovolatic Power Converter: A Technology Readiness Assessment
The purpose of this project is to examine the Photo Voltaic Power Converter Technology, developed and patented by Atira, as a potential Department of Defense Acquisition program/project. Specifically the project will focus on the Technology Readiness Level (TRL), Critical Operational Issues (COI), and Key Performance Parameters (KPP). The project will evaluate and identify the current Technology Readiness Level (TRL) of the PVPC and develop recommended KPPs and COIs for the system. Additionally we will recommend the appropriate insertion point of the PVPC into the DoD acquisition process.
E. THE DEPARTMENT OF DEFENSE ACQUISITION PROCESS In order to answer our primary, and most of our secondary research questions,
specifically, “what is the appropriate insertion point for the PVPC into the DoD
Acquisition System,” an understanding of the Defense Acquisition System is required.
The following section provides the reader with a brief overview of this system.
The Defense Acquisition System manages the nation’s investments in
technologies, programs, and product support necessary to achieve the National Security
Strategy and support the United States Armed Forces by acquiring quality products that
satisfy the user’s needs for measurable improvements to mission capability and
operational support, in a timely manner, and at a fair and reasonable price.51
1. The Defense Acquisition Framework
The DoD uses a management process based on centralized policies and principles,
known as the Defense Acquisition Management Framework, to allow for the
decentralized and streamlined execution of acquisition activities among and within the
armed services. The vast majority of these centralized policies and principles are
51 Department of Defense Directive (DoDD) 5000.1, page 2.

22
contained in two publications, both of which were updated on 12 May 2003, the
Department of Defense Directive 5000.1 (DoDD 5000.1) and the Department of Defense
Instruction 5000.2 (DoDI 5000.2). This framework is intended to provide flexibility,
responsiveness, and encourage innovation when developing a material solution to fit the
user’s requirement, while also maintaining strict emphasis on discipline and
accountability. A graphic depiction of the Framework is shown in the figure below.
Figure 1. The Defense Acquisition Management Framework (From: DoDI 5000.2, May 12, 2003)
2. Overview of the Acquisition Process Focused on Technology
Assessment52 A program to acquire a new system or capability is normally established in
response to a recognized and validated user need, but it can also be established to exploit
a technological opportunity that might result in a new military capability, a reduced cost,
or other benefit. Within this framework, each program can be structured to achieve the
best balance of cost, schedule, and performance. The process of exploiting new
technology and integrating it into an existing program is know as Horizontal Technology
Insertion (HTI). The PVPC represents such a technological opportunity. It has the
ability to provide a new and added capability to current battery charging systems, reduce
overall costs, and lessen the logistical burden of disposable battery use by allowing for
52 This section is taken, with minor modifications, in its entirety from the DoD Technology
Readiness Assement (TRA) Deskbook, September 2003, section 1.4.

23
the expanded use of rechargeable batteries within the DoD as demonstrated in our
colleagues’ above mentioned MBA project.
The following description of the acquisition system is limited to the elements that
impact technology selection, development, and use in defense system acquisition. DoDI
5000.2 contains a far more complete description of the acquisition system.
Consistent with a joint integrated architecture,53 the Under Secretary of Defense
for Acquisition, Technology, and Logistics (USD(AT&L)) leads “the development of
integrated plans . . .”54 With advice from the Chairman of the Joint Chiefs of Staff
(CJCS) and the Joint Requirements Oversight Council (JROC), multiple DoD
communities “assist in formulating broad, time phased, operational goals, and [in]
describing requisite capabilities in [an] Initial Capabilities Document (ICD).”55 After
analysis of potential system concepts, the ICD describes a selected concept based on
“robust analyses that consider affordability, technology maturity, and responsiveness.”56
The ICD and a plan for an Analysis of Alternatives (AoA) are presented to the
Milestone Decision Authority (MDA) for approval. Approval initiates the Concept
Refinement phase of the process as shown in the previous figure. During Concept
Refinement, the selected concept is refined, and alternative technologies (not alternative
concepts) are analyzed. This analysis includes consideration of the maturity of the
alternative technologies. Whenever the system concept requires technologies that are
promising but still unproven, the Component includes a project for maturing the
technology in a Technology Development Strategy (TDS). Among other things, the TDS
describes how the program will be divided into technology spirals and development
53 The joint integrated architectures are developed collaboratively by the USD(AT&L), the ASD(NII)
(formerly ASD(C3I), the Joint Staff, the Military Departments, the Defense Agencies, Combatant Commanders, and other appropriate DoD Components. See DoDI 5000.2, paragraph 3.2.1.1.
54 DoDI 5000.2, paragraph 3.2.2. 55 Ibid, paragraph 3.4.1. 56 Ibid.

24
increments. The program enters Technology Development (TD) at Milestone A when the
MDA approves the TDS. Generally speaking, the program is not yet considered an
“acquisition program.”57
During TD, the technologies required to design and build the system are pursued
so that they will be sufficiently mature by Milestone B. TD is a continuous technology
discovery and development process that reflects a close collaboration between the user
and the system developer and between the system developer and the technology
developers.58 This phase reduces technology risk and determines which technologies are
mature and should be integrated into a system. For an evolutionary program, this
selection of mature technologies applies to the next increment that will have a Milestone
B. TD continues for subsequent increments, each of which has its own Milestone B.
A Technology Readiness Assessment (TRA) must be conducted before each
Milestone B (and before each Milestone C). One of the criteria for exiting TD is that the
technology has been demonstrated in a relevant environment.59 TD demonstrations are
used to substantiate technology maturity. These demonstrations should use prototypes or
engineering development models (EDMs) at the subsystem level. That is, these items,
after detailed design, should be suitable for integration into the system.
During the TD phase, the Joint Staff produces a Capability Development
Document (CDD) that builds on the ICD and supports the initiation of an acquisition
program. The CDD provides the detailed operational performance parameters necessary
to design the proposed system.
The technologies chosen for the system must provide an affordable increment of
capability.60 This requires that the chosen technologies are producible at an acceptable
cost and production rate. While not explicit in DoDI 5000.2, this implies that
57 Shipbuilding acquisition programs can be initiated at Milestone A. See DoDI 5000.2, paragraph 3.6.3.
58 The system developer and the technology developers may formalize their association with Technology Transition Agreements. Appendix J [of the TRA Handbook] contains an example template for an agreement.
59 DoDI 5000.2, paragraph 3.6.7. 60 DoDI 5000.2, paragraph 3.6.7.

25
manufacturability and producibility have been considered in the selection of technologies
and the assessment of their maturity level.
Milestone B authorizes a program or increment of a program to enter System
Development and Demonstration (SDD). SDD consists of two major efforts (System
Integration and System Demonstration) and a mid-phase Design Readiness Review
(DRR). System Integration is the system design phase during which the chosen
technologies and subsystems are integrated into a detailed system design, and the
manufacturing processes are developed. This effort typically includes demonstration of
prototype articles or EDMs that result from integration of some or all of the subsystems.
The DRR marks the transition to System Demonstration. During System Demonstration,
prototypes are demonstrated in the intended environment, showing that the system can
meet approved requirements.61 This phase must also establish that no significant
manufacturing risk exists and that industrial capabilities are reasonably available.
A new or revised TRA is required before Milestone C. This TRA should reflect
the resolution of any technology deficiencies that arose during SDD and should establish
that all critical manufacturing technologies are mature.
Milestone C follows SDD and authorizes Low Rate Initial Production (LRIP).
LRIP completes manufacturing development to ensure efficient manufacturing capability
and produces production-representative articles for Initial Operational Test and
Evaluation (IOT&E).62
Approval for Full Rate Production (FRP) depends on demonstrating that critical
manufacturing processes are under control and that statistical process control data are
being collected.
61 After DRR, a Capability Production Document (CPD) is finalized by the Joint Staff, and it is validated and approved before Milestone C. Key Performance Parameters (KPPs) from the CPD are inserted verbatim into the acquisition strategy and the Acquisition Program Baseline (APB). See Chairman of the Joint Chiefs of Staff Manual (CJCSM) 3170.01, Operation of the Joint Capabilities Integration and Development System, dated 24 June 2003, Enclosure F paragraphs 1. and 2, ( http://www.teao.saic.com/jfcom/ier/documents/m317001.pdf ).
62 From DoDI 5000.2, 3.8.3.4. “LRIP is not applicable to AISs or software-intensive systems with no developmental hardware; however a limited deployment phase may be applicable. Software shall have demonstrated the maturity level required in the CPD before deploying it to the operational environment.” An AIS is an automated information system.

26
The framework just described can be tailored to a specific acquisition program
structure. For example, the program does not have to start at Concept Refinement. It can
start at any point consistent with phase-specific entrance criteria and statutory
requirements. If it starts at or beyond Milestone B, an associated TRA is conducted to
ensure that the technology is ready for the upcoming phase of acquisition. Normally, a
program is not considered an “acquisition program” until it has passed Milestone B.
DoDI 5000.2 establishes evolutionary development as the strategy DoD prefers:
3.3.2. The approaches to achieve evolutionary acquisition require collaboration between the user, tester, and developer. They include:
3.3.2.1. Spiral Development. In this process, a desired capability is identified, but the end-state requirements are not known at program initiation. Those requirements are refined through demonstration and risk management; there is continuous user feedback; and each increment provides the user the best possible capability. The requirements for future increments depend on feedback from users and technology maturation.
3.3.2.2. Incremental Development. In this process, a desired capability is identified, an end-state requirement is known, and that requirement is met over time by developing several increments, each dependent on available mature technology.
For hardware systems, evolutionary development normally uses incremental
development. Each successive design unit is called an increment (Increment 1, Increment
2, and so forth). To ensure that the technology is mature, a TRA is required for each
increment before the program has a Milestone B or Milestone C review for that
increment.63
Software is normally developed using the spiral development process. This is an
iterative, cyclical process of build-test-fix-test-deploy. Each release builds on the lessons
of the previous release. There can be several releases during the acquisition and
deployment of a system or system increment. In the TRA process, software is considered
an integral part of the system or subsystem in which it operates. Therefore,
63 DoDI 5000.2, paragraph 3.7.2.4 and Table E3.T2.

27
demonstration of a technology at the subsystem or system level must include
demonstration of the associated software. The Army, for its use, has defined TRLs for
software.64
F. TECHNOLOGICAL READINESS LEVELS This section provides a general background on the Technology Readiness Level
(TRL) concept and includes the purpose and origin of TRLs, Department of Defense
roles and responsibilities regarding Technology Readiness Assessments (TRAs), and
Statutory and regulatory information requirements. Chapter III presents a more detailed
description of each TRL level and the TRA process.
1. TRL Purpose and Origin Science is the “observation, identification, description, and experimental
investigation and theoretical explanation of phenomenon”65 and technology is “the
application of science”.66 Thus, it is the application of science that is often the driving
force behind the new systems and equipment developed by DoD for use by the armed
forces. Consequently, the maturity level of the technology can directly impact program
success. Technology Readiness Levels are a consistent measurement to categorize the
maturity level of a program’s key technologies and provide a common language or
reference to the science and technology community within the DoD Acquisition process.
Further, the definitions for each readiness level are applicable across the broad spectrum
of technologies in both hardware and software.
The conception of a common metric for technology maturity was born in the
National Aeronautical and Space Administration in the mid 1980’s. NASA developed
seven levels beginning with level one, the basic Principle Observed and Reported, and
ending with level seven, System Adequacy Validated in Space. The Air Force began to
incorporate the TRL concept into its programs in the early 1990s and then on April 6,
1995, John C. Mankins, a NASA employee, published a white paper clearly defining nine
64 The Army’s TRL for Software can be found in Appendix G of the TRA Handbook. 65 The American Heritage Dictionary of the English Language, Fourth Edition, Houghton Mifflin
Company, 2002 66 Ibid

28
different technology readiness levels.67 The next key publication on TRLs was GAO
Report 99-162, released in 1999. The GAO conducted extensive research of government
and commercial programs and their incorporation of 23 new technologies into a variety
of products and weapons systems. The report identified a direct correlation between the
maturity level of critical technologies integrated and program success, and recommended
that the DoD adopt a stringent TRL maturity assessment program. In 2001, the Under
Secretary of Defense for Science and Technology formally adopted GAO
recommendations by issuing a memorandum endorsing use of TRL metrics for new
programs. Finally, in 2003, DoD provided comprehensive guidance for the acquisition
community by publishing the DoD Technology Readiness Assessment Deskbook.68
2. DoD Roles and Responsibilities Regarding TRA In addition to providing definitions for TRLs and a process to conduct a
Technology Readiness Assessment, the DoD Technology Readiness Assessment
Deskbook documents the roles and responsibilities of service components, DoD offices,
and agencies to conduct the TRAs suggested by DODD 5000.1, DODI 5000.2 and
Interim Guidance. The summary below lists these roles and responsibilities.69
a. Secretary of Defense
• Reports to Congress on the implementation of DoD policy regarding maturity at the initiation of MDAPs IAW Sec. 804 of the NDAA for fiscal Year 2002 Conference Report
b. Deputy Under Secretary of Defense for Science and Technology
(DUSD(S&T))
• Provides oversight of during technology development of a program • Oversight and evaluation responsibilities for the TRA • Reviews component TRAs and concurs or conducts independent TRA • Submits findings to OIPT and the DAB • Recommends if technology is mature enough at each milestone review
67 John C. Mankins, Technology Readiness Levels, White Paper, NASA, April 6, 1995. 68 Wikipedia, the free encyclopedia, http://en.wikipedia.org/wiki/Technology_Readiness_Level,
[October 2004] 69 Appendix C presents, in its entirety, appendix B from the TRA Deskbook which includes from
DoDD 5000.1, DoDI 5000.2, and the Interim Guidebook extracts that establish or suggest TRA roles and responsibilities.

29
• Prepares Submits DoD technology implementation and technology readiness reports IAW Sec.804 of the NDAA for fiscal year 2002 Conference Report
c. Component Acquisition Executive (CAE)
• Approving authority for ACAT I and ACAT IA TRAs • Submits action copy of TRA to DUSD(S&T) with a TRL assessment
for each critical technology for ACAT ID and ACAT IAM programs • Reports through the Component Secretary to the USD(AT&L)
d. Component Science and Technology (S&T) Executive
• Develops non-commercial technologies that the component needs for to meet future operational requirements
• Advises PMs regarding status and applicability of new technologies • Provides resources and development support during Technological
Development phase before Milestone B • Directs the component’s TRAs and establishes process • Signs TRAs and accepts responsibility for its accuracy for ACAT ID
and ACAT IAM programs • Reports to CAE
e. Program Manager:
• Guides development during technological development and prepares for Milestone B
• Submits memorandum to DUSD(S&T) and Component S&T describing process the PM will use to identify critical technologies for the program
• Identifies critical technologies for the program and details the function of each technology and status of the technologies development
• Requests Milestone B and C reviews and schedules submission of critical technologies
• Provide program updates to the Defense Acquisition Board on technology maturity, risk management, affordability, technological protection and rapid insertion.
• Address any interoperability and supportability requirements linked to other systems
• Form and lead an IPT for the program • Coordinates TRA activities with DUSD(S&T) and Component S&T as
appropriate • Reports to PEO who in return reports to the CAE

30
3. Statutory and Regulatory Information Requirements for TRAs As previously discussed, TRAs of critical technologies for each program are
required at the major milestone reviews. The Tables below present the information
required, the applicable statute or regulation, and when it is required.
Table 1. Statutory and Regulation Information Requirements (After: Technology
Readiness Assessment Deskbook) Statutory Information Requirements
Information Required Applicable Statute When Required Consideration of Technology
Issues 10 U.S.C. 2364, reference
(q) Milestone (MS) A, B,
and C Technology Development
Strategy (TDS) Sec. 803, Pub.L. 107-314,
reference (an) MS A, B, and C
Regulatory Information Requirements Information Required Regulatory Source When Required
Program Initiation for Ships
Preliminary Assessment
Technology Readiness Assesment
DoDI 5000.2, dated May 12, 2003
MS B and C Independent Technology
Asssesment (ACAT ID only) (If required by DUSD(S&T)
DoDI 5000.2, dated May 12, 2003
MS B and C
Program Initiation for Ships
Preliminary Assessment
Commnand, Control, Communications, Computers, and Inteilligence Support Plan
(C4ISP)
DoDI 4630.8 and DoD Directive 4630.5,
references (ar) and (as)
MS B and C

31
III. DATA
A. INTRODUCTION This section of the paper provides greater detail on how the PVPC works, presents
test data from various sources, provides a more in depth description of the TRA process,
and discusses points and methods by which the technology can be inserted into the
acquisition framework.
B. PRODUCT DESCRIPTION: CONVERTING SOLAR POWER To understand what the PVPC does, it helps to understand the environment in
which it operates. The power (Watts) generated by a PV panel varies significantly based
on three primary factors: the efficiency of the panel itself, the amount of sunlight hitting
the surface of the panel, and the load applied to the system. The efficiency of the panel is
a function of the material used to construct it, and once constructed, cannot be changed.
The amount of light hitting the surface of the panel depends on external environmental
and geographical factors, such as the latitude at which the panel is located or the amount
of shadow cast on the panel by terrestrial objects or clouds. In our tests, we measured the
amount of light hitting the surface of the panel in Lumens per square meter (otherwise
known as Lux). In our research, we found that another commonly used measure of the
energy striking the surface of the panel is Watts per square meter (W/m2). Lastly, the
attached devices that require power (a laptop computer, calculator, or a battery in our
case) represent the load applied to the system.
Commercially available panels, typically with low conversion efficiencies of 10%
or less, have power outputs that are extremely sensitive to lighting conditions and the
load factor placed on the system. As the amount of light energy striking the surface of
the panel varies, the potential power the panel can produce is constantly in flux. If the
light energy falling on the panel is insufficient to generate the required Voltage or
Amperage needed, the load will shut off or cease to charge. The panel is still producing
power, but either the Voltage or Amperage components are insufficient to meet the
threshold requirements of the load; therefore, no usable power is being produced.

32
Figure 2 below shows a plot of Current (in milliamps on the Y axis) vs. Voltage
(on the X axis) produced by a Solengy solar cell (red) and a competitors cell (blue) under
decreasing light energy levels from 200W/m2, 100W/m2, and finally 50W/m2
respectively. This figure graphically represents the decreasing light scenario mentioned
above in which the light energy at 50W/m2 does not generate enough voltage for the
lowest blue line to intersect the 12V battery’s charging window.
Figure 2. Low Light Effect on Battery Charging (After: <http://www.solengy.com/pages/whitepapers.html>, April 2005)
Alternatively, if the load attached to the system attempts to draw too much current
(Amps) from the panel, even in good lighting conditions, the Voltage across the circuit
will drop to zero and no power is produced (0V * XAmps = 0Watts). This scenario is
depicted in the figure above by starting at the left of any line and noticing that at
maximum amperage achieved, the voltage is zero, which means no power is being
produced.
To address the variability of the amount of light energy striking the panel and the
varying demands of the load, the PVPC incorporates two critical technologies –
Maximum Power Point Tracking (MPPT) and Switch Mode Power Conversion (SMPC).
Panel Voltage (V)
12

33
Both of these technologies are proven and have been commercially available for years.
Making use of these two technologies, Atira claims it can recover as much as 25% of the
available power that is currently wasted in conventional conversion techniques; thereby
essentially increasing the overall efficiency of the PV system [not the cell itself] by this
amount.70 The PVPC is unique because it applies these technologies to an area of low
power production, namely photovoltaic panels, which had previously received little
attention from power conversion designers.
1. Maximum Power Point Tracking (MPPT) The concept behind MPPT is that the circuit continuously monitors and optimizes
the interface between the solar panel and the load/battery. The only way to continuously
maximize the power output based on these two ever-changing inputs is for the output
load to be constantly adjusted based on the level of exposure of the PV panel to the sun.
However, current MPPT circuits are designed only to optimize the panel input within a
narrow range, as shown in Figure 2. In other words, when the light energy striking the
surface of the panel is sufficient to generate a voltage that is within the battery’s charging
window, the MPPT circuit maximizes the amount of power that can be produced by that
amount of light. If the light energy is insufficient to cross the threshold, no power is
produced – it only maximizes what makes it into the window. The result is a PV panel
with a specific nominal voltage, such as the Solengy panel graphed above (12V panel)
matched to the load of a 12V battery. The panel cannot charge a load that exceeds its
voltage window, such as an 18V battery. Below in Figure 3 is a schematic of a standard
MPPT circuit.
70 Alexander Wolf, “Photovoltaic Power Conversion Technology Enhancements: Design a circuit that
will track max pwr pt,” (Unpublished Document, Atira Technologies, Los Gatos, CA: 2004), 2

34
Figure 3. Schematic of Maximum Power Point Tracking Circuit. (From:
<http://www.elecdesign.com/Articles/ArticleID/6262/6262.html>, April 2005)
2. Switch Mode Power Conversion Switch mode power conversion is the method by which the PVPC continuously
adjusts the output load based on the amount of sunlight striking the surface of the panel.
“In all applications of switch mode power conversion, input power to the converter is
equal to the output power generated by the converter, assuming no losses within the
conversion process. Simply stated, 6 volts at 1 amp [output of the solar panel] is
converted to 12 volts at 0.5 amps [by the PVPC].”71 If the load on the PV system is a
typical 12V battery, it has an approximate charging window between 11V and 14V.
Voltages produced by the panel that are less than 11V or more than 14V are unusable for
charging the battery and therefore wasted energy (as shown in Figure 2). However, if
you change the component characteristics of the power so that the 6V and 1A produced
by the panel is converted into 12V and 0.5A, the threshold for battery charging is
achieved. Also, if the SMPC can convert the 6V and 1A into 18V and .33A it can now
charge an 18V battery, something a 12V panel could never do before. By using the
71 David A. Besser, “Photovoltaic Power Conversion Technology: Reserved Backup Power,”
(Unpublished Document, Atira Technologies, Los Gatos, CA: May 12, 2004), 2

35
second concept of switch mode power conversion, the PVPC can both expand the range
of batteries it can charge or applications it can power and extend the usable range of input
solar energy.
The PVPC changes the components of the power equation by switching the mode
of the power, produced by the panel, from Direct Current (DC) to Alternating Current
(AC). Once switched to AC, the energy now has another component characteristic –
frequency, as measured in Hertz (Hz). By modulating the frequency to a higher level and
then switching back to DC, the voltage is dramatically increased and the current is
proportionally decreased to stay within the laws of V*A =W. The result is a usable
voltage level being produced by the system that can satisfy the load, whereas before
voltage produced was too low to be usable. In the situation just discussed in which the
panel is only producing unusable power, it can be argued that PVPC infinitely improves
the system. We designed our tests to determine if a solar power system with the PVPC
integrated produces more power than a system without the technology.
3. Relevant Range of the PVPC Currently, Atira is building the PVPC by hand from commercially available
components. Each PVPC is built to optimize a particular panel’s power production. The
three PVPC circuits we tested are known as the 0512, 0916, and the 1216 circuit boards.
The first two numbers of each four number grouping indicate the input Voltage of the
panel the circuit was designed to optimize. While the last two numbers give the nominal
upper Voltage limit the circuit can produce based upon that input voltage. For instance,
the 0916 circuit is designed to optimize the power output of a 9V solar panel and can
increase that Voltage up to about 16V. Therefore, as currently produced, one size does
not fit all applications. When constructing the PVPC, designers must consider the
particular power production characteristics of the solar panel as well as the power
requiring characteristics of the load.
The original PVPC circuit was the 1216, designed to work with the 12V Solengy
glass panel. The 1216 was then subsequently modified into the 0916 to work with the 9v
Uni-Solar LM-3 panel. The modification was done as a proof of concept to show that

36
with the 0916 PVPC a 9V panel could indeed charge a 12V battery (see Table 2 test
results). However, the design was never matured to optimize at the 9V input level (see
Table 12 test results).
4. Physical Description Figure 4, below, shows the physical appearance of the PVPC at the time of our
April 2005 tests. Atira currently builds the PVPC by hand, on a printed circuit board
with various capacitors, inductors, resistors, and input and output receptacles soldered on.
It is 1.9375 inches (horizontally) by 1.625 inches (vertically) as shown below.
Figure 4. Digital Photograph of the PVPC
5. Next Generation of the PVPC72 For any new technology or product, the ability to economically manufacture is an
important consideration. Atira realizes that the current method of production cannot
support large orders. With this in mind, the company is working with potential
manufacturers to both miniaturize and mass-produce the technology. “In its final form,
the PVPC will be an integrated circuit not much larger than a postage stamp”. They also
see the need to give the PVPC its own automated processor, so it can optimize
electronically, over a far greater range of input panel voltage and power, what it is now
doing with hand-soldered hardware. “The next generation PVPC will be designed with a
72 Stephan Matan, PVPC Inventor, telephone conversation with authors, 4 May 2005.

37
built in microprocessor that will allow it to optimize input Voltage from zero to 30V and
power from zero to 200W to meet the demand of the load”.
The manufacturing and miniaturization technologies to build microprocessors and
other electronic components are mature. The ability to literally grow the silicon crystals
and print the circuit pattern on the wafer is known as photolithography. This is a
manufacturing method routinely applied in fabrication facilities where chips such as Intel
or AMD microprocessors are manufactured, which allows the wafer to electronically
replicate the hardware shown in Figure 4.
6. Summary of How It Produces Power Based on the preceding explanation of the two critical PVPC operating
characteristics, we provide the following concise description of how it produces usable
power. Using switch mode power conversion, the PVPC continuously modifies the
characteristics of the inherently variable power produced by the panel to provide the
maximum amount of usable power, within a relevant range, to the attached load; it does
this based on its changing power requirements, as determined by the maximum power
point tracking circuit.
C. PRODUCT TEST DATA This section presents the data collected from multiple tests conducted to evaluate
the PVPC. We grouped test data according to the primary organization that conducted
the tests. Item 1, Atira Technologies Comparison Tests, presents data for tests conducted
by Atira Technologies. Item 2, NPS Field Tests, presents data from independent tests
conducted by the authors of this project. Item 3, Raven Designs Field Tests, concludes
the presentation of test data section of this report. In this chapter, we present only the
data and conditions for each of the tests. We discuss the analysis and conclusions for the
tests in Chapter IV.
1. Atira Technologies Comparison Tests Atira Technologies conducted comparison tests using Uni-Solar flexible solar
panels and the Global Solar P-4 Array. The test approach used was a side-by-side
comparison of solar power systems using procedures that measured the PVPC’s

38
performance levels. Each test consisted of testing two identically configured systems,
one with and one without the PVPC technology integrated.
a. Atira LM-3 Test with 12V Load On 8 February 2005, Atira Tech used the Uni-Solar LM-3 modules and
UBC36106102/PCM Ultra-Life Polymer 3.7V Rechargeable batteries for these tests
(Figure 5). For each solar system, Atira representatives wired three Ultra-Life Polymer
batteries in series to create a 12V battery load.
Figure 5. Uni-Solar LM-3 Solar Module and Ultra-Life Polymer Battery73
The key data elements recorded during the tests were the current and load.
For each solar power system, Atira measured performance of the systems in Volts and
current in milliamperes (milliamps or mA). Presented below is the data for the LM-3
tests conducted by Atira.
73 Picture of Ultra-Life Polymer Battery From: Electronic Product Brochure,1.

39
Table 2. LM-3 12V Test, Feb 8, 2005
Time mA V Watts mA V Watts0730 0 11.43 0 0 11.59 00800 0 11.43 0 4 11.59 46.360830 10 11.43 114.3 4 11.59 46.360845 25 11.43 285.75 40 11.59 463.60915 50 11.43 571.5 100 11.59 11590920 50 11.43 571.5 100 11.60 11601000 50 11.43 571.5 100 11.59 11591200 50 11.43 571.5 100 11.66 11661245 10 11.43 114.3 50 11.66 5831315 50 11.43 571.5 100 11.69 11691345 20 11.43 228.6 75 11.73 879.751430 10 11.43 114.3 75 11.73 879.751515 0 11.43 0 50 11.73 586.51545 0 11.43 0 50 11.73 586.51615 0 11.43 0 50 11.73 586.51645 0 11.43 0 50 11.73 586.51715 0 11.43 0 0 11.73 01716 0 11.43 0 0 11.73 0
Standard System PVPC System
LM3 12V Test (Feb 8)
b. Atira LM-3 Test with Programmable Fixed Load Atira Tech used the Uni-Solar LM-3 modules and the HP 6063B DC
Programmable Electronic Load system for this test. The HP 6063B is a programmable
DC load bank that is used to apply a consistent and specific load source to the test
systems simultaneously. The test approach was a side-by-side comparison test. The goal
of the test was to measure the power output of the Standard system and the PVPC system
under identical conditions and using identical loads. Using the HP 6063B, Atira began
with a minimum load of 0.5V and incrementally increased the loads by 0.5V until they
reached a maximum load of 16.5V for each system. For this test, Atira integrated a 0916
PVPC circuit board. Table 3 presents the data for this test.

40
Table 3. LM-3 Test with Programmable Fixed Load, Feb 20, 2005
Voltage (V)
Current (mA)
Watts (mW)
Voltage (V)
Current (mA)
Watts (mW)
Voltage (V)
Current (mA)
Watts (mW)
Voltage (V)
Current (mA)
Watts (mW)
0.5 210 105 0.5 790 395 8.5 180 1530 8.5 150 12751 210 210 1 650 650 9 180 1620 9 140 1260
1.5 200 300 1.5 550 825 9.5 170 1615 9.5 130 12352 200 400 2 470 940 10 160 1600 10 120 1200
2.5 200 500 2.5 400 1000 10.5 140 1470 10.5 120 12603 200 600 3 350 1050 11 110 1210 11 110 1210
3.5 200 700 3.5 320 1120 11.5 70 805 11.5 110 12654 200 800 4 280 1120 12 20 240 12 100 1200
4.5 200 900 4.5 260 1170 12.5 0 0 12.5 100 12505 200 1000 5 230 1150 13 0 0 13 100 1300
5.5 200 1100 5.5 210 1155 13.5 0 0 13.5 90 12156 190 1140 6 200 1200 14 0 0 14 90 1260
6.5 190 1235 6.5 190 1235 14.5 0 0 14.5 90 13057 190 1330 7 170 1190 15 0 0 15 80 1200
7.5 190 1425 7.5 160 1200 15.5 0 0 15.5 80 12408 190 1520 8 150 1200 16 0 0 16 70 1120
16.5 0 0 16.5 0 0
System without PVPC System with PVPC System without PVPC System with PVPCLM-3 Flex Test w/ Programable Fixed Load
c. Atira P-4 Test with Programmable Fixed Load Atira Tech used the Global Solar P-4 Array and the HP 6063B DC
Programmabale Electronic Load system for this test. The Global Solar P-4 Array (Figure
6) consists of 18 individual Global Solar modules. Each module produces 1.67 volts.
Atira integrated six 0516 PVPC circuit boards in a 3:1 module to circuit board ratio.
Figure 6. Global Solar P-4 Array (From: Atira Technologies)
The HP 6063B is a programmable DC load bank that is used to apply a
consistent and specific load source to the test systems simultaneously. The goal of the
test was to measure the power output of the Standard system and the PVPC system under
identical conditions. Using the HP 6063B, Atira began with a minimum load of 1V and

41
incrementally increased the loads by 0.5V until they reached a maximum load of 33V for
each system. Table 4 presents the data for this test.
Table 4. Global Solar P-4 Test with Programmable Fixed Load
Voltage (V)
Current (mA) Watts (mW)
Voltage (V)
Current (mA) Watts (mW) Voltage (V)
Current (mA)
Watts (mW)
Voltage (V)
Current (mA)
Watts (mW)
1 1870 1870 1 8800 8800 17.5 1110 19425 17.5 1190 208251.5 1850 2775 1.5 7500 11250 18 1090 19620 18 1140 205202 1840 3680 2 6900 13800 18.5 1060 19610 18.5 1100 20350
2.5 1820 4550 2.5 6000 15000 19 1030 19570 19 1040 197603 1810 5430 3 5480 16440 19.5 980 19110 19.5 990 19305
3.5 1790 6265 3.5 5000 17500 20 950 19000 20 960 192004 1780 7120 4 4550 18200 20.5 890 18245 20.5 900 18450
4.5 1760 7920 4.5 4200 18900 21 860 18060 21 880 184805 1740 8700 5 3820 19100 21.5 780 16770 21.5 800 17200
5.5 1720 9460 5.5 3500 19250 22 710 15620 22 780 171606 1710 10260 6 3320 19920 22.5 650 14625 22.5 700 15750
6.5 1690 10985 6.5 3000 19500 23 590 13570 23 610 140307 1670 11690 7 2900 20300 23.5 500 11750 23.5 500 11750
7.5 1650 12375 7.5 2750 20625 24 470 11280 24 470 112808 1630 13040 8 2590 20720 24.5 420 10290 24.5 420 10290
8.5 1610 13685 8.5 2410 20485 25 310 7750 25 320 80009 1590 14310 9 2320 20880 25.5 110 2805 25.5 290 7395
9.5 1560 14820 9.5 2200 20900 26 80 2080 26 260 676010 1540 15400 10 2110 21100 26.5 0 0 26.5 240 6360
10.5 1520 15960 10.5 2000 21000 27 0 0 27 220 594011 1510 16610 11 1920 21120 27.5 0 0 27.5 190 5225
11.5 1490 17135 11.5 1810 20815 28 0 0 28 160 448012 1470 17640 12 1770 21240 28.5 0 0 28.5 140 3990
12.5 1450 18125 12.5 1700 21250 29 0 0 29 120 348013 1410 18330 13 1630 21190 29.5 0 0 29.5 90 2655
13.5 1390 18765 13.5 1580 21330 30 0 0 30 80 240014 1360 19040 14 1520 21280 30.5 0 0 30.5 60 1830
14.5 1330 19285 14.5 1490 21605 31 0 0 31 40 124015 1300 19500 15 1410 21150 31.5 0 0 31.5 25 787
15.5 1260 19530 15.5 1380 21390 32 0 0 32 10 32016 1220 19520 16 1330 21280 32.5 0 0 32.5 5 162
16.5 1180 19470 16.5 1290 21285 33 0 0 33 0 017 1140 19380 17 1240 21080
System without PVPC System with PVPC System without PVPC System with PVPCGlobal Solar P-4 Test w/ Programable Fixed Load
2. NPS Field Tests We independently tested the PVPC April 6-11, 2005. Our objective was to
validate the tests conducted by Atira Technologies and to verify that a solar power system
integrated with the PVPC technology would produce more power than an identical
system without the technology. The test approach used was a side-by-side comparison of
solar power systems using procedures that measured the PVPC’s performance levels. We
conducted the tests in the uncontrolled, natural environment that existed on the scheduled
test days with the intention of capturing performance data relevant to a typical temperate
climate. Each test consisted of using two identically configured systems, one with and
one without the PVPC technology (Figure 7). The test plan provided in appendix A,
details the setup and procedures we used to conduct each test.

42
Figure 7. NPS PVPC Field Test Configurations
The key data elements of the tests were the performance results of the solar power
systems. For each solar power system, we measured performance of the systems in Volts
and current in milliamps (mA). To measure relevant light conditions of the environment,
we used light meter readings (Lux). We recorded data photographically to capture an
instantaneous “snapshot” and to ensure exact readings of all meters at the same point in
time. We then transferred the photographic data elements for the Volts, mA and Lux to a
spreadsheet for presentation and analysis. Additional data recorded during the test
included solar panel surface temperature readings and hourly weather conditions in the
area. We recorded this data to further document relevant light and environmental
conditions in order to help the reader understand the actual conditions during the test and
correlate them to the Lux meter readings.
a. Glass Panel-7.4V Battery Field Performance Test The solar panels used for the glass panel 7.4V tests were Solengy ASI-F
5/12 framed solar modules. The batteries used were UBC36106102/PCM Ultra-Life
Polymer 3.7V Rechargeable batteries. For each system, we wired two of these batteries
in series to create a 7.4V battery load for glass tests 1-3. The PVPC technology circuit
board was a model 1216. Tables 5-7 present the data for Glass Panel Tests 1 through 3.

43
Table 5. Glass Test 1 With 7.4V Battery
Array Temp
Battery Current
(mA)Battery Voltage
Watts (mW)
Array Temp
Battery Current
(mA)Battery Voltage
Watts (mW)
8:00 AM 25800 63 100 7.76 776.0 61 135 7.71 1040.858:15 AM 34400 71 125 7.78 972.5 67 160 7.74 1238.48:30 AM 18400 62 52 7.75 403.0 58 98 7.71 755.588:45 AM 21100 61 70 7.76 543.2 58 100 7.73 7739:00 AM 24000 61 81 7.77 629.4 58 125 7.75 968.759:15 AM 28200 64 100 7.78 778.0 63 150 7.75 1162.59:30 AM 72000 99 250 7.83 1957.5 97 380 7.85 29839:45 AM 70600 101 270 7.84 2116.8 99 400 7.87 3148
10:00 AM 64200 92 225 7.84 1764.0 89 360 7.87 2833.210:15 AM 66900 96 250 7.87 1967.5 95 375 7.9 2962.510:30 AM 82400 105 300 7.9 2370.0 102 425 7.93 3370.2510:45 AM 60900 96 220 7.92 1742.4 92 330 7.94 2620.211:00 AM 71600 86 235 7.94 1865.9 83 370 7.96 2945.211:15 AM 64400 88 245 7.96 1950.2 81 350 7.99 2796.511:30 AM 60600 92 220 7.98 1755.6 86 320 8.02 2566.411:45 AM 96800 92 325 8.03 2609.8 85 460 8.08 3716.8
Glass A Glass B With PVPCGlass Test 1 With 7.4V Battery (6 April 05)
Light Reading
(Lux)Time
Table 6. Glass Test 2 With 7.4V Battery
Array Temp
Battery Current
(mA)Battery Voltage
Watts (mW)
Array Temp
Battery Current
(mA)Battery Voltage
Watts (mW)
12:15 PM 72600 105 308 7.23 2226.8 99 452 7.26 3281.512:30 PM 102200 110 409 7.41 3030.7 105 535 7.53 4028.612:45 PM 70900 104 257 7.46 1917.2 96 401 7.59 3043.61:00 PM 99100 110 390 7.56 2948.4 105 502 7.69 3860.41:15 PM 98500 117 376 7.57 2846.3 109 494 7.72 3813.71:30 PM 99100 115 377 7.58 2857.7 108 476 7.75 3689.01:45 PM 98900 113 369 7.61 2808.1 108 473 7.79 3684.72:00 PM 97800 112 359 7.63 2739.2 107 456 7.82 3565.92:15 PM 97000 109 347 7.65 2654.6 103 450 7.85 3532.52:30 PM 95400 110 336 7.67 2577.1 105 430 7.87 3384.12:45 PM 93300 107 318 7.69 2445.4 101 412 7.89 3250.73:00 PM 91300 107 305 7.7 2348.5 101 398 7.91 3148.23:15 PM 88900 99 287 7.72 2215.6 94 380 7.93 3013.43:30 PM 85700 96 270 7.73 2087.1 91 358 7.95 2846.13:45 PM 83200 92 253 7.75 1960.8 91 341 7.98 2721.24:00 PM 78300 86 230 7.75 1782.5 83 314 8 2512.04:15 PM 75600 85 211 7.76 1637.4 82 288 8.01 2306.94:30 PM 71700 77 192 7.77 1491.8 76 264 8.04 2122.64:45 PM 55900 69 118 7.76 915.7 66 166 8.03 1333.05:00 PM 33000 64 73 7.76 566.5 62 110 8.03 883.35:15 PM 47200 64 110 7.77 854.7 64 155 8.05 1247.85:30 PM 28600 73 78 7.77 606.1 69 120 8.06 967.2
Glass B With PVPCGlass AGlass Test 2 With 7.4V Battery (6 April 05)
Light Reading
(Lux)Time

44
Table 7. Glass Test 3 With 7.4V Battery
Array Temp
Battery Current
(mA)Battery Voltage
Watts (mW)
Array Temp
Battery Current
(mA)Battery Voltage
Watts (mW)
7:15 AM 500 50 2 7.5 15 50 0 7.41 07:30 AM 1400 51 5 7.5 37.5 51 0 7.41 07:45 AM 1800 51 7 7.51 52.57 51 0 7.41 08:00 AM 3600 52 14 7.52 105.28 52 3 7.42 22.268:15 AM 7100 47 24 7.53 180.7 48 22 7.43 163.468:30 AM 9700 49 33 7.54 248.8 49 39 7.46 290.948:45 AM 13900 50 46 7.55 347.3 50 63 7.49 471.879:00 AM 8100 57 26 7.54 196.0 55 26 7.48 194.489:15 AM 900 54 32 7.55 241.6 52 37 7.49 277.139:30 AM 11700 54 37 7.55 279.4 53 48 7.51 360.489:45 AM 25700 59 101 7.6 767.6 57 159 7.58 1205.2210:00 AM 33700 62 121 7.61 920.8 59 187 7.6 1421.210:15 AM 24000 63 87 7.6 661.2 60 147 7.59 1115.7310:30 AM 42100 63 125 7.63 953.8 61 188 7.61 1430.6810:45 AM11:00 AM 39500 62 104 7.63 793.5 60 163 7.64 1245.3211:15 AM 40600 62 106 7.64 809.8 59 159 7.65 1216.3511:30 AM 52500 65 134 7.64 1023.8 62 208 7.68 1597.4411:45 AM 68100 76 183 7.65 1400.0 69 275 7.71 2120.25
Data was not collected for this period.
Glass Test 3 With 7.4V Battery (7 April 05)Glass A Glass B With PVPC
Light Reading
(Lux)Time
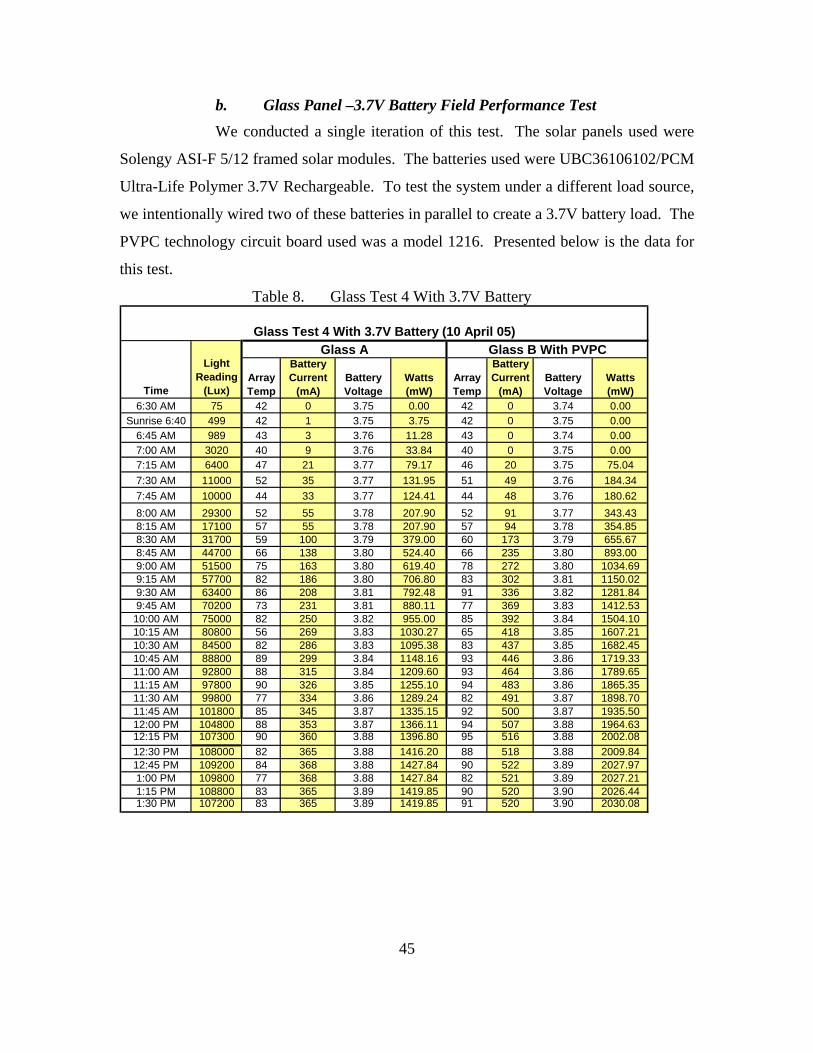
45
b. Glass Panel –3.7V Battery Field Performance Test We conducted a single iteration of this test. The solar panels used were
Solengy ASI-F 5/12 framed solar modules. The batteries used were UBC36106102/PCM
Ultra-Life Polymer 3.7V Rechargeable. To test the system under a different load source,
we intentionally wired two of these batteries in parallel to create a 3.7V battery load. The
PVPC technology circuit board used was a model 1216. Presented below is the data for
this test.
Table 8. Glass Test 4 With 3.7V Battery
Array Temp
Battery Current
(mA)Battery Voltage
Watts (mW)
Array Temp
Battery Current
(mA)Battery Voltage
Watts (mW)
6:30 AM 75 42 0 3.75 0.00 42 0 3.74 0.00Sunrise 6:40 499 42 1 3.75 3.75 42 0 3.75 0.00
6:45 AM 989 43 3 3.76 11.28 43 0 3.74 0.007:00 AM 3020 40 9 3.76 33.84 40 0 3.75 0.007:15 AM 6400 47 21 3.77 79.17 46 20 3.75 75.047:30 AM 11000 52 35 3.77 131.95 51 49 3.76 184.347:45 AM 10000 44 33 3.77 124.41 44 48 3.76 180.628:00 AM 29300 52 55 3.78 207.90 52 91 3.77 343.438:15 AM 17100 57 55 3.78 207.90 57 94 3.78 354.858:30 AM 31700 59 100 3.79 379.00 60 173 3.79 655.678:45 AM 44700 66 138 3.80 524.40 66 235 3.80 893.009:00 AM 51500 75 163 3.80 619.40 78 272 3.80 1034.699:15 AM 57700 82 186 3.80 706.80 83 302 3.81 1150.029:30 AM 63400 86 208 3.81 792.48 91 336 3.82 1281.849:45 AM 70200 73 231 3.81 880.11 77 369 3.83 1412.5310:00 AM 75000 82 250 3.82 955.00 85 392 3.84 1504.1010:15 AM 80800 56 269 3.83 1030.27 65 418 3.85 1607.2110:30 AM 84500 82 286 3.83 1095.38 83 437 3.85 1682.4510:45 AM 88800 89 299 3.84 1148.16 93 446 3.86 1719.3311:00 AM 92800 88 315 3.84 1209.60 93 464 3.86 1789.6511:15 AM 97800 90 326 3.85 1255.10 94 483 3.86 1865.3511:30 AM 99800 77 334 3.86 1289.24 82 491 3.87 1898.7011:45 AM 101800 85 345 3.87 1335.15 92 500 3.87 1935.5012:00 PM 104800 88 353 3.87 1366.11 94 507 3.88 1964.6312:15 PM 107300 90 360 3.88 1396.80 95 516 3.88 2002.0812:30 PM 108000 82 365 3.88 1416.20 88 518 3.88 2009.8412:45 PM 109200 84 368 3.88 1427.84 90 522 3.89 2027.971:00 PM 109800 77 368 3.88 1427.84 82 521 3.89 2027.211:15 PM 108800 83 365 3.89 1419.85 90 520 3.90 2026.441:30 PM 107200 83 365 3.89 1419.85 91 520 3.90 2030.08
Glass Test 4 With 3.7V Battery (10 April 05)Glass A Glass B With PVPC
Light Reading
(Lux)Time

46
c. Flexible Panel-7.4V Battery Field Performance Test: We conducted a single iteration of this test. The solar panels used for the
flexible panel 7.4V tests were Uni-Solar LM-3 modules. Each system utilized an array of
three LM-3 modules. The batteries used were UBC36106102/PCM Ultra-Life Polymer
3.7V Rechargeable batteries with two batteries wired in series to create a 7.4V battery
load. The PVPC technology circuit board used was a model 0916. Table 9 presents the
data for this test.
Table 9. Flexible Panel Test With 7.4V Battery
Array Temp
Battery Current
(mA)Battery Voltage
Watts (mW)
Array Temp
Battery Current
(mA)Battery Voltage
Watts (mW)
10:30 AM 84500 96 739 7.77 5742.03 92 604 7.57 4572.2810:45 AM 88800 107 738 7.85 5793.3 106 613 7.71 4726.2311:00 AM 92800 105 787 7.95 6256.65 105 622 7.76 4826.7211:15 AM 97800 101 820 8.03 6584.6 102 643 7.82 5028.2611:30 AM 99800 93 825 8.09 6674.25 89 653 7.87 5139.1111:45 AM 101800 98 823 8.14 6699.22 97 654 7.92 5179.6812:00 PM 104800 102 810 8.18 6625.8 100 646 7.95 5135.712:15 PM 107300 104 813 8.23 6690.99 103 659 7.99 5265.41
Flex Test With 7.4V Battery (10 April 05)
Time
Light Reading
(Lux)
Flex A Flex B With PVPC
d. Flexible Panel-3.7V Battery Field Performance Test We conducted a single iteration of this test. The solar panels used for the
flexible panel 3.7V tests were Uni-Solar LM-3 modules. Each system utilized an array of
three LM-3 modules. The batteries used were UBC36106102/PCM Ultra-Life Polymer
3.7V Rechargeable batteries. For each system, we wired two of these batteries in parallel
to create a 3.7V battery load for the test. The PVPC technology circuit board used was a
model 1216. Presented below is the data for this test.
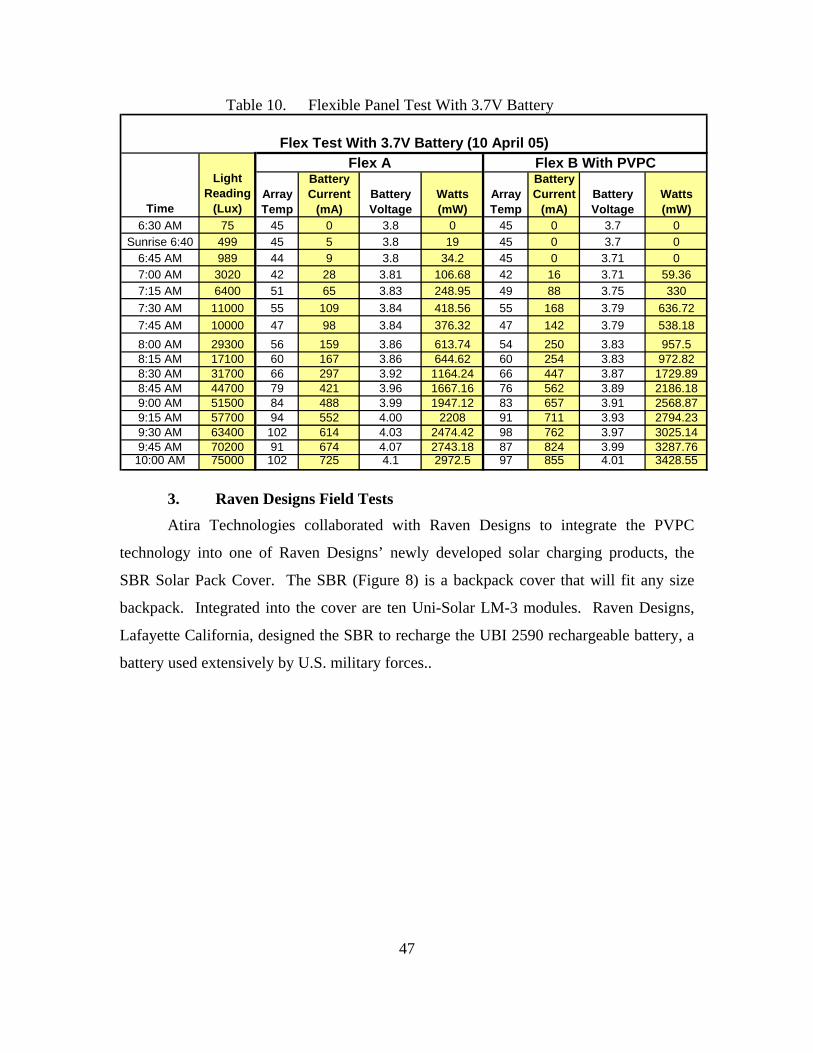
47
Table 10. Flexible Panel Test With 3.7V Battery
Array Temp
Battery Current
(mA)Battery Voltage
Watts (mW)
Array Temp
Battery Current
(mA)Battery Voltage
Watts (mW)
6:30 AM 75 45 0 3.8 0 45 0 3.7 0Sunrise 6:40 499 45 5 3.8 19 45 0 3.7 0
6:45 AM 989 44 9 3.8 34.2 45 0 3.71 07:00 AM 3020 42 28 3.81 106.68 42 16 3.71 59.367:15 AM 6400 51 65 3.83 248.95 49 88 3.75 3307:30 AM 11000 55 109 3.84 418.56 55 168 3.79 636.727:45 AM 10000 47 98 3.84 376.32 47 142 3.79 538.188:00 AM 29300 56 159 3.86 613.74 54 250 3.83 957.58:15 AM 17100 60 167 3.86 644.62 60 254 3.83 972.828:30 AM 31700 66 297 3.92 1164.24 66 447 3.87 1729.898:45 AM 44700 79 421 3.96 1667.16 76 562 3.89 2186.189:00 AM 51500 84 488 3.99 1947.12 83 657 3.91 2568.879:15 AM 57700 94 552 4.00 2208 91 711 3.93 2794.239:30 AM 63400 102 614 4.03 2474.42 98 762 3.97 3025.149:45 AM 70200 91 674 4.07 2743.18 87 824 3.99 3287.7610:00 AM 75000 102 725 4.1 2972.5 97 855 4.01 3428.55
Flex Test With 3.7V Battery (10 April 05)Flex A Flex B With PVPC
Light Reading
(Lux)Time
3. Raven Designs Field Tests Atira Technologies collaborated with Raven Designs to integrate the PVPC
technology into one of Raven Designs’ newly developed solar charging products, the
SBR Solar Pack Cover. The SBR (Figure 8) is a backpack cover that will fit any size
backpack. Integrated into the cover are ten Uni-Solar LM-3 modules. Raven Designs,
Lafayette California, designed the SBR to recharge the UBI 2590 rechargeable battery, a
battery used extensively by U.S. military forces..
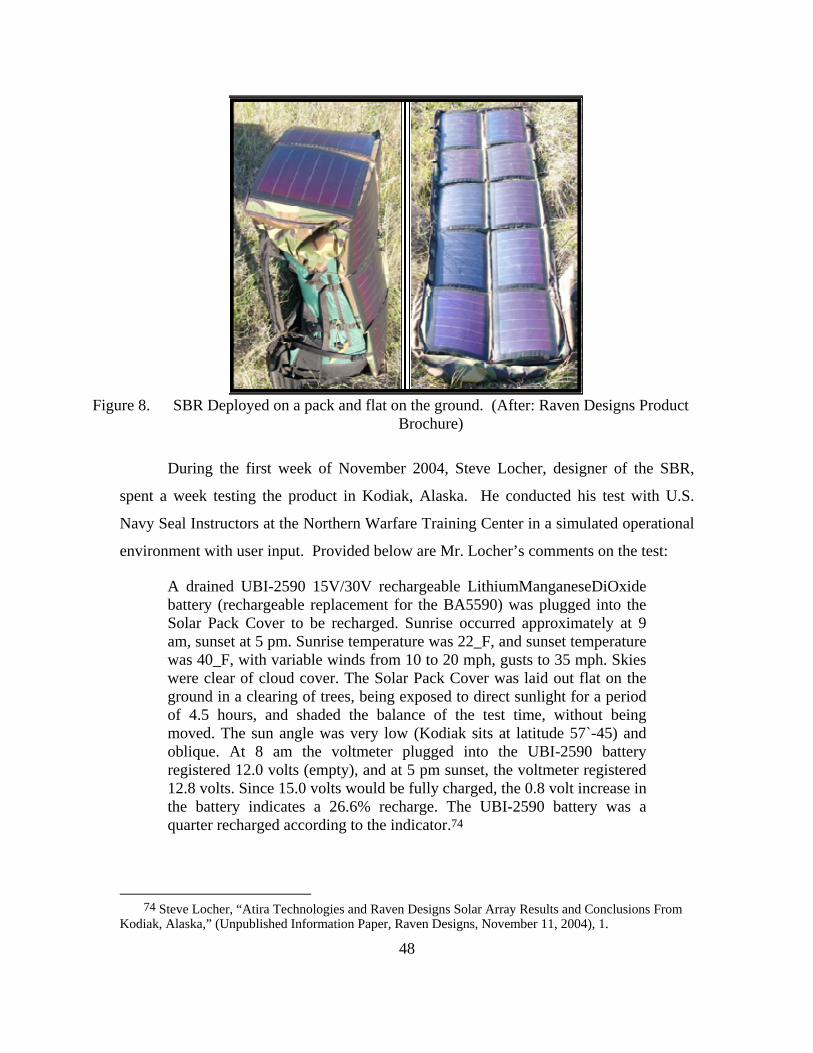
48
Figure 8. SBR Deployed on a pack and flat on the ground. (After: Raven Designs Product
Brochure)
During the first week of November 2004, Steve Locher, designer of the SBR,
spent a week testing the product in Kodiak, Alaska. He conducted his test with U.S.
Navy Seal Instructors at the Northern Warfare Training Center in a simulated operational
environment with user input. Provided below are Mr. Locher’s comments on the test:
A drained UBI-2590 15V/30V rechargeable LithiumManganeseDiOxide battery (rechargeable replacement for the BA5590) was plugged into the Solar Pack Cover to be recharged. Sunrise occurred approximately at 9 am, sunset at 5 pm. Sunrise temperature was 22_F, and sunset temperature was 40_F, with variable winds from 10 to 20 mph, gusts to 35 mph. Skies were clear of cloud cover. The Solar Pack Cover was laid out flat on the ground in a clearing of trees, being exposed to direct sunlight for a period of 4.5 hours, and shaded the balance of the test time, without being moved. The sun angle was very low (Kodiak sits at latitude 57`-45) and oblique. At 8 am the voltmeter plugged into the UBI-2590 battery registered 12.0 volts (empty), and at 5 pm sunset, the voltmeter registered 12.8 volts. Since 15.0 volts would be fully charged, the 0.8 volt increase in the battery indicates a 26.6% recharge. The UBI-2590 battery was a quarter recharged according to the indicator.74
74 Steve Locher, “Atira Technologies and Raven Designs Solar Array Results and Conclusions From
Kodiak, Alaska,” (Unpublished Information Paper, Raven Designs, November 11, 2004), 1.

49
Following the test conducted in Alaska, Mr. Locher conducted similar field-
testing of the Solar Pack, with the integrated PVPC technology, in Monterey, CA. in a
simulated operational environment. His descriptions and comments are:
…a test in Monterey, California (latitude 36’36’N) during the last week of November with the SBR at a 45 degree angle to the ground (roughly 90 degrees to the sun) and never moved to track the sun, recharged the same battery by 71% in 8 hours. The next day, also with clear skies, the SBR was hung from a tree (vertical to the ground), rotated once during the day to track the sun, and recharged the UBI-2590 battery in 8 hours. Testing in ideal conditions (summer sun, and the unit periodically rotated to roughly follow the sun) at mid latitudes, shows 100% UBI- 2590 battery recharging in less than 7 hours. These different testing conditions, from the low angle, partly shaded sun, to direct, full sun, illustrates the viability of this technology. When coupled with the field versatility of the Solar Battery Recharger by Raven Designs, the Warfighter is presented with a real world solution to many battlefield power supply problems. By reducing the weight and bulk of the required battery supply of today’s Warfighter, individuals and units can move more quickly, safely, and with more endurance. By being able to recharge batteries in the field, mission durations can be safely lengthened.75
D. TECHNOLOGY READINESS LEVEL DESCRIPTIONS76 The purpose of this section is to describe in detail each Technology Readiness
Level. As stated in Chapter II, Technology Readiness Levels are a consistent
measurement to categorize the maturity level of a program’s key technologies and
provide a common language or reference to the science and technology community
within the DoD. Developing a comprehensive understanding of each level and the
supporting information required to justify an assessment is essential in conducting a
thorough Technology Readiness Assessment. Items 1-9 below present each TRL
definition followed by the supporting information necessary to justify an assessment for
that level and an example.
75 Steve Locher, “Raven Designs”, (Unpublished Product Broachure, Raven Designs) 76 The definitions, required supporting information, and examples for each TRL are cited/paraphrased
from the DoD Technology Readiness Assessment Deskbook, September, 2003

50
1. TRL 1: Basic Principles Observed and Reported
a. Description TRL 1 is the lowest level of technology readiness. At this level, scientific
research begins to be translated into applied research and development.
b. Supporting Information Supporting information required includes published research that
identifies the principles that underlie this technology. References must include whom,
where and when.
c. Example Examples of TRL 1 include paper studies of technologies basic properties.
2. TRL 2: Technology Concept and/or Application Formulated
a. Description Invention begins at TRL 2. Once basic principles are observed, practical
applications can be invented. At TRL 2 applications are speculative, and proof or
detailed analysis to support the assumptions may be lacking.
b. Supporting Information Supporting information for TRL 2 include publications or other references
that outline the application being considered and that provide analysis to support the
concept.
c. Example Examples of TRL 2 include analytical studies.
3. TRL 3: Analytical and Experimental Critical Function and/or Characteristic Proof of Concept
a. Description TRL 3 is characterized by the initiation of active research and
development that includes analytical studies and laboratory studies to physically validate
analytical predictions of separate elements of the technology.

51
b. Supporting Information Supporting information include results of laboratory tests performed to
measure parameters of interest and comparison to analytical predictions for critical
subsystems. References must include who, where, and when the tests and comparisons
were performed.
c. Example Examples include components that are not yet integrated or representative.
4. TRL 4: Component and/or Breadboard Validation in a Laboratory Environment
a. Description At level TRL 4 basic technological components are integrated to establish
that they will work together. This is relatively ‘low fidelity” compared to the eventual
system.
b. Supporting Information Supporting information necessary include systems concepts that have been
considered and results from testing laboratory-scale breadboard(s). References must
provide who, where, and when the tests and comparisons were performed.
c. Example Integration of “ad hoc” hardware in the laboratory.
5. TRL 5: Component and/or Breadboard Validation in a Relevant Environment
a. Description Fidelity of breadboard technology increases significantly at TRL 5. The
basic technological components are integrated with reasonably realistic supporting
elements so they can be tested in a simulated environment.
b. Supporting Information
Supporting information consist of results from testing a laboratory
breadboard system that are integrated with other supporting elements in a simulated
operational environment. Documentation should address questions such as, how the
relevant environment differs from the expected operational environment; how do the test
results compare with expectations; what problems, if any, were encountered; was the
breadboard system refined to match the expected system goals more nearly?
52
c. Example Examples of TRL include “high-fidelity” laboratory integration of
components.
6. TRL 6: System/Subsystem Model or Prototype Demonstration in a Relevant Environment
a. Description TRL 6 is characterized by a representative model or prototype system,
which is well beyond that of TRL 5 that is tested in a relevant environment. This level
represents a major step up in a technology’s demonstrated readiness.
b. Supporting Information Supporting information should consist of results from laboratory testing of
a prototype system that is near the desired configuration in terms of performance, weight,
and volume. Questions to address are how did the test environment differ from the
operational environment? Who performed the tests? How did the test compare with
expectations? What problems, if any, were encountered? What are/were the plans,
options, or actions to resolve problems before moving to the next level?
c. Example Examples include testing a prototype in a high fidelity laboratory
environment or in a simulated operational environment.
7. TRL 7: System Prototype Demonstration in an Operational Environment
a. Description At TRL 7 a prototype near, or at, the planned operational system is
realized. TRL 7 represents a major step up from TRL 6. It requires a demonstration of
an actual operational system prototype in an operational environment such as an aircraft,
vehicle, or space.
b. Supporting Information Supporting information should include results of testing a prototype
system in an operational environment. Questions to address are: Who performed the

53
tests? How did the test compare with expectations? What problems, if any, were
encountered? What are/were the plans, options, or actions to resolve problems before
moving to the next level?
c. Example An example for TRL 7 is testing the prototype in a test bed aircraft.
8. TRL 8: Actual System Completed and Qualified Through Test and Demonstration
a. Description At TRL 8, the technology has been proved to work in its final form and
under expected conditions. In almost all cases, this TRL represents the end of true
system development.
b. Supporting Information Supporting information should include results of testing the system in its
final configuration under the expected range of environmental conditions in which it will
be expected to operate. Assessments at TRL 8 must also determine whether it will meet
its operational requirements. Questions to address are: What problems, if any, were
encountered? What are/were the plans, options, or actions to resolve problems before
finalizing the design?
c. Example Examples for TRL 8 include developmental test and evaluation of the
system in its intended weapon system to determine if it meets design specifications.
9. TRL 9: Actual System Proven Through Successful Mission Operations
a. Description TRL 9 is the highest level of technology readiness. This level is describe
as the actual application of the technology in its final form and under mission conditions,
such as those encountered in operational test and evaluation.
b. Supporting Information Supporting information is reports and results from operational test and
evaluation.
c. Example Examples include using the system under operational mission conditions.
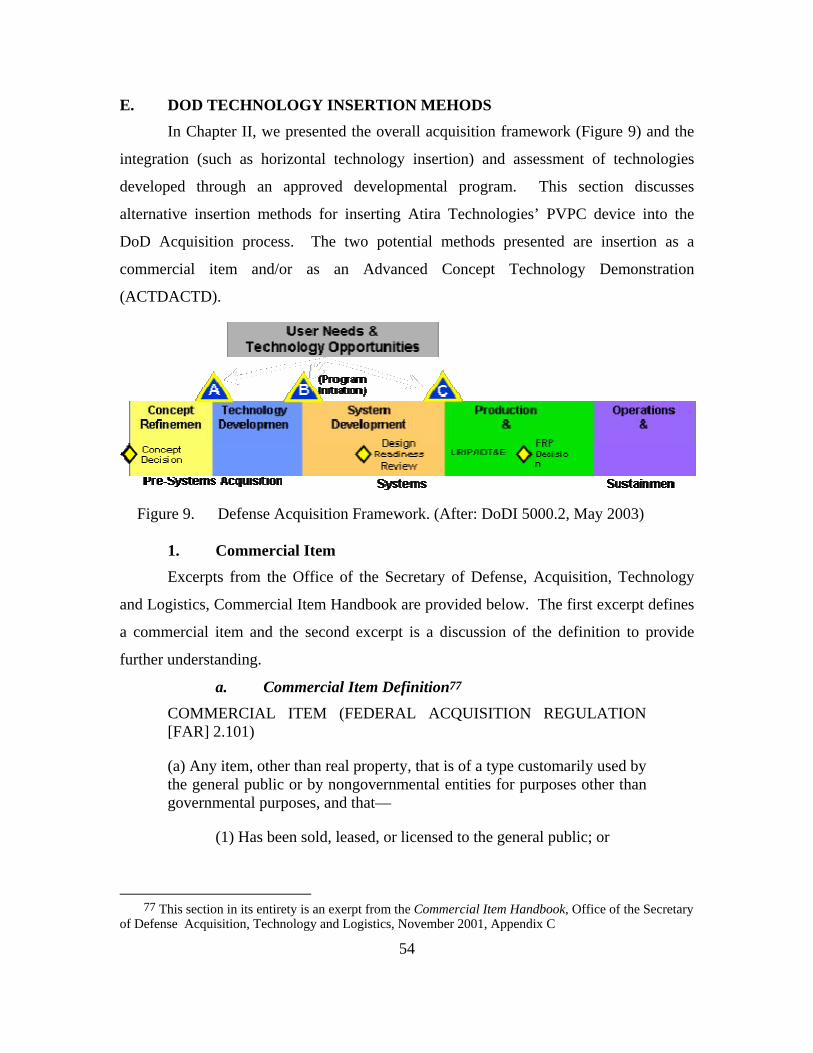
54
E. DOD TECHNOLOGY INSERTION MEHODS In Chapter II, we presented the overall acquisition framework (Figure 9) and the
integration (such as horizontal technology insertion) and assessment of technologies
developed through an approved developmental program. This section discusses
alternative insertion methods for inserting Atira Technologies’ PVPC device into the
DoD Acquisition process. The two potential methods presented are insertion as a
commercial item and/or as an Advanced Concept Technology Demonstration
(ACTDACTD).
Figure 9. Defense Acquisition Framework. (After: DoDI 5000.2, May 2003)
1. Commercial Item Excerpts from the Office of the Secretary of Defense, Acquisition, Technology
and Logistics, Commercial Item Handbook are provided below. The first excerpt defines
a commercial item and the second excerpt is a discussion of the definition to provide
further understanding.
a. Commercial Item Definition77 COMMERCIAL ITEM (FEDERAL ACQUISITION REGULATION [FAR] 2.101)
(a) Any item, other than real property, that is of a type customarily used by the general public or by nongovernmental entities for purposes other than governmental purposes, and that—
(1) Has been sold, leased, or licensed to the general public; or
77 This section in its entirety is an exerpt from the Commercial Item Handbook, Office of the Secretary
of Defense Acquisition, Technology and Logistics, November 2001, Appendix C

55
(2) Has been offered for sale, lease, or license to the general public;
(b) Any item that evolved from an item described in paragraph (a) of this definition through advances in technology or performance and that is not yet available in the commercial marketplace, but will be available in the commercial marketplace in time to satisfy the delivery requirements under a Government solicitation;
(c) Any item that would satisfy a criterion expressed in paragraphs (a) or (b) of this definition, but for—
(1) Modifications of a type customarily available in the commercial marketplace; or
(2) Minor modifications of a type not customarily available in the commercial marketplace made to meet Federal Government requirements. “Minor” modifications means modifications that do not significantly alter the nongovernmental function or essential physical characteristics of an item or component, or change the purpose of a process. Factors to be considered in determining whether a modification is minor include the value and size of the modification and the comparative value and size of the final product. Dollar values and percentages may be used as guideposts, but are not conclusive evidence that a modification is minor;
(d) Any combination of items meeting the requirements of paragraphs (a), (b), (c),or (e) of this definition that are of a type customarily combined and sold in combination to the general public;
(e) Installation services, maintenance services, repair services, training services, and other services if—
(1) Such services are procured for support of an item referred to in paragraph (a), (b), (c), or (d) of this definition, regardless of whether such services are provided by the same source or at the same time as the item; and
(2) The source of such services provides similar services contemporaneously to the general public under terms and conditions similar to those offered to the Federal Government;
(f) Services of a type offered and sold competitively in substantial quantities in the commercial marketplace based on established catalog or market prices for specific tasks performed under standard commercial terms and conditions. This does not include services that are sold based on hourly rates without an established catalog or market price for a specific service performed. For purposes of these services—

56
(1) “Catalog Price” means a price included in a catalog, price list, schedule, or other form that is regularly maintained by the manufacturer or vendor, is either published or otherwise available for inspection by customers, and states prices at which sales are currently, or were last, made to a significant number of buyers constituting the general public; and
(2) “Market Prices” mean current prices that are established in the course of ordinary trade between buyers and sellers free to bargain and that can be substantiated through competition or from sources independent of the offerors; (g) Any item, combination of items, or service referred to in paragraphs (a) through (f), notwithstanding the fact that the item, combination of items, or service is transferred between or among separate divisions, subsidiaries, or affiliates of a contractor; or
(h) A nondevelopmental item, if the procuring agency determines the item was developed exclusively at private expense and sold in substantial quantities, on a competitive basis, to multiple State and local governments.
b. Discussion of Commercial Item Definition78 The commercial item definition…is broad. It embraces any item of a type customarily used by the general public or by nongovernmental entities for purposes other than Government purposes that has been sold, leased, or licensed or offered for sale, lease, or license to the general public. Also included in the commercial item definition is any item that has evolved from a commercial item as described above, through technical/performance advances, even if it is not yet available in the commercial marketplace, as long as it will be available in time to satisfy the Government’s requirements. Commercial items do not necessarily have to be “off-the-shelf”; items that merely require modifications of a type customarily available in the commercial marketplace, or else minor Government-unique modifications, can still be considered commercial items. (To qualify as representing a minor modification, the item must retain a predominance of nongovernmental functions or physical characteristics.) Additionally, the FAR commercial item definition includes many services. A service is considered a commercial item when it is provided in support of a commercial item as previously defined. A service is also considered a commercial item when it is of a type offered and sold competitively in substantial quantities in the commercial market on the basis of established catalog or market prices for specific tasks performed under standard commercial terms and conditions. The definition also includes any combination of commercial items (except “of
78 This section is an excerpt from the Commercial Item Handbook, Office of the Secretary of Defense
Acquisition, Technology and Logistics, November 2001, 10

57
a type” services) that are customarily combined and sold in combination to the general public. The commercial item definition is not limited to items acquired by the Government from prime contractors; it also extends to commercial items acquired from subcontractors at all tiers, including items transferred from a contractor’s divisions, affiliates, or subsidiaries. Acquisition professionals are responsible for developing requirements and acquisition strategies that facilitate the inclusion of commercial items in Government-unique systems. Commercial off-the-shelf (COTS) items, nondevelopmental items (NDIs), and Government off the- shelf (GOTS) items are related to commercial items, but the terms are not synonymous. Further, the fact that a supply or service to be procured does not easily fit into the NDI or GOTS categories does not in itself mean that it is not a commercial item.
2. Advance Concept Technology Demonstration79 This section provides excerpts from the Advanced Concept Technology
Demonstration web page. It begins with an in introduction to ACTDs, transitions to the
focus of the program and the criterion used to evaluate proposed ACTDs, and then
concludes by describing the four ACTD objectives.
a. Introduction to ACTDs In early 1994, the DoD initiated a new program designed to help expedite the transition of maturing technologies from developers to the users. The Advanced Concept Technology Demonstration (ACTD) program was to help the DoD acquisition process adapt to today's economic and threat environments. ACTDs emphasize technology assessment and integration rather than technology development. The goal is to provide a prototype capability to the warfighter and to support him in the evaluation of that capability. The warfighters evaluate the capabilities in real military exercises and at a scale sufficient to fully assess military utility.
ACTDs are designed to allow users to gain an understanding of proposed new capabilities for which there is no user experience base. Specifically, they provide the warfighter an opportunity: to develop and refine his concept of operations to fully exploit the capability under evaluation, to evolve his operational requirements as he gains experience and understanding of the capability, and to operate militarily useful quantities of prototype systems in realistic military demonstrations, and on that basis, make an assessment of the military utility of the proposed capability.
79 The information in this section is an excerpt from the Advanced Technology Concept
Demonstration Home Page, http://www.acq.osd.mil/actd/intro.htm#Introduction, [20 April 2005]

58
At the conclusion of the ACTD operational demonstration, there are three potential outcomes. The user sponsor may recommend acquisition of the technology and fielding of the residual capability that remains at the completion of the demonstration phase of the ACTD to provide an interim and limited operational capability. If the capability or system does not demonstrate military utility, the project is terminated or returned to the technology base. A third possibility is that the user's need is fully satisfied by fielding the residual capability that remains at the conclusion of the ACTD, and there is no need to acquire additional units.
b. Focus of ACTDs80 There are several key criteria by which ACTD candidates are evaluated: response to user needs, maturity of technologies, and potential effectiveness.
(1) User needs: ACTDs focus on addressing critical military needs. To evaluate proposed solutions to meet these needs, intense user involvement is required. ACTDs place mature technologies in the hands of the user and then conduct realistic and extensive military exercises to provide the user an opportunity to evaluate utility and gain experience with the capability. The process provides the users a basis for evaluating and refining their operational requirements, for developing a corresponding concept of operations, and ultimately for developing a sound understanding of the military utility of the proposed solution before a decision is made to enter into the formal acquisition process. Furthermore, a key objective of ACTDs is to provide a residual operational capability for the warfighter as an interim solution prior to procurement.
(2) Exploit mature technologies: ACTDs are based on mature or nearly mature technologies. By limiting consideration to mature technologies, the ACTD avoids the time and risks associated with technology development, concentrating instead on integration and demonstration activities. This approach permits an early user demonstration on a greatly reduced schedule at a reduced cost.
(3) Potential effectiveness: The potential or projected effectiveness must be sufficient to warrant consideration of an ACTD or the capability must address a need for which there is no suitable solution.
These are the criteria used by the Deputy Under Secretary of Defense for Advanced Systems and Concepts (DUSD(AS&C)) as an initial filter in the ACTD review process. The ACTDs that pass this step are then subjected
80 The information in this section is an excerpt from the Advanced Technology Concept
Demonstration Home Page, http://www.acq.osd.mil/actd/intro.htm#Introduction, [20 April 2005]

59
to an in-depth review by Service, Agency, and Joint Staff technical and operational personnel.
c. ACTD Objectives The objectives of an ACTD are to conduct meaningful demonstrations of the capability, develop and test concepts of operations to optimize military effectiveness, and prepare to transition the capability into acquisition without loss of momentum, if warranted.
(1) Conduct meaningful demonstrations of the capability: The demonstrations are sized and structured to provide clear evaluation of military capability. The user, with support from the Operational Test Agencies, defines the measures of effectiveness and measures of performance that allow effectiveness and suitability to be characterized. Data collection is tailored accordingly. The quantity of systems in the ACTD is sufficient to provide a valid assessment of the capability, or simulations are used to expand the battlespace and forces involved in the exercise. The user provides, or at least approves, the planned operational exercises which typically include red, as well as blue, forces.
(2) Concept of operations (CONOPS): Many of the ACTDs are based on advanced technologies which may permit, or even demand, new CONOPS, tactics, and doctrine in order to realize their maximum potential. The ACTD provides a means to develop, refine, and optimize these warfighting concepts to achieve maximum utility and effectiveness.
(3) Prepare to transition into acquisition: A key goal of ACTDs is to move into the appropriate phase of formal acquisition without loss of momentum, assuming the user makes a positive determination of military utility. Each ACTD has a clear acquisition goal for the post ACTD phases. In addition, there must be provisions for the development of formal operational requirements; documents addressing interoperability, life cycle cost, manning, and training; and preparations for supportability.
(4) Management Oversight: Each ACTD is managed by a lead Service or Agency developer and driven by the principal user sponsor. As a general rule, but not as a requirement, the user sponsor is usually a Unified Commander. The Joint Requirements Oversight Council (JROC) will make a recommendation to the DUSD(AS&C) regarding the lead Service and user sponsor as part of the JROC review of candidate ACTDs. All user and development organizations are represented on an oversight group, chaired by the DUSD(AS&C). The purpose of this group of senior representatives is to provide a decision making body that can respond quickly to significant program issues that require management direction or approval and to assure effective, timely communications among the leadership level of the key participating organizations.

60
THIS PAGE INTENTIONALLY LEFT BLANK

61
IV. ANALYSIS
A. INTRODUCTION In this chapter, we present our analysis of the data presented in Chapter III. To
facilitate an easy crosswalk between the data and analysis, we used the same format for
Chapters III and IV. We begin with the analysis of the test results for each PVPC product
test in Section B. In Section C, we correlate the product description and type of product
tests with the different Technology Readiness Levels. Finally, we apply the definitions
of the DOD Technology Insertion Methods to the PVPC.
B. PRODUCT TEST ANALYSIS The purpose of our Product Test Analysis is to present our study of the individual
PVPC test data collected during our research. The ultimate goal of our analysis is to
document clear and logical interpretations of factual data that will allow us to conclude
whether or not a solar power system integrated with the PVPC generates more power.
We categorized the tests into three sections. The first section details the analyses of the
tests conducted by Atira, the second section covers test conducted at NPS, and the third
section discusses test conducted by Raven Designs. The presentation order of the
analysis does not reflect the chronological order of the tests conducted.
We used conventional and automated analytical tools to extract information from
the test data. For each test, we provide a brief narrative that describes these descriptive
statistics and support the narrative using tabular and graphical techniques to provide
further clarity. Following our individual analysis, we then review our individual
interpretations to identify any correlations and/or consistencies between the individual
tests that may support overall or summary conclusions about the performance of the
PVPC technology.
1. Atira Technologies Comparison Test The test approach used was a side-by-side comparison of solar power systems
using procedures that measured the PVPC’s performance levels. Each test consisted of
testing two identically configured systems except one system integrated the PVPC
technology. For simplicity, the solar power system integrated with the PVPC is referred
62
to as the “PVPC system” and the solar power system without the PVPC is referred to as
the “Standard system”. Our analysis focuses on two data elements, current (mA) and
power (Watts). These two data elements are the best indicators of the amount of energy a
system is generating at a specific point in time. Current is the primary measurable output
from each solar power system while power is a product of the load source (Volts) and the
current. For our analysis, we use power as the standard measurement to allow us to
compare results consistently from tests that have varied input, and in some cases load
variables. For each test, we entered the collected data into an automated spreadsheet and
used the software to generate the descriptive statistics and graphic depictions for the data.
This allowed us to identify any significant and measurable differences.
a. Atira LM-3 Test with 12V Load Atira Tech used the Uni-Solar LM-3 modules and UBC36106102/PCM
Ultra-Life Polymer 3.7V Rechargeable batteries for this test. For each system, Atira
representatives wired three Ultra-Life Polymer batteries, in series, to represent a 12V
battery load. Atira selected the 12V battery to demonstrate specifically the ability of the
PVPC to enhance or improve an existing solar power system. Uni-Solar designed the
LM-3 Module to charge a 9V battery. As explained previously, if the system cannot
convert enough solar power into electrical power with the right characteristics to reach
the batteries charging threshold, the power generated is lost or unusable. Because Uni-
Solar designed the LM-3 to charge a 9V battery, it does not generate enough usable
power to charge a 12V battery. With this in mind, Atira wanted to demonstrate that by
incorporating the PVPC into the solar charging system, it could access the energy that is
produced below battery charging thresholds and transform it to generate usable power to
charge a battery beyond the LM3’s designed charging threshold.
The time interval for the test was approximately 10 hours beginning at
0730 and ending at 1730. Atira recorded 18 data readings during the test period. Table
11 presents the descriptive statistics for battery current (mA), battery voltage (V), and
power (mW).

63
Table 11. LM-3 12V Test Descriptive Statistics
Standard PVPC Standard PVPC Standard PVPCMean 18.06 52.67 206.38 614.32 11.43 11.67Median 10.00 50.00 114.30 586.50 11.43 11.68Range 50.00 100.00 571.50 1169.00 0.00 0.14Minimum 0.00 0.00 0.00 0.00 11.43 11.59Maximum 50.00 100.00 571.50 1169.00 11.43 11.73Sum 325.00 948.00 3714.75 11057.82 205.74 209.99Count 18 18 18 18 18 18
Battery Current (mA) Watts (mW)
LM-3 12V Test (Feb 8)
Battery Voltage (V)
Beginning with battery current, we review and compare the statistics for
each data element. By examining the Mean, we can compare the averages for each solar
power system. The average Battery Currents for the Standard and PVPC systems are
18.06 and 52.67 respectively. The numerical difference between the two means is
approximately 34.6 mA. Dividing the difference of 34.6 by the mean of the Standard
system, reveals a percentage difference of approximately 191%. The minimum mA
reading for each system was 0.00mA. The maximum mA reading for the PVPC system
was 100mA, which is exactly double the 50mA maximum reading recorded for the
Standard system.
The descriptive statistics also provides the sum for each of the data points.
It is important to understand that the sum is only the cumulative amount of 18 (count)
data recordings or samples and that each recording represents a particular point in time.
The sum does not reflect the total cumulative amount generated by either system during
the entire test period. Observing the mA sum for each system, we determine that for the
18 data recordings, the Standard system accumulated 325mA and the PVPC 948mA for a
difference of 623mA or 191%.
Using the same methodology as above, we can compare the descriptive
statistics for the data for power (mW). The mW range for the Standard system is 571mW
with a minimum recording of 0.00mW and a maximum of 571.50mW. The PVPC
demonstrated a range of 0.00mW to a much higher maximum of 1,169.00mW. On
average, the Standard system generated 206.38mW and the PVPC generated an average
64
of 614.32mW for a difference of 407.94mW or approximately 197%. The sum for each
system is 3,714.75mW for the Standard and 11,057.82mW for the PVPC. This translates
to a difference of 7,343.07mW, or approximately 197%, and correlates directly to the
percent increase in average power. The reason the percentage differences in current and
power are not exactly the same is because each system started with a slightly different
voltage
The beginning charge for the standard system was 11.43Vs, while the
PVPC system measured 11.67V. Both systems were below the fully discharged threshold
for the battery configuration. At the conclusion of the test, the standard system’s battery
charge remained the same at 11.43V. In contrast, the PVPC system’s battery contained a
charge of 11.73. The ranges for the standard system and the PVPC system were 0.0 and
0.14V respectively, thus the PVPC system increased the charge of the battery while the
standard system failed to increase the charge.
A closer examination of the Voltage readings for the PVPC system (Table
12) revealed that the PVPC system generated enough power to charge the battery during
the time interval between 0915hrs and 1345hrs. From 0830 through 1430 hours, the
Standard system does produce power, however, as shown by the fact that the battery was
not charging, none of it is usable. This reveals a key fact to which we have already
alluded – not all power is usable power. In this situation, the PVPC system is essentially
producing infinitely more power; however, we were unable to devise a method to
quantify this advantage as both systems produce power, but only the PVPC system
produced usable power.

65
Table 12. LM3 12V Test PVPC Charging Interval
Time mA V Watts mA V Watts0730 0 11.43 0 0 11.59 00800 0 11.43 0 4 11.59 46.360830 10 11.43 114.3 4 11.59 46.360845 25 11.43 285.75 40 11.59 463.60915 50 11.43 571.5 100 11.59 11590920 50 11.43 571.5 100 11.60 11601000 50 11.43 571.5 100 11.59 11591200 50 11.43 571.5 100 11.66 11661245 10 11.43 114.3 50 11.66 5831315 50 11.43 571.5 100 11.69 11691345 20 11.43 228.6 75 11.73 879.751430 10 11.43 114.3 75 11.73 879.751515 0 11.43 0 50 11.73 586.51545 0 11.43 0 50 11.73 586.51615 0 11.43 0 50 11.73 586.51645 0 11.43 0 50 11.73 586.51715 0 11.43 0 0 11.73 01716 0 11.43 0 0 11.73 0
Standard System PVPC System
LM3 12V Test (Feb 8)
For further analysis, we used graphs to compare visually the data collected
for both systems. The first graph (Figure 10) graphically depicts the data collected for
current versus time and the second graph (Figure 11) depicts power versus time. The
third graph (Figure 12) combines both current and power versus time with the current
axis displayed on the left and the power axis displayed on the right.
Figure 10. LM-3 12V Test mA Comparison Graph
66
Figure 11. LM-3 12V Test mW Comparison Graph
Figure 12. LM-3 12V Test mA and mW Combined Comparison Graph
At first glance, it appears that Figure 13 only depicts two data elements,
yet the legend lists all four data elements. Actually, all four data elements are displayed,
however, the current and power for each system follow identical relative paths. To
explain further, power, as mentioned above, is a product of current and voltage. Second,
the relative numerical differences between the voltage readings for each battery are very
small. Third, the recorded times of the data samples are the same. As a result, current
and power are directly correlated and although their numerical measurements are

67
different, the relative intervals with relation to the x-axis are identical. With this in mind,
we will only use the graphs depicting power for the remainder of our comparison
analysis.
As stated above, Figure 12 graphically depicts the data collected for power
as measured in mW versus time. As expected, these graphics are consistent with the
analysis of the descriptive statistics discussed previously. By starting at the left, we see
that each system begins at 0730 with 0.00 mW generated, but by 0845, the PVPC system
is producing nearly twice the power generated by the standard system. By 0915, both
systems have reached their maximum power output and at maximum output, the PVPC
system continues to produce twice as much power as the standard system.
Continuing along the data line for each system, we note a sudden drop in
power for the data recorded at 1245hrs. Atira recorded that a brief period of cloud cover
degraded the light conditions, which in turn caused the sudden reduction in power. Of
key interest is the comparison of the two readings during the low light condition. Under
the severely degraded light conditions, the power output for the standard system dropped
by 80% from 571mW to 114mW. In contrast, the PVPC system’s drop in power was
only 50% from 1166mW to 583mW. Further, in these low light conditions, the PVPC
system generated more power (583mW) than the maximum power output recorded for
the Standard system (571mW) during the entire test period. Finally, the graph also
highlights that the PVPC system continued to produce 586.5mW power for
approximately an hour and a half after the Standard system ceased producing power.
b. Atira LM-3 Test with Programmable Fixed Load Atira Tech used the Uni-Solar LM-3 modules and the HP 6063B DC
Programmable Electronic Load system for this test. The test approach was a side-by-side
comparison test. As pointed out in the introduction, these tests were chronologically the
last tests conducted. Atira conducted the Programmable Fixed Load (PFL) tests to
eliminate any concerns or perceptions that the slight variability in the beginning battery
voltage significantly skewed the results. In the battery tests, the batteries were
discharged, approximating a fully discharged level, however, identical initial battery
charge states were not achieved. Although the differences were negligible and do not

68
significantly alter the results, initiating the trials with different charge states did introduce
an undesirable, though slight variation.
The HP 6063B is a programmable DC load bank that is used to apply a
consistent and specific load source to the test systems simultaneously. The goal of the
test was to measure the power output of the Standard system and the PVPC system under
identical conditions. Using the HP 6063B, Atira began with a minimum load of 0.5V and
incrementally increased the loads by 0.5V until they reached a maximum load of 16.5V
for each system. For this test, Atira integrated a 0916 PVPC circuit board. Table 13
presents the descriptive statistics for this test.
For the analysis of this test, we integrated the actual differences between
each system, and the corresponding percentages, into the descriptive statistics table. The
same methods and calculations describe in the previous section were used to determine
these differences and percentages depicted.
Table 13. LM-3 w/ Programmable Fixed Load Test Descriptive Statistics
Standard PVPC Diff % Diff Standard PVPC Diff % DiffMean 127.27 213.94 86.67 68.10% 707.73 1102.88 395.15 55.83%Range 210.00 790.00 580.00 276.19% 1620.00 1305.00 -315.00 -19.44%Minimum 0.00 0.00 0.00 0.00% 0.00 0.00 0.00 0.00%Maximum 210.00 790.00 580.00 276.19% 1620.00 1305.00 -315.00 -19.44%Sum 4200.00 7060.00 2860.00 68.10% 23355.00 36395.00 13040.00 55.83%Count 33.00 33.00 33.00 33.00
LM-3 Flex Test w/ Programmable Fixed LoadWatts (mW)Battery Current (mA)
On average, the PVPC system generated 55% more power than the
Standard system; however, in contrast to the previous test, the Standard system
demonstrated a higher maximum power output at 1620mW compared to PVPC system’s
maximum output of 1305mW. We reviewed the data for the test and discovered that at
loads between 7 and 10.5V, (Table 14) the Standard system produced more power than
the PVPC; however, at all other loads the PVPC produced more power.

69
Table 14. LM-3 Flex Test w/ Programmable Fixed Load Excerpt
Voltage (V)
Current (mA)
Watts (mW)
Voltage (V)
Current (mA)
Watts (mW)
7 190 1330 7 170 11907.5 190 1425 7.5 160 12008 190 1520 8 150 1200
8.5 180 1530 8.5 150 12759 180 1620 9 140 1260
9.5 170 1615 9.5 130 123510 160 1600 10 120 1200
10.5 140 1470 10.5 120 1260
LM-3 Flex Test w/ Programmable Fixed LoadSystem without PVPC System with PVPC
As detailed in Chapter III, the original PVPC circuit, the 1216, was designed to
work with the 12V Solengy glass panel. Atira subsequently modified the 1216 into the
0916 model to work with the 9V Uni-Solar LM-3 panel in order to demonstrate that the
PVPC could enable a solar charging system to perform beyond its designed capabilities.
Thus, Atira performed the modification as a proof of concept to demonstrate that the
0916 PVPC, a 9V panel could indeed charge a 12V battery. Simply put, the 0916 PVPC
circuit was never specifically designed to optimize at the LM-3s 9V input level, which
likely accounts for the Standard system generating more power at voltage levels between
7V and 10.5V.
For further analysis, we used a graph to visually depict the data collected for both
systems. Figure 13 presents the data for battery current and power versus the volts or
load placed on the system. The Y-axis on the left represents the battery current mA and
the Y-axis on the right represents the power mWs, while the X-axis depicts the load (V).
This graphically depicts that although the Standard system produced more power at
voltage loads between 7V and 10.5V, overall the PVPC produced 55% more power.

70
LM-3 side by side load
0
200
400
600
800
1000
1200
1400
1600
1800
1 2 3 4 5 6 7 8 9 10 11 12 13 14 15 16
Volt
Pow
er
0
100
200
300
400
500
600
700
800
900
Cur
rent Power without technology
Power with technologyCurrent witout technologyCurrent with technology
Figure 13. LM-3 Variable Fixed Load Test Graphics
c. Atira P-4 Test with Programmable Fixed Load Atira Tech used the Global Solar P-4 modules and the HP 6063B for this
test. The goal of the test was to measure the power output of the Standard system and the
PVPC system under identical conditions. Using the HP 6063B, Atira began with a
minimum load of 0.5V and incrementally increased the loads by 0.5V until they reached
a maximum load of 16.5V for each system. In contrast to the LM-3 Programmable Load
test in section b. above, the 0516 PVPC circuits were specifically designed to optimize a
set of three Global Solar P-4 Modules. Table 15 presents the descriptive statistics for this
test.
For the analysis of this test, we integrated the actual differences between
each system, and the corresponding percentages, into the descriptive statistics table. The
same methods and calculations describe in the previous section were used to determine
these differences and percentages depicted.

71
Table 15. Global Solar P-4 Test with Programmable Fixed Load Descriptive Statistics
Standard PVPC Diff % Diff Standard PVPC Diff % DiffMean 1002.12 1900.30 898.18 89.63% 10481.89 14597.00 4115.11 39.26%Range 1890.00 9270.00 7380.00 390.48% 19620.00 21605.00 1985.00 10.12%Minimum 0.00 0.00 0.00 0.00% 0.00 0.00 0.00 0.00%Maximum 1890.00 9270.00 7380.00 390.48% 19620.00 21605.00 1985.00 10.12%Sum 66140.00 125420.00 59280.00 89.63% 691805.00 963402.00 271597.00 39.26%Count 66.00 66.00 66.00 66.00
Global Solar P-4 Test with Programmable Fixed LoadBattery Current (mA) Watts (mW)
On average, the PVPC system generated 39.26% more power than the
Standard system and demonstrated a 10.12% higher maximum power output at
21,605mW compared to Standard system’s maximum output of 19,620mW. Observing
the mW sum for each system, we determine that for the 66 data recordings, the Standard
system accumulated 691,805mW and the PVPC 963,402mW for a difference of
271,597mW or 39.26%. For further analysis, we used a graph (Figure 14) to compare the
data collected for both systems. For this test, Atira specifically designed PVPC
technology to optimize the Global Solar P-4 module; thus, in contrast to the LM-3
Programmable Fixed Load Test, the PVPC system generated more mW than the Standard
system throughout.
Figure 14. Global Solar P-4 with Variable Fixed Load Graphics

72
2. NPS Field Tests We independently tested the PVPC April 6-11, 2005. Our objective was to
validate the tests conducted by Atira Technologies and to verify that a solar power system
integrated with the PVPC technology would produce more power than an identical
system without the technology. The test approach used was a side-by-side comparison of
solar power systems using procedures that measured the PVPC’s performance levels. We
conducted the tests in the uncontrolled, natural environment that existed on the scheduled
test days with the intention of capturing performance data relevant to a typical temperate
climate. Again, our analysis focuses on two data elements, current (mA) and power
(Watts). As previously shown, we use power as the standard measurement to base our
comparison. For each test, we entered the collected data into a Microsoft Excel
spreadsheet and used the software to generate the descriptive statistics and graphic
depictions for the data, which allowed us to identify any significant and measurable
differences.
a. Glass Panel-7.4V Battery Field Performance Test The solar panels used for the glass panel 7.4V tests were Solengy ASI-F
5/12 framed solar modules. The batteries used were UBC36106102/PCM Ultra-Life
Polymer 3.7V Rechargeable batteries. For each system, we wired two of these batteries
in series to create a 7.4V battery load for glass tests 1-3. The PVPC circuit was a model
1216. Table 16 presents the descriptive statistics for Glass Panel Tests 1 through 3.
For the analysis of this test, we integrated the actual differences between
each system, and the corresponding percentages, into the descriptive statistics table. The
same methods and calculations describe in the previous sections were used to determine
these differences and percentages depicted.

73
Table 16. Glass Test 1-3 Descriptive Statistics
Standard PVPC Diff % of Diff Standard PVPC Diff % of DiffMean 182.64 254.23 71.59 39.20% 1406.33 1986.61 580.28 41.26%Range 407.00 535.00 128.00 31.45% 3015.69 4028.55 1012.86 33.59%Minimum 2.00 0.00 -2.00 -100.00% 15.00 0.00 -15.00 -100.00%Maximum 409.00 535.00 126.00 30.81% 3030.69 4028.55 997.86 32.93%Sum 10228.00 14237.00 4009.00 39.20% 78754.42 111250.06 32495.64 41.26%Count 56.00 56.00 0.00 0.00% 56.00 56.00 0.00 0.00%
Battery Current (mA) Watts (mW)Glass Test 1-3 With 7.4V Battery (6 April 05)
On average, the PVPC system generated 41% more power than the
Standard system and demonstrated a 32.93% higher maximum power output at
4,028.55mW compared to the Standard system’s maximum output of 3,030.69mW.
Observing the mW sum for each system, we determine that for the 56 data recordings, the
Standard system accumulated 78,754.42mW and the PVPC 111,250.06mW for a
difference of 32,495.64mW or 41.26%. For further analysis, we used graphs to visually
compare the data collected for both systems. Due to the different time intervals for each
test, we present individual graphics depicting power versus time (Figures 15-17). For all
three tests, the PVPC system generated more mW than the Standard system.
Figure 15. Glass Test 1: 7.4V mW Comparison Graph
74
Figure 16. Glass Test 2: 7.4V mW Comparison Graph
Figure 17. Glass Test 3 7.4V mW Comparison Graph
b. Glass Panel –3.7V Battery Field Performance Test We conducted a single iteration of this test. The solar panels used were
Solengy ASI-F 5/12 framed solar modules. The batteries used were UBC36106102/PCM
Ultra-Life Polymer 3.7V Rechargeable. To test the system under a different load source,
we intentionally wired two of these batteries in parallel to create a 3.7V battery load. The
1216 PVPC circuit was used. Table 17 presents the descriptive statistics for the Glass
Panel Test with a 3.7V.

75
Table 17. Glass Test 4 Descriptive Statistics
Standard PVPC Diff % of Diff Standard PVPC Diff % of DiffMean 206.87 308.13 101.27 48.95% 796.49 1188.55 392.06 49.22%Median 240.50 380.50 140.00 58.21% 917.56 1458.32 540.76 58.94%Range 368.00 522.00 154.00 41.85% 1427.84 2030.08 602.24 42.18%Minimum 0.00 0.00 0.00 0.00% 0.00 0.00 0.00 0.00%Maximum 368.00 522.00 154.00 41.85% 1427.84 2030.08 602.24 42.18%Sum 6206.00 9244.00 3038.00 48.95% 23894.78 35656.56 11761.78 49.22%Count 30.00 30.00 0.00 0.00% 30.00 30.00 0.00 0.00%
Battery Current (mA) Watts (mW)Glass Test 4 With 3.7V Battery (10 April 05)
On average, the PVPC system generated 49.22% more power than the
Standard system and demonstrated a 42.18% higher maximum power output at
2,030.08mW compared to Standard system’s maximum output of 1,427.84mW.
Observing the mW sum for each system, we determine that for the 30 data recordings, the
Standard system accumulated 23,894.78mW and the PVPC accumulated 35,656.56mW,
for a difference of 11,761.784mW or 49.22%. For further analysis, we present a graph to
compare the data collected for both systems. Figure 18 illustrates that the PVPC system
generated more mW than the Standard system throughout the test.
Figure 18. Glass Test 4 3.7V mW Comparison Graph
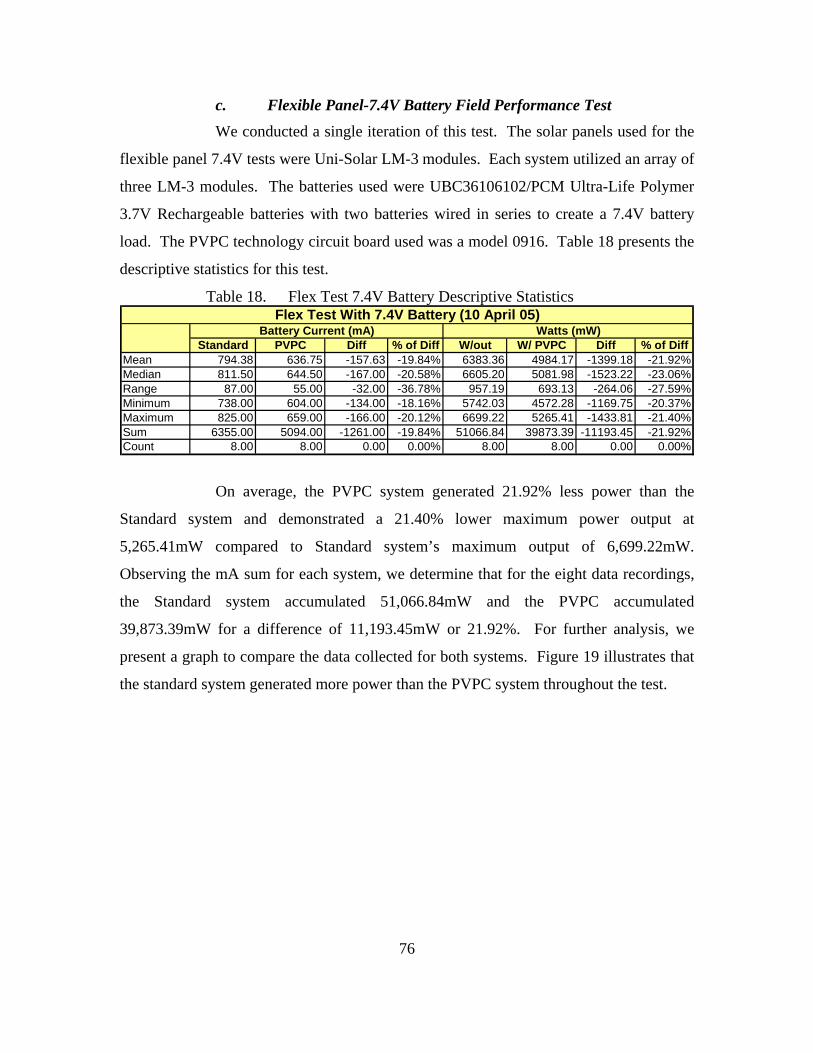
76
c. Flexible Panel-7.4V Battery Field Performance Test We conducted a single iteration of this test. The solar panels used for the
flexible panel 7.4V tests were Uni-Solar LM-3 modules. Each system utilized an array of
three LM-3 modules. The batteries used were UBC36106102/PCM Ultra-Life Polymer
3.7V Rechargeable batteries with two batteries wired in series to create a 7.4V battery
load. The PVPC technology circuit board used was a model 0916. Table 18 presents the
descriptive statistics for this test.
Table 18. Flex Test 7.4V Battery Descriptive Statistics
Standard PVPC Diff % of Diff W/out W/ PVPC Diff % of DiffMean 794.38 636.75 -157.63 -19.84% 6383.36 4984.17 -1399.18 -21.92%Median 811.50 644.50 -167.00 -20.58% 6605.20 5081.98 -1523.22 -23.06%Range 87.00 55.00 -32.00 -36.78% 957.19 693.13 -264.06 -27.59%Minimum 738.00 604.00 -134.00 -18.16% 5742.03 4572.28 -1169.75 -20.37%Maximum 825.00 659.00 -166.00 -20.12% 6699.22 5265.41 -1433.81 -21.40%Sum 6355.00 5094.00 -1261.00 -19.84% 51066.84 39873.39 -11193.45 -21.92%Count 8.00 8.00 0.00 0.00% 8.00 8.00 0.00 0.00%
Battery Current (mA) Watts (mW)Flex Test With 7.4V Battery (10 April 05)
On average, the PVPC system generated 21.92% less power than the
Standard system and demonstrated a 21.40% lower maximum power output at
5,265.41mW compared to Standard system’s maximum output of 6,699.22mW.
Observing the mA sum for each system, we determine that for the eight data recordings,
the Standard system accumulated 51,066.84mW and the PVPC accumulated
39,873.39mW for a difference of 11,193.45mW or 21.92%. For further analysis, we
present a graph to compare the data collected for both systems. Figure 19 illustrates that
the standard system generated more power than the PVPC system throughout the test.

77
Figure 19. Flex Test with 7.4V Battery Field Test
The results of this test, having a battery charging range between 7V and
8.5V, directly correlates with the results from the Atira Programmable Fixed Load test
for the LM-3. In the Atira test, the Standard system produced more power than the PVPC
system at a voltage range between 7V and 10V. This confirmed that the modified 0916
Circuit did not optimize the PVPC system as expected
d. Flexible Panel-3.7V Battery Field Performance Test We conducted a single iteration of this test. The solar panels used for the
flexible panel 3.7V tests were Uni-Solar LM-3 modules. Each system utilized an array of
three LM-3 modules. The batteries used were UBC36106102/PCM Ultra-Life Polymer
3.7V Rechargeable batteries. For each system, we wired two of these batteries in parallel
to create a 3.7V battery load for the test. The PVPC circuit used was a model 1216.
Presented below are the descriptive statistics for this test.

78
Table 19. Flexible Panel Test With 3.7V Battery Descriptive Statistics
Standard PVPC Diff % Dif Standard PVPC Diff % DifMean 275.69 358.50 82.81 30.04% 1102.42 1407.20 304.78 27.65%Median 163.00 252.00 89.00 54.60% 629.18 965.16 335.98 53.40%Range 725.00 855.00 130.00 17.93% 2972.50 3428.55 456.05 15.34%Minimum 0.00 0.00 0.00 0.00% 0.00 0.00 0.00 0.00%Maximum 725.00 855.00 130.00 17.93% 2972.50 3428.55 456.05 15.34%Sum 4411.00 5736.00 1325.00 30.04% 17638.69 22515.20 4876.51 27.65%Count 16.00 16.00 0.00 0.00% 16.00 16.00 0.00 0.00%
Battery Current (mA) Watts (mW)Flex Test With 3.7V Battery (10 April 05)
On average, the PVPC system generated 27.65% more power than the
Standard system and demonstrated a 15.34% higher maximum power output at
3,428.55mW compared to Standard system’s maximum output of 2,972.50mW.
Observing the mA sum for each system, we determine that for the 16 data recordings, the
Standard system accumulated 17,638.69mW and the PVPC 22,515.20mW for a
difference of 4,876.51mW or 27.65%. For further analysis, we used a graph to compare
the data collected for both systems. Figure 20 illustrates that the PVPC system generated
more power than the standard system throughout the test.
Flex Test with 3.7V Battery
0500
1000150020002500300035004000
6:30
6:45
7:15
7:45
8:15
8:45
9:15
9:45
Time
mW
PVPCStandard
Figure 20. Flex Test with 3.7V Battery Field Test

79
3. Raven Designs Field Tests Atira Technologies collaborated with Raven Designs to integrate the PVPC
technology into one of newly developed solar charging products. Atira incorporated the
technology into an SBR Solar Pack Cover. Raven Designs designed the SBR to recharge
the UBI 2590 rechargeable battery, a battery used extensively by U.S. military forces.
During the first week of November 2004, Steve Locher, designer of the SBR,
spent a week testing the product in Kodiak, Alaska. He conducted his test with U.S.
Navy Seal Instructors at the Northern Warfare Training Center. Following the test
conducted in Alaska, Mr. Locher conducted similar field-testing of the Solar Pack, with
the integrated PVPC technology, in Monterey, CA.
The purpose of Mr. Locher’s tests was to evaluate the performance of the SBR
system in an operational environment. This test approach and objective is significantly
different from the approaches and objectives of the previous product tests analyzed
above. As indicated, the previous tests were side-by-side comparisons based on
quantitative outputs to determine if the PVPC technology increases the power output of
an existing system. In contrast, the objective of the Raven design tests was to determine
if the SBR would recharge a UBI-2590 battery in an operational environment. As a
result, our analysis of this test is more qualitative than quantitative.
Review of Mr. Locher’s comments for the test conducted in Alaska reveals that
the SBR system increased the charge of a UBI-2590 battery by approximately 26.6%
over a nine-hour period. Further, the system increased the battery’s charge in the low
light conditions characteristic of Kodiak Alaska during the month of November. It is
apparent that the SBR, with the PVPC, did function as intended; however, because we do
not have a benchmark to evaluate the rate of charge, we are unable to determine the
efficiency of the systems performance or the specific impact of the integrated PVPC
technology.
In contrast to the low light conditions typical of a November day in Kodiak,
Alaska, the light conditions were more favorable for the test conducted in Monterey, CA.
Mr. Locher conducted in the Monterey test on a clear day during the last week of

80
November. During the Monterey test, the SBR increased the charge of the UBI-2590
battery by 71%. As above, it is apparent that the SBR integrated with the PVPC
functioned successfully in an operational environment but once again, a benchmark is not
available to determine the efficiency of the SBR or the PVPC.
4. Summary Analysis of Quantitative Product Tests Overall, we analyzed and presented the results for seven individual tests using
conventional and automated analytical tools to extract information from the test data. In
this section, we review our individual analysis to identify any correlations and/or
consistencies between the individual tests that may support overall or summary
conclusions about the PVPC technology. To support a general conclusion or inference of
whether or not a solar power system integrated with the PVPC generates more power, we
will conduct a Difference between Two Means Test: Matched Pairs. To accomplish this
we will first review the different tests and determine which tests, if any, are outliers and
remove them accordingly from the analysis. Second, we will conduct the Matched Pairs
test, and third, we analyze and interpret the results.
Outliers are data elements that may potentially skew the results of a statistical
analysis. In our study, we exclude any test data set that was incorrectly included. To aid
in identifying any outliers, we created Table 20 below. This table lists each test
conducted and provides the average power for the Standard and PVPC systems, their
numerical differences, and the percentage of differences based on the mean of the
Standard system.
Table 20. Test Summary of Individual Tests
Test Standard PVPC Diff % DiffAtira LM-3 Flex Test w/ Variable Fixed Load 707.73 1102.88 395.15 55.83%
Atira LM3 12V Test 206.38 614.32 407.95 197.67%
Atira P-4 Test w/ Variable Fixed Load 10481.89 14597.00 4115.11 39.26%Glass Test 1-3 w/ 7.4V Battery 1406.33 1986.61 580.28 41.26%Glass Test 4 w/ 3.7V Battery 796.49 1188.55 392.06 49.22%Flex Test w/ 7.4V Battery 6383.36 4984.17 -1399.18 -21.92%Flex Test w/ 3.7V Battery 1102.42 1407.20 304.78 27.65%
Test Summary by Individual Test (mW)

81
During our analyses, we identified four tests that are potential outliers. The first
test is the Atira 12V LM-3 12V Test. As illustrated in the table above, the PVPC system
generated an average of 197% more power than the standard system. Although the
numbers are accurate, this test data will inappropriately skew our results. As discussed in
the individual analysis of the test, Atira did not specifically design the PVPC 0916 to
operate at an optimal level with the Uni-Solar LM-3 module. Likewise, Uni-Solar did
not design the LM-3 Module to charge a 12V battery. In fact, Atira had modified a 1216
to create the 0916 PVPC just to illustrate that the technology could enable the 9V, LM-3
array to operate outside of its design limits. In this regard, the test was a success;
however, for our final analysis we will only include data from test scenarios that allow
both systems to operate at their optimal design configurations. Therefore, the Atira LM-3
12V Test is classified as an outlier and is not included in our final data population. The
second and third outliers, the Atira LM-3 Test w/ Programmable Fixed Load and Flex
Test with 7.4V Battery, are not included in our final data population. We removed these
tests from consideration for the same reasons stated above.
There was a fourth test that we considered a potential outlier; the Flex Test with
3.7V Battery. Like the proceeding test, this test was conducted using a non-optimized
0916 circuit with the 9V LM-3 modules; however, the relevant charging range and
threshold of a 3.7V configuration, allowed both systems to operate as designed.
Therefore, the Flex Test with 3.7V Battery is not classified as an outlier and is included
in the final analysis.
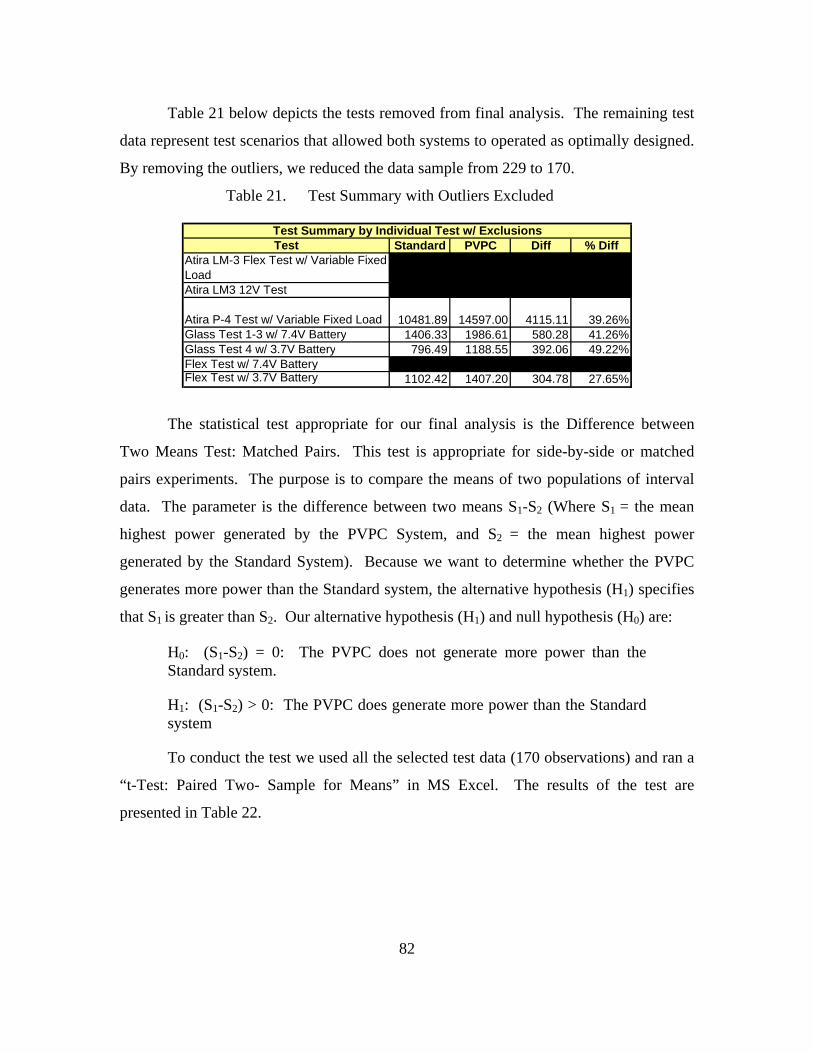
82
Table 21 below depicts the tests removed from final analysis. The remaining test
data represent test scenarios that allowed both systems to operated as optimally designed.
By removing the outliers, we reduced the data sample from 229 to 170.
Table 21. Test Summary with Outliers Excluded
Test Standard PVPC Diff % DiffAtira LM-3 Flex Test w/ Variable Fixed LoadAtira LM3 12V Test 206.38 614.32 407.95 197.67%
Atira P-4 Test w/ Variable Fixed Load 10481.89 14597.00 4115.11 39.26%Glass Test 1-3 w/ 7.4V Battery 1406.33 1986.61 580.28 41.26%Glass Test 4 w/ 3.7V Battery 796.49 1188.55 392.06 49.22%Flex Test w/ 7.4V BatteryFlex Test w/ 3.7V Battery 1102.42 1407.20 304.78 27.65%
Test Summary by Individual Test w/ Exclusions
The statistical test appropriate for our final analysis is the Difference between
Two Means Test: Matched Pairs. This test is appropriate for side-by-side or matched
pairs experiments. The purpose is to compare the means of two populations of interval
data. The parameter is the difference between two means S1-S2 (Where S1 = the mean
highest power generated by the PVPC System, and S2 = the mean highest power
generated by the Standard System). Because we want to determine whether the PVPC
generates more power than the Standard system, the alternative hypothesis (H1) specifies
that S1 is greater than S2. Our alternative hypothesis (H1) and null hypothesis (H0) are:
H0: (S1-S2) = 0: The PVPC does not generate more power than the Standard system.
H1: (S1-S2) > 0: The PVPC does generate more power than the Standard system
To conduct the test we used all the selected test data (170 observations) and ran a
“t-Test: Paired Two- Sample for Means” in MS Excel. The results of the test are
presented in Table 22.

83
Table 22. t-Test: Paired Two Sample for Means
Standard PVPCMean 4777.02 6663.67Variance 43409537 61976023Observations 170 170Pearson Correlation 0.936341001Hypothesized Mean Difference 0df 169t Stat -8.56312P(T<=t) one-tail 0.00000t Critical one-tail 1.65392P(T<=t) two-tail 0.00000t Critical two-tail 1.97410
t-Test: Paired Two Sample for Means
With a test statistic of -8.56 and a p-value of .0000, there is overwhelming
evidence to infer that the PVPC System generates more power than the Standard System,
that is, we reject our null hypothesis above. Next, we estimate the mean difference power
output from the two systems with a 95% confidence interval. Table 23 depicts the
results.
Table 23. Estimated Mean Difference
Mean 1886.65Standard Deviation 2872.66LCL 1451.71UCL 2321.59
t-Estimate: Mean
Based on statistical test results depicted in Tables 22 and 23, we estimate with a
95% confidence interval, that the mean power (mW) for the PVPC exceeds the mean
power (mW) for the Standard system by an amount that lies between 1,451.71mW and
2,321.59mW as depicted as the LCL and UCL above. By dividing the Lower Control
Limit and the Upper Control Limit in Table 23 by the mean of the Standard system in
Table 22, we can state more simply that we estimate that the PVPC generates between
30.39% and 48.60% more power than the Standard system with point estimate of 39.49%
more power.
84
C. TECHNOLOGY READINESS ASSESSMENT As stated in Chapter II, Technology Readiness Levels are a consistent
measurement to categorize the maturity level of a program’s key technologies and
provide a common language or reference to the science and technology community
within the DoD. The purpose of this section is to correlate the product description and
type of product tests for the PVPC with the appropriate Technology Readiness Level. To
accomplish this we use a format similar to Chapter III, section D, except that item c. now
presents supporting documentation specifically for the PVPC versus the general example
provided earlier. Our process is to review the definition of each TRL, beginning with
TRL 1, and correlate the appropriate supporting information from Chapters II, III and IV.
We analyze each TRL consecutively until we are unable to submit the appropriate
support information to justify a transition to the next TRL.
1. TRL 1: Basic Principles Observed and Reported
a. Description TRL 1 is the lowest level of technology readiness. At this level, scientific
research begins to be translated into applied research and development.
b. Required Supporting Information Supporting information required includes published research that
identifies the principles that underlie this technology. References must include who,
where, and when.
c. PVPC Supporting Information (1) The Cooperative Research and Development Agreement
between the NPS and Atira Technologies identify the principles that underlie the PVPC
technology, May 2004. Chapter I, page 19, Atira and NPS.
(2) The cited works of Alexander Wolf and David Besser
identify and provide a detailed description of the principles that underlie the PVPC.
Chapter III, section B, Product Description: Converting Solar Power.

85
2. TRL 2: Technology Concept and/or Application Formulated
a. Description Invention begins at TRL 2. Once basic principles are observed, practical
applications can be invented. At TRL 2 applications are speculative, and proof or
detailed analysis to support the assumptions may be lacking.
b. Supporting Information Supporting information for TRL 2 include publications or other references
that outline the application being considered and that provide analysis to support the
concept.
c. PVPC Supporting Information Mr. Stefan Matan’s personal account of his development of the
mathematical model he used to develop the technology and the solar cube he created.
Chapter I, page 16-17.
3. TRL 3: Analytical and Experimental Critical Function and/or Characteristic Proof of Concept
a. Description TRL 3 is characterized by the initiation of active research and
development that includes analytical studies and laboratory studies to physically validate
analytical predictions of separate elements of the technology.
b. Supporting Information Supporting information include results of laboratory tests performed to
measure parameters of interest and comparison to analytical predictions for critical
subsystems. References must include who, where, and when the tests and comparisons
were performed.
c. PVPC Supporting Information The cited works of Alexander Wolf and David Besser, as well as
identifying and providing a detailed description of the principles that underlie the PVPC,
also analyze the results of tests which indicate that the PVPC can increase the
performance of a solar power system by as much as 25 percent. This claim is what
initiated our investigation. Chapter III, section B, Product Description: Converting Solar
Power.

86
4. TRL 4: Component and/or Breadboard Validation in a Laboratory Environment
a. Description At level TRL 4 basic technological components are integrated to establish
that they will work together. This is relatively ‘low fidelity” compared to the eventual
system.
b. Supporting Information Supporting information necessarily includes system concepts that have
been considered and results from testing laboratory-scale breadboard(s). References must
provide who, where, and when the tests and comparisons were performed.
c. PVPC Supporting Information (1) Atira Technologies LM-3 Test with 12V Load conducted
by Atira Technologies, 8 February 2005. Chapter III, page 37, Chapter IV, page 63.
(2) Atira Technologies LM-3 Test with Variable Fixed Load
conducted by Atira Technologies, 20 February 2005. Chapter III, page 39, Chapter IV,
page 69,80.
(3) Atira P-4 Test with Variable Fixed Load conducted by
Atira Technologies, 25 April 2005. Chapter III, page 40, Chapter IV, page 70, 80
5. TRL 5: Component and/or Breadboard Validation in a Relevant Environment
a. Description Fidelity of breadboard technology increases significantly at TRL 5. The
basic technological components are integrated with reasonably realistic supporting
elements so they can be tested in a simulated environment.
b. Supporting Information Supporting information consist of results from testing a laboratory
breadboard system that are integrated with other supporting elements in a simulated
operational environment. Documentation should address questions such as, how the
relevant environment differs from the expected operational environment; how do the test
results compare with expectations; what problems, if any, were encountered; was the
breadboard system refined to match the expected system goals more nearly?

87
c. PVPC Supporting Information (1) NPS, Glass Panel 7.4V Battery Field Performance Tests
conducted by the authors, 6-10 April 2005, Chapter III, page 41-44, Chapter IV, page 73-
74, 80
(2) NPS, Glass Panel 3.7V Battery Field Performance Test
conducted by the authors, 10 April 2005, Chapter III, page 47, Chapter IV, page 77-78,
80.
(3) Raven Designs Field Tests conducted by Steve Locher
Novemeber 2004, Lafayette, CA, Chapter III, page 48, Chapter IV, 78.
6. TRL 6: System/Subsystem Model or Prototype Demonstration in a Relevant Environment
a. Description TRL 6 is characterized by a representative model or prototype system,
which is well beyond that of TRL 5 that is tested in a relevant environment. This level
represents a major step up in a technology’s demonstrated readiness.
b. Supporting Information Supporting information should consist of results from laboratory testing of
a prototype system that is near the desired configuration in terms of performance, weight,
and volume. Questions to address are how did the test environment differ from the
operational environment? Who performed the tests? How did the test compare with
expectations? What problems, if any, were encountered? What are/were the plans,
options, or actions to resolve problems before moving to the next level?
c. PVPC Supporting Information PVPC supporting information is not currently available to justify a
transition to TRL 6.
D. DOD TECHNOLOGY INSERTION METHODS
1. Commercial Item To begin our analysis, we restate the first part of the commercial item definition
from the Commercial Item Handbook.

88
(a) Any item, other than real property, that is of a type customarily used by the general public or by nongovernmental entities for purposes other than governmental purposes, and that—
(1) Has been sold, leased, or licensed to the general public; or
(2) Has been offered for sale, lease, or license to the general public…81
a. Establishing Commerciality By their very nature, photovoltaic systems, and their various components,
are intended for use by the public. The capability to convert photons into electrical
energy is not one that is solely desired by the Government. The PVPC is intended to
make PV power systems more efficient and cost effective.
Drawing upon the description of the product in Chapter III, we recall that
the PVPC is constructed from commercially available components. Also in Chapter III,
we established that Atira sold the PVPC to Raven Designs, who has incorporated it into
their solar charging products and offered it for sale to the public. This establishes that
there have been both business-to-business sales and that the PVPC is being indirectly
offered for sale to the general public. In Annex B, we provide a completed Commercial
Item Checklist from the Commercial Item Handbook. Given the available evidence, the
PVPC fully meets the commercial item definition.
b. The Benefits of Commercial Item Classification Over the past decade, our government has been streamlining and
transforming our federal acquisition policies and processes into a system that more
closely resembles commercial industry standards or “best practices.” This transformation
of the Federal Acquisition System has been characterized by three specific acts passed by
Congress: the Federal Acquisition Streamlining Act of 1994 (FASA), the Federal
Acquisition Reform Act of 1995 (FARA), and most recently the Service Acquisition
Reform Act of 2003 (SARA). Before FASA emerged, the definition of a commercial
81 Commercial Item Handbook, Office of the Secretary of Defense, Acquisition, Technology and
Logistics, November 2001, Appendix C

89
item was much more restrictive and it was a much more difficult process to get an item
declared as commercial. All three of these acts emphasize the benefits of procuring
“commercial items”.
J.S. Gansler, the former Under Secretary of Defense for Acquisition,
Technology, and Logistics summarizes these benefits:
We must expand the use of commercial items in Department of Defense systems so we can leverage the massive technology investments of the private sector; reap the benefits of reduced cycle times, faster insertion of new technologies, lower life cycle costs, greater reliability and availability, and support from a robust industrial base. To accomplish this we must capitalize on the technical advances in the commercial marketplace by carefully reviewing our requirements to determine where they can be satisfied by commercially available products or where they can be altered to enable the Department to leverage the commercial sector.82
The idea is that if private industry has identified the demand for a product, they will
already be spending their money to develop it, make it reliable, and quickly get it to
market so they can begin earning a profit. If DoD can use it, they may be able to acquire
needed capabilities “better, faster and cheaper” than if they contracted for a
developmental item. DoD will also reap the benefits of the economies of scale that the
manufacturer enjoys when producing for a vastly larger population of users than just the
Government. The marketplace drives the producer to reduce defects in the item and
update the item with new, and increasing functionality and capabilities to maintain
market share all at the producer’s expense – not the Government’s. There is also a less
visible benefit to procuring a commercial item.
Even after a decade of acquisition reform, the process of doing business
with the Government is so complicated and includes such a vast amount of burdensome
laws and regulations that some firms simply refuse to participate when we send out a
82 J.S. Gansler, Memorandum as Forward to, Office of the Secretary of Defense Report on
Commercial Item Acquisition: Considerations and Lessons Learned, (Washington D.C.: 2000).

90
request for proposal. For the firms that choose to do business with our Government, DoD
in particular, the cost of complying with these regulatory and administrative burdens has
been estimated.
In its December 1994 report, The DOD Regulatory Cost Premium: A Quantitative Assessment, [the consulting firm of] Coopers and Lybrand identified over 120 regulatory and statutory “cost drivers” that, according to the contractors surveyed, increase the price DOD pays for goods and services by 18 percent.83
Table 24 below shows the top ten regulatory burdens and their estimated
share of the total 18 percent compliance premium paid to contractors for doing business
with the DoD. It also shows that these ten cost drivers account for almost 50 percent of
the total DoD cost premium. If the costs associated with complying with these drivers
still exist today and a determination of commerciality offered relief from some of the
regulations, it would save the Government and industry both time and money.
83 General Accounting Office, GAO/NSIAD-96-106, Acquisition Reform: Efforts to Reduce the
Cost to Manage and Oversee DOD Contracts, (Washington, D.C.: 1996), 1.

91
Table 24. DoD Regulatory Compliance Costs: Top Ten Cost Drivers84
Item # Cost Driver Coopers & Lybrand's Est Cost
Percent of Total 18%
1 MIL-Q-9858A 1.7% 9.4%2 Truth in Negotiations Act (TINA) 1.3% 7.2%
3 Cost and Schedule Control System Requirements 0.9% 5.0%
4 Configuration Management 0.8% 4.4%5 Contract Specific Requirements 0.7% 3.9%
6
Defense Contract Audit Agency (DCAA)/Defense Contract
Management Agency (DCMA) Interface Requirements
0.7% 3.9%
7 Cost Accounting Standards (CAS) 0.7% 3.9%
8 Material Management and Accounting System (MMAS) 0.6% 3.3%
9 Engineering Drawings 0.6% 3.3%
10 Government Property Administration 0.5% 2.8%
Total of Estimated 18 % Cost Premium 8.5% 47.2%
Nine out of these ten cost drivers still exist today. The exception is MIL-
Q-9858A, which the International Standards Organization’s (ISO) 9000 series and other
commercially based quality standards replaced. However, the process to obtain ISO
certification is expensive and firms that pursue certification transfer the cost to the
consumer through the product price. Today’s competitive marketplace compels these
firms to adopt ISO 9000 quality standards. As a result, through the purchase of
commercial items the Government is able to share the cost with the general population.
The determination of commerciality on a procurement item relieves both
the Government and potential suppliers from costly administrative and regulatory
requirements. Specifically it eliminates, either directly or indirectly, cost drivers 1, 2, 4,
7, 9, and most likely 10. This is a cost savings of 5.6 percent of the contract price. When
talking about multi-million dollar contracts, 5.6 percent can add up very quickly.
84 Created with data from: General Accounting Office, GAO/NSIAD-97-48, Acquisition Reform: DoD Faces Challenges in Reducing Oversight Costs, (Washington, D.C.: 1997), 20-21.

92
2. Advance Concept Technology Demonstration An ACTD is designed to integrate technology into a prototype capability so the
warfighter can evaluate the capability in an operational environment and determine the
military utility of the technology and the capability it enables. One of the primary goals
of the program is to “prepare to transition the capability into acquisition without loss of
momentum…”85. Based upon the preceding analysis of the performance level and
Technology Readiness Level of the PVPC, we believe it can be integrated into a useful
prototype technology demonstrator and provide the warfighter with a useful increment of
military capability in renewable power for numerous battery applications.
85 <http://www.acq.osd.mil/actd/intro.htm#Introduction>, [20 April 2005]

93
V. CONCLUSIONS AND RECOMMENDATIONS
A. INTRODUCTION In this final Chapter of the report, we answer the primary and secondary research
questions posed in Chapter I. We also make recommendations for further research.
B. CONCLUSIONS
1. Primary Research Questions:
a. Does the PVPC Allow a Solar Power System to Produce 25 Percent More Power Than an Identical System without the Technology Integrated?
As computed from the information in Tables 22 and 23, testing has
demonstrated that the PVPC, on average, with a statistically significant point-estimate of
39.49%, produced more power than did an identical system without this technology. In
addition, we estimate, with 95% confidence, that the PVPC converts between 30.39% -
48.60% more power than the standard system.
As indicated in our analysis, certain tests were outliers and not included in
the final summary analysis we conducted to reach the above general conclusion. Such a
test was the LM-3 panel test conducted with the 0916 PVPC charging the 12V Ultra-Life
battery. Atira conducted this test, shown in Table 2, to demonstrate that with the
technology, a 9V panel could charge a 12V battery. The fact that it converted previously
unusable power into usable power is an infinite improvement. We could not devise a
methodology to show quantitatively how much more usable power is being produced,
only the difference between what is produced, whether usable or not. This is an
important distinction, because devising a surrogate for an infinite improvement would
likely increase the comparative advantage of the PVPC beyond the figures provided
above. Obviously, enabling a system to produce usable power when it previously could
not is a significant capability improvement. In summary, we believe the 39.49% point
estimate is a conservative figure.

94
With this technology, the capability exists to charge various batteries with
a single panel that formerly only serviced a single battery. It also provides the capability
to generate more power during periods of low light than the standard solar power system,
b. What is the Current Technology Readiness Level of the PVPC, as Defined by DoD 5000.2-R Appendix 6?
The analysis in Chapter IV identifies and correlates the necessary
supporting information to justify that the PVPC meets all of the criteria for Technology
Readiness Level 5; however, it is very close to meeting the criteria for TRL 6. To
explain further, the technology maturity of the PVPC exceeds level five, however, the
formal documentation to justify an assessment at TRL 6 is not available. In addition, we
also conclude that the PVPC’s current level of technological maturity can increase to
TRL 6, or higher, with the inclusion of three key improvements, all of which are
currently being actively pursued. The first key improvement is miniaturizing the circuit
board to the size of a standard computer microprocessor (abut the size of a postage
stamp). The second key improvement is to incorporate a microprocessor into the circuit
that will allow the PVPC to perform optimally over a larger range of input power and
output loads. This would eliminate the need to design specific PVPC circuits for each
application. The third key improvement is to demonstrate the producibility of the
improved circuit as described above
Although improvements could be made in its current configuration, and at
a TRL 5, the PVPC could be horizontally inserted into an existing battery powered
military product and would provide a usable increment of capability that significantly
exceeds that of the current system.
2. Secondary Research Questions:
a. What is the Appropriate Insertion Method for the PVPC into the DoD Acquisition System?
Under the umbrella of commercial item acquisition, the PVPC can be
inserted both as an HTI and as an ACTD. We formed our conclusion, and later, our
recommendation for the PVPC, from three intermediate conclusions.
After analyzing the PVPC against the criteria in the FAR that defines a
commercial item, our first conclusion is the PVPC meets the definition of a commercial

95
item. Commercial item classification eases many rules and regulations in the acquisition
process. It also allows the Government to realize cost savings and benefits from a more
fast-paced, market-driven series of technological updates in the areas of functional
capabilities, reliability, availability, and maintainability. Secondly, we conclude that,
based on the goals and objectives of the Advanced Technology Concept Demonstration
Program and the current level of technological maturity of the PVPC, that it is an
excellent candidate for the ACTD Program. Thirdly, we conclude that many military
programs that deal with battery powered or charging applications could benefit greatly
from a horizontal technology insertion of the PVPC. For these programs, an HTI of the
PVPC would be the next evolutionary step in the incremental development of their
capabilities.
b. What Organization Should Provide Management and Oversight of PVPC Development?
We conclude that it would be necessary for command and control,
logistical, and configuration management purposes to designate a Joint Program Office or
a DoD Program Office to manage this effort. Given the vast applications for this product,
it is important that the PVPC be managed at the Joint level. This method is preferred to
the Services independently procuring and inserting it into their programs. We conclude
the DoD Project Manager for Mobile Electric Power (MEP) manage and oversee the
PVPC development. This Project manager:
is responsible for research, development, acquisition, fielding, and logistics support of a modernized standard family of mobile electric power systems for all services throughout the Department of Defense which range from small, 0.5kW manportable systems to large 920kW prime power generating systems.86
C. RECOMMENDATIONS
1. Overall Recommendations for the PVPC We recommend a two-pronged approach to insert the PVPC into the DoD
Acquisition Framework. The PVPC should be acquired as a commercial item and
inserted into currently fielded or more mature acquisition programs (past Milestone B) as
86 Project Manager Combat Systems Support (PM CSS) Homepage, http://peocscss.tacom.army.mil/pmCSS.html>, May 2005.

96
a Horizontal Technology Insertion. Simultaneously, the PVPC should be approved for an
ACTD to demonstrate its enhanced power production capabilities in less mature
acquisition programs that could benefit from a renewable power source.
The first prong of this approach (HTI) utilizes the evolutionary acquisition
approach that leverages this product’s potential to add capability to the next envisioned
“block” upgrade of any system that can take advantage of the increased power it
produces. An example of the HTI approach would be to take the Army’s current PP-
8498/U Multi-Port Universal Battery Charger (NSN: 6130-01-495-2839) and introduce a
solar powered variant with integrated PVPC technology or to add this capability to the
current version via a modification or upgrade kit. The PP-8498/U, seen below in Figure
21, is the Army’s newest smart charger for a plethora of batteries. Table 25 lists the
batteries it can charge and examples of the end items they power.
Figure 21. PP-8498/U Multi-Port Universal Battery Charger87
87 From the Integrated Power Management Homepage,
https://lrcteams.monmouth.army.mil/QuickPlace/ipm/PageLibrary85256A2B0062C0F7.nsf/h_Toc/F8DED136FF17831985256B3E006CF4E0/?OpenDocument, May 2005.

97
Table 25. PP-8498/U Compatible RechargeableBatteries and End Items They Power (After
Integrated Power Management Homepage, May 2005)
Rechargeable Battery Nomenclature
Non Rechargeable Equivalent
End Item Example:
BB-2590/U Li-Ion BA-5590 and BB390A/B
Most SINCGARS, M22 & AN/PSC-5
BB-390B/U. Replacement for the BB-390A/U
BA-5590 Above applications plus JAVELIN
BB-388A/U BA-5588 AN/PRC-126
BB-516A/U NONE AN/PVS-6 (MELIOS)
BB-503A/U NONE Dragon Night sight (JAVELIN) is replacing)
BB-2847A/U BA-5347 Thermal Weapon Sight (TWS): AN/PAS-13
BB-2800/U BA-5800 AN/PSN-11 (PLGR-GPS) CAM /JCAM
BB-2600A/U BA-5600 HTU and AN/PSC-2,
BB-557/U BA-5557 REMBASS (AN/GSQ-187)
The second prong of the approach is to use an ACTD to integrate the technology
into an evolving capability to determine the military utility of combining the technology
and the capability. The Future Combat System (FCS) offers such an opportunity. FCS
may benefit greatly by integrating the PVPC into many of its emerging technologies
including its Unattended Munitions family of systems. We believe all three systems in
this family are excellent ACTD candidates. The Non-Line-of-Sight Launch System
(NLOS-LS), the Intelligent Munitions Systems (IMS), and the Unattended Ground
Sensors (UGS), will all likely require extended operations battery technology to meet the
“unattended” period specified in the FCS Operational Requirements Document.
Alternatively, the adoption of a renewable power supply may satisfy the requirement.

98
This family of systems is intended to operate in austere environments and transmit
their data to remotely located operators and decision makers. Figure 22 below depicts
current concept computer renderings of these systems.
Figure 22. Unattended Munitions Family of Systems (After: Program Manager Unit of Action, White Paper)88
By having an efficient solar power generation and battery charging capability
incorporated, these systems could sustain themselves for a significantly longer, if not
indefinite period, as compared to battery power alone. This is the same concept as fitting
NASA spacecraft with solar panels so they can continue to transmit their data for decades
in the austere environment of space.
2. Recommendations for Future Research
• Student team conduct an Analysis of Alternatives to determine which
program would be the most beneficial to use as an ACTD
• Student team prepare the recommendation packet for acceptance into
the ACTD program
• NPS and Atira, under the provisions of the CRADA, modify a PP-
8498/U Multi-Port Universal Battery Charge to determine the
usefulness of a solar charging variant
88 Future Combat Systems, 18 + 1 +1 Overview, Whitepaper, (Program Manager Unit of Action,
2005), 8-9.

99
• Since the PVPC is not restricted to solar energy, future studies could
examine other applications for it, such as hydro-electric conversion,
geothermal-electric conversion, or the conversion of wind into
electricity. All these sources have points at which the “wheel” is
turning and producing power, but that power does not meet the
threshold requirements of the system. Using the PVPC to make a low
flow water or wind source produce usable power could open up a
whole new area of power production in these industries.

100
THIS PAGE INTENTIONALLY LEFT BLANK

101
APPENDICES
APPENDIX A – PVPC TEST PLAN
TEST PLAN
Photovoltaic Power Converter (PVPC)
April 10, 2005

2
APPENDIX A – TEST PLAN TABLE OF CONTENTS
1.0 OBJECTIVE ......................................................................................................................3
2.0 TEST APPROACH............................................................................................................3
3.0 EQUIPMENT LIST...........................................................................................................4 3.1 GLASS PANEL-7.4V BATTERY FIELD PERFORMANCE TEST. ..............4 3.2 GLASS PANEL –3.7V BATTERY FIELD PERFORMANCE TEST..............4 3.3 FLEXIBLE PANEL-7.4V BATTERY FIELD PERFORMANCE TEST ........4 3.4 FLEXIBLE PANEL-3.7V BATTERY FIELD PERFORMANCE TEST ........4
4.0 PERSONNEL REQUIREMENTS ...................................................................................5
5.0 TEST DURATION.............................................................................................................6 5.1 GLASS PANEL-7.4V BATTERY FIELD PERFORMANCE TEST ...............6 5.2 GLASS PANEL –3.7V BATTERY FIELD PERFORMANCE TEST..............6 5.3 FLEXIBLE PANEL-7.4V BATTERY FIELD PERFORMANCE TEST ........6 5.4 FLEXIBLE PANEL-3.7V BATTERY FIELD PERFORMANCE TEST ........6
6.0 TEST LOCATIONS ..........................................................................................................6
7.0 TEST SETUP .....................................................................................................................7
8.0 TEST PROCEDURES.......................................................................................................8
9.0 TEST DATA.......................................................................................................................9 9.1 GLASS PANEL-7.4V BATTERY FIELD PERFORMANCE TEST ...............9 9.2 GLASS PANEL –3.7V BATTERY FIELD PERFORMANCE TEST............15 9.3 FLEXIBLE PANEL-7.4V BATTERY FIELD PERFORMANCE TEST:.....17 9.4 FLEXIBLE PANEL-3.7V BATTERY FIELD PERFORMANCE TEST ......17

3
1.0 OBJECTIVE To independently verify that a solar power system integrated with a PVPC, developed by Atira Technologies will produce more power than an identical system without the PVPC. Atira technologies presented data from previous tests the company has conducted; however, to date, independent tests have not been conducted to validate Atira’s test results. The tests within this test plan will support or refute Atira’s previous test results that suggest the PVPC allows more potential power to be converted into usable power. 2.0 TEST APPROACH The approach of this test plan is to establish field-test procedures for the PVPC that will measure the PVPC’s performance levels in a relevant environment. All tests conducted will be side-by-side comparisons of identical solar power systems, under the same conditions, except that one system has the PVPC integrated. Field-testing of the PVPC will consist of testing the PVPC’s performance in at least four differently configured solar power systems. These tests will be conducted in the uncontrolled, natural environment that exists on the scheduled test days. The intent of the field tests is to capture performance data relevant to a typical temperate climate. All field tests will be conducted on the rooftop of Ingersoll Hall on the campus of the Naval Postgraduate School (NPS), in Monterey California.

4
3.0 EQUIPMENT LIST
3.1 Glass Panel-7.4V Battery Field Performance Test. (1) Solengy, ASI-F 5/12 framed solar module, quantity (2). (2) UBC36106102/PCM Ultralife Polymer 3.7V Rechargeable Battery, quantity (8) (3) Atira Technologies 1216 Photovoltaic Power Controller, quantity (1) (4) Digital Multi-meter such as a Fluke 87, quantity (4) (5) Digital Light Meter, Reed ST-1300 (1) (6) Digital Infrared Mini Thermometer (1) (7) Digital Camera, quantity (1) (8) Laptop computer, quantity (1) 3.2 Glass Panel –3.7V Battery Field Performance Test. (1) Solengy, ASI-F 5/12 framed solar module, quantity (2). (2) UBC36106102/PCM Ultralife Polymer 3.7V Rechargeable Battery, quantity (8) (3) Atira Technologies 1216 Photovoltaic Power Controller, quantity (1) (4) Digital Multi-meter such as a Fluke 87, quantity (4) (5) Digital Light Meter, Reed ST-1300 (1) (6) Digital Infrared Mini Thermometer (1) (7) Digital Camera, quantity (1) (8) Laptop computer, quantity (1) 3.3 Flexible Panel-7.4V Battery Field Performance Test (1) Uni-Solar LM-3 solar module, quantity (4). (2) UBC36106102/PCM Ultralife Polymer 3.7V Rechargeable Battery, quantity (8) (3) Atira Technologies 0916 Photovoltaic Power Controller, quantity (1) (4) Digital Multi-meter such as a Fluke 87, quantity (4) (5) Digital Light Meter, Reed ST-1300 (1) (6) Digital Infrared Mini Thermometer (1) (7) Digital Camera, quantity (1) (8) Laptop computer, quantity (1)
3.4 Flexible Panel-3.7V Battery Field Performance Test
(1) Uni-Solar LM-3 solar module, quantity (4). (2) UBC36106102/PCM Ultralife Polymer 3.7V Rechargeable Battery, quantity (8) (3) Atira Technologies 0916 Photovoltaic Power Controller, quantity (1) (4) Digital Multi-meter such as a Fluke 87, quantity (4) (5) Digital Light Meter, Reed ST-1300 (1) (6) Digital Infrared Mini Thermometer (1) (7) Digital Camera, quantity (1) (8) Laptop computer, quantity (1)

5
4.0 PERSONNEL REQUIREMENTS (1) Test Officer: MAJ Steven Ansley, MBA candidate at NPS, Graduate School of
Business and Public Policy (GSBPP) (2) Test Officer: MAJ Lewis Phillips, MBA candidate at NPS, GSBPP (3) System Engineer: Stefan Matan, PVPC Inventor, Atira Technologies (4) System Engineer: Dave Besser, Atira Technologies
6
5.0 TEST DURATION
5.1 Glass Panel-7.4V Battery Field Performance Test Setup requires approximately 30 Minutes. Testing takes an estimated 4-7 hours (Duration is dependent on weather conditions and time of year). Take down requires approximately 30 minutes.
5.2 Glass Panel-3.7V Battery Field Performance Test Setup requires approximately 30 Minutes. Testing takes an estimated 6-9 hours (Duration is dependent on weather conditions and time of year). Take down requires approximately 30 minutes.
5.3 Flexible Panel-7.4V Battery Field Performance Test Setup requires approximately 30 Minutes. Testing takes an estimated 4-7 hours (Duration is dependent on weather conditions and time of year). Take down requires approximately 30 minutes.
5.4 Flexible Panel-3.7V Battery Field Performance Test Setup requires approximately 30 Minutes. Testing takes an estimated 6-9 hours (Duration is dependent on weather conditions and time of year). Take down requires approximately 30 minutes. 6.0 TEST LOCATIONS Field Tests were conducted on the rooftop of Ingersoll Hall. Ingersol Hall is located on the campus of the Naval Post Graduate School in Monterey, CA.

7
7.0 TEST SETUP All field tests were set-up in the same manner to measure the performance levels of the solar power systems with and without the integrated PVPC. Set-up checks are presented below:
(1) Inventory test equipment. (2) Prepare Excel spreadsheet to record test results as illustrated in the figure below.
(3) Verify batteries are appropriately discharged. (4) Verify battery indicators on Multi-meters, Light Meter, and Thermometer show
sufficient charge for duration of test – have spare batteries on hand. (5) Label and arrange test equipment. Label the system without the PVPC as Flex A
or Glass A as appropriate. Label the system with the PVPC as Flex B or Glass B as appropriate.
(6) Connect all meters to the systems according to wiring diagram illustrated below.
(7) Turn on all meters and equipment and test circuitry.
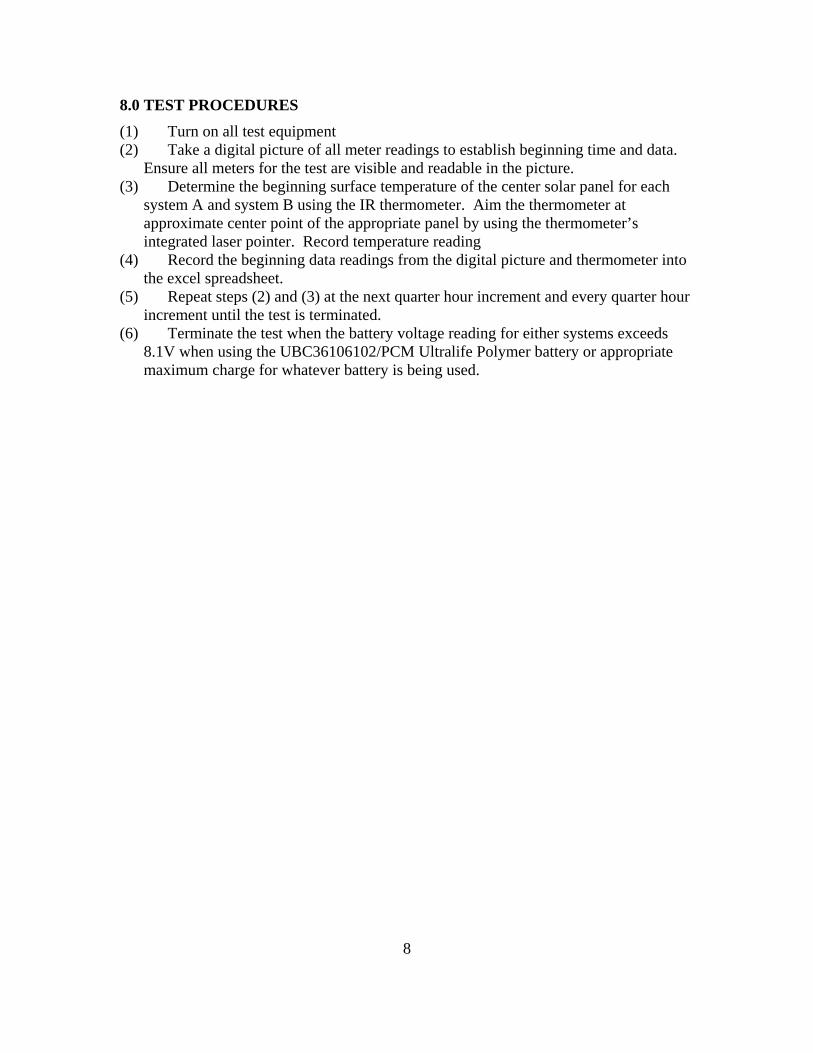
8
8.0 TEST PROCEDURES (1) Turn on all test equipment (2) Take a digital picture of all meter readings to establish beginning time and data.
Ensure all meters for the test are visible and readable in the picture. (3) Determine the beginning surface temperature of the center solar panel for each
system A and system B using the IR thermometer. Aim the thermometer at approximate center point of the appropriate panel by using the thermometer’s integrated laser pointer. Record temperature reading
(4) Record the beginning data readings from the digital picture and thermometer into the excel spreadsheet.
(5) Repeat steps (2) and (3) at the next quarter hour increment and every quarter hour increment until the test is terminated.
(6) Terminate the test when the battery voltage reading for either systems exceeds 8.1V when using the UBC36106102/PCM Ultralife Polymer battery or appropriate maximum charge for whatever battery is being used.

9
9.0 TEST DATA The key data elements of our tests are the performance results of the solar power systems in the field tests. Performance of the systems, in all tests, is measured in Volts direct current (Volts, V, or VDC) and milliamperes (milliamps or mA). Data was recorded photographically, to capture the exact readings of all meters at the same point in time. The photographic data elements of Volts and mA were then transferred to an MS Excel spreadsheet for presentation and analysis, in which Watts were calculated. Surface temperature readings were taken sequentially with no more than a five second time interval between the system A panel and the system B panel. Temperatures were recorded manually in degrees Fahrenheit and then transferred to the MS Excel spreadsheet for presentation and analysis. 9.1 Glass Panel-7.4V Battery Field Performance Test (1) The data for Glass Test 1 is presented below. The first table depicts the recorded test
data while the second table presents the hourly weather conditions recorded for the local area (Weather conditions were recorded from www.weatherchannel.com for Monterey CA.)

10

11
(2) The data for Glass Test 2 is presented below. The first table depicts the recorded test data while the second table presents the hourly weather conditions recorded for the local area (Weather conditions were recorded from www.weatherchannel.com for Monterey CA.
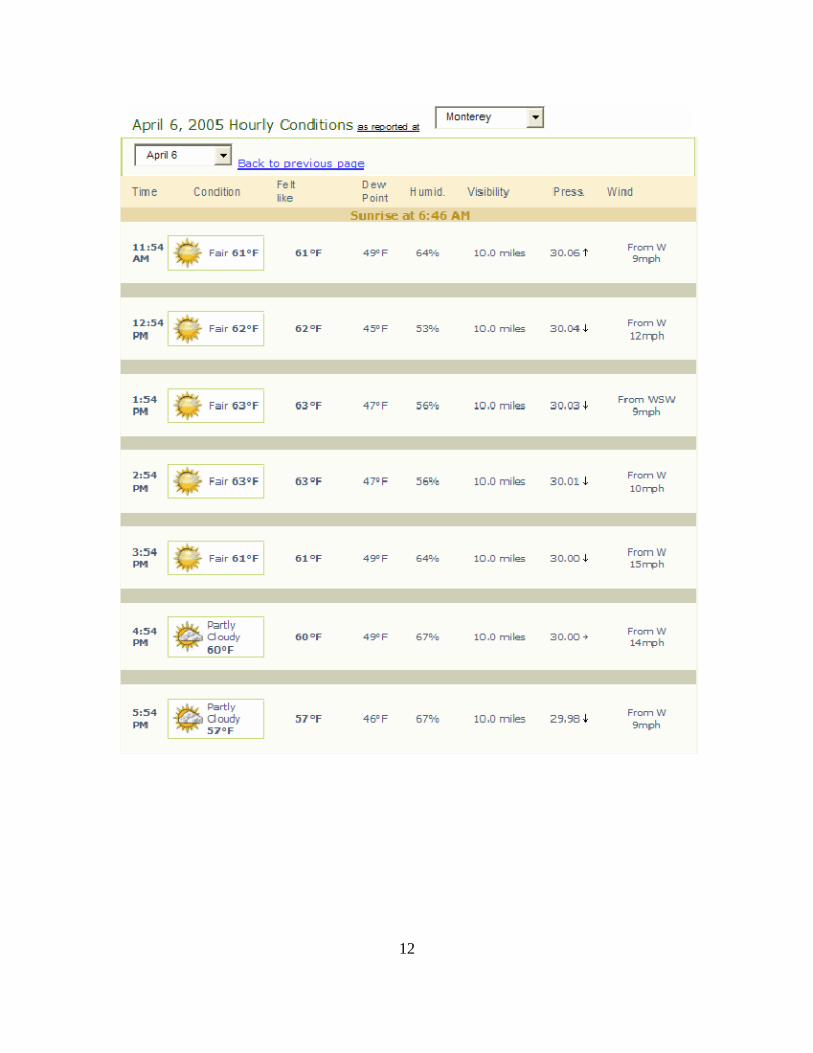
12
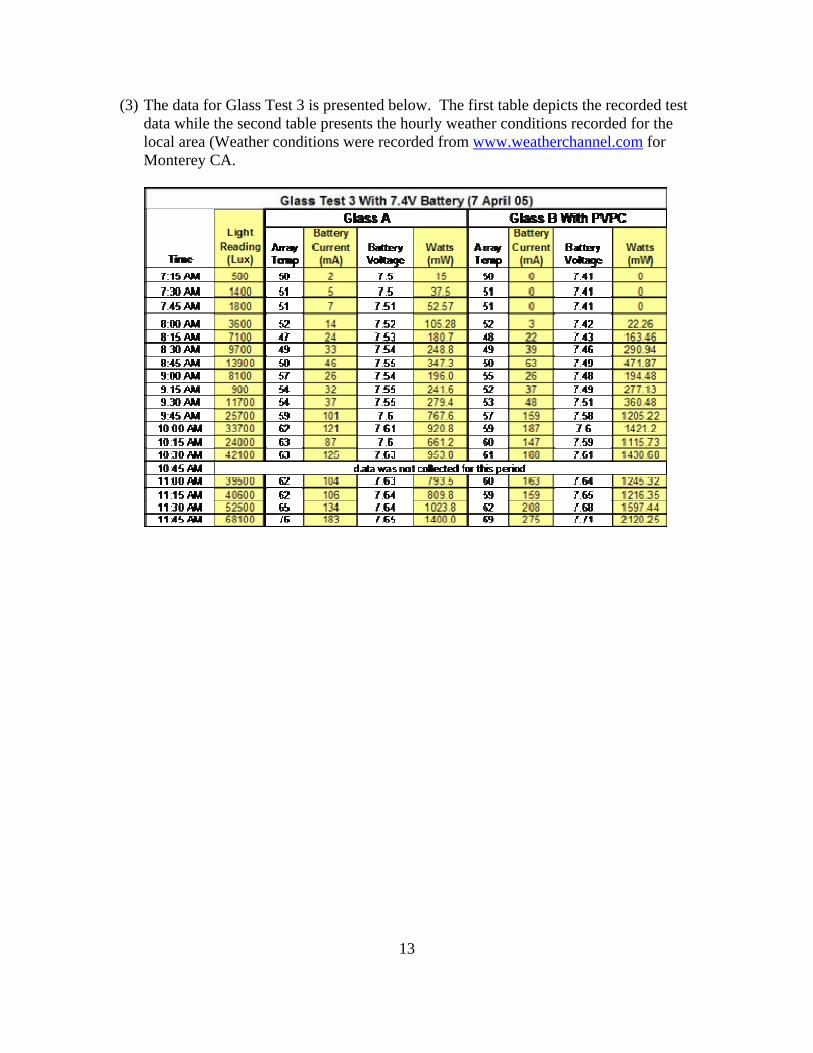
13
(3) The data for Glass Test 3 is presented below. The first table depicts the recorded test data while the second table presents the hourly weather conditions recorded for the local area (Weather conditions were recorded from www.weatherchannel.com for Monterey CA.

14

15
9.2 Glass Panel –3.7V Battery Field Performance Test A single iteration of this test was conducted. The data for this test is presented below. The first table depicts the recorded test data while the second table presents the hourly weather conditions recorded for the local area (Weather conditions were recorded from www.weatherchannel.com for Monterey CA.

16

17
9.3 Flexible Panel-7.4V Battery Field Performance Test: A single iteration of this test was conducted. The data for this test is presented below. The first table depicts the recorded test data while the second table presents the hourly weather conditions recorded for the local area (Weather conditions were recorded from www.weatherchannel.com for Monterey CA.
9.4 Flexible Panel -3.7V Battery Field Performance Test

18
A single iteration of this test was conducted. The data for this test is presented below. The first table depicts the recorded test data while the second table presents the hourly weather conditions recorded for the local area (Weather conditions were recorded from www.weatherchannel.com for Monterey CA.

19

120
THIS PAGE INTENTIONALLY LEFT BLANK

121
APPENDIX B - SAMPLE COMMERCIAL ITEM CHECKLIST89
Commercial Item Checklist (Part 1: Items)
Item: PVPC Part 1: Acquisition of Items Can the Government’s requirements (which should be performance based) be satisfied by— 1. An item that is of a type customarily used by the general public or by nongovernmental entities for purposes other than government purposes and that has been sold, leased, or licensed to the general public or that has been offered for sale, lease, or license to the general public? A. If Yes, designate the item as commercial and annotate evidence of actual sale, lease, or license to the general public (or offer for the same), as appropriate:
As noted in Chapter III and discussed in Chapter IV. _______________________________________________________ B. If No, proceed. 2. An item that has evolved from an item described in 1 above through advances in technology or performance and that is not yet available in the commercial marketplace but will be available in time to satisfy the Government’s delivery requirements? A. If Yes, designate the item as commercial and annotate evidence that the item will be available in time to satisfy the Government’s requirements. _____________________________________________________ _____________________________________________________ B. If No, proceed. 3. An item that would meet 1 or 2 above but requires modifications of a type customarily available in the commercial marketplace or minor modifications of a type not customarily available in the commercial marketplace, made to meet Federal Government requirements?
89 Commercial Item Handbook, Office of the Secretary of Defense, Acquisition, Technology and
Logistics, November 2001, Appendix D.

122
A. If Yes, designate the item as commercial and annotate either evidence of the customary availability of modification in the commercial marketplace or the technical relationship between the modified item and the item that meets 1 or 2. (For the latter, attach drawings or comparison of the characteristics of the commercial item and the modified item, as appropriate). _____________________________________________________ _____________________________________________________ B. If No, proceed. 4. Any combination of items meeting 1, 2, or 3 above that are of a type customarily combined and sold in combination to the general public? A. If Yes, designate the combination as commercial and annotate evidence of the customary combination being sold to the general public. _____________________________________________________ _____________________________________________________ B. If No, proceed. 5. Any item or combination of items that would meet 1, 2, 3, or 4 above but for being transferred between or among separate divisions, subsidiaries, or affiliates of a contractor? A. If Yes, designate the item as commercial and annotate how the item would meet 1, 2, 3, or 4. ____________________________________________________ _____________________________________________________ B. If No, proceed. 6. A nondevelopmental item that the procuring agency determines was developed exclusively at private expense and sold in substantial quantities, on a competitive basis, to multiple state and local governments? A. If Yes, designate the nondevelopmental item as commercial and annotate evidence that it was 1) developed exclusively at private expense, and 2) sold competitively in substantial quantities to multiple state and local governments. _____________________________________________________ _____________________________________________________ B. If No, recommend that the agency’s requirements be revised to permit commercial solutions. If they cannot, recommend that noncommercial acquisition be considered (include Numbered Note 26 in the synopsis).

123
APPENDIX C – ACRONYMS AND ABBREVIATIONS
ACAT Acquisition Category
AIS Automated Information System
AO Action Officer
AoA Analysis of Alternatives
APB Acquisition Program Baseline
ASD(C3I) Assistant Secretary of Defense for Command, Control,
ASD(NII) Assistant Secretary of Defense for Networks and Information
CAE Component Acquisition Executive
CDD Capability Development Document
CJCS Chairman of the Joint Chiefs of Staff
CJCSM Chairman of the Joint Chiefs of Staff Manual
CPD Capability Production Document
DAB Defense Acquisition Board
DAS Defense Acquisition System
DLA Defense Logistics Agency
DoD Department of Defense
DoDD Department of Defense Directive
DoDI Department of Defense Instruction
DRR Design Readiness Review
DUSD(S&T) Deputy Under Secretary of Defense for Science and Technology
FRP full-rate production
GAO Government Accounting Office
GSBPP Graduate School of Business and Public Policy
ICD Initial Capabilities Document
IOC initial operational capability
IOT&E Initial Operational Test and Evaluation
IT OIPT Information Technology Overarching Integrated Product Team
ITAB Information Technology Acquisition Board
JROC Joint Requirements Oversight Council
KPP key performance parameter
124
LRIP low rate initial production
MAIS Major Automated Information System
MDA Milestone Decision Authority
MDAP Major Defense Acquisition Program
MRL Manufacturing Readiness Level
NASA National Aeronautics and Space Administration
NDAA National Defense Authorization Act
NPS Naval Post Graduate School
OIPT Overarching Integrated Product Team
OSD Office of the Secretary of Defense
PA&E Program Analysis and Evaluation
PEO Program Executive Officer
PM Program Manager
PVPC Photovoltaic Power Converter
RDT&E Research, Development, Test, and Evaluation
S&T Science and Technology
SDD System Development and Demonstration, a phase in the DAS
SPO System Program Office
T&E Test and Evaluation
TD Technology Development
TDS Technology Development Strategy
TRA Technology Readiness Assessment
TRL Technology Readiness Level
USD(AT&L) Under Secretary of Defense for Acquisition, Technology, and

125
LIST OF REFERENCES
A Short History of The Naval Postgraduate School, http://www.nps.edu/aboutnps/navigation/heritage.html, [October 2004]
American Heritage Dictionary of the English Language, Fourth Edition, Houghton Mifflin Company, 2002
Besser, David A., Photovoltaic Power Conversion Technology: Reserved Backup Power, (Unpublished Document, Atira Technologies, Los Gatos, CA: May 12, 2004)
Chairman of the Joint Chiefs of Staff Manual (CJCSM) 3170.01, Operation of the Joint Capabilities Integration and Development System, dated 24 June 2003, Enclosure F paragraphs 1. and 2, ( http://www.teao.saic.com/jfcom/ier/documents/m317001.pdf ).
Department of Defense Directive (DoDD) 5000.1, The Defense Acquisitions System, May 12, 2003
Department of Defense Instruction (DoDI 5000.2), Operation of the Defense Acquisition System, May 12, 2003
Department of Defense, Technology Readiness Assessment (TRA) Deskbook, September 2003
Dept of Energy, Solar Energy Profile, http://www.eia.doe.gov/cneaf/solar.renewables/page/solarthermal/solarprofile.pdf, [October 2004]
Future Combat Systems, 18 + 1 +1 Overview, Whitepaper, (Program Manager Unit of Action, 2005)
Gansler, J.S., Memorandum as Forward to, Office of the Secretary of Defense Report on Commercial Item Acquisition: Considerations and Lessons Learned, (Washington D.C.: 2000).
General Accounting Office, GAO/NSIAD-96-106, Acquisition Reform: Efforts to Reduce the Cost to Manage and Oversee DOD Contracts, (Washington, D.C.: 1996),
General Accounting Office, GAO/NSIAD-97-48, Acquisition Reform: DoD Faces Challenges in Reducing Oversight Costs, (Washington, D.C.: 1997)
Hamilton, Jason A., Sablan, Steve A., Whiteker, James S, Logistical Impact Study of Photovaoltaic Power Converter Technology to the United States Army and United States Marine Corps, MBA Professional Report, Naval Postgraduate School, Monterey, CA: 2004

126
http://ces.iisc.ernet.in/hpg/envis/olydoc712.html, [October 2004]
http://encyclobeamia.solarbotics.net/articles/photovoltaic.html, [October 2004]
http://inventors.about.com/library/inventors/blsolar2.htm, [October 2004]
http://peocscss.tacom.army.mil/pmCSS.html, [May 2005]
http://www.acq.osd.mil/actd/intro.htm#Introduction, [April 2005]
http://www.californiasolarcenter.org/photovoltaics.html, [October 2004]
http://www.mcs.drexel.edu/~crorres/Archimedes/Mirrors/Tzetzes.html, [October 2004]
http://www.uccs.edu/~energy/courses/160lectures/solhist.htm, [October 2004]
http://www.walter-fendt.de/ph11e/photoeffect.htm, [October 2004]
https://lrcteams.monmouth.army.mil/QuickPlace/ipm/PageLibrary85256A2B0062C0F7.nsf/h_Toc/F8DED136FF17831985256B3E006CF4E0/?OpenDocument, May 2005.
Locher, Steve, Atira Technologies and Raven Designs Solar Array Results and Conclusions From Kodiak, Alaska, (Unpublished Information Paper, Raven Designs, November 11, 2004)
Locher, Steve, Raven Designs, (Unpublished Product Brochure, Raven Designs)
Mankins, John C., Technology Readiness Levels, White Paper, NASA, April 6, 1995
Matan, Stefan, Mr. Matan’s Personal Account, (Unpublished Document, Atira Technologies, Los Gatos, CA: 2004)
Navy Cooperative Research Agreement, NPS and ATIRA, Low-Light Solar Charger, Draft
Norman, http://www.eco.utexas.edu/homepages/faculty/Norman/long.extra/Student.F99/solar/car.html, [October 2004]
NPS At a Glance, http://www.nps.edu/aboutnps/navigation/descNPS.html, [October 2004]
Office of the Secretary of Defense, Acquisition, Technology, and Logistics, Commercial Item Handbook, , November 2001,
Perlin and Butti, http://www.californiasolarcenter.org/history_pv.html, [October 2004]
127
Perlin and Butti, http://www.californiasolarcenter.org/history_solarthermal.html, [October 2004]
Perlin and Butti, www.californiasolarcenter.org/history_passive.html, [October 2004]
Programs, 18 October 2004, <http://www.nps.navy.mil/gsbpp/programs.htm>, [October 2004]
Smith, http://www.solarenergy.com/info_history.html, [October 2004]
Wikipedia, http://en.wikipedia.org/wiki/Technology_Readiness_Level, [October 2004]
Wolf, Alexander,Photovoltaic Power Conversion Technology Enhancements: Design a circuit that will track max pwr pt, (Unpublished Document, Atira Technologies, Los Gatos, CA: 2004)
www.californiasolarcenter.org/history_passive.html, [October 2004]
www.encarta.msn.com/encylopedia_761562112/Sun.html, [October 2004]
www.m-w.com, [October 2004]
www.solarserver.de/lexikon/sonnenenergie-e.html, [October 2004]
www.usgs.gov/tech-transfer/what-crada.html

128
THIS PAGE INTENTIONALLY LEFT BLANK

129
INITIAL DISTRIBUTION LIST
1. Defense Technical Information Center Ft. Belvoir, Virginia
2. Dudley Knox Library Naval Postgraduate School Monterey, California