Embed Size (px)
Citation preview

2016-2017 NATURAL GAS
FUEL FLEET VEHICLEREBATE ANNUAL
ASSESSMENT

FY 2016-2017 Natural Gas Fuel Fleet Vehicle Rebate Program Assessment i
Dear Governor Scott, President Negron and Speaker Corcoran:
I appreciate your support of the Natural Gas Fuel Fleet Vehicle Rebate Program. This program was designed to help reduce transportation costs in the state and encourage freight mobility investments that contribute to Florida’s economic growth. Pursuant to Section 377.810(7), Florida Statutes, I hereby transmit the Natural Gas Fuel Fleet Vehicle Rebate Program Assessment for FY 2016-2017. I hope you find this assessment informative.
Through this program, we offer incentives to public and private sector entities for the purchase, lease or conversion of fleet vehicles from diesel- or gasoline- to natural gas-powered vehicles. Beyond the rebates provided to qualified participants, the long-term benefits of the program include reduced fuel costs and lower vehicle emissions. The Natural Gas Fuel Fleet Vehicle Rebate Program became effective through statute on July 1, 2013. The program accepts applications from July 1 to June 30, concurrent with the state fiscal year. Year four of the program began on July 1, 2016, and closed on June 30, 2017. During year four, we approved 560 applications for a total of $6 million. Highlights of the program include:
A total of 765 jobs with an average pay of $56,816 were created or retained as a result of the program.
560 vehicles we purchased, leased or converted. Use of these vehicles will save rebate recipients an estimated $8.1 million in annual fuel
costs. The program incentivized investment from private and public sector entities in the
amount of $144.8 million. Total contribution to Florida’s Gross Domestic Product (GDP) is estimated at $240.6
million.
I look forward to continuing to work with you to stimulate economic growth and create jobs for Floridians. Sincerely,
Adam H. Putnam Commissioner of Agriculture

FY 2016-2017 Natural Gas Fuel Fleet Vehicle Rebate Program Assessment ii Page
Table of Contents Sections ____ _____ Page No.
1. Introduction ……………………………………………….…………………. 1
2. Data Source …………………………………………………………………... 1
3. Expenses and Savings Supported by the Program ………………………… 2
4. Contribution to Florida’s Economy ………………………………………… 5
5. Return on Investment ……………………………………………………….. 8
6. Conclusion ……………………………………………….…………………… 9

FY 2016-2017 Natural Gas Fuel Fleet Vehicle Rebate Program Assessment 1 Page
Section 1. Introduction
The Natural Gas Fuel Fleet Vehicle Rebate was established by the Florida Legislature in 2013 through House Bill 579 as a program administered by the Florida Department of Agriculture and Consumer Services (department). The legislation provides $6 million per fiscal year in recurring funds from FY 2013-14 through FY 2017-18, to provide rebates for the purchase, conversion, or lease of natural gas fuel fleet vehicles. Fiscal Year 2016-2017 was the last year of the program.
The program goals, as laid out in the legislation, were to help reduce transportation costs and encourage freight mobility investments that contribute to the economic growth of the state. The program provided rebates of up to $25,000 per vehicle and $250,000 per applicant per fiscal year for up to 50 percent of the costs associated with the conversion, purchase or lease of natural gas fleet vehicles registered in the state of Florida.
Applications were reviewed and deemed complete or incomplete for reasons such as insufficient application information or a lack of supporting documentation. Summary of total received, approved and incomplete applications are shown below under Table 1.
Table 1. Program Summary Fiscal Years 2013-2014 through 2016-2017
Applications Received Approved Incomplete Fiscal Year 2013-2014 572 272 300
Fiscal Year 2014- 2015 899 518 381
Fiscal Year 2015-2016 935 598 337
Fiscal Year 2016- 2017 1203 560 643
Total 3609 1948 1661
The program was expected to foster public and private sector spending in the automotive and natural gas distribution sectors, reduce fuel costs for private and public sector entities, and increase the financial feasibility of investments in new or retrofitted vehicles. As required by Section 377.810(7), Florida Statue, this report is to document the expenditures fostered by the program, estimate the economic contributions of the program to the state’s economy and determine the program’s return on investment.
Section 2. Data Source
Rule 5O-4.001, Florida Administrative Code, requires applicants to complete a Natural Gas Fuel Fleet Vehicle Rebate Application, FDACS-01976, Rev 10/13, for each vehicle purchase, lease or conversion. In addition to determining the eligibility of the applicant and associated investment, the application is designed to collect information, including whether the investment is a conversion, purchase or lease, the total eligible incremental costs (i.e. the excess cost associated with retrofitting a diesel or gasoline vehicle into a natural gas fuel powered vehicle), the rebate

FY 2016-2017 Natural Gas Fuel Fleet Vehicle Rebate Program Assessment 2 Page
amount requested and the total value of the investment (i.e. infrastructure, maintenance, and eligible incremental costs) in alternative fuels and the projected fuel savings. In addition, the application also requests the type of natural gas technology the vehicle will utilize, the type of entity that is applying for the rebate, and the county in which the vehicle is licensed and fueled. The information was entered into an electronic database, and the data was aggregated to the applicant level for this analysis. A summary statistics for the information are compared between all years of the program in Table 2.
Section 3. Expenses and Savings Supported by the Program
Aggregation of the data to the applicant level gives a clear picture of the type of entities that received rebates, the types of investments and the fuel savings supported by the program. For example, 45.8 percent of applicants to the program in FY 2016-2017 were public sector entities, while 54.2 percent were private sector entities, representing a decrease in the proportion of private sector applicants relative to previous fiscal years. Similarly, Compressed Natural Gas (CNG) seems to be preferred over other types of natural gas technology available in the marketplace, as 55.9 percent of applicants reported investments in CNG, 28.8 percent invested in propane gas and 3.4 percent invested in Liquefied Natural Gas (LNG). In addition, 6.8 percent of applicants reported investments in bi-fuel CNG, while 5.1 percent reported investments in bi-fuel propane.
The program supports three types of investments, including purchase of new vehicles, lease of new vehicles and conversion or retrofit of existing vehicles: 68 percent of applicants used the rebates to support new vehicle purchases, 22 percent invested in the conversion or retrofit of an existing vehicle and 10.2 percent of applicants leased new vehicles.
Table 2. Percent Applicant Breakdown by Type of Entity and Natural Gas Technology Adopted
Description 2013-14 2014-15 2015-16 2016-17
Applicant is a governmental entity 44.7% 43.5% 38.1% 45.8%
Applicant is a commercial entity 55.3% 56.5% 61.9% 54.2%
Investment is in CNG technology 65.8% 58.1% 51.2% 55.9%
Investment is in bi-fuel CNG technology 16.0% 17.7% 4.8% 6.8%
Investment is in LNG technology 5.3% 4.8% 2.4% 3.4%
Investment is in propane technology 10.5% 16.1% 31.0% 28.8%
Investment is in bi-fuel propane technology
2.6% 3.2% 10.7% 5.1%
Vehicles purchased 76.0% 54.8% 63.1% 67.8%
Vehicles leased 7.9% 9.7% 4.8% 10.2%
Vehicles converted to NG fuel 16.0% 35.5% 32.1% 22.0%

FY 2016-2017 Natural Gas Fuel Fleet Vehicle Rebate Program Assessment 3 Page
In terms of the value of investments supported by the program, the average rebate recipient made a total eligible investment of $222,415 in approximately 10 vehicles and received $101,694 in rebates. For the average recipient, the rebate program covered 46 percent of the total incremental cost of the investment. In addition, the average recipient will conserve 137,869 gallons of gasoline or diesel every year, for a total estimated annual fuel savings of $137,675. On average, recipients invested a total of $2,455,321 in alternative fuels, including the new or converted vehicles as well as any additional support infrastructure.
On a per vehicle basis, the average incremental cost eligible for a rebate was $26,788, and the average vehicle received a rebate of $12,322. Besides the eligible incremental cost, the average rebate fostered an investment of $215,010 in either the vehicle itself or in infrastructure needed to support the vehicle. The average vehicle will save 17,042 gallons of conventional fuel each year, for an average annual fuel savings of $12,643. The average fuel savings is calculated using current traditional fuel prices.
As seen in the last column of Table 3, the 560 Natural Gas Fuel Fleet Vehicle rebates approved in FY 2016-2017 accounted for a total of $13,122,468 in eligible incremental costs, of which $6,000,000 was reimbursed to applicants. The total direct investment supported by the program was $144,863,937. Approximately 8,134,299 gallons of gasoline or diesel fuel will be saved every year, resulting in estimated fuel cost savings of $8,122,858 per year.
In FY 2016-2017, private sector entities received the maximum total amount of $3,600,000 in rebates, while public sector entities received the maximum of $2,400,000. The public sector’s total reported investment in alternative energy ($69,296,337) is significantly lower than the reported investment by the private sector ($75,567,600). The number of vehicles purchased, leased or retrofitted in the private sector was 289 vehicles, compared to 271 vehicles in the public sector.
Table 3. Program Benefits Accruing to Public and Private Sector Entities
Government Private Total
Incremental Costs 5,396,985 7,725,483 13,122,468
Rebates Awarded 2,400,000 3,600,000 6,000,000
Total Investment 69,296,337 75,567,600 144,863,937
Fuel Savings (Gallons) 2,118,835 6,015,464 8,134,299
Fuel Savings ($) 4,382,456 3,740,402 8,122,858
Vehicles 271 289 560
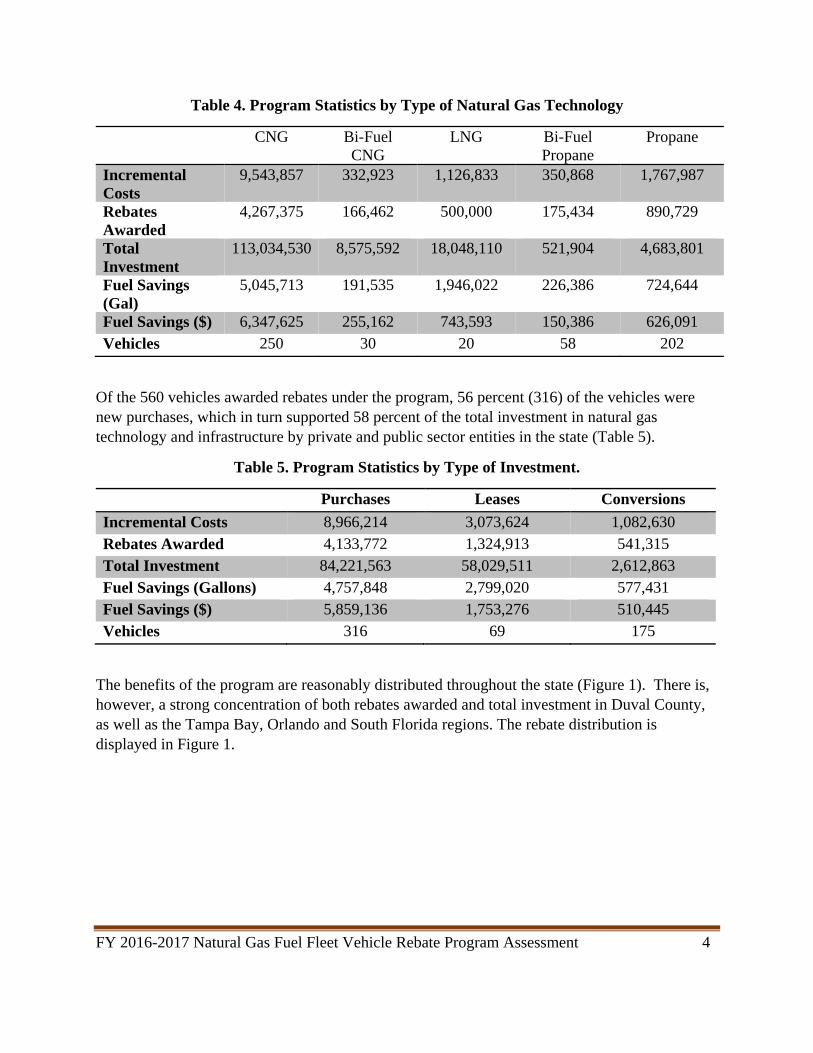
Table 4 provides the displays statistics for the natural gas technologies utilized by public and private entities. Compressed Natural Gas was the most utilized technology in FY 2016-2017 in terms of total investment ($113,034,530) and vehicles purchased, leased or retrofitted (250).
FY 2016-2017 Natural Gas Fuel Fleet Vehicle Rebate Program Assessment 4 Page
Table 4. Program Statistics by Type of Natural Gas Technology
CNG Bi-Fuel CNG
LNG Bi-Fuel Propane
Propane
Incremental Costs
9,543,857 332,923 1,126,833 350,868 1,767,987
Rebates Awarded
4,267,375 166,462 500,000 175,434 890,729
Total Investment
113,034,530 8,575,592 18,048,110 521,904 4,683,801
Fuel Savings (Gal)
5,045,713 191,535 1,946,022 226,386 724,644
Fuel Savings ($) 6,347,625 255,162 743,593 150,386 626,091 Vehicles 250 30 20 58 202
Of the 560 vehicles awarded rebates under the program, 56 percent (316) of the vehicles were new purchases, which in turn supported 58 percent of the total investment in natural gas technology and infrastructure by private and public sector entities in the state (Table 5).
Table 5. Program Statistics by Type of Investment.
Purchases Leases Conversions
Incremental Costs 8,966,214 3,073,624 1,082,630 Rebates Awarded 4,133,772 1,324,913 541,315 Total Investment 84,221,563 58,029,511 2,612,863 Fuel Savings (Gallons) 4,757,848 2,799,020 577,431 Fuel Savings ($) 5,859,136 1,753,276 510,445 Vehicles 316 69 175
The benefits of the program are reasonably distributed throughout the state (Figure 1). There is, however, a strong concentration of both rebates awarded and total investment in Duval County, as well as the Tampa Bay, Orlando and South Florida regions. The rebate distribution is displayed in Figure 1.

FY 2016-2017 Natural Gas Fuel Fleet Vehicle Rebate Program Assessment 5 Page
Figure 1. Geographic Distribution of Rebates and Total Investment
Section 4. Contribution to Florida’s Economy
The data collected through the application process and summarized in Section 3 can be used to create a regional economic model that tracks the flow of expenditures and savings that resulted from the program through Florida’s economy. The model was created using the Impact Analysis for Planning (IMPLAN) software v3.1 with statewide Florida data for 2014. IMPLAN is an input/output tool that characterizes spending patterns and relationships between households and industries, and is one of the most widely used and well known platforms for modeling economic impacts and contributions.
Several indicators are used in regional economic models to characterize the impact or contribution of an activity or a set of activities on the economy: “employment” refers to full and part-time employment for one year, “labor income” is an employee’s total payroll cost as paid by the employer, including wages and salary, all benefits and payroll taxes, as well as income earned by proprietors and self-employed professionals; “total value added” includes all profits, indirect business taxes and payments to households (such as investment income); and “output” is the total value of industry production.
Regional economic models generally report three types of impacts or effects: “direct effects” refer to total spending in the program or activity of interest; “indirect effects” result from changes in the demand of factor inputs caused by the program or activity under study; and “induced effects” result from households and workers spending the money earned as a result of the program or activity of interest.

FY 2016-2017 Natural Gas Fuel Fleet Vehicle Rebate Program Assessment 6 Page
Table 6. Total Investment Expenditures Driving the Regional Economic Model
Sector Description Amount Automotive repair and maintenance, except car washes (504)
Conversions are performed by trained auto and truck maintenance specialists. Expenses in this category include the incremental costs of conversions.
$2,612,863
Light truck and utility vehicle manufacturing (344)
One third of the total investment from new vehicle purchases and leases is assumed to be expenses in this sector.
$47,417,025
Heavy duty truck manufacturing (345)
One third of the total investment from new vehicle purchases and leases is assumed to be expenses in this sector.
$47,417,025
Natural gas distribution (50) One third of the total investment from new vehicle purchases and leases is assumed to be expenses in this sector. In addition, this sector includes the excess investment from conversions not included as automotive repairs.
$47,417,025
TOTAL $144,863,937
To determine the economic contribution of the program, the total investment reported by program applicants was used as the change in final demand as a consequence of the program. This change in final demand is assumed to take place in four sectors (Table 6). Similarly, the fuel savings reported by program applicants are also modeled as drivers of final demand in the sectors that benefit from these savings (Table 7). That is, savings by a particular sector are assumed to be used to generate an equivalent value in services by the same sector.

FY 2016-2017 Natural Gas Fuel Fleet Vehicle Rebate Program Assessment 7 Page
Table 7. Total Fuel Savings Driving the Regional Economic Model
Sector Description Amount Waste Management and Remediation Services (471)
20% of fuel savings are assumed to benefit waste management companies.
$1,624,571
Truck transportation (411) 30% of fuel savings are assumed to benefit freight transport companies
$2,436,857
Local government passenger transit (524)
30% of fuel savings are assumed to benefit local government entities engaged in public or school related ground transportation
$2,436,857
Other local government enterprises (526)
20% of fuel savings are assumed to benefit local governments whose employees will be using more efficient fleets for local government business related transportation.
$1,624,571
TOTAL $8,122,858
Regional economic model results are summarized in Table 8. The program fostered an estimated $152.9 million in direct expenditures, which included $144.8 million of total investment in alternative energy related to the program and $8.1 million in fuel savings statewide. An estimated 765 jobs were created or retained as a result of the program, and the total economic contribution of the program to Florida’s economy in FY 2016-2017 was estimated at $240.6 million. The program also resulted in an estimated contribution to state and local taxes of $10,713,825.
Table 8. Direct, indirect and induced effects from the program in FY 2016-2017.
Impact Type Employment Labor Income Value Added Output
Direct Effect 233.1 $17,070,189 $32,209,148 $152,986,793
Indirect Effect 301.8 $16,214,029 $24,957,989 $55,384,801
Induced Effect 230.2 $10,183,516 $18,241,019 $32,239,212
Total Effect 765.1 $43,467,735 $75,408,155 $240,610,806
Table 9 shows the 10 sectors that saw the largest gains or retention in employment as a result of the program. Local government passenger transit created or retained 41 jobs; wholesale trade created of retained 54 jobs; the natural gas industry, including distribution and extraction, created or retained 104 jobs; and the manufacturing of heavy duty trucks, including the transportation and automotive repair sectors, created over 105 jobs.

FY 2016-2017 Natural Gas Fuel Fleet Vehicle Rebate Program Assessment 8 Page
Table 9. Top ten job producing sectors as a result of the program in FY 2016-2017.
Description Employment Labor Income Value Added Output Natural gas distribution 62.9 $6,088,425 $16,325,238 $47,505,239
Wholesale trade 54.3 $4,533,357 $8,860,643 $13,313,246Heavy duty truck manufacturing
48.1 $3,300,191 $5,612,614 $47,430,383
Local government passenger transit
41.7 $3,179,146 $2,388,519 $2,459,237
Extraction of natural gas and crude petroleum
41.3 $675,142 $212,550 $7,957,307
Automotive repair and maintenance, except car washes
31.6 $1,531,026 $2,184,553 $3,078,385
Real estate 27.3 $427,477 $2,899,995 $4,490,433 Truck transportation 27 $1,214,012 $1,509,967 $4,053,974
Light truck and utility vehicle manufacturing
24.8 $1,603,300 $4,000,221 $47,418,222
Management of companies and enterprises
17.1 $1,810,643 $2,263,344 $3,936,521
Section 5. Return on Investment
The program statistics summarized in Section 3 coupled with the economic contributions documented in Section 4 can be used to calculate the returns on the state of Florida’s investment in the program in FY 2016-2017. Every $1 million that the state invested in rebates for natural gas vehicle purchases, leases and conversions, fostered an incremental investment of $2.174 million, and a total investment (including infrastructure and maintenance) in alternative fuels of over $24.1 million. Similarly, every $1 million invested in rebates promoted the creation or retention of 127 jobs paying a total of $7.2 million in labor income, or an average income of $56,816. In addition, every $1 million invested in the program spurred total contributions to Florida’s gross domestic product (GDP) of $40.1 million. Finally, every $1 million invested in the program produced an estimated $1.78 million in state and local taxes, for a 78.56 percent return on investment (ROI) as defined in FS 288.005.

FY 2016-2017 Natural Gas Fuel Fleet Vehicle Rebate Program Assessment 9 Page
Table 10. Return on Investment, per $1 million Awarded in Rebates
Type of ROI FY2014-2015 FY2015-2016 FY2016-2017
Incremental Investment $2,142,487.76 $2,100,995.51 $2,187,078.00
Total Investment $13,837,440.75 $13,524,321.79 $24,143,989.50
Fuel Savings $2,925,939.89 $2,834,923.70 $1,353,809.67
Employment 119.96 107.54 127.52
Labor Income $6,097,045.33 $6,026,983.41 $7,244,622.50
Total Output $28,179,478.82 $26,931,510.98 $40,101,801.00
State and Local Taxes - $1,120,665.44 $1,785,637.50
FS 288.005 ROI - 12.07% 78.56%
Section 6. Conclusion
During FY 2016-2017 of the program, a total of $6 million was disbursed as rebates in all regions of the state for the purchase, lease or conversion of 560 vehicles, fostering a total investment of $144.8 million. This investment, coupled with $8.1 million in annual fuel savings, resulted in the creation or retention of 765 jobs paying an average yearly wage of $56,816. The total contribution to Florida’s GDP as a result of this program’s fiscal year 2016- 2017 is estimated at $240.6 million.


![Uranium Resource Availability Fuel Cycle Cost Resource Availability Fuel Cycle Cost Course 22.39, ... Western World Production against Reactor ... FCC FLEET = FCC UOX [% Fleet UOX]](https://img.dokumen.tips/doc/110x75/5b3fae907f8b9a51528c5547/uranium-resource-availability-fuel-cycle-cost-resource-availability-fuel-cycle-cost.jpg)