Embed Size (px)
Citation preview

National trends in passenger transport regarding the choice of transport mode

National trends in passenger transport regarding the choice of transport modeEXCELDATEIPFAD.xl
s
Key Findings
National trends in passenger transport show a general increase of mobility and high growth rates in public transport, especially in recent years. Statistics / Data
National policy
Results of statistics and policy
Need for USEmobility
Management Summary
National statistics and policies give an aggregate overview of national trends in passenger transport regarding the choice of transport mode at a macroeconomic level.
An individual analysis of passengers behaviour questioning why people use public transport modes more intensely will help all actors to exploit to the full the potential of public transport in the future.
2
Political attempts to foster public transport exist in all research countries but do not dominate transport policies
Implication for USEmobility

National trends in passenger transport regarding the choice of transport mode 3
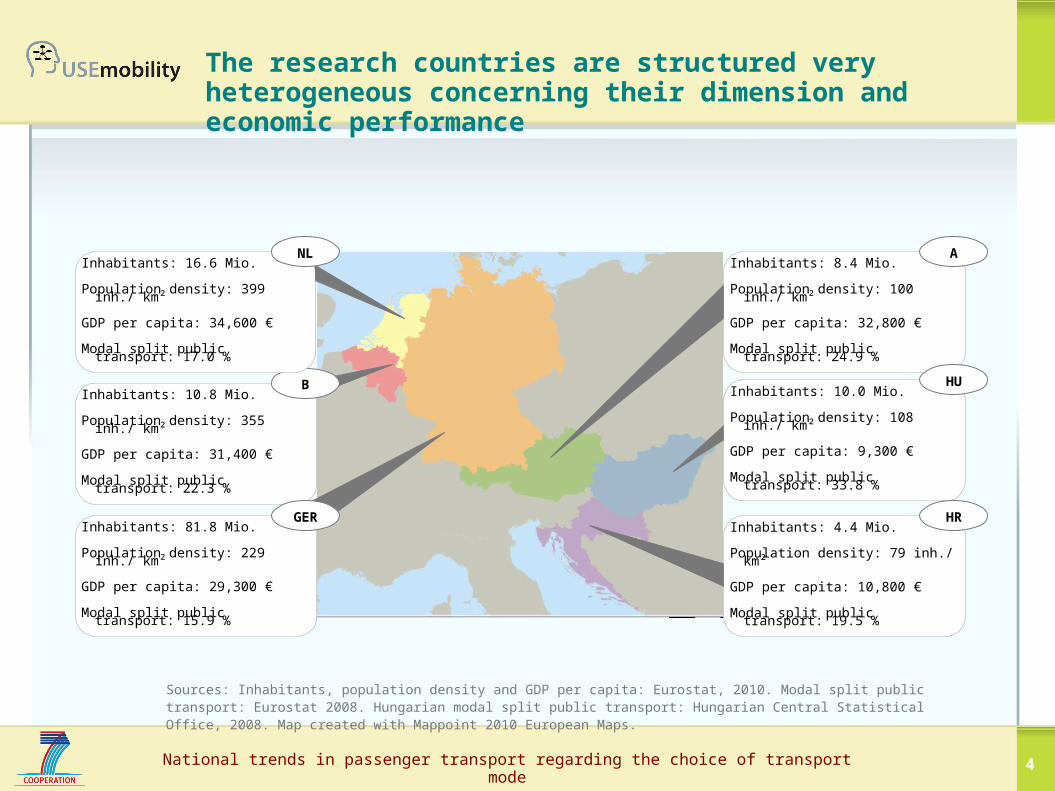
1. Overview and comparison of the countries
2. Quantitative analysis Macroeconomic analysis of transport markets
Research period of ten years (2000 – 2010)
Based on statistics (e.g. transport volume, number of vehicles, economic and demographic development, development of fuel prices and ticket prices in public transport)
3. Qualitative analysis Examination of transport policy
Based on political programs of national/regional governments, relevant legislation, publications of governments, ministries, public transport authorities and providers, civil society organisations (e.g. consumer organisations, environmental organisations).
4. Results of the analyses
Content
National trends in passenger transport regarding the choice of transport mode 4
The research countries are structured very heterogeneous concerning their dimension and economic performance
Sources: Inhabitants, population density and GDP per capita: Eurostat, 2010. Modal split public transport: Eurostat 2008. Hungarian modal split public transport: Hungarian Central Statistical Office, 2008. Map created with Mappoint 2010 European Maps.
Inhabitants: 10.8 Mio.
Population density: 355 inh./ km²
GDP per capita: 31,400 €
Modal split public transport: 22.3 %
B
Inhabitants: 16.6 Mio.
Population density: 399 inh./ km²
GDP per capita: 34,600 €
Modal split public transport: 17.0 %
NL
Inhabitants: 81.8 Mio.
Population density: 229 inh./ km²
GDP per capita: 29,300 €
Modal split public transport: 15.9 %
GER
Inhabitants: 8.4 Mio.
Population density: 100 inh./ km²
GDP per capita: 32,800 €
Modal split public transport: 24.9 %
A
Inhabitants: 10.0 Mio.
Population density: 108 inh./ km²
GDP per capita: 9,300 €
Modal split public transport: 33.8 %
HU
Inhabitants: 4.4 Mio.
Population density: 79 inh./ km²
GDP per capita: 10,800 €
Modal split public transport: 19.5 %
HR
National trends in passenger transport regarding the choice of transport mode 5
1. Overview and comparison of the countries
2. Quantitative analysis Macroeconomic analysis of transport markets
Research period of ten years (2000 – 2010)
Based on statistics (e.g. transport volume, number of vehicles, economic and demographic development, development of fuel prices and ticket prices in public transport)
3. Qualitative analysis Examination of transport policy
Based on political programs of national/regional governments, relevant legislation, publications of governments, ministries, public transport authorities and providers, civil society organisations (e.g. consumer organisations, environmental organisations).
4. Results of the analyses
Content

National trends in passenger transport regarding the choice of transport mode 6
Trends identified in the research countries at a glance
Socio-economic and demographic trends
Stagnating population figures
Ageing of the population
General urbanization
High economic growth rates in Eastern Europe
Price increases in individual transport higher than in public transport
Transport and mobility trends
Public transport is gaining on individual transport throughout Europe
Eastern Europe is gaining on Western Europe concerning motorization
Eastern Europe makes up for motorway network expansion
Supply in passenger transport by railway increases (train-kilometres)
Stagnation or reduction of rail infrastructure

National trends in passenger transport regarding the choice of transport mode
-20
-15
-10
-5
0
5
10
15
20
%
20082005200019951990
20082005200019951990
20082005200019951990
20082005200019951990
-20
-15
-10
-5
0
5
10
15
20
%
-20
-15
-10
-5
0
5
10
15
20
%
-20
-15
-10
-5
0
5
10
15
20
%
-20
-15
-10
-5
0
5
10
15
20
%
-20
-15
-10
-5
0
5
10
15
20
%
PTIT PTIT
PTITPTITPTIT
NetherlandsBelgium Germany
Focus of USEmobility
Focus of USEmobility
Focus of USEmobility
Focus of USEmobility
Focus of USEmobility
Focus of USEmobility
Austria Hungary Croatia
19951990 200820052000
PTIT
2005 2008200019951990
Annual growth rates in public and individual transport 1990 – 2008. Source: European Commission – Statististical Pocketbook 2010. Hungarian Data: Hungarian Central Statistical Office.
Growth rates in public transport are mostly higher than in individual transport (especially in recent years)
7

National trends in passenger transport regarding the choice of transport mode
CHANGE OF INDICATORS IN % (2000 – 2008)
0.0153.8
-1.4114.3
0.03.9
3.414.0
-7.58.0
1.23.6
12.729.2
14.74.6
9.715.3
5.75.8
7.29.7
15.437.9Croatia 28.3
35.0
Hungary -10.116.9
Austria 13.09.9
Netherlands 9.94.2
Germany 1.52.5
Belgium 45.15.1
Public transport by rail (exception: Demand values present public transport performance in general)
Individual transport (only individual transport by car, without powered two-wheelers)
TRANSPORT PERFORMANCE
[in pkm]
INFRASTRUCTURE
[length in km]
MEANS OF TRANSPORT OFFER
[car stock and train kilometres¹]
DEMAND SUPPLY
¹) Data for train kilometres in the Netherlands from 2007.
In several countries the demand for public transport showed a greater increase than the demand for individual transport.
Increasing demand for mobility in almost all research countries
8

National trends in passenger transport regarding the choice of transport mode
0%
10%
20%
30%
40%
50%
60%
70%
80%
90%
100%
80.5
19.5
79.7
20.3
66.2
33.8
60.1
39.9
75.1
24.9
75.6
24.4
83.0
17.0
83.8
16.2
84.1
15.9
83.9
16.1
77.7
22.3
82.8
17.2
2000200820002008200020082000 20082000200820002008
public transport
individual transport
Increasing market shares in public transport in some countries
Comparison of Modal splits 2000 and 2008 [in % of total pkm]Source: European Commission – Statistical Pocketbook 2010. Hungarian Data: Hungarian Central Statistical Office.
There seems to be a change from declining market shares in public transport in the past towards increasing market shares at least in some countries.
Croatia
Hungary
AustriaNetherlandsBelgium Germany
9

National trends in passenger transport regarding the choice of transport mode 10
1. Overview and comparison of the countries
2. Quantitative analysis Macroeconomic analysis of transport markets
Research period of ten years (2000 – 2010)
Based on statistics (e.g. transport volume, number of vehicles, economic and demographic development, development of fuel prices and ticket prices in public transport)
3. Qualitative analysis Examination of transport policy
Based on political programs of national/regional governments, relevant legislation, publications of governments, ministries, public transport authorities and providers, civil society organisations (e.g. consumer organisations, environmental organisations).
4. Results of the analyses
Content

National trends in passenger transport regarding the choice of transport mode
Political objectives
Positive approaches
Transport sector is facing major challenges Need for political action to make mobility more sustainable is generally
seen Noticeable increase of attractiveness of public transport
Positive approaches towards increased multimodality but also obstacles and problems
Making public transport and multimodality more attractive for the users Increasing market share of public transport and multimodality (modal
shift)
Obstacles and problems
Fostering public transport is mostly not dominating transport policy Measures and implementations are often avoided or delayed due to
financial problems Still numerous measures fostering individual transport (road
construction, tax benefits for company cars, car-scrap bonus, etc.)
Rising awareness
NGO’s claim for more a consistent policy fostering public transport NGO’s contribute to a rising awareness of problems concerning public
transport and multimodality, both in politics and the population
11

National trends in passenger transport regarding the choice of transport mode 12
1. Overview and comparison of the countries
2. Quantitative analysis Macroeconomic analysis of transport markets
Research period of ten years (2000 – 2010)
Statistics (e.g. transport volume, number of vehicles, economic and demographic development, development of fuel prices and ticket prices in public transport)
3. Qualitative analysis Examination of transport policy
Political programs of national/regional governments, relevant legislation, publications of governments, ministries, public transport authorities and providers, civil society organisations (e.g. consumer organisations, environmental organisations).
4. Results of the analyses
Content

National trends in passenger transport regarding the choice of transport modeEXCELDATEIPFAD.xl
s
…viewable in individual as well as in public transport
Demand for public transport is growing faster than for individual transport, especially in the last five years
There seems to be a change concerning market shares of public transport
Increasing demand for mobility...
Challenging competitive situation...
Objectives to foster public transport exist...
Potential still not exploited to the full…
…of public transport towards individual transport Competition within the passenger market
And for political support
Conclusions
…in all research countries at all political levels But still do not dominate transport policies
Are often not consistently implemented and delayed
Focus on urban areas
...for increased use of public transport Report D2.2 will help to understand transport
behaviour in a general way
Analysis of changes in passenger’s individual behaviour is the focus of USEmobility.
13
Implication for
USEmobility