Embed Size (px)
Citation preview
Project no. 248992
Project acronym: NEUNEU
Project title: Artificial Wet Neuronal Networks from CompartmentalisedExcitable Chemical Media
Small or medium-scale focused research project (STREP)
Deliverable 2.4 - Report or publication on computation with oneand two droplets
Period covered: from 1.2.2010 to 29.2.2012 Date of preparation: 18.9.2009
Start date of project: 1.2.2010 Duration: 36 months
Project coordinator name: Dr. Peter DittrichProject coordinator organisation name: Friedrich Schiller University Jena
A simple model of interactions between
Belousov-Zhabotinsky droplets
Joanna Natalia Goreckaa, Jerzy Goreckib,c,
Jan Szymanskib and Konrad Gizynskib
a Institute of Physics, Polish Academy of Sciences,
Al. Lotnikow 36/42, 02-668 Warsaw, Poland
bInstitute of Physical Chemistry, Polish Academy of Sciences,
Kasprzaka 44/52, 01-224 Warsaw, Poland.
c Faculty of Mathematics and Natural Sciences,
Cardinal Stefan Wyszynski University
Dewajtis 5, Warsaw, Poland
February 16, 2012
Abstract
Lipid covered droplets containing solution of reagents of oscilla-
tory Belousov-Zhabotinsky reaction and surrounded by hydrocarbons
form an interesting system for studying information processing oper-
ations that can be directly executed by a chemical medium. Activa-
1
tions are transmitted between droplets in contact so the ensemble of
droplets can be regarded as a prototype of a neural network. In the
paper we introduce a simple mathematical model that can be used to
simulate the time evolution of interacting droplet system in realistic
experimental conditions. The chemical dynamics is described by the
recently introduced, two variable model that correctly predicts the
period of oscillations for a large class of conditions at which droplets
are investigated. The parameters describing diffusion of activator and
its transport through separating lipids layers are fitted to match the
experimental results. We apply the model to determine the stable
modes of coupled oscillations in two identical droplets.
1 Introduction
Unconventional computing is a field of interdisciplinary research focused on
interpreting the natural time evolution of a physical system as a sequence
of information processing operations [1, 2]. A special attention within the
unconventional computing is given to chemical systems because chemical
processes are responsible for sensing, communication and decision making in
living organisms. Studies on unconventional computation with chemical me-
dia are concerned with processes at various spatial and temporal scales. The
systems considered for information coding and processing include stationary
states of reaction networks [3, 4], macroscopic spatio-temporal structures
appearing in reaction-diffusion processes [5] as well as selective bonding phe-
nomena at the level of individual molecules [6, 7].
It has been demonstrated that relatively simple chemical systems can
2
imitate the behavior of biological neural networks [3, 8]. A typical nerve
system is build of non-linear elements (neurons) that are linked together via
communication channels in which signals propagate and form a specific net-
work. A chemical medium showing similar behavior can be generated with a
clever geometrical distribution of excitable and nonexcitable regions. Studies
on a chemical equivalent of neuron networks, for example based on photo-
sensitive Belousov-Zhabotinsky (BZ) medium with excitability controlled by
illumination level [8], have shown that the geometrical structure of fragments
characterized by different excitabilities plays equally important role as the
chemical kinetics. Even for quite simple excitable kinetics we can construct
logic gates and build a universal computer by setting the proper structure
of illuminated and non-illuminated regions [10]. However, in all applications
of photosensitive medium to information processing a human factor played
the crucial role because an experimentalist manually fixed the geometrical
distribution of illumination levels or operated the devices used to control the
experiment.
It seems much more challenging to find a chemical medium in which the
structure required for information processing is self-generated at properly se-
lected nonequilibrium conditions. A medium composed of droplets contain-
ing the water solution of reagents of BZ reaction that are separated by the
oil-phase is one of the systems in which self-realization of information process-
ing functions seems possible [11, 12]. Our experiments were concerned with
droplets covered by a layer of phospholipids and surrounded by hydrocarbons
[13]. The diameter of droplets in such medium is by an order of magnitude
larger than the those studied by Epstein group [11, 12, 14, 15, 16]. The pres-
3
ence of lipid monolayer stabilized droplets mechanically so the structures
they form remained unchanged for hours. The time evolution of excitations
in such medium, that can be interpreted as a sequence of information pro-
cessing operations, is determined by the kinetics of Belousov-Zhabotinsky
reaction. In the case of ferroin catalyzed reaction two states of the medium,
corresponding to large concentrations of the catalyst in the reduced or the
oxidized forms can be easily distinguished by the color. In the following
we regard the state corresponding to a high concentration of the oxidized
catalyst (blue color of solution) as the excited one. In a droplet containing
oscillatory solution of BZ-reagents the excited state periodically re-appears.
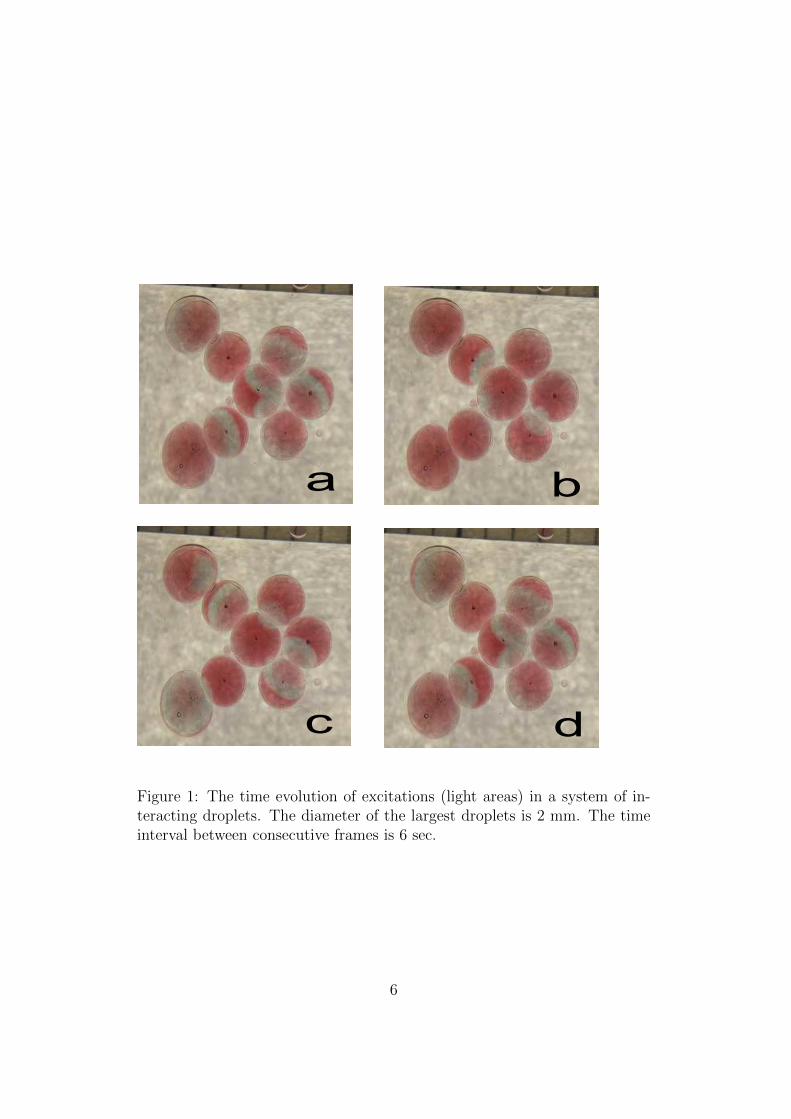
We have observed ( see Fig. 1) that excitations of one droplet can influence
its neighbors via exchange of reagents through separating lipid layers. There-
fore, the structure of multiple droplets can be regarded as a prototype of a
neural network, where individual droplets play the role of nonlinear elements
(neurons) that are linked together and communicate. Fig. 1 shows that in
a typical experiment droplet excitations are not homogeneous. For droplets
with diameters exceeding 1mm we frequently observed pulses of excitation
propagating inside them. In such case the excited region covered a small
fraction of droplet volume.
Experiments with multiple droplets are difficult. The theoretical studies
and in-silico simulations of droplet structures with potential interest for in-
formation processing operations are helpful because they allow to test a large
number of configurations and concentrations of reagents and select the most
interesting for real experiments. In order to translate theoretical predictions
from the virtual world into reality we need a mathematical model that can be
4
related quantitatively with experimental conditions. The aim of this paper
is to propose a simple yet realistic model that can be used to simulate the
time evolution of multiple droplet system observed in typical experimental
conditions with Belousov-Zhabotinsky reaction. The model we present de-
scribes both spatiotemporal dynamics inside a single droplet and interactions
between droplets and it is as simple as the Oregonator [17]. The droplets in
our experiments are relatively large and the geometry of excitations prop-
agating inside a droplet is important for information processing functions
executed by the medium [18, 19]. The simulations of droplets have to base
on partial differential equations. A simple model of chemical kinetics can
significantly reduce the time of calculations if compared with multivariable
ones.
The paper is organized as follows. In the subsequent section we refine the
values of parameters describing chemical kinetics to obtain a good agreement
with periods of oscillations for concentrations of reagents used in experiments.
We estimate the diffusion of activator using the observed excitation velocity.
Activator degradation rate in the lipid bilayer is fixed to describe the trans-
formation of excitation frequency in communication between droplets. In
the next section we use the model to estimate the stability of oscillations in
two coupled identical droplets. We show that both in-phase and anti-phase
oscillations are stable, and we estimate the basin of attraction for each mode.
5
a b
c d
Figure 1: The time evolution of excitations (light areas) in a system of in-teracting droplets. The diameter of the largest droplets is 2 mm. The timeinterval between consecutive frames is 6 sec.
6
2 Spatio-temporal dynamics of BZ-droplets
In this section we discuss two types of spatiotemporal phenomena observed in
BZ-droplets: pulse propagation within a single droplet and transformation
of frequency when train of excitations is transmitted from one droplet to
another. Their analysis allows us to extract the values of model parameters.
We discuss the procedures of parameter fitting. The diffusion of activator
Dx in Eq.(6) is selected to give a correct value of pulse velocity observed in
experiments. The model for activator degeneration inside the double layer
is constructed to explain transformation of frequency of excitations passing
between droplets containing solutions of reagents that produce oscillations
with different periods.
2.1 Simple models of reaction kinetics.
We describe the chemical kinetics inside a droplet using Rovinsky-Zhabotinsky-
like models [21, 22]. Such models are useful for in-silico experiments because
they include a small number of differential equations, but still the equation
parameters can be fitted such that the results are in a good agreement with
experiment. The three-variable model [23] is based on the following kinetic
equations:
∂x
∂t= ε1h0Nx− ε2h0x
2 − 2αγε1β
h0xy + 2αγε1µ
βh0Ny (1)
∂y
∂t= qβ
M ∗Kh0
z
1− z− γh0xy − γµh0Ny +M ∗K (2)
7
∂z
∂t=
h0N
Cx− α
K ∗MCh0
z
(1− z)(3)
where the model variables x, y and z denote scaled concentrations ofHBrO2,Br−
and Fe(phen)3+3 respectively. The symbols C,K,M and N denote the total
concentration of the catalyst (C = [Fe(phen)2+3 ]+[Fe(phen)3+3 ]) and concen-
trations of KBr, CH2(COOH)2 and NaBrO3 respectively. Such choice of
model parameters reflects the fact that in our experiments BZ-droplets were
prepared with water solution of sulfuric acid, sodium bromate, potassium
bromide, malonic acid and ferroin [13, 23] and the concentrations of these
reagents are precisely known when an experiment starts. h0 is the Hammett
acidity function of the solution. For the concentrations of sulfuric acid used
in our experiments it can be approximated as 1.3 times the concentration of
H2SO4. The other parameters of the model: α, β, γ, ε1, ε2, µ and q do not
depend on concentrations of reagents used to prepare BZ-droplets. Their val-
ues are fitted to obtain the best match with periods of oscillations measured
in experiments.
The three variable model (Eqs.(1-3)) can be simplified if we assume that
the relaxation of y is fast and the stationary value of y is immediately ap-
proached. Calculating the steady value of y from Eq.(2) and substituting it
to Eq.(1) we obtain the two variable model:
∂x
∂t= ε1h0Nx− ε2h0x
2 − 2αε1M ∗K(1
β+ q
1
h0
z
1− z)x− µN
x+ µN(4)
∂z
∂t=
h0N
Cx− α
K ∗MCh0
z
(1− z)(5)
8
with parameters α, β, ε1, ε2, µ and q.
Both models presented above can be used to predict the time evolution of
their variables in the BZ-droplets for typical concentrations of reagents used
in experiments. As it can be seen on Fig. 1 oscillations inside droplets are not
spatially homogeneous and excitations can be transmited from one droplet
to another when droplets are in contact. For completeness of mathematical
model we have to describe both phenomena. Having a limited amount of
experimental results we decided to make a model that is as simple as possible
with a small number of adjustable parameters. The oxidized form of catalyst
(z) is a large ion (it contains three bulky phenanthroline ligands ) and we
neglect its mobility if compared to the other reagents. Introducing diffusion
within the three variable model requires self-diffusion constants for both x
and y as well as cross-diffusion parameters. At the moment we have not
collected enough experimental data to give precise values of diffusions, so
we focus our attention on the two variable model with a single self-diffusion
constant Dx for x. Within these approximations equations describing spatio-
temporal effects inside a droplet are:
∂x
∂t= ε1h0Nx− ε2h0x
2 − 2αε1M ∗K(1
β+ q
1
h0
z
1− z)x− µN
x+ µN+Dx∆x (6)
∂z
∂t=
h0N
Cx− α
K ∗MCh0
z
(1− z)(7)
The ion representing the oxidized form of catalyst seems to be too large to
cross lipid bilayer separating droplets. Therefore in the model we use Eq.(7)
with no-flow conditions at droplet boundary. In order to get communica-
9
tion between droplets in the model based on Eqs.(6-7) we have to assume
that HBrO2 can migrate through the double lipid layer. We introduce a
mechanism of activator transport between droplets and fit its parameters.
2.2 The parameters of two variable model
The parameters of the two variable model (Eqs.(4-5))) given in [23] were
obtained after optimization of periods over a large number of experiments
performed with different BZ-mixtures. In experiments discussed below the
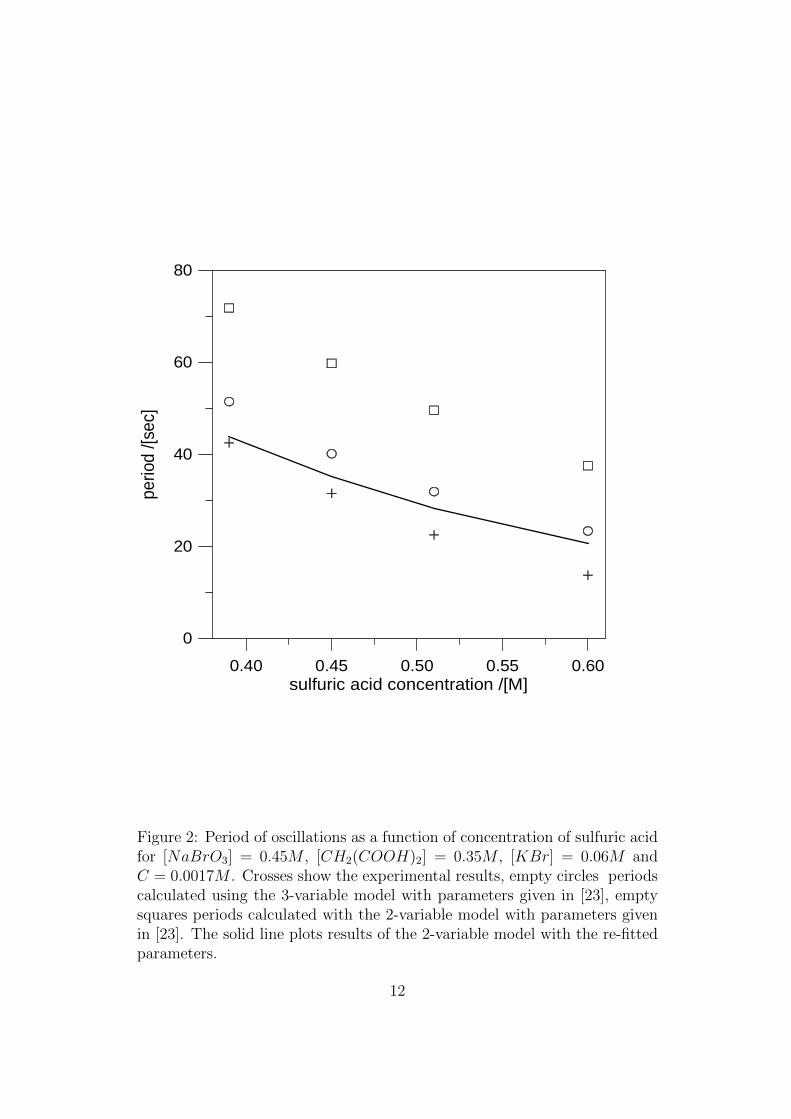
concentration of sulfuric acid was around 0.5M . Selected results for the
period of homogeneous oscillations within a droplet as a function of acidity
of the medium are illustrated in Fig. 2. The experimental results are marked
by crosses. The three variable model with parameters from [23] gives quite
good estimation of the observed period ( empty circles), but, as we have
mentioned, its application for description of spatiotemporal effects requires
a model of diffusion for both HBrO2 and Br−. The periods predicted by
the two variable model with parameters from [23] (α = 2.6 ∗ 10−4, β = 200.,
ε1 = 4000., ε2 = 5800., µ = 2.1 ∗ 10−5 and q = 0.88) are marked with empty
squares. For these parameters the calculated period is approximately twice
as long as that observed in experiments. If a kinetic model fails to predict the
period then one should not expect to estimate correctly the value of activator
diffusion coefficient by comparing calculated velocity with this measured in
an experiment. In order to improve the two variable model we re-fitted
its parameters by optimizing calculated periods for concentrations of sulfuric
acid used in experimental studies on spatiotemporal effects. The optimization
10
procedure was the same as described in [23] and over 20 different sets of
concentrations of BZ-reagents were considered. The re-adjusted values of
parameters for two variable model are: α = 2.6∗10−4, β = 1000., ε1 = 1200.,
ε2 = 6700., µ = 1.6∗10−5 and q = 0.51. As it can be seen, they are not much
different from the original values, but they lead to much better agreement
with experiment (the solid line on Fig 2). We will use these values in the
subsequent calculations.
11
0.40 0.45 0.50 0.55 0.60sulfuric acid concentration /[M]
0
20
40
60
80
perio
d /[s
ec]
Figure 2: Period of oscillations as a function of concentration of sulfuric acidfor [NaBrO3] = 0.45M , [CH2(COOH)2] = 0.35M , [KBr] = 0.06M andC = 0.0017M . Crosses show the experimental results, empty circles periodscalculated using the 3-variable model with parameters given in [23], emptysquares periods calculated with the 2-variable model with parameters givenin [23]. The solid line plots results of the 2-variable model with the re-fittedparameters.
12
2.3 The estimation of diffusion coefficient
In experiments we measure velocity of excitation pulses propagating in elon-
gated droplets. The solution of BZ-reagents is denser than the surrounding
oil phase so droplets placed in a narrow trench at the bottom of a cuvette
assume elongated shapes. If a droplet is long enough then an excitation pulse
generated at one of droplet ends reaches the stable form and velocity within
the droplet. The observed value of velocity can be compared with the numer-
ical solution of Eqs.(6-7)) and the value of Dx for which the numbers match
can be extracted. We studied wave propagation in droplets that were 6 mm
long and 2 mm wide (see Fig. 3 a). The excitation pulses propagated along
the droplet for more than 20 sec with a constant velocity (see Fig. 3 b). To
obtain unidirectional propagation of pulses we introduced a pacemaker ( a
piece of stainless steel seen as a black triangle at the left end of droplet in
Fig. 3(a)). The stainless steel acted similarly to a silver wire and reduced
the concentration of Br− ions that inhibit the reaction. The pacemaker be-
comes a source of pulses with high concentration of the oxidized catalyst
propagating to the left. Two excitation pulses can be seen in Fig. 3(a),
one at the right end of the droplet and another close to the large gas bub-
ble. As the result of forced activation of the medium the excitation maxima
re-appear at a given point more frequently than in a homogeneous medium
without the pacemaker. The observed average time between maxima of oxi-
dized catalyst in the elongated droplet was 21sec. A small (diameter 1.3mm)
separated droplet seen in the left bottom corner of Fig. 3(a). It contained
the same solution of BZ-reagents and the measured period of oscillations
13
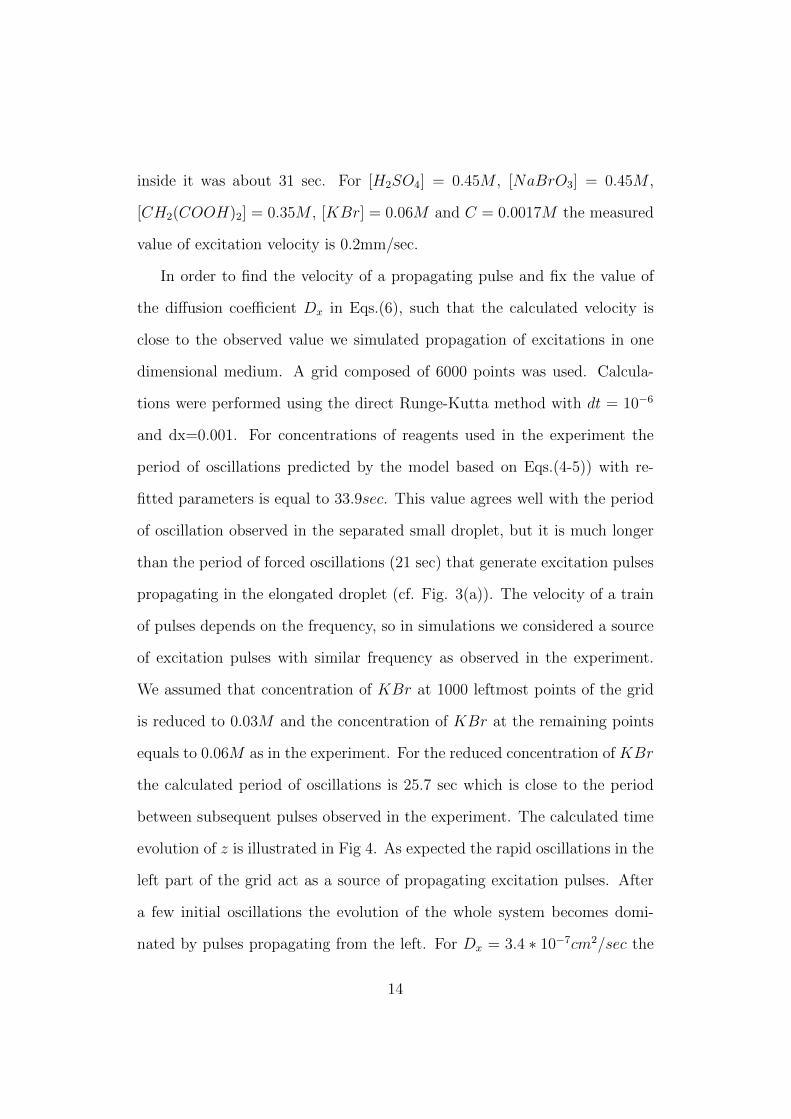
inside it was about 31 sec. For [H2SO4] = 0.45M , [NaBrO3] = 0.45M ,
[CH2(COOH)2] = 0.35M , [KBr] = 0.06M and C = 0.0017M the measured
value of excitation velocity is 0.2mm/sec.
In order to find the velocity of a propagating pulse and fix the value of
the diffusion coefficient Dx in Eqs.(6), such that the calculated velocity is
close to the observed value we simulated propagation of excitations in one
dimensional medium. A grid composed of 6000 points was used. Calcula-
tions were performed using the direct Runge-Kutta method with dt = 10−6
and dx=0.001. For concentrations of reagents used in the experiment the
period of oscillations predicted by the model based on Eqs.(4-5)) with re-
fitted parameters is equal to 33.9sec. This value agrees well with the period
of oscillation observed in the separated small droplet, but it is much longer
than the period of forced oscillations (21 sec) that generate excitation pulses
propagating in the elongated droplet (cf. Fig. 3(a)). The velocity of a train
of pulses depends on the frequency, so in simulations we considered a source
of excitation pulses with similar frequency as observed in the experiment.
We assumed that concentration of KBr at 1000 leftmost points of the grid
is reduced to 0.03M and the concentration of KBr at the remaining points
equals to 0.06M as in the experiment. For the reduced concentration of KBr
the calculated period of oscillations is 25.7 sec which is close to the period
between subsequent pulses observed in the experiment. The calculated time
evolution of z is illustrated in Fig 4. As expected the rapid oscillations in the
left part of the grid act as a source of propagating excitation pulses. After
a few initial oscillations the evolution of the whole system becomes domi-
nated by pulses propagating from the left. For Dx = 3.4 ∗ 10−7cm2/sec the
14
pulse velocity is 0.2 mm/sec. This value of diffusion coefficient is used in the
subsequent calculations. In many papers on simulations of BZ-medium the
activator diffusion coefficient is approximated by 10−6cm2/sec and this value
is not much different from the result of our analysis.
15
space ->
time ->
(a)
(b)
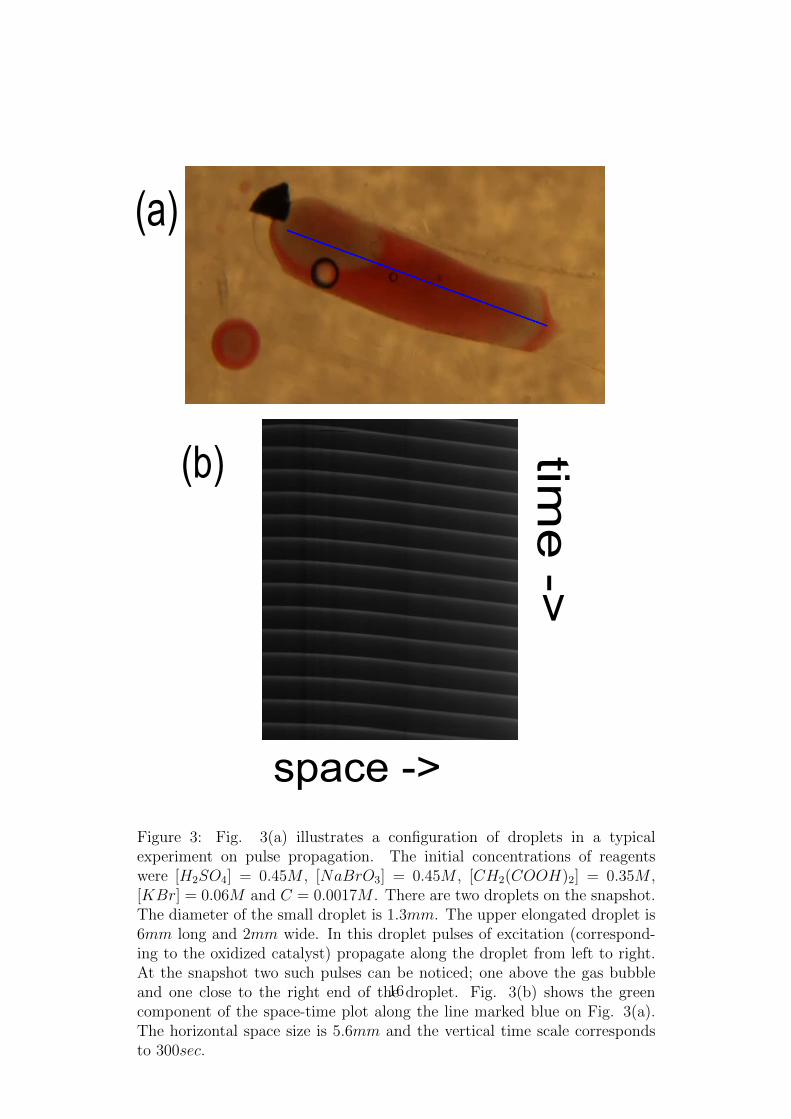
Figure 3: Fig. 3(a) illustrates a configuration of droplets in a typicalexperiment on pulse propagation. The initial concentrations of reagentswere [H2SO4] = 0.45M , [NaBrO3] = 0.45M , [CH2(COOH)2] = 0.35M ,[KBr] = 0.06M and C = 0.0017M . There are two droplets on the snapshot.The diameter of the small droplet is 1.3mm. The upper elongated droplet is6mm long and 2mm wide. In this droplet pulses of excitation (correspond-ing to the oxidized catalyst) propagate along the droplet from left to right.At the snapshot two such pulses can be noticed; one above the gas bubbleand one close to the right end of the droplet. Fig. 3(b) shows the greencomponent of the space-time plot along the line marked blue on Fig. 3(a).The horizontal space size is 5.6mm and the vertical time scale correspondsto 300sec.
16
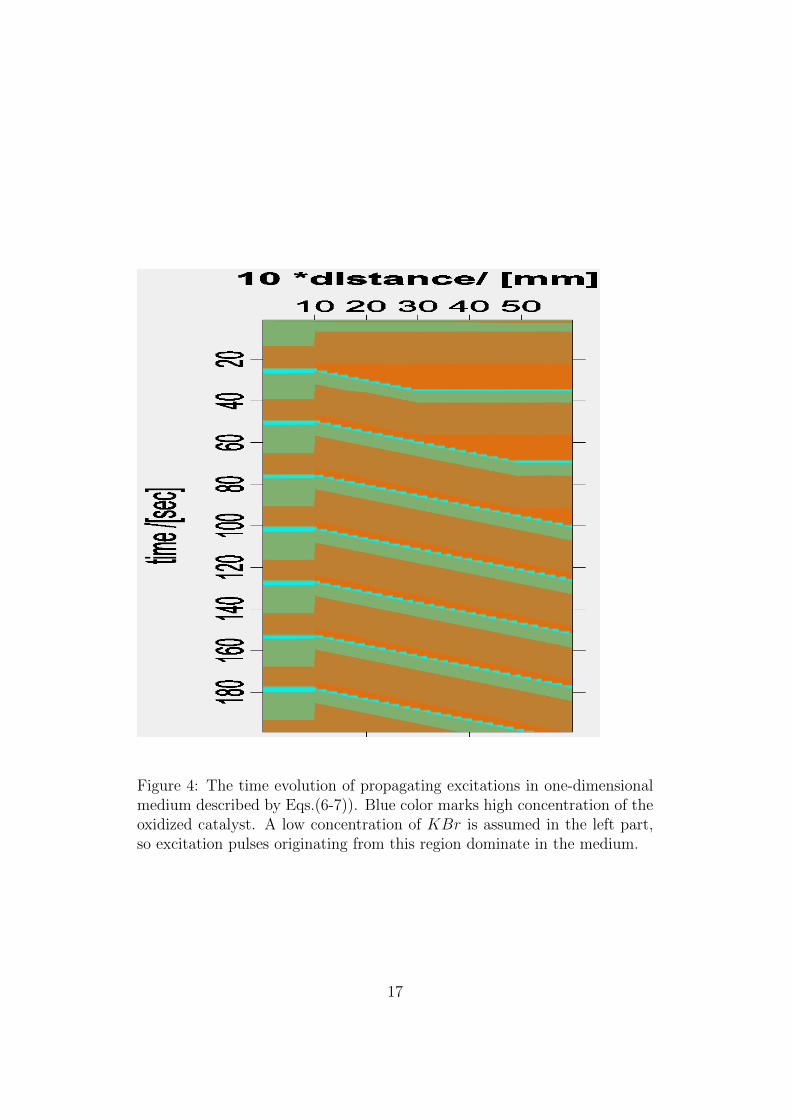
Figure 4: The time evolution of propagating excitations in one-dimensionalmedium described by Eqs.(6-7)). Blue color marks high concentration of theoxidized catalyst. A low concentration of KBr is assumed in the left part,so excitation pulses originating from this region dominate in the medium.
17
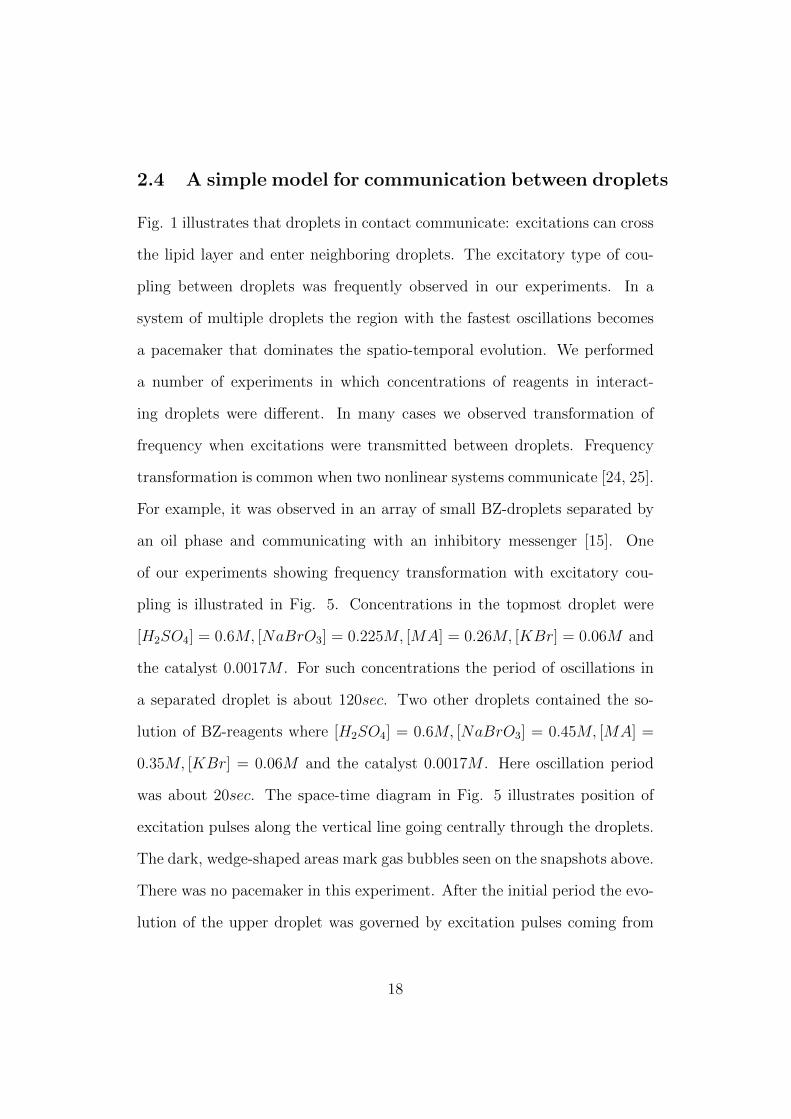
2.4 A simple model for communication between droplets
Fig. 1 illustrates that droplets in contact communicate: excitations can cross
the lipid layer and enter neighboring droplets. The excitatory type of cou-
pling between droplets was frequently observed in our experiments. In a
system of multiple droplets the region with the fastest oscillations becomes
a pacemaker that dominates the spatio-temporal evolution. We performed
a number of experiments in which concentrations of reagents in interact-
ing droplets were different. In many cases we observed transformation of
frequency when excitations were transmitted between droplets. Frequency
transformation is common when two nonlinear systems communicate [24, 25].
For example, it was observed in an array of small BZ-droplets separated by
an oil phase and communicating with an inhibitory messenger [15]. One
of our experiments showing frequency transformation with excitatory cou-
pling is illustrated in Fig. 5. Concentrations in the topmost droplet were
[H2SO4] = 0.6M, [NaBrO3] = 0.225M, [MA] = 0.26M, [KBr] = 0.06M and
the catalyst 0.0017M . For such concentrations the period of oscillations in
a separated droplet is about 120sec. Two other droplets contained the so-
lution of BZ-reagents where [H2SO4] = 0.6M, [NaBrO3] = 0.45M, [MA] =
0.35M, [KBr] = 0.06M and the catalyst 0.0017M . Here oscillation period
was about 20sec. The space-time diagram in Fig. 5 illustrates position of
excitation pulses along the vertical line going centrally through the droplets.
The dark, wedge-shaped areas mark gas bubbles seen on the snapshots above.
There was no pacemaker in this experiment. After the initial period the evo-
lution of the upper droplet was governed by excitation pulses coming from
18
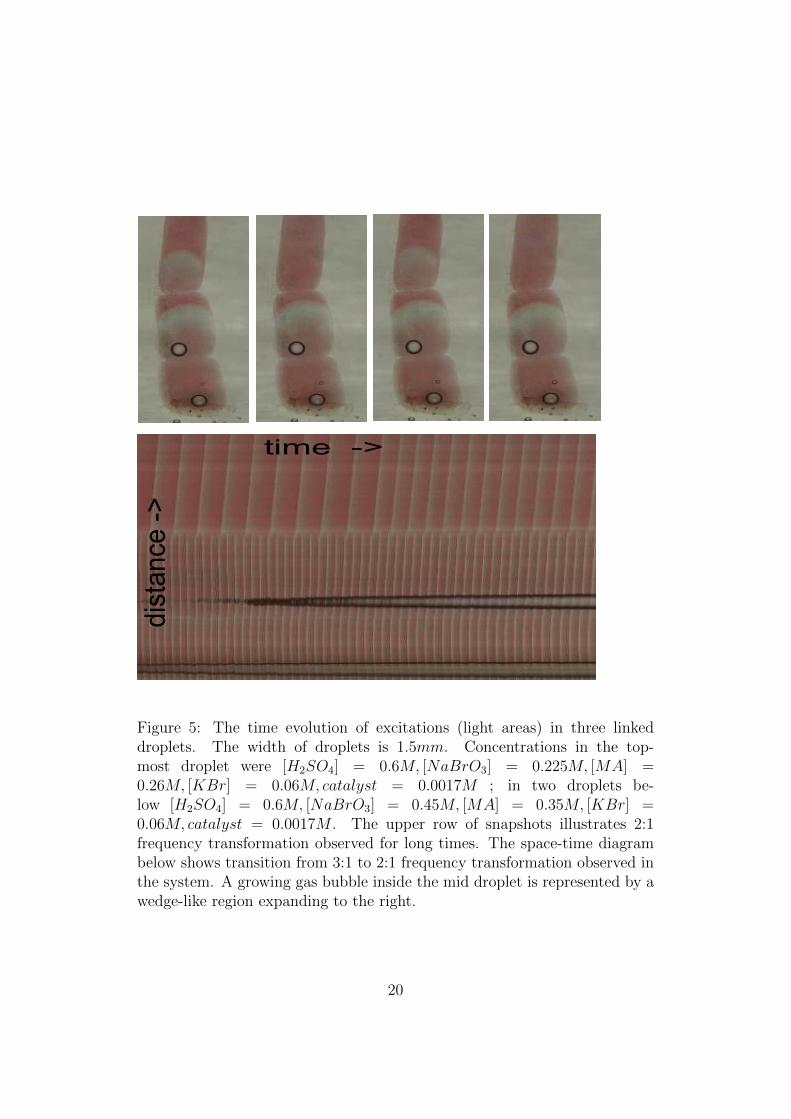
rapidly oscillating droplets below. During the experiment we observed the
frequency transformation: only a part of excitations that appeared in the
lower droplets activate the upper one. The space time plot shows transi-
tion from 3:1 to 2:1 frequency transformation, which is probably related to
the decrease in frequency of arriving excitation pulses. Although the time
evolution of concentrations in lower droplets was not spatially uniform, the
excitations arriving to the bilayer separating the upper droplet were similar
to that generated by a homogeneous evolution. In both cases the wave vector
of arriving excitations was perpendicular to the boundary.
19
time ->
dis
tan
ce
->
Figure 5: The time evolution of excitations (light areas) in three linkeddroplets. The width of droplets is 1.5mm. Concentrations in the top-most droplet were [H2SO4] = 0.6M, [NaBrO3] = 0.225M, [MA] =0.26M, [KBr] = 0.06M, catalyst = 0.0017M ; in two droplets be-low [H2SO4] = 0.6M, [NaBrO3] = 0.45M, [MA] = 0.35M, [KBr] =0.06M, catalyst = 0.0017M . The upper row of snapshots illustrates 2:1frequency transformation observed for long times. The space-time diagrambelow shows transition from 3:1 to 2:1 frequency transformation observed inthe system. A growing gas bubble inside the mid droplet is represented by awedge-like region expanding to the right.
20
The observed frequency transformation should be predicted by a correct
model describing interactions between droplets. The inhibitor z in the model
based on Eqs.(6-7)) represents the concentration of a large ionic complex.
We can assume that the complex is too bulky to penetrate a lipid bilayer.
Therefore, within the two variable model, only migration of activator between
droplets can be responsible for transmission of excitations. Let us consider
two droplets that are in contact. The double layer should be penetrable for
the activator, because otherwise no communication occurs. We described the
double layer as a medium separating the droplets (see Fig. 6). Migration of
HBrO2 between droplets and the double layer is represented by a diffusion
process with the diffusion coefficient Dl. We have no experimental data that
allow us to estimate Dl. In order to introduce as few new parameters in the
model as possible we assume that the diffusion coefficient Dl is the same as
the diffusion coefficient within a droplet and so equal to Dx estimated in the
previous section.
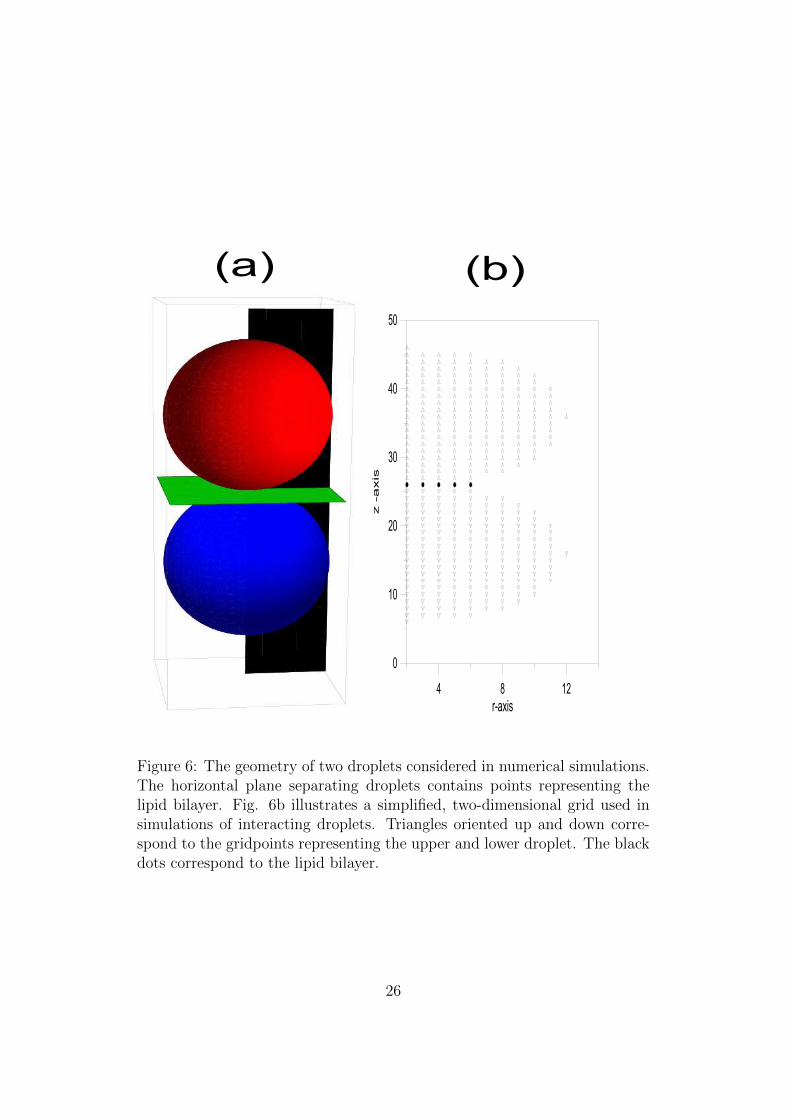
The numerical simulations of two interacting droplets were performed on
the grid schematically illustrated in Fig. 6b. Both droplets were represented
by spheres with centers on the z-axis. The grid points marked with triangles
oriented up and down were used to describe kinetics of BZ-reaction in the
upper and the lower droplet respectively. The bilayer was represented by a
layer of grid points equally distant from centers of droplets. Each of the points
representing the bilayer (the black dots in Fig. 6) has neighbors belonging
to each of the droplets. We considered excitation pulses that have rotational
symmetry along the z-axis. Within such approximation the problem becomes
two-dimensional which speeds up the calculations.
21
For simulations we assumed that concentrations in the upper droplet were:
[H2SO4] = 0.6M, [NaBrO3] = 0.195M, [MA] = 0.175M, [KBr] = 0.06M,
and the catalyst 0.0017M . In the lower droplet they were : [H2SO4] =
0.6M, [NaBrO3] = 0.45M, [MA] = 0.35M, [KBr] = 0.06M, the catalyst
0.0017M . As in Fig. 5 the frequency of oscillations in the lower droplet is
larger than in the upper one. For the considered concentrations the two vari-
able model with re-fitted parameters predicts that separated droplets oscillate
with frequencies 20.5sec and 155sec, which agrees with the experiment. If
droplets are interacting than oscillations of the lower droplets periodically
excite the upper one. The experiment showed a stable 2:1 frequency ratio
between excitations arriving at the bilayer and those crossing it. The cal-
culations for interacting droplets were performed in cylindrical coordinates
with ∆t = 1. ∗ 10−6sec and equal steps in the z-direction and along the ra-
dius ∆z = ∆r = 0.0015mm. The radius of spheres representing droplets was
50 grid distances. The bilayer was formed by an array of 22 grid points.
Although the diameters of considered droplets was smaller than those in
experiments it does not affect simulations, because we considered no flow
boundary condition between droplets and hydrocarbons outside. The re-
sults of simulations have shown that within the assumptions listed above
the interaction between droplets is very strong and each excitation of the
lower droplet generates an excitation of the upper one. Thus, in order to
describe the observed behavior the amount of transmitted activator should
be reduced.
22
In the FKN model [26] we find reaction:
2HBrO2 → HOBr +HBrO3 (8)
that describes degradation of activator if no other reagents are present We
can consider this process and describe the time evolution of activator in the
lipid bilayer with the equation:
∂x
∂t= −Kdx
2 +Dx∆x (9)
and in the reduced variables Kd = ε2h0.
The numerical simulations have shown that if ε2 = 6700 then each ex-
citation of the lower droplet still generates an excitation of the upper one.
Therefore the mechanism of activator degeneration based on reaction (8)
gives too slow decay. Full synchronization between oscillations in droplets
was still observed for Kd = 106.
If we assume that some small ions (H+, Br−) can penetrate the lipid
bilayer then other reactions can lead to degradation of HBrO2 inside it.
Having no information on which reagents diffuse into the double layer and
what are their concentrations we described degradation ofHBrO2 as a simple
decay process with the unknown rate K:
∂x
∂t= −Kx+Dx∆x (10)
The value ofK can be fitted from numerical simulations of systems studied in
experiments. In numerical simulations for selected concentrations of reagents
we observed that the lower droplet, where oscillations are frequent, strongly
influenced slowly oscillating upper droplet, but the reversible interaction was
23
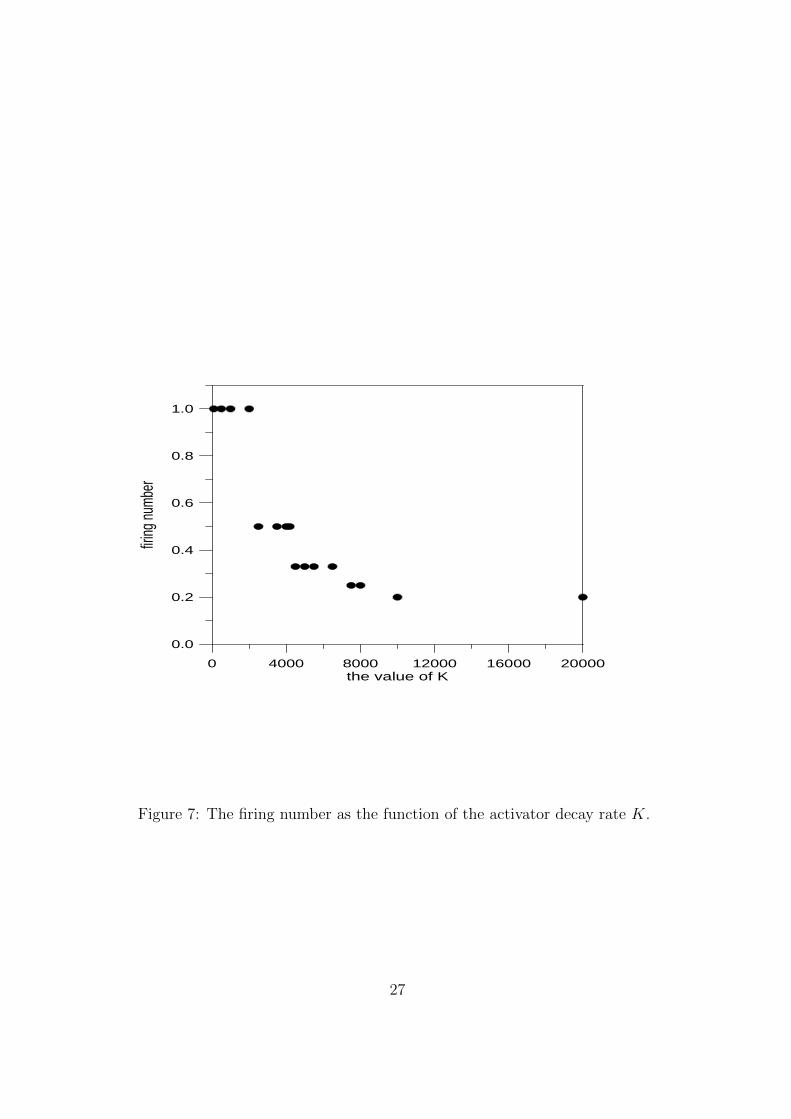
not recorded. We measured the firing number defined as the ratio between
the number of excitations in the upper droplet and the number of excitations
that arrived from the lower one. Fig.7 illustrates the firing number as a
function of the activator decay rate K. The dependence has a typical devil
staircase like form [25]. It is quite surprising that the range of K in which
for the considered concentrations 2:1 frequency transformation is observed
is limited to [2200sec−1, 4300sec−1]. For K > 50000sec−1 oscillations in
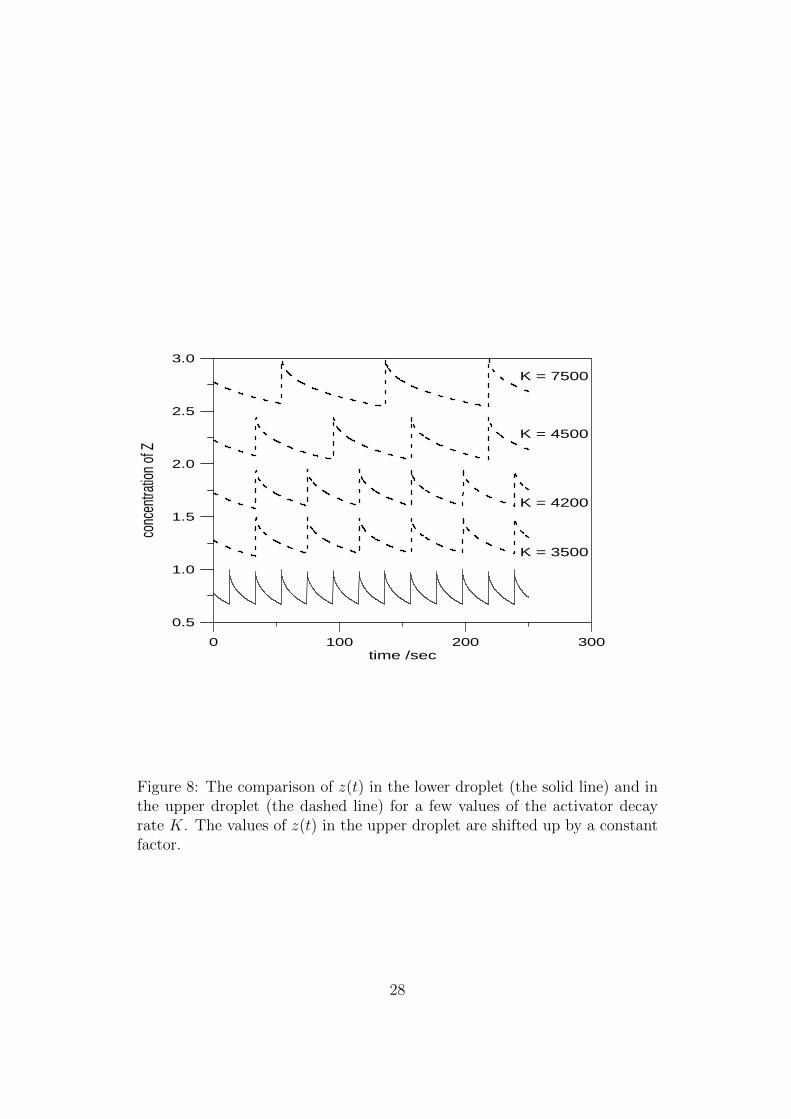
droplets are not synchronized. The time evolution of z in the lower and
upper droplets for a few selected values of activator decay rate is shown in
Fig. 8. The solid curve shows z(t) at the point on the symmetry axis 16 grid
distances above the center of the lower droplet. In this droplet z(t) was the
same for all considered values of K. All dashed lines plot z(t) at the point on
the symmetry axis 16 grid distances below the center of the upper droplet.
The curves corresponding to different values of K are artificially shifted by a
constant, to make them readable. For the considered values of K we observe
different firing numbers. They change from 0.25 for K = 7500sec−1 to 0.5
for K = 3500sec−1.
The estimated value of K (here around 3500sec−1) describes the degener-
ation of activator that should be taken into account to obtain the transforma-
tion of frequency observed in experiments. However, if activator migration
through lipids is slower than, assuming the same value of K, a larger amount
of activator will disappear. Therefore, the fitted value of K is related to the
diffusion coefficient of activator in the bilayer. If Dl 6= Dx, as assumed above,
then the value of K is different.
Numerical simulations indicate that relatively small size of droplets as-
24
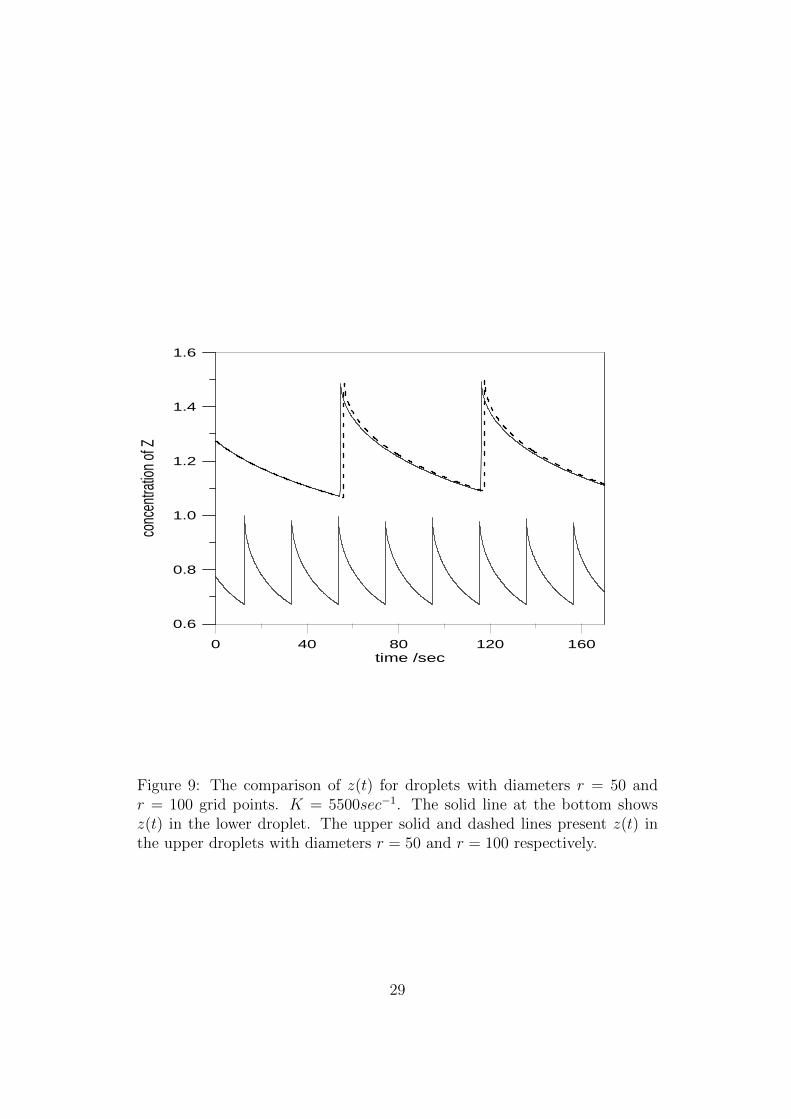
sumed in calculations does not have quantitative influence on the results.
Fig. 9 compares z(t) for droplets with diameters r = 50 and r = 100 grid
points. The decay rate used was K = 5500sec−1. The upper solid line shows
z(t) in the lower droplet, at the point r/6 above the center. The oscillations
in the lower droplet were uniform so the results for r = 50 and r = 100
are identical. In both cases BZ-solution oscillated with the period 20.5sec.
Two lower lines present z(t) at the point r/6 below the center of the up-
per droplet. The solid and the dashed lines show results for droplets with
diameters r = 50 and r = 100 respectively. If a droplet with selected con-
centrations does not interact with the other then the period of oscillations
is 155sec. Here oscillations in the upper droplet are more frequent because
they are forced by oscillations of the lower one. For both radii: r = 50 and
r = 100 every third oscillation of the lower droplet excites the upper one.
Therefore, the firing number does not depend on both droplet radius and
the size of contact layer. Moreover, due to a large difference in periods of
oscillations in separated droplets, the calculated firing number does not de-
pend on the initial states of droplets. The oscillations of the upper droplet
are nonhomogeneous. An excitation originates at the point of contact and
expands over the droplet. It can be noticed that z(t) for r = 100 is delayed
if compared with z(t) for r = 50. The delay just reflects longer distance
between the separating bilayer and the observation point inside the larger
droplet.
25
4 8 12
r-axis
0
10
20
30
40
50
z -a
xis
(a) (b)
Figure 6: The geometry of two droplets considered in numerical simulations.The horizontal plane separating droplets contains points representing thelipid bilayer. Fig. 6b illustrates a simplified, two-dimensional grid used insimulations of interacting droplets. Triangles oriented up and down corre-spond to the gridpoints representing the upper and lower droplet. The blackdots correspond to the lipid bilayer.
26
0 4000 8000 12000 16000 20000the value of K
0.0
0.2
0.4
0.6
0.8
1.0
firing
numb
er
Figure 7: The firing number as the function of the activator decay rate K.
27
0 100 200 300time /sec
0.5
1.0
1.5
2.0
2.5
3.0
conc
entra
tion o
f Z
K = 3500
K = 4200
K = 4500
K = 7500
Figure 8: The comparison of z(t) in the lower droplet (the solid line) and inthe upper droplet (the dashed line) for a few values of the activator decayrate K. The values of z(t) in the upper droplet are shifted up by a constantfactor.
28
0 40 80 120 160time /sec
0.6
0.8
1.0
1.2
1.4
1.6
conc
entra
tion o
f Z
Figure 9: The comparison of z(t) for droplets with diameters r = 50 andr = 100 grid points. K = 5500sec−1. The solid line at the bottom showsz(t) in the lower droplet. The upper solid and dashed lines present z(t) inthe upper droplets with diameters r = 50 and r = 100 respectively.
29
3 The stable modes of coupled oscillations in
two identical droplets
The model described in the previous section can be applied to find the stable
modes of two coupled BZ-droplets. In coupled nonlinear oscillators one can
expect synchronization in both in-phase and anti-phase modes [27]. These
modes can represent bits 0 and 1, so a coupled pair of droplets can be used as
a memory element in a droplet-based unconventional computer. In numeri-
cal study on mode stability we considered two identical droplets represented
by spheres with radius r = 50 grid points. The location of droplets were
the same as shown in Fig. 7. Concentrations of BZ-reagents inside droplets
were identical and equal to: [H2SO4] = 0.45M, [NaBrO3] = 0.45M, [MA] =
0.35M, [KBr] = 0.06M, and the catalyst 0.0017M . For these concentra-
tions of reagents the calculated period of oscillations is T = 35.1sec. At
the beginning of simulations we assumed uniform concentrations of x and
z in each droplet. We considered initial concentrations (x0, z0) that corre-
sponded to points on the limit cycle. The droplets were initialized at different
points of the cycle. The phase distance between points on the limit cycle can
be measured as the time t0 within which the system evolves between these
points. Presenting the results we use t0/T as the measure of distance. We
studied the distance between concentrations at droplet centers after one pe-
riod of oscillations T as the function the initial distance. The results for
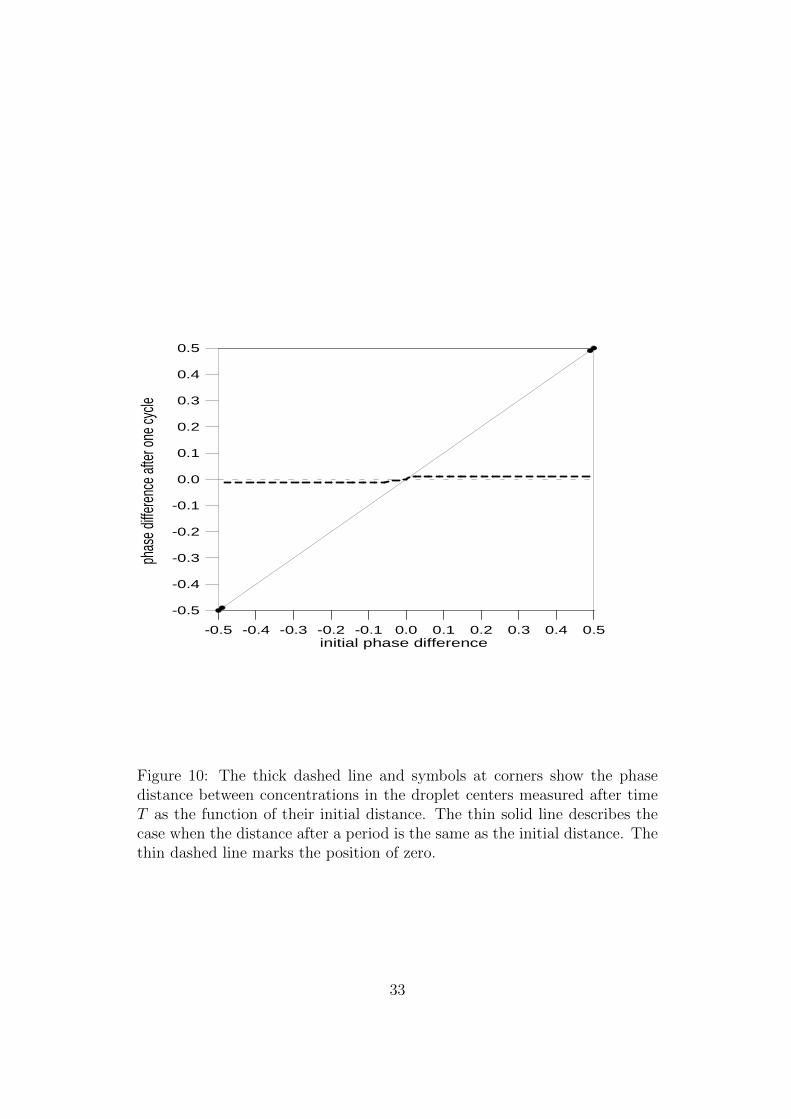
K = 4200sec−1 are illustrated on Fig. 10. If the distance after time T is
smaller than the initial one then oscillations in droplets finally synchronize
in stable in-phase mode. For the considered values of parameters we ob-
30
served such synchronization if the absolute value of initial phase difference is
smaller than 0.487T . It is quite interesting that for majority of initial con-
figurations in this range the stable phase difference is not 0, but has a small
value around 0.01. It is because the stable oscillation mode is represented
by homogeneous oscillations in one of the droplets that activate excitations
in the other. The observed difference in phases corresponds to the time of
excitation propagation form the bilayer where excitations appear to the cen-
ter of droplet where the phase is measured. If the initial phase distance is
smaller than 0.01T it remains stable during the evolution. On the other hand
if the absolute value of initial phase difference is larger than 0.49T than it
does not change after the period. It means that in a narrow range of initial
conditions the perturbations generated by excitations arriving from a firing
droplet are too small to change the state of the other. Therefore anti-phase
oscillations in the considered droplets are stable. Both types of evolution are
illustrated in Fig. 11. The solid and dashed lines illustrate z(t) in the lower
and the upper droplets respectively. For difference is phases smaller than
17.1sec oscillations synchronize in in-phase mode within a single cycle. If
the difference is larger than 17.2sec (the lines at the bottom) the anti-phase
mode of oscillations remains stable. We conclude that if K = 4200sec−1
then a system of two coupled droplets can play a role of memory with states
corresponding to in-phase and to anti-phase oscillations, although the region
of anti-phase oscillations is very narrow. In the ideal memory based on two
interacting droplets the basins of attraction for each of the modes should be
similar. The model presented above can be used to scan the space of reagent
concentrations for such system. The precise estimation of K in the model
31
is very important for studies on the stable modes of interacting droplets,
because small changes in K can lead to qualitative changes in the charac-
ter of evolution. For smaller values of K the concentration of transmitted
activator increases and the basin of attraction for in-phase synchronization
becomes larger. Numerical simulations of BZ-droplets with concentrations
described above and the activator degeneration rate K = 3000sec−1, which
also explains 2:1 frequency transformation in the considered experiment, do
not show a stable anti-phase mode. Additional experiments on frequency
transformation for droplets with different concentrations of reagents should
allow for better estimation of K.
32
-0.5 -0.4 -0.3 -0.2 -0.1 0.0 0.1 0.2 0.3 0.4 0.5initial phase difference
-0.5
-0.4
-0.3
-0.2
-0.1
0.0
0.1
0.2
0.3
0.4
0.5
phas
e diffe
renc
e afte
r one
cycle
Figure 10: The thick dashed line and symbols at corners show the phasedistance between concentrations in the droplet centers measured after timeT as the function of their initial distance. The thin solid line describes thecase when the distance after a period is the same as the initial distance. Thethin dashed line marks the position of zero.
33

0 40 80 120time /sec
0.4
0.8
1.2
conc
entra
tion o
f z
Dt = 17.10 sec
Dt = 17.20 sec
Figure 11: z(t) for two identical interacting droplets with diameters r = 50.The solid and dashed lines show z(t) in the lower and the upper dropletsrespectively. The initial phase difference between upper and lower dropletsis given next to the lines, K = 4200sec−1. For the phase difference smallerthan 17.1sec oscillations synchronize in the in-phase mode within a singlecycle. If the difference is large it does not change in time and the anti-phasemode of oscillations remains stable (the bottom lines).
34
4 Conclusions
In this paper we generalized previously introduced simple two variable model
of BZ reaction kinetics including diffusion of activator and the mechanism
of communication between droplets in contact. We estimated the values of
model parameters such that numerical calculations based on the model agree
with experimental studies on excitation propagation within a droplet and
transformation of frequency on the lipid bilayer separating droplets. We think
that the considered model can be used in future investigation on information
processing operations that can be executed by a medium composed of BZ-
droplets. The model contains just two variables and in intensive numerical
simulations of spatio-temporal evolution it is faster than multi variable mod-
els. This is important because some information processing operations, like
for example unidirectional propagation of excitations [13] between droplets,
are related with sizes and geometry of contacts. Reaction-diffusion equations
describing 3-dimensional medium have to be solved to simulate such behav-
ior. It is also important that the model, unlike commonly used Oregonator
[17], can be easily adopted to describe quantitatively an experiment with
typical concentrations of reagents.
We applied the model to find the stable modes of oscillations in two cou-
pled droplets containing the same mixture of reagents. The results strongly
depend on selected value of K. For K = 4200sec−1 that explains 2:1 fre-
quency transformation observed in experiment the model have shown that
both in-phase and anti-phase oscillations can be stable, although the region
where the anti-phase oscillations are stabile is very small. The stability of
35
both phases indicates that a pair of oscillating droplets can be used as a
memory with 1 bit capacity.
More complex four variable model of BZ-droplet kinetics have been con-
sidered in a number of recent papers published by Epstein group [15, 16].
However the droplets in those experiments are much smaller than ours, so
the spatiotemporal effects inside a droplet can be neglected. Moreover, the
distance between droplets in Epstein group experiments was larger (around
100µm) than that between our droplets in contact. It was discovered that for
distant droplets the inhibitory coupling with Br2 molecules diffusing in the
oil phase was dominant and resulted in anti-phase synchronization. In our ex-
periments communication between droplets results from excitatory coupling
and in-phase synchronization prevails. However, the model described in the
paper shows that even with excitatory coupling anti-phase synchronization
can be stable.
5 Acknowlgement
The research was supported by the NEUNEU project financed by the Euro-
pean Community within FP7-ICT-2009-4 ICT-4-8.3 - FET Proactive 3: Bio-
chemistry-based Information Technology (CHEM-IT) program. The contri-
bution of one of the authors (K.G.) was financed within the International
PhD Projects Programme of the Foundation for Polish Science, cofinanced
from European Regional Development Fund within Innovative Economy Op-
erational Programme ”Grants for innovation”.
36
References
[1] Gramss, T.; Bornholdt, S.; Gross, M.; Mitchell, M.; Pellizzari, T.; Non-
Standard Computation, Wiley-VCH: Weinhaim 1998.
[2] Many articles covering different aspects of unconventional computing
can be found in Encyclopedia of Complexity and Systems Science, Mey-
ers, R. A. ed., Springer-Verlag: New York, 2009.
[3] Hjelmfelt, A.; Weinbergret, E. D.; Ross, J. Proc. Natl. Acad. Sci. U.S.A.
1991, 88, 10983-10987 .
[4] Buisman, H. J.; ten Eikelder, H. M. M.; Hilbers, P. A. J.; Liekens, A.
M. L. Artificial Life 2009, 15 115.
[5] Adamatzky, A.; De Lacy Costello,B.; Asai, T. Reaction, Reaction-
Diffusion Computers, Elsevier Science: Amsterdam, The Netherlands,
2005.
[6] Lulu Qian, David Soloveichik, D.; Winfree, E.; Efficient Turing-
universal computation with DNA polymers, in Proceedings of the 16th in-
ternational conference on DNA computing and molecular programming,
Springer-Verlag: Heidelberg 2011, ISBN: 978-3-642-18304-1.
[7] Stojanovic, M.N.; Mitchell, T.E.; Stefanovic, D.; J. Am. Chem. Soc.
2002, 124 3555-3561.
[8] Gorecka, J.N.; Gorecki, J.; J. Chem. Phys. 2006, 124 084101.
[9] Gorecki, J.; Gorecka, J.N.; International Journal of Unconventional
Computing 2007, 3, 259-270.
37
[10] Gorecki, J.; Gorecka, J. N.; Computing in Geometrical Constrained Ex-
citable Chemical Systems in Encyclopedia of Complexity and Systems
Science , Meyers, R. A. ed., Springer-Verlag: New York, 2009.
[11] Vanag, V. K.; Epstein, I. R.; Proc. Natl. Acad. Sci. U.S.A. 2003, 100
14635-14638.
[12] Toiya, M.; Vanag, V. K.; Epstein, I. R.; Angew. Chem., Int. Ed. 2008,
47, 7753-7755.
[13] Szymanski, J.; Gorecka, J. N.; Igarashi, Y.; Gizynski, K.; Gorecki, J.;
Zauner, K. P.; de Planque, M.; Int. J. Unconv. Comput. 2011, 7, 141-
158.
[14] Toiya, M.; Gonzalez-Ochoa H.O.; Vanag, V. K.; Fraden S.; Epstein, I.
R.; J. Phys. Chem. Lett. 2010, 7, 1241-1246.
[15] Vanag, V. K.; Epstein, I. R.; Phys. Rev. E 2010, 81, 066213.
[16] Delgado, J.; Li, N.; Leda, M.; Gonzalez-Ochoa H.O.; Fraden S.; Epstein,
I. R.; Soft Matter, 2011, 7, 3155-3167.
[17] Krug, H. J.; Pohlmann L.; Kuhnert L.; J. Phys. Chem. 1990, 94, 4862-
4866.
[18] Holley, J.; Adamatzky, A.; Bull, L.; De Lacy Costello, B.; Jahan, I.;
Computational modalities of BelousovZhabotinsky encapsulated vesi-
cles, Nano Communication Networks 2011, 2, 50-61.
[19] Adamatzky, A.; De Lacy Costello, B.; Bull, L.; Holley, J.; Isr. J. Chem.
2011, 51, 56-66
38
[20] Holley, J.; Jahan, I.; De Lacy Costello, B.; Adamatzky, A.; Bull, L.;
Phys. Rev. E 2011, 84, 056110.
[21] Rovinsky, A. B.; Zhabotinsky, A. M.; J. Phys. Chem. 1984, 88, 6081-
6084.
[22] Rovinsky, A. B.; J. Phys. Chem. 1986, 90, 217-219.
[23] Gorecki, J.; Szymanski, J.; Gorecka, J.N.; J. Phys. Chem. A 2011, 115,
8855-8859
[24] Sielewiesiuk, J.; Gorecki, J.; J. Phys. Chem. A 2002, 106, 4068.
[25] Sielewiesiuk, J.; Gorecki, J.; Phys. Rev. E 2002, 66, 016212.
[26] Field, R. J.; Koros E.; Noyes, R. M.; J. Am. Chem. Soc. 1972, 94,
8649-8664.
[27] Kohira, M. I.; Magome, N.; Kitahata, H.; Yoshikawa, K.; Am. J. Phys.
2007, 75, 893.
39


![[INSERT PROJECT NAME]€¦ · Project name Project Number [Where applicable] Project Manager Project Controller Project location [Insert brief details of project location, including](https://img.dokumen.tips/doc/110x75/603496f741d854077e52cec0/insert-project-name-project-name-project-number-where-applicable-project-manager.jpg)