Embed Size (px)
Citation preview

National Indian Health Board Annual Consumers Conference
September 2014
CMS Tribal Technical Advisory Group Data Project Update
Mark LeBeau, PhDExecutive Director
California Rural Indian Health Board
Joan O’Connell, PhDCenters for American Indian and Alaska Native Health,
University of Colorado Denver

The Burden of Diabetes among American Indians and Alaska Native
Medicare Enrollees
II. TTAG Data Project 2014 Medicare Findings

Project Population
Medicare enrollees in 2010
IHS AIANs: AIANs registered to use IHS services, number = 121,323
White: non-Hispanic white enrollees, number = 5,915,119, reference population
Other:
•Lived in IHS Contract Health Service Delivery Areas (CHSDAs)
•No Medicare capitated coverage, no managed care
•Coverage for inpatient and outpatient services (that is Medicare Part A and Part B coverage) during 2010

Results: AIAN age and disability
Nearly twice as many IHS AIAN (29%) as White enrollees (15%) were eligible for Medicare due to a disability – that is they were younger than 65 years old.
Age distribution of IHS AIAN and White Medicare enrollees. 2010.
0%
5%
10%
15%
20%
25%
30%
35%
40%
45%
< 45 45 - 54 55 - 64 65 - 74 75 - 84 85+
IHS AIAN White

Results: AIAN dual enrollment in Medicaid
Twice as many IHS AIAN as White enrollees were also enrolled in Medicaid.
aianwhite
Percent of IHS AIAN and White Medicare enrollees enrolled in Medicaid. 2010.
31%
14%
0%
20%
40%
60%
80%
100%
IHS AIAN White
Medicaid

Results: Health status
The prevalence of diabetes among IHS AIAN was 1.6 times* that for White enrollees.
The IHS AIAN prevalence rates were adjusted to the age and gender distribution of the White enrollees.
The diabetes status of Medicare enrollees. 2010.
39%
61%
IHS AIAN
Enrolleeswith diabetes
Otherenrollees
24%
76%
White
Otherenrollees
Enrolleeswith diabetes
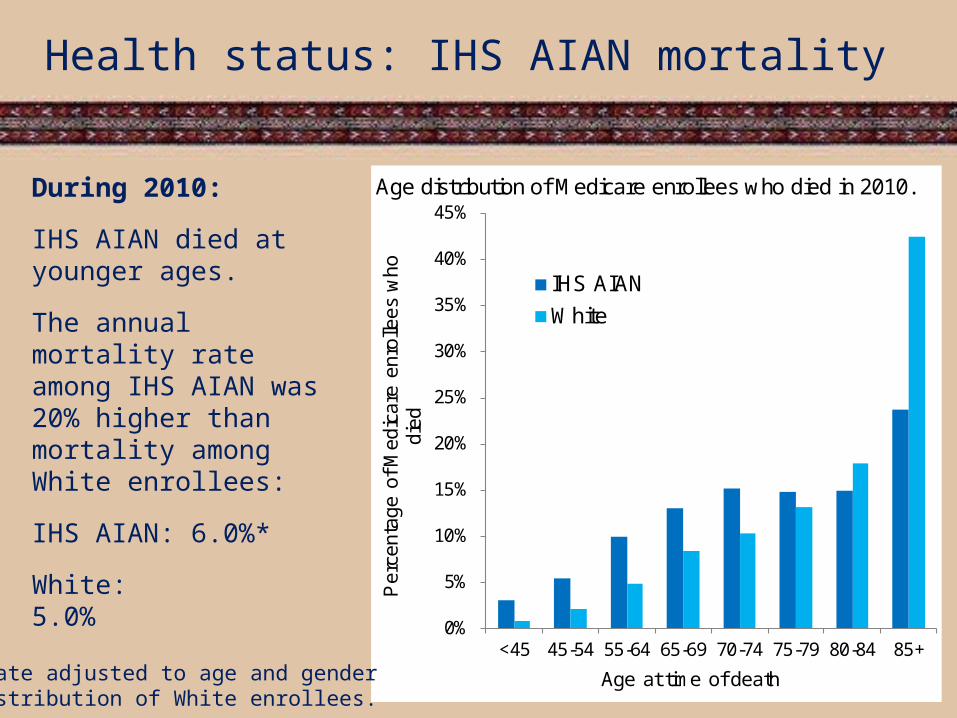
Health status: IHS AIAN mortality
During 2010:
IHS AIAN died at younger ages.
The annual mortality rate among IHS AIAN was 20% higher than mortality among White enrollees:
IHS AIAN: 6.0%*
White: 5.0%
Age distribution of Medicare enrollees who died in 2010.
0%
5%
10%
15%
20%
25%
30%
35%
40%
45%
<45 45-54 55-64 65-69 70-74 75-79 80-84 85+
Per
cent
age
of M
edic
are
enro
llees
who
di
ed
Age at time of death
IHS AIAN
White
*Rate adjusted to age and gender distribution of White enrollees.

Higher mortality among IHS AIAN is explained in part by their higher prevalence of diabetes and related chronic conditions.
Diabetes status of Medicare enrollees who died in 2010.
50%50%
IHS AIAN
Enrolleeswith diabetes
Otherenrollees
33%
67%
White
Other enrollees
Enrolleeswith diabetes
Health status: IHS AIAN mortality

Medicare payments: The influence of diabetes and related conditions on Medicare payments
Nearly 40% of IHS AIAN had diabetes.They accounted for 59% of all Medicare payments for IHS AIAN.
Percent of total Medicare payments attributed to enrollees with diabetes.
38%
White
59%
IHS AIAN
Enrolleeswith
diabetes
62%Other
enrollees
41%Other
enrollees
Enrolleeswith
diabetes

Medicare payments: The influence of diabetes and related conditions on Medicare payments
The average annual Medicare payment for all IHS AIAN enrollees was higher than for White enrollees. However, health status influenced spending.
All persons 15,021 12,261 Persons with diabetes (regardless of other comorbidities) 22,751 19,502
Among persons with diabetes
No CVD or ESRD 10,658 10,141
CVD no ESRD 26,539 25,081
ESRD 78,559 85,282
IHS AIAN White
Average annual Medicare payments. 2010.
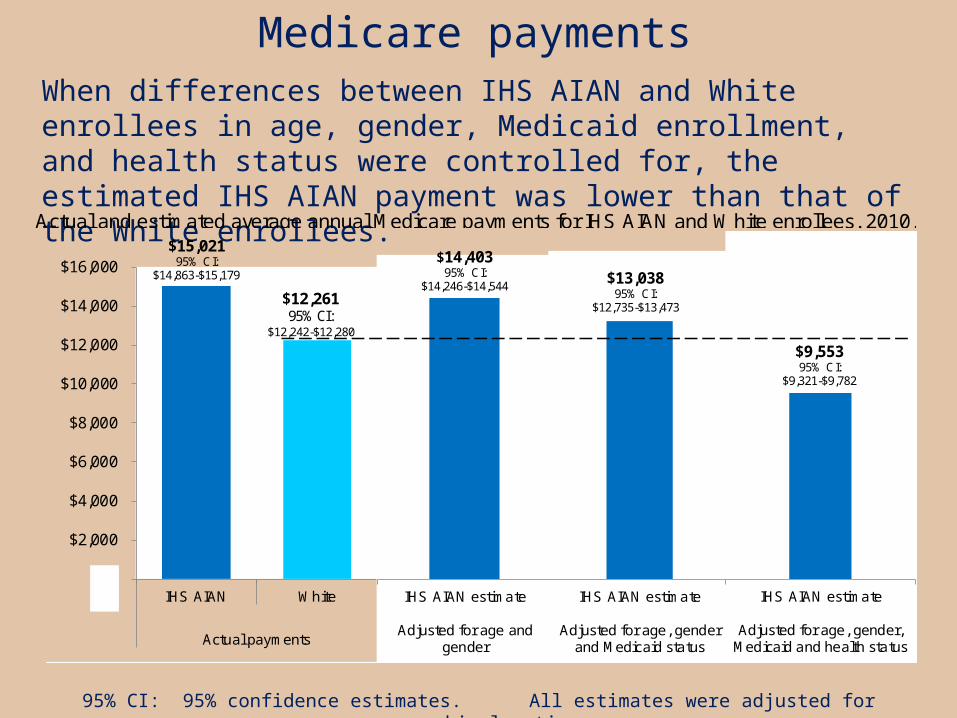
95% CI: 95% confidence estimates. All estimates were adjusted for geographic location.
Medicare paymentsWhen differences between IHS AIAN and White enrollees in age, gender, Medicaid enrollment, and health status were controlled for, the estimated IHS AIAN payment was lower than that of the White enrollees.
Actual and estimated average annual Medicare payments for IHS AIAN and White enrollees. 2010.
$-
$2,000
$4,000
$6,000
$8,000
$10,000
$12,000
$14,000
$16,000
IHS AIAN White
Actual payments
$12,26195% CI:
$12,242-$12,280
$15,02195% CI:
$14,863-$15,179
IHS AIAN estimate
Adjusted for age, genderand Medicaid status
$13,03895% CI:
$12,735-$13,473
IHS AIAN estimate
Adjusted for age, gender,Medicaid and health status
$9,55395% CI:
$9,321-$9,782
IHS AIAN estimate
Adjusted for age andgender
The predictions above are based on a two-stage regression model. In the first stage, a logistic regression was used to estimate the factors
$14,40395% CI:
$14,246-$14,544
Policy Implications
Preventing the onset of diabetes among AIANs is key to reducing identified disparities. Programs implemented to prevent diabetes or prevent the onset of complications among those with diabetes must address AIAN specific needs:
• Living in rural areas, • Having lower household incomes,• Diabetes onset at younger age, and• High rates of diabetes-related complications.
Policy ImplicationsSpecific information on AIAN who use IHS services can inform efforts to improve IHS AIAN health outcomes.
Examples:
Medicare and Medicaid reimbursement policies and programs that support increased IHS AIAN access to evidenced-based and best practices that prevent diabetes and diabetes-related complications and efficiently use resources.
The Special Diabetes Program for Indians (SDPI) increases access to services that prevent the onset of diabetes, and prevent and treat complications among those with diabetes. Information on the burden of diabetes may be used to assess sustained funding for this program.