Embed Size (px)
Citation preview

NATIONAL HURRICANE CENTER FORECAST VERIFICATION REPORT
2015 HURRICANE SEASON
John P. Cangialosi and James L. Franklin 9 March 2016
TRACKS OF THE 2015 ATLANTIC AND EAST PACIFIC TROPICAL CYCLONES.
ABSTRACT
The 2015 Atlantic hurricane season had below-normal activity, with 222 official forecasts issued. The mean NHC official track forecast errors in the Atlantic basin were slightly smaller than the previous 5-yr means from 12 to 36 h, but higher than the 5-yr means from 72 to 120 h. No records for track accuracy were set. The official track forecasts were highly skillful and performed close to or better than the consensus models. EMXI was the best-performing model and the only aid to consistently beat the official forecasts at 36 h and beyond. GFSI was a strong performer and the second best individual model. AEMI, EGRI, and HWFI were fair performers while GHMI, CMCI, NVGI, and GFNI performed less well. The Government Performance and Results Act of 1993 (GPRA) track goal was just missed.
2015 Hurricane Season 2
Mean official intensity errors for the Atlantic basin in 2015 were below the 5-yr means from 12 to 48 h, but above the means at the longer lead times. Decay-SHIFOR errors in 2015 were close to their 5-yr means from 12 to 36 h, but considerably larger than average at the other forecast times. The official forecasts were quite skillful and near or better than the top models. Records for intensity accuracy were set at 12 and 24 h. Among the guidance, FSSE, HWFI, DSHP, and LGEM were the best performers, followed by IVCN. GHMI was the poorest-performing model, and GFNI was not competitive. The GPRA intensity goal was met.
There were 362 official forecasts issued in the eastern North Pacific basin in 2015, although only 127 of these verified at 120 h. This level of forecast activity was considerably above average. No records for track accuracy were set in 2015. The official forecasts were very skillful, but they were outperformed by TVCE and occasionally by FSSE. EMXI was the best individual model, but it had a little less skill than the consensus aids and the official forecasts. GFSI, AEMI, and HWFI performed fairly well and made up the second tier of models.
For intensity, the official forecast errors in the eastern North Pacific basin were slightly higher than the 5-yr means at most times. Decay-SHIFOR errors in 2015 were also higher than their 5-yr means, indicating the season’s storms were more difficult than average to predict. No records for intensity accuracy were set. The official forecasts were as good as or better than all of the guidance, and they were only outperformed by FSSE at 24 and 36 h. IVCN was a strong perfomer, but it had less skill than the official forecasts. HWFI, DSHP, and LGEM were about equally skillful and made up the second tier of models. GHMI, GFNI, GFSI, and EMXI were not competitive. Nearly all of the guidance and the official forecasts had a low bias in 2015.
Quantitative probabilistic forecasts of tropical cyclogenesis were publically expanded from 48 to 120 h in August of 2013. Forecasts were expressed in 10% increments and in terms of categories (“low”, “medium”, or “high”). In the Atlantic basin, results from 2015 indicate that the 48-h probabilistic forecasts were quite reliable at the low probabilities, but had a low (under-forecast) bias at medium probabilities. The 120-h probabilities also had a low bias at probabilities higher than 40%. In the eastern North Pacific basin, the 48-h probabilistic forecasts were well calibrated, but the 120-h probabilities had a low bias at most ranges.

2015 Hurricane Season 3
TABLE OF CONTENTS
1. Introduction 4
2. Atlantic Basin 7 a. 2015 season overview – Track 7 b. 2015 season overview – Intensity 9 c. Verifications for individual storms 10
3. Eastern North Pacific Basin 10 a. 2015 season overview – Track 10 b. 2015 season overview – Intensity 11 c. Verifications for individual storms 12
4. Genesis Forecasts 12
5. Looking Ahead to 2016 12 a. Track Forecast Cone Sizes 12 b. Consensus Models 13
6. References 14
List of Tables 15
List of Figures 45

2015 Hurricane Season 4
1. Introduction For all operationally designated tropical or subtropical cyclones in the Atlantic and eastern North Pacific basins, the National Hurricane Center (NHC) issues an official forecast of the cyclone’s center location and maximum 1-min surface wind speed. Forecasts are issued every 6 h, and contain projections valid 12, 24, 36, 48, 72, 96, and 120 h after the forecast’s nominal initial time (0000, 0600, 1200, or 1800 UTC)1. At the conclusion of the season, forecasts are evaluated by comparing the projected positions and intensities to the corresponding post-storm derived “best track” positions and intensities for each cyclone. A forecast is included in the verification only if the system is classified in the final best track as a tropical (or subtropical2) cyclone at both the forecast’s initial time and at the projection’s valid time. All other stages of development (e.g., tropical wave, [remnant] low, extratropical) are excluded3. For verification purposes, forecasts associated with special advisories do not supersede the original forecast issued for that synoptic time; rather, the original forecast is retained4. All verifications in this report include the depression stage.
It is important to distinguish between forecast error and forecast skill. Track forecast error, for example, is defined as the great-circle distance between a cyclone’s forecast position and the best track position at the forecast verification time. Skill, on the other hand, represents a normalization of this forecast error against some standard or baseline. Expressed as a percentage improvement over the baseline, the skill of a forecast sf is given by
sf (%) = 100 * (eb – ef) / eb
where eb is the error of the baseline model and ef is the error of the forecast being evaluated. It is seen that skill is positive when the forecast error is smaller than the error from the baseline.
To assess the degree of skill in a set of track forecasts, the track forecast error can be compared with the error from CLIPER5, a climatology and persistence model that contains no information about the current state of the atmosphere (Neumann 1972, Aberson 1998)5. Errors from the CLIPER5 model are taken to represent a “no-skill” level of accuracy that is used as the baseline (eb) for evaluating other forecasts6. If CLIPER5 errors are unusually low during a given season, for example, it indicates that the year’s storms were inherently “easier” to forecast than normal or otherwise unusually well behaved. The current version of CLIPER5 is based on developmental data from 1931-2004 for the Atlantic and from 1949-2004 for the eastern Pacific.
Particularly useful skill standards are those that do not require operational products or inputs, and can therefore be easily applied retrospectively to historical data. CLIPER5 satisfies
1 The nominal initial time represents the beginning of the forecast process. The actual advisory package is not released until 3 h after the nominal initial time, i.e., at 0300, 0900, 1500, and 2100 UTC. 2 For the remainder of this report, the term “tropical cyclone” shall be understood to also include subtropical cyclones. 3 Possible classifications in the best track are: Tropical Depression, Tropical Storm, Hurricane, Subtropical Depression, Subtropical Storm, Extratropical, Disturbance, Wave, and Low. 4 Special advisories are issued whenever an unexpected significant change has occurred or when watches or warnings are to be issued between regularly scheduled advisories. The treatment of special advisories in forecast databases changed in 2005 to the current practice of retaining and verifying the original advisory forecast. 5 CLIPER5 and SHIFOR5 are 5-day versions of the original 3-day CLIPER and SHIFOR models. 6 To be sure, some “skill”, or expertise, is required to properly initialize the CLIPER model.

2015 Hurricane Season 5
this condition, since it can be run using persistence predictors (e.g., the storm’s current motion) that are based on either operational or best track inputs. The best-track version of CLIPER5, which yields substantially lower errors than its operational counterpart, is generally used to analyze lengthy historical records for which operational inputs are unavailable. It is more instructive (and fairer) to evaluate operational forecasts against operational skill benchmarks, and therefore the operational versions are used for the verifications discussed below.7
Forecast intensity error is defined as the absolute value of the difference between the forecast and best track intensity at the forecast verifying time. Skill in a set of intensity forecasts is assessed using Decay-SHIFOR5 (DSHIFOR5) as the baseline. The DSHIFOR5 forecast is obtained by initially running SHIFOR5, the climatology and persistence model for intensity that is analogous to the CLIPER5 model for track (Jarvinen and Neumann 1979, Knaff et al. 2003). The output from SHIFOR5 is then adjusted for land interaction by applying the decay rate of DeMaria et al. (2006). The application of the decay component requires a forecast track, which here is given by CLIPER5. The use of DSHIFOR5 as the intensity skill benchmark was introduced in 2006. On average, DSHIFOR5 errors are about 5-15% lower than SHIFOR5 in the Atlantic basin from 12-72 h, and about the same as SHIFOR5 at 96 and 120 h.
It has been argued that CLIPER5 and DSHIFOR5 should not be used for skill benchmarks, primarily on the grounds that they were not good measures of forecast difficulty. Particularly in the context of evaluating forecaster performance, it was recommended that a model consensus (see discussion below) be used as the baseline. However, an unpublished study by NHC has shown that on the seasonal time scales at least, CLIPER5 and DSHIFOR5 are indeed good predictors of official forecast error. For the period 1990-2009 CLIPER5 errors explained 67% of the variance in annual-average NHC official track forecast errors at 24 h. At 72 h the explained variance was 40% and at 120 h the explained variance was 23%. For intensity the relationship was even stronger: DSHIFOR5 explained between 50 and 69% of the variance in annual-average NHC official errors at all time periods. Given this, CLIPER5 and DSHIFOR5 appear to remain suitable baselines for skill, in the context of examining forecast performance over the course of a season (or longer). However, they’re probably less useful for interpreting forecast performance with smaller samples (e.g., for a single storm).
The trajectory-CLIPER (TCLP) model is an alternative to the CLIPER and SHIFOR models for providing baseline track and intensity forecasts (DeMaria, personal communication). The input to TCLP [Julian Day, initial latitude, longitude, maximum wind, and the time tendencies of position and intensity] is the same as for CLIPER/SHIFOR but rather than using linear regression to predict the future latitude, longitude and maximum wind, a trajectory approach is used. For track, a monthly climatology of observed storm motion vectors was developed from a 1982-2011 sample. The TCLP storm track is determined from a trajectory of the climatological motion vectors starting at the initial date and position of the storm. The climatological motion vector is modified by the current storm motion vector, where the influence of the current motion vector decreases with time during the forecast. A similar approach is taken for intensity, except that the intensity tendency is 7 On very rare occasions, operational CLIPER or SHIFOR runs are missing from forecast databases. To ensure a completely homogeneous verification, post-season retrospective runs of the skill benchmarks are made using operational inputs. Furthermore, if a forecaster makes multiple estimates of the storm’s initial motion, location, etc., over the course of a forecast cycle, then these retrospective skill benchmarks may differ slightly from the operational CLIPER/SHIFOR runs that appear in the forecast database.
2015 Hurricane Season 6
estimated from the logistic growth equation model with climatological input. Similar to track, the climatological intensity tendency is modified by the observed tendency, where the influence decreases with forecast time. The track used for the TCLP intensity forecast is the TCLP track forecast. When the storm track crosses land, the intensity is decreased at a climatological decay rate. A comparison of a 10-yr sample of TCLP errors with those from CLIPER5 and DSHIFOR5 shows that the average track and intensity errors of the two baselines are within 10% of each other at all forecast times out to five days for the Atlantic and eastern North Pacific. One advantage of TCLP over CLIPER5/DSHIFOR5 is that TCLP can be run to any desired forecast time.
NHC also issues forecasts of the size of tropical cyclones; these “wind radii” forecasts are estimates of the maximum extent of winds of various thresholds (34, 50, and 64 kt) expected in each of four quadrants surrounding the cyclone. Unfortunately, there is insufficient surface wind information to allow the forecaster to accurately analyze the size of a tropical cyclone’s wind field. As a result, post-storm best track wind radii are likely to have errors so large as to render a verification of official radii forecasts unreliable and potentially misleading; consequently, no verifications of NHC wind radii are included in this report. In time, as our ability to measure the surface wind field in tropical cyclones improves, it may be possible to perform a meaningful verification of NHC wind radii forecasts.
Numerous objective forecast aids (guidance models) are available to help the NHC in the preparation of official track and intensity forecasts. Guidance models are characterized as either early or late, depending on whether or not they are available to the forecaster during the forecast cycle. For example, consider the 1200 UTC (12Z) forecast cycle, which begins with the 12Z synoptic time and ends with the release of an official forecast at 15Z. The 12Z run of the National Weather Service/Global Forecast System (GFS) model is not complete and available to the forecaster until about 16Z, or about an hour after the NHC forecast is released. Consequently, the 12Z GFS would be considered a late model since it could not be used to prepare the 12Z official forecast. This report focuses on the verification of early models.
Multi-layer dynamical models are generally, if not always, late models. Fortunately, a technique exists to take the most recent available run of a late model and adjust its forecast to apply to the current synoptic time and initial conditions. In the example above, forecast data for hours 6-126 from the previous (06Z) run of the GFS would be smoothed and then adjusted, or shifted, such that the 6-h forecast (valid at 12Z) would match the observed 12Z position and intensity of the tropical cyclone. The adjustment process creates an “early” version of the GFS model for the 12Z forecast cycle that is based on the most current available guidance. The adjusted versions of the late models are known, mostly for historical reasons, as interpolated models8. The adjustment algorithm is invoked as long as the most recent available late model is not more than 12 h old, e.g., a 00Z late model could be used to form an interpolated model for
8 When the technique to create an early model from a late model was first developed, forecast output from the late models was available only at 12 h (or longer) intervals. In order to shift the late model’s forecasts forward by 6 hours, it was necessary to first interpolate between the 12 h forecast values of the late model – hence the designation “interpolated”.

2015 Hurricane Season 7
the subsequent 06Z or 12Z forecast cycles, but not for the subsequent 18Z cycle. Verification procedures here make no distinction between 6 and 12 h interpolated models.9
A list of models is given in Table 1. In addition to their timeliness, models are characterized by their complexity or structure; this information is contained in the table for reference. Briefly, dynamical models forecast by solving the physical equations governing motions in the atmosphere. Dynamical models may treat the atmosphere either as a single layer (two-dimensional) or as having multiple layers (three-dimensional), and their domains may cover the entire globe or be limited to specific regions. The interpolated versions of dynamical model track and intensity forecasts are also sometimes referred to as dynamical models. Statistical models, in contrast, do not consider the characteristics of the current atmosphere explicitly but instead are based on historical relationships between storm behavior and various other parameters. Statistical-dynamical models are statistical in structure but use forecast parameters from dynamical models as predictors. Consensus models are not true forecast models per se, but are merely combinations of results from other models. One way to form a consensus is to simply average the results from a collection (or “ensemble”) of models, but other, more complex techniques can also be used. The FSU “super-ensemble”, for example, combines its individual components on the basis of past performance and attempts to correct for biases in those components (Williford et al. 2003). A consensus model that considers past error characteristics can be described as a “weighted” or “corrected” consensus. Additional information about the guidance models used at the NHC can be found at http://www.nhc.noaa.gov/modelsummary.shtml.
The verifications described in this report are based on forecast and best track data sets taken from the Automated Tropical Cyclone Forecast (ATCF) System10 on 4 February 2016 for the Atlantic basin, and on 17 February 2016 for the eastern North Pacific basin. Verifications for the Atlantic and eastern North Pacific basins are given in Sections 2 and 3 below, respectively. Section 4 discusses NHC’s probabilistic genesis forecasts. Section 5 summarizes the key findings of the 2015 verification and previews anticipated changes for 2016.
2. Atlantic Basin
a. 2015 season overview – Track
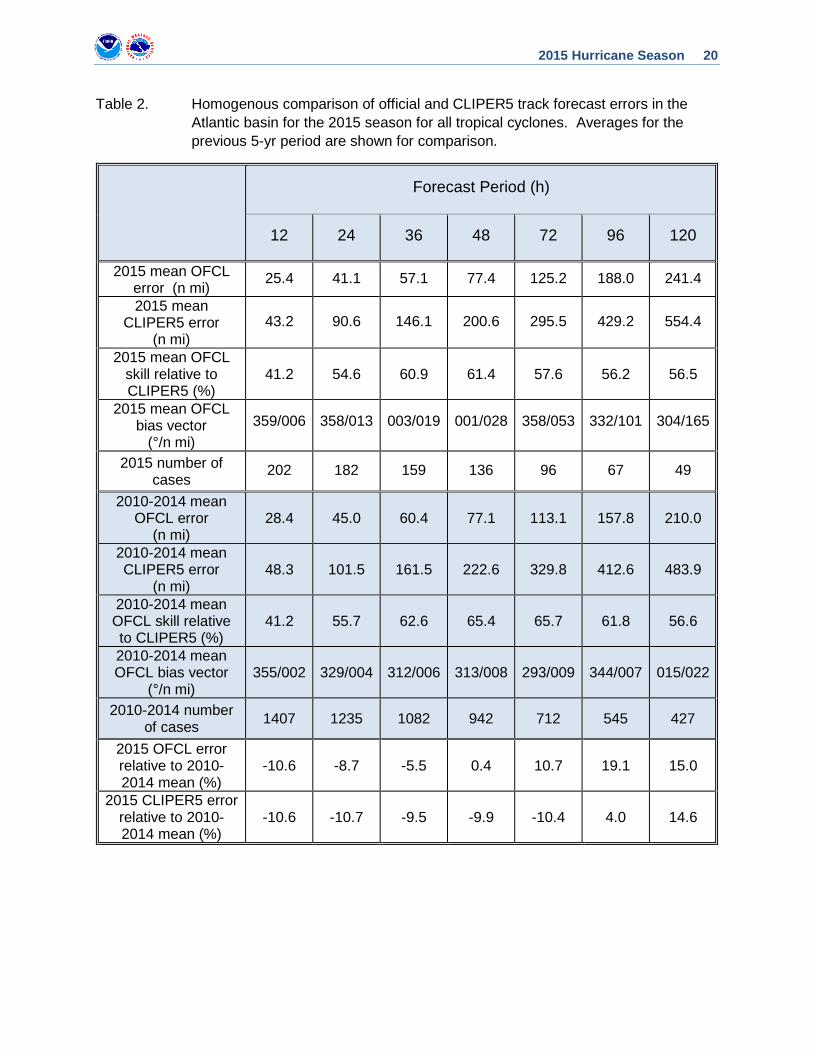
Figure 1 and Table 2 present the results of the NHC official track forecast verification for the 2015 season, along with results averaged for the previous 5-yr period, 2010-2014. In 2015, the NHC issued 222 Atlantic basin tropical cyclone forecasts11, a number well below the previous 5-yr average of 317 (Fig. 2) Mean track errors ranged from 25 n mi at 12 h to 241 n mi at 120 h. It is seen that the mean official track forecast errors in 2015 were slightly smaller than the previous 5-yr means from 12 to 36 h, near the 5-yr mean at 48 h, and higher than the 5-yr means from 72
9 The UKM and EMX models are only available through 120 h twice a day (at 0000 and 1200 UTC). Consequently, roughly half the interpolated forecasts from these models are 12 h old. 10 In ATCF lingo, these are known as the “a decks” and “b decks”, respectively. 11 This count does not include forecasts issued for systems later classified to have been something other than a tropical cyclone at the forecast time.

2015 Hurricane Season 8
to 120 h. The season’s storms were about of average difficulty to forecast from 12 to 48 h, but were a little more difficult to forecast than average from 72 to 120 h. No records for accuracy were set in 2015. The official track forecast vector biases were small through 48 h, but increased beyond that time and were generally northwestward at 96 and 120 h (i.e., the official forecast tended to fall to the northwest of the verifying position). These biases at the longer range forecast times were largely dominated by forecasts made for Hurricane Joaquin, which accounted for a little more than one-third of the total sample at 96 and 120 h. Track forecast skill ranged from 41% at 12 h to 61% at 48 h (Table 2). The track errors in 2015 increased from the 2014 values (except at 120 h), but over the past 20-25 yr, 24−72-h track forecast errors have been reduced by about 70% (Fig. 3). Track forecast error reductions of about 50% have occurred over the past 10-15 yr for the 96- and 120-h forecast periods. On average, the NHC track errors steadily decrease as the initial intensity of a cyclone increases (Fig. 4).
Note that the mean official error in Fig. 1 is not precisely zero at 0 h (the analysis time). This non-zero difference between the operational analysis of storm location and best track location, however, is not properly interpreted as “analysis error”. The best track is a subjectively smoothed representation of the storm history over its lifetime, in which the short-term variations in position or intensity that cannot be resolved in a 6-hourly time series are deliberately removed. Thus the location of a strong hurricane with a well-defined eye might be known with great accuracy at 1200 UTC, but the best track may indicate a location elsewhere by 5-10 miles or more if the precise location of the cyclone at 1200 UTC was unrepresentative. Operational analyses tend to follow the observed position of the storm more closely than the best track analyses, since it is more difficult to determine unrepresentative behavior in real time. Consequently, the t=0 “errors” shown in Fig. 1 contain both true analysis error and representativeness error.
Table 3a presents a homogeneous12 verification for the official forecast along with a selection of early models for 2015. In order to maximize the sample size, a guidance model had to be available at least two-thirds of the time at both 48 and 120 h to be included in this comparison. The performance of the official forecast and the early track models in terms of skill are presented in Fig. 5. Note that the sample becomes small (around 50 cases or less) at 96 h and beyond. The figure shows that the official forecasts were highly skillful, and near or slightly better than the accuracy of the consensus aids TVCA and FSSE. EMXI was the most skillful model, and the only aid that consistently beat the official forecasts. The strong performance of EMXI was boosted by its correct predictions of Hurricane Joaquin’s moving southwestward near the Bahamas and then away from the United States. GFSI was a good performer (second best individual model) and had skill values just below the official forecast and consensus aids. AEMI, EGRI, and HWFI were not quite as skillful and made up the the next tier of models. GHMI, CMCI, NVGI, and GFNI were the poorest-preforming dynamical models. An evaluation over the three years 2013-15 (Fig. 6) indicates that FSSE and TVCA are the best-performing models through 48 h, however, EMXI is the most skillful model from 72 to 120 h. The official forecast has skill that is quite close to the best aids throughout the forecast perod. GFSI, AEMI, EGRI, and HWFI were strong performers and were the next best models. GHMI and CMCI performed less well.
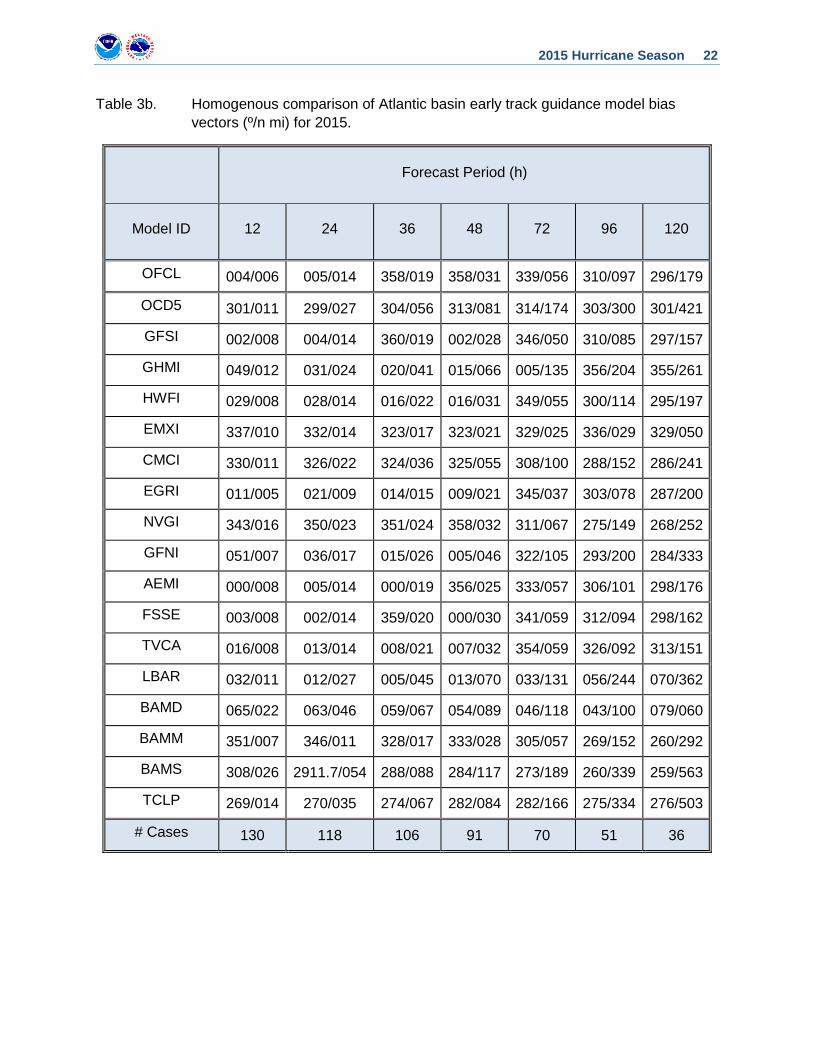
Vector biases of the guidance models for 2015 are given in Table 3b. The table shows that the official forecast had similar biases to TVCA, FSSE, and GFSI. Most of the guidance, like 12 Verifications comparing different forecast models are referred to as homogeneous if each model is verified over an identical set of forecast cycles. Only homogeneous model comparisons are presented in this report.
2015 Hurricane Season 9
the official forecast, had a large northwest bias at 96 and 120 h primarily due to the poor predictions of Hurricane Joaquin when it was located near the Bahamas.
A separate homogeneous verification of the primary consensus models for 2015 is shown in Fig. 7. The figure shows that the skill of the consensus aids were similar to one another for the short lead times, but GFEX (consensus of GFSI and EMXI) was the most skillful model at 48 h and beyond. The second best performer was TVCX, which uses the members of TVCA but gives EMXI double weight. AEMI had less skill than the other consensus aids. An examination of AEMI over the past few years (not shown) indicates that the ensemble mean has become increasingly skillful in the Atlantic basin, and it is even more skillful than the GFS deterministic run at 96 and 120 h.
Atlantic basin 48-h official track error, evaluated for all tropical cyclones, is a forecast measure tracked under the Government Performance and Results Act of 1993 (GPRA). In 2015, the GPRA goal was 77 n mi and the verification for this measure was 77.4 n mi.
b. 2015 season overview – Intensity Figure 8 and Table 4 present the results of the NHC official intensity forecast verification for the 2015 season, along with results averaged for the preceding 5-yr period. Mean forecast errors in 2015 ranged from 5 kt at 12 h to about 20 kt at 120 h. These errors were below the 5-yr means from 12 to 48 h, but above the 5-yr means beyond 48 h. Records for accuracy were set at 12 and 24 h. The official forecasts had a slight low bias from 12 to 72 h, and a slight high bias at 96 and 120 h. Decay-SHIFOR5 errors were close to their 5-yr means from 12 to 36 h, but much larger than average at the other forecast times. Although larger-than-average Decay-SHIFOR5 errors can sometimes imply that the season’s storms were challegening, in this case that model’s large high biases at the latter forecast times suggest that the tropical cyclones in 2015 strengthened at a rate far less than climatology. This implies that the season’s storms were actually not more difficult than average to forecast since environmental conditions were generally hostile (and known to be so), and forecasters were more confident than normal in their intensity predictions. Figure 9 shows that the errors increased at all forecast times (except 12 h) in 2015, disrupting the decreasing error trend that began at the start of the decade. Over the long term there has been a slight decrease in error, and forecasts in this decade, on average, have been more skillful than those from the previous one. In 2015, skill was at or near an all time high at 24 and 48 h. Skill values beyond 48 h, however, have decreased from record levels set a couple of years ago.
Table 5a presents a homogeneous verification for the official forecasts and the primary early intensity models for 2015. Intensity biases are given in Table 5b, and forecast skill is presented in Fig. 10. The official forecasts were quite skillful at all times, and were near or better than the top models. The most accurate intensity models in 2015 were FSSE, DSHP, LGEM, and HWFI. The performances of these models were quite similar to one another, and they occasionally outperformed the official forecasts from 36 to 96 h. IVCN was competitive with the top models from 12 to 72 h, but it trailed at the longer lead times likely due to the poor performance of GHMI, which is one of its members. GHMI had no skill at 96 and 120 h, with errors near 32 and 40 kt, respectively. GFNI was better than GHMI, but it was not competitive with the best models. The top-performing global models, GFSI and EMXI, were included in the intensity

2015 Hurricane Season 10
verification for completeness, although they are typically not considered by forecasters. GFSI and EMXI showed little skill through 72 h, but had skill values close to the better-performing models at the longer lead times. An inspection of the intensity biases (Table 5b) indicates that most of the models had a small low bias at the shorter lead times, but a more notable high bias at the longer lead times. HWFI had the smallest bias overall (less than 3 kt), while GHMI had a very large (21 kt) high bias at 120 h. An evaluation over the three years 2013-15 (Fig. 11) indicates that the official forecasts have been performing better than all of the guidance. Similar to 2015, the top models for the 3-yr sample are FSSE, IVCN, HWFI, DSHP, and LGEM, which all have similar skill levels.
The 48-h official intensity error, evaluated for all tropical cyclones, is another GPRA measure for the NHC. In 2015, the GPRA goal was 12 kt and the verification for this measure was 11.4 kt. This was the fifth time in eight years that the intensity goal was met.
c. Verifications for individual storms Forecast verifications for individual storms are given in Table 6. Of note are the large track errors for Hurricane Joaquin, which were more than double the long-term mean at 96 and 120 h. The primary reason for the higher than average errors for this storm was that the official forecasts did not anticipate the southwestward motion of the cyclone over the Bahamas and some forecasts incorrectly showed a track too far west near the United States. Conversely, the official track forecast errors were quite low for Hurricane Danny and Tropical Storm Ida. The track errors for those storms where about 20-30% lower than the long-term mean at all forecast times. Figure 12 shows an illustration of the official track errors stratified by storm.
Regarding intensity forecast errors, Hurricane Danny was one of the more challenging cyclones to predict in 2015. The official intensity forecasts were greater than the long-term mean at all forecast times and more than twice the 5-yr averages at 96 and 120 h. The primary reason for the higher than average errors for Danny was because the official forecasts failed to predict the rapid intensification, peak intensity, and rapid weakening that ensued shortly after Danny had reached its peak intensity. Conversely, official intensity errors were very low for Tropical Depression Nine as forecasts correctly anticipated that the cyclone would not strengthen due to hostile environmental conditions. Figure 13 shows an illustration of the official intensity errors stratified by storm. Additional discussion on forecast performance for individual storms can be found in NHC Tropical Cyclone Reports available at http://www.nhc.noaa.gov/data/tcr/index.php?season=2015&basin=atl
3. Eastern North Pacific Basin
a. 2015 season overview – Track The NHC track forecast verification for the 2015 season in the eastern North Pacific, along with results averaged for the previous 5-yr period is presented in Figure 14 and Table 7. There were 362 forecasts issued for the eastern Pacific basin in 2015, although only 127 of these verified at 120 h. This level of forecast activity is slightly above average (Fig. 15). Mean track errors

2015 Hurricane Season 11
ranged from 26 n mi at 12 h to 154 n mi at 120 h. These errors were higher than the 5-yr means from 12 to 36 h, but lower than the 5-yr means from 72 to 120 h. No records for accuracy were set in 2015. CLIPER5 errors were a little higher than their long-term means for the short lead times, but much lower than the means from 72 to 120 h. The official track forecast vector biases were small through 36 h, but increased beyond that time and were generally northeastward or east-northeastward from 48 to120 h.
Figure 16 shows recent trends in track forecast accuracy and skill for the eastern North Pacific. Although the 2015 errors changed little from the 2014 values, the long-term trend is quite pronounced. Errors have been reduced by roughly 60% for the 24 to 72 h forecasts since 1990. Similar improvements have been made for the 96 and 120 h forecasts since 2001. Forecast skill in 2015 decreased from record values in 2014, but the overall trend shows a significant increase in skill.
Table 8a presents a homogeneous verification for the official forecast and the early track models for 2015, with vector biases of the guidance models given in Table 8b. Skill comparisons of selected models are shown in Fig. 17. The official forecasts were very skillful, and were only slightly beat by TVCE and by FSSE at 12 and 24 h. EMXI was the best individual model, but it had less skill than TVCE/FSSE and the official forecasts. GSFI, HWFI, and AEMI made up the second tier of models, and EGRI and GHMI had similar skill levels except for the longer leads where they trailed. GFNI, NVGI, and CMCI were the poorest-performing dynamical models and were beat by the simple BAMM model beyond 48 h.
A separate verification of the primary consensus aids is given in Figure 18. The skill of the consensus models was tightly clustered with TVCX slightly outperforming TVCE. GFEX had a little less skill than TVCE/TVCX, except for the longer leads where it was superior. FSSE was not far behind, and AEMI was the least skillful of the consensus aids shown.
b. 2015 season overview – Intensity
Figure 19 and Table 9 present the results of the NHC eastern North Pacific intensity forecast verification for the 2015 season, along with results averaged for the preceding 5-yr period. Mean forecast errors were 7 kt at 12 h and increased to 16 kt at 72 h. The errors were a little higher than the 5-yr means at most forecast time periods. The Decay-SHIFOR5 forecast errors were also higher than their 5-yr means, indicative that the season’s storms were more difficult than normal to predict. A review of error and skill trends (Fig. 20) indicates that although there is considerable year-to-year variability in intensity errors, there has been a slight decrease in error over the past 20-25 yr at 48 h and beyond. No trend is apparent for 24 h. Forecast skill increased in 2015, and it was at or near all time highs at 48 h and beyond. Intensity forecast biases were low for all lead times.
Figure 21 and Table 10a present a homogeneous verification for the primary early intensity models for 2015. Forecast biases are given in Table 10b. The official forecasts performed as good as or better than all of the guidance. In fact, the only model that had lower errors was FSSE at 24 and 36 h, but that model trailed at longer lead times. IVCN was a strong performer for all forecast periods, but it had slightly less skill than the official forecasts. HWFI, DSHP, and LGEM made up the next tier of models and were about equally skillful. GHMI, GFNI, and GFSI had little

2015 Hurricane Season 12
skill and were not competitive, and EMXI was not skillful at any forecast time. Nearly all of the models suffered from a low bias in 2015, with GHMI and GFNI having the most significant bias of about 20 kt at 36 and 48 h. It should be noted that the official forecast bias was lower than the guidance.
c. Verifications for individual storms
Forecast verifications for individual storms are given for reference in Table 11. Additional discussion on forecast performance for individual storms can be found in NHC Tropical Cyclone Reports available at http://www.nhc.noaa.gov/data/tcr/index.php?season=2015&basin=epac.
4. Genesis Forecasts
The NHC routinely issues Tropical Weather Outlooks (TWOs) for both the Atlantic and eastern North Pacific basins. The TWOs are text products that discuss areas of disturbed weather and their potential for tropical cyclone development. Since 2007, forecasters subjectively assigned a probability of genesis (0 to 100%, in 10% increments) to each area of disturbed weather described in the TWO, where the assigned probabilities represented the forecaster’s determination of the chance of tropical cyclone formation during the 48 h period following the nominal TWO issuance time. In 2009, the NHC began producing in-house (non-public) experimental probabilistic tropical cyclone forecasts out to 120 h, which became public in August of 2013. Verification is based on NHC best-track data, with the time of genesis defined to be the first tropical cyclone point appearing in the best track.
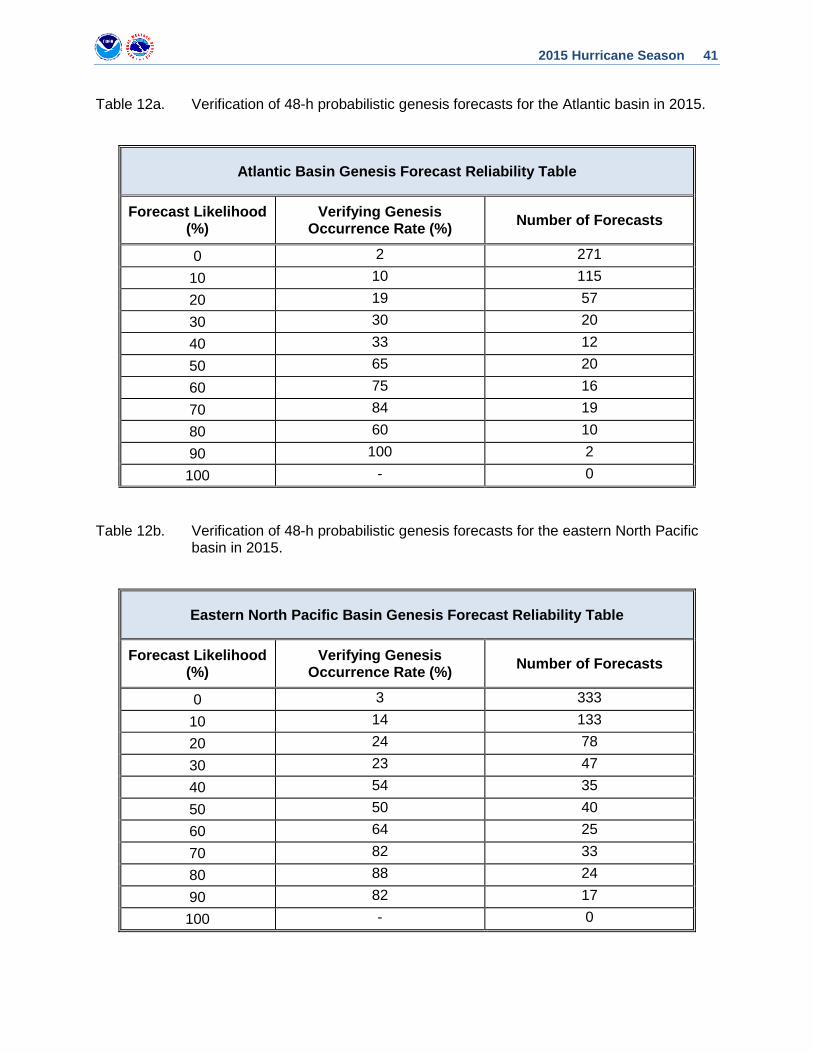
Verifications of the 48-h outlook for the Atlantic and eastern North Pacific basins for 2015 are given in Table 12 and illustrated in Fig. 22. In the Atlantic basin, a total of 542 genesis forecasts were made. These 48-h forecasts were quite reliable for the low probabilities but exhibited a slight under-forecast (low) bias in the medium probabilities. The sample is too small at the high probabilities to draw meaningful conclusions. In the eastern Pacific, a total of 765 genesis forecasts were made. The forecasts were well calibrated and much improved from previous years.
Verification of the 120-h outlook for the Atlantic and eastern North Pacific basins for 2015 are given in Table 13 and illustrated in Fig. 23. In the Atlantic basin, the 120-h forecasts were well calibrated from 0 to 40%, but, in general, a low bias existed at probabilities greater than 40%. In the eastern North Pacific, a slight low bias exists at most probabilities. The diagrams also show the refinement distribution, which indicates how often the forecasts deviated from (a perceived) climatology. Sharp peaks at climatology indicate low forecaster confidence, while maxima at the extremes indicate high confidence; the refinement distributions shown here suggest an intermediate level of forecaster confidence.
2015 Hurricane Season 13
5. Looking Ahead to 2016
a. Track Forecast Cone Sizes
The National Hurricane Center track forecast cone depicts the probable track of the center of a tropical cyclone, and is formed by enclosing the area swept out by a set of circles along the forecast track (at 12, 24, 36 h, etc.). The size of each circle is set so that two-thirds of historical official forecast errors over the most-recent 5-yr sample fall within the circle. The circle radii defining the cones in 2016 for the Atlantic and eastern North Pacific basins (based on error distributions for 2011-15) are given in Table 14. In the Atlantic basin, the cone circles will be slightly smaller (by up to 7 %) at all forecast time periods except 120 h, where the cone circle will be 5 % larger. In the eastern Pacific basin, the cone circles will change little except at 96 and 120 h where they will be slightly smaller .
b. Consensus Models
In 2008, NHC changed the nomenclature for many of its consensus models. The new system defines a set of consensus model identifiers that remain fixed from year to year. The specific members of these consensus models, however, will be determined at the beginning of each season and may vary from year to year.
Some consensus models require all of their member models to be available in order to compute the consensus (e.g., TCOA), while others are less restrictive, requiring only two or more members to be present (e.g., TVCA). The terms “fixed” and “variable” can be used to describe these two approaches, respectively. In a variable consensus model, it is often the case that the 120 h forecast is based on a different set of members than the 12 h forecast. While this approach greatly increases availability, it does pose consistency issues for the forecaster.
The consensus model composition for 2016 is given in Table 15. The 2016 consensus model composition for TVCA, TVCE, and IVCN have been modified to include the regional model COAMPS-TC using the GFS initial and lateral boundary conditions (CTCI). CTCI has been a strong performer for track and intensity of tropical cyclones for both the Atlantic and east Pacific basins during the past few years, and it has had similar skill levels to the best performing track and intensity models during that time (not shown).
Acknowledgments The authors gratefully acknowledge Michael Brennan, Monica Bozeman, and Craig
Mattocks of NHC, managers of the NHC forecast databases.

2015 Hurricane Season 14
6. References Aberson, S. D., 1998: Five-day tropical cyclone track forecasts in the North Atlantic basin.
Wea. Forecasting, 13, 1005-1015.
DeMaria, M., J. A. Knaff, and J. Kaplan, 2006: On the decay of tropical cyclone winds crossing narrow landmasses, J. Appl. Meteor., 45, 491-499.
Jarvinen, B. R., and C. J. Neumann, 1979: Statistical forecasts of tropical cyclone intensity for the North Atlantic basin. NOAA Tech. Memo. NWS NHC-10, 22 pp.
Knaff, J.A., M. DeMaria, B. Sampson, and J.M. Gross, 2003: Statistical, five-day tropical cyclone intensity forecasts derived from climatology and persistence. Wea. Forecasting, 18, 80-92.
Neumann, C. B., 1972: An alternate to the HURRAN (hurricane analog) tropical cyclone forecast system. NOAA Tech. Memo. NWS SR-62, 24 pp.
Williford, C.E., T. N. Krishnamurti, R. C. Torres, S. Cocke, Z. Christidis, and T. S. V. Kumar, 2003: Real-Time Multimodel Superensemble Forecasts of Atlantic Tropical Systems of 1999. Mon. Wea. Rev., 131, 1878-1894.

2015 Hurricane Season 15
List of Tables
1. National Hurricane Center forecasts and models.
2. Homogenous comparison of official and CLIPER5 track forecast errors in the Atlantic basin for the 2015 season for all tropical cyclones.
3. (a) Homogenous comparison of Atlantic basin early track guidance model errors (n mi) for 2015. (b) Homogenous comparison of Atlantic basin early track guidance model bias vectors (º/n mi) for 2015.
4. Homogenous comparison of official and Decay-SHIFOR5 intensity forecast errors in the Atlantic basin for the 2015 season for all tropical cyclones.
5. (a) Homogenous comparison of Atlantic basin early intensity guidance model errors (kt) for 2015. (b) Homogenous comparison of a selected subset of Atlantic basin early intensity guidance model errors (kt) for 2015. (c) Homogenous comparison of a selected subset of Atlantic basin early intensity guidance model biases (kt) for 2015.
6. Official Atlantic track and intensity forecast verifications (OFCL) for 2015 by storm.
7. Homogenous comparison of official and CLIPER5 track forecast errors in the eastern North Pacific basin for the 2015 season for all tropical cyclones.
8. (a) Homogenous comparison of eastern North Pacific basin early track guidance model errors (n mi) for 2015. (b) Homogenous comparison of eastern North Pacific basin early track guidance model bias vectors (º/n mi) for 2015.
9. Homogenous comparison of official and Decay-SHIFOR5 intensity forecast errors in the eastern North Pacific basin for the 2015 season for all tropical cyclones.
10. (a) Homogenous comparison of eastern North Pacific basin early intensity guidance model errors (kt) for 2015. (b) Homogenous comparison of eastern North Pacific basin early intensity guidance model biases (kt) for 2015.
11. Official eastern North Pacific track and intensity forecast verifications (OFCL) for 2015 by storm.
12. Verification of 48-h probabilistic genesis forecasts for (a) the Atlantic and (b) eastern North Pacific basins for 2015.
13. Verification of 120-h probabilistic genesis forecasts for (a) the Atlantic and (b) eastern North Pacific basins for 2015.
14. NHC forecast cone circle radii (n mi) for 2015. Change from 2015 values in n mi and percent are given in parentheses.
15. Composition of NHC consensus models for 2015. It is intended that TCOA/TVCA would be the primary consensus aids for the Atlantic basin and TCOE/TVCE would be primary for the eastern Pacific.

2015 Hurricane Season 16
Table 1. National Hurricane Center forecasts and models.
ID Name/Description Type Timeliness
(E/L) Parameters
forecast
OFCL Official NHC forecast Trk, Int
GFDL NWS/Geophysical Fluid Dynamics Laboratory model
Multi-layer regional dynamical L Trk, Int
HWRF Hurricane Weather and Research Forecasting Model
Multi-layer regional dynamical L Trk, Int
GFSO NWS/Global Forecast System (formerly Aviation)
Multi-layer global dynamical L Trk, Int
AEMN GFS ensemble mean Consensus L Trk, Int
UKM United Kingdom Met Office model, automated tracker
Multi-layer global dynamical L Trk, Int
EGRR United Kingdom Met Office
model with subjective quality control applied to the tracker
Multi-layer global dynamical L Trk, Int
NVGM Navy Global Environmental Model
Multi-layer global dynamical L Trk, Int
GFDN Navy version of GFDL Multi-layer regional dynamical L Trk, Int
CMC Environment Canada global model
Multi-level global dynamical L Trk, Int
NAM NWS/NAM Multi-level regional dynamical L Trk, Int
CTX COAMPS-TC using GFS initial and boundary conditions
Multi-layer regional dynamical L Trk, Int
EMX ECMWF global model Multi-layer global dynamical L Trk, Int

2015 Hurricane Season 17
ID Name/Description Type Timeliness
(E/L) Parameters
forecast
EEMN ECMWF ensemble mean Consensus L Trk
BAMS Beta and advection model (shallow layer) Single-layer trajectory E Trk
BAMM Beta and advection model (medium layer) Single-layer trajectory E Trk
BAMD Beta and advection model
(deep layer) Single-layer trajectory E Trk
LBAR Limited area barotropic model Single-layer regional dynamical E Trk
CLP5 CLIPER5 (Climatology and Persistence model) Statistical (baseline) E Trk
SHF5 SHIFOR5 (Climatology and Persistence model) Statistical (baseline) E Int
DSF5 DSHIFOR5 (Climatology and Persistence model) Statistical (baseline) E Int
OCD5 CLP5 (track) and DSF5 (intensity) models merged Statistical (baseline) E Trk, Int
TCLP Trajectory-CLIPER model Statistical (baseline) E Trk, Int
SHIP Statistical Hurricane Intensity Prediction Scheme (SHIPS) Statistical-dynamical E Int
DSHP SHIPS with inland decay Statistical-dynamical E Int
OFCI Previous cycle OFCL, adjusted Interpolated E Trk, Int
GFDI Previous cycle GFDL, adjusted
Interpolated-dynamical E Trk, Int

2015 Hurricane Season 18
ID Name/Description Type Timeliness
(E/L) Parameters
forecast
GHMI
Previous cycle GFDL, adjusted using a variable
intensity offset correction that is a function of forecast time. Note that for track, GHMI and
GFDI are identical.
Interpolated-dynamical E Trk, Int
HWFI Previous cycle HWRF, adjusted
Interpolated-dynamical E Trk, Int
CTCI Previous cycle CTCX, adjusted
Interpolated-dynamical E Trk, Int
GFSI Previous cycle GFS, adjusted Interpolated-dynamical E Trk, Int
UKMI Previous cycle UKM, adjusted Interpolated-dynamical E Trk, Int
EGRI Previous cycle EGRR, adjusted
Interpolated-dynamical E Trk, Int
NVGI Previous cycle NVGM, adjusted
Interpolated-dynamical E Trk, Int
GFNI Previous cycle GFDN, adjusted
Interpolated-dynamical E Trk, Int
EMXI Previous cycle EMX, adjusted Interpolated-dynamical E Trk, Int
CMCI Previous cycle CMC, adjusted Interpolated-dynamical E Trk, Int
GUNA Average of GFDI, EGRI, and GFSI Consensus E Trk
CGUN Version of GUNA corrected for model biases Corrected consensus E Trk

2015 Hurricane Season 19
ID Name/Description Type Timeliness
(E/L) Parameters
forecast
AEMI Previous cycle AEMN, adjusted Consensus E Trk, Int
FSSE FSU Super-ensemble Corrected consensus E Trk, Int
GFEX Average of GFSI and EMXI Consensus E Trk
TCON Average of GHMI, EGRI, GFSI, and HWFI Consensus E Trk
TCCN Version of TCON corrected for model biases Corrected consensus E Trk
TVCN Average of at least two of GFSI EGRI GHMI HWFI EMXI Consensus E Trk
TVCA Average of at least two of GFSI EGRI GHMI HWFI EMXI Consensus E Trk
TVCE Average of at least two of GFSI EGRI GHMI HWFI EMXI Consensus E Trk
TVCX EMXI and average of at least
two of GFSI EGRI GHMI HWFI EMXI
Consensus E Trk
TVCC Version of TVCN corrected for model biases Corrected consensus E Trk
ICON Average of DSHP, LGEM, GHMI, and HWFI Consensus E Int
IVCN Average of at least two of DSHP LGEM GHMI HWFI
GFNI Consensus E Int
2015 Hurricane Season 20
Table 2. Homogenous comparison of official and CLIPER5 track forecast errors in the Atlantic basin for the 2015 season for all tropical cyclones. Averages for the previous 5-yr period are shown for comparison.
Forecast Period (h)
12 24 36 48 72 96 120
2015 mean OFCL error (n mi) 25.4 41.1 57.1 77.4 125.2 188.0 241.4
2015 mean CLIPER5 error
(n mi) 43.2 90.6 146.1 200.6 295.5 429.2 554.4
2015 mean OFCL skill relative to CLIPER5 (%)
41.2 54.6 60.9 61.4 57.6 56.2 56.5
2015 mean OFCL bias vector
(°/n mi) 359/006 358/013 003/019 001/028 358/053 332/101 304/165
2015 number of cases 202 182 159 136 96 67 49
2010-2014 mean OFCL error
(n mi) 28.4 45.0 60.4 77.1 113.1 157.8 210.0
2010-2014 mean CLIPER5 error
(n mi) 48.3 101.5 161.5 222.6 329.8 412.6 483.9
2010-2014 mean OFCL skill relative to CLIPER5 (%)
41.2 55.7 62.6 65.4 65.7 61.8 56.6
2010-2014 mean OFCL bias vector
(°/n mi) 355/002 329/004 312/006 313/008 293/009 344/007 015/022
2010-2014 number of cases 1407 1235 1082 942 712 545 427
2015 OFCL error relative to 2010-2014 mean (%)
-10.6 -8.7 -5.5 0.4 10.7 19.1 15.0
2015 CLIPER5 error relative to 2010-2014 mean (%)
-10.6 -10.7 -9.5 -9.9 -10.4 4.0 14.6

2015 Hurricane Season 21
Table 3a. Homogenous comparison of Atlantic basin early track guidance model errors (n mi) for 2015. Errors smaller than the NHC official forecast are shown in bold-face.
Forecast Period (h)
Model ID 12 24 36 48 72 96 120
OFCL 25.6 40.4 56.6 74.1 114.7 154.9 220.2
OCD5 45.1 96.8 163.0 216.6 309.4 456.1 641.5
GFSI 28.9 45.1 63.0 82.8 126.9 185.6 288.4
GHMI 32.3 55.2 78.0 104.3 184.5 313.9 419.6
HWFI 30.8 51.8 76.2 98.8 165.3 255.4 389.9
EMXI 26.5 40.2 53.1 59.9 81.9 113.8 142.9
CMCI 32.4 55.6 85.8 115.6 210.4 297.8 369.5
EGRI 28.2 46.5 66.1 87.0 146.0 215.1 361.8
NVGI 35.8 59.9 88.7 121.0 226.2 335.9 433.5
GFNI 34.1 58.2 87.7 117.0 211.6 347.0 447.6
AEMI 28.4 45.9 67.5 89.3 149.5 210.7 291.3
FSSE 25.6 39.1 54.9 71.5 119.8 172.1 247.6
TVCA 25.7 39.4 54.5 71.0 115.1 174.0 256.8
LBAR 40.9 76.8 120.9 163.0 268.0 384.0 468.1
BAMD 43.5 85.2 130.0 177.2 267.1 372.0 512.8
BAMM 37.1 69.7 104.4 135.7 210.8 311.8 469.9
BAMS 48.2 92.5 140.1 180.5 280.1 440.5 693.7
TCLP 46.3 100.4 170.7 221.5 309.2 462.3 670.0
# Cases 130 118 106 91 70 51 36
2015 Hurricane Season 22
Table 3b. Homogenous comparison of Atlantic basin early track guidance model bias vectors (º/n mi) for 2015.
Forecast Period (h)
Model ID 12 24 36 48 72 96 120
OFCL 004/006 005/014 358/019 358/031 339/056 310/097 296/179
OCD5 301/011 299/027 304/056 313/081 314/174 303/300 301/421
GFSI 002/008 004/014 360/019 002/028 346/050 310/085 297/157
GHMI 049/012 031/024 020/041 015/066 005/135 356/204 355/261
HWFI 029/008 028/014 016/022 016/031 349/055 300/114 295/197
EMXI 337/010 332/014 323/017 323/021 329/025 336/029 329/050
CMCI 330/011 326/022 324/036 325/055 308/100 288/152 286/241
EGRI 011/005 021/009 014/015 009/021 345/037 303/078 287/200
NVGI 343/016 350/023 351/024 358/032 311/067 275/149 268/252
GFNI 051/007 036/017 015/026 005/046 322/105 293/200 284/333
AEMI 000/008 005/014 000/019 356/025 333/057 306/101 298/176
FSSE 003/008 002/014 359/020 000/030 341/059 312/094 298/162
TVCA 016/008 013/014 008/021 007/032 354/059 326/092 313/151
LBAR 032/011 012/027 005/045 013/070 033/131 056/244 070/362
BAMD 065/022 063/046 059/067 054/089 046/118 043/100 079/060
BAMM 351/007 346/011 328/017 333/028 305/057 269/152 260/292
BAMS 308/026 2911.7/054 288/088 284/117 273/189 260/339 259/563
TCLP 269/014 270/035 274/067 282/084 282/166 275/334 276/503
# Cases 130 118 106 91 70 51 36

2015 Hurricane Season 23
Table 4. Homogenous comparison of official and Decay-SHIFOR5 intensity forecast errors in the Atlantic basin for the 2015 season for all tropical cyclones. Averages for the previous 5-yr period are shown for comparison.
Forecast Period (h)
12 24 36 48 72 96 120
2015 mean OFCL error (kt) 5.0 7.4 9.9 11.4 15.6 19.6 20.4 2015 mean Decay-SHIFOR5 error (kt) 6.7 10.3 13.8 18.1 23.5 27.5 29.2
2015 mean OFCL skill relative to Decay-SHIFOR5
(%) 25.4 28.2 28.3 37.0 33.6 28.7 30.1
2015 OFCL bias (kt) -1.6 -1.6 -1.6 -1.8 -1.1 0.9 4.7
2015 number of cases 202 182 159 136 96 67 49
2010-14 mean OFCL error (kt) 6.2 9.4 11.5 13.3 14.6 14.6 14.8
2010-14 mean Decay-SHIFOR5 error (kt) 7.3 10.8 13.3 15.3 17.7 17.8 17.6
2010-14 mean OFCL skill relative to Decay-SHIFOR5
(%) 15.1 13.0 13.5 13.1 17.5 18.0 15.9
2010-14 OFCL bias (kt) -0.6 0.0 0.6 1.3 1.3 1.3 1.7
2010-14 number of cases 1407 1235 1082 942 712 545 427
2015 OFCL error relative to 2010-14 mean (%) -19.4 -21.3 -13.9 -14.3 6.8 34.2 37.8
2015 Decay-SHIFOR5 error relative to 2010-14
mean (%) -8.2 -4.6 3.8 18.3 32.8 54.5 65.9

2015 Hurricane Season 24
Table 5a. Homogenous comparison of selected Atlantic basin early intensity guidance model errors (kt) for 2015. Errors smaller than the NHC official forecast are shown in boldface.
Forecast Period (h)
Model ID 12 24 36 48 72 96 120
OFCL 5.8 8.3 11.3 12.2 13.9 16.8 16.8
OCD5 7.5 11.0 15.4 19.7 22.7 25.7 29.7
HWFI 6.8 9.4 11.7 11.9 12.6 17.1 20.5
GHMI 7.8 11.8 15.3 16.6 20.7 31.6 40.2
GFNI 8.6 11.6 15.2 16.9 18.8 22.2 19.9
DSHP 7.0 9.6 12.2 13.6 13.4 16.2 20.7
LGEM 6.8 9.4 11.9 13.2 12.9 16.9 22.2
IVCN 6.6 9.2 11.6 12.5 13.5 18.9 24.9
FSSE 6.3 8.7 11.0 12.4 14.2 16.7 18.3
GFSI 8.0 11.8 16.0 18.8 20.6 20.4 19.4
EMXI 8.5 12.6 16.5 19.7 22.1 20.8 21.7
TCLP 7.3 11.2 15.5 19.5 22.9 25.3 27.0
# Cases 135 125 111 96 72 55 38

2015 Hurricane Season 25
Table 5b. Homogenous comparison of selected Atlantic basin early intensity guidance model biases (kt) for 2015. Biases smaller than the NHC official forecast are shown in boldface.
Forecast Period (h)
Model ID 12 24 36 48 72 96 120
OFCL -1.4 -0.4 -0.1 -0.1 1.7 5.5 6.8
OCD5 -1.2 1.6 3.4 5.3 6.9 13.2 15.9
HWFI -1.8 -1.0 -0.3 0.0 2.7 1.9 -0.9
GHMI -1.8 -0.9 0.3 1.4 6.6 13.2 20.8
GFNI -4.2 -4.7 -4.7 -5.1 -5.3 -7.7 -6.0
DSHP -1.9 -0.6 -0.1 0.4 0.9 4.2 4.8
LGEM -1.8 -0.4 0.5 1.7 3.1 6.5 6.8
IVCN -1.6 -0.4 0.4 1.1 3.6 6.7 8.3
FSSE -1.7 -0.5 -0.1 0.5 3.4 6.1 8.9
GFSI -2.8 -0.9 -0.1 0.3 2.3 6.7 5.5
EMXI -2.5 -1.2 0.0 0.7 4.4 10.9 19.7
TCLP -1.5 0.1 1.5 3.5 8.2 16.8 24.3
# Cases 135 125 111 96 72 55 38

2015 Hurricane Season 26
Table 6. Official Atlantic track and intensity forecast verifications (OFCL) for 2015 by storm. CLIPER5 (CLP5) and SHIFOR5 (SHF5) forecast errors are given for comparison and indicated collectively as OCD5. The number of track and intensity forecasts are given by NT and NI, respectively. Units for track and intensity errors are n mi and kt, respectively.
Verification statistics for: AL012015 ANA
VT (h) NT OFCL OCD5 NI OFCL OCD5 000 12 4.5 4.5 12 1.3 1.3 012 12 11.6 25.3 12 3.3 5.6 024 12 13.5 50.9 12 2.5 7.5 036 10 22.7 77.0 10 3.0 8.3 048 8 31.2 115.8 8 3.8 7.4 072 4 85.3 215.2 4 0.0 4.3 096 0 -999.0 -999.0 0 -999.0 -999.0 120 0 -999.0 -999.0 0 -999.0 -999.0
Verification statistics for: AL022015 BILL
VT (h) NT OFCL OCD5 NI OFCL OCD5 000 6 6.6 7.6 6 0.8 0.8 012 6 32.6 64.6 6 3.3 4.3 024 6 25.5 114.2 6 0.8 2.3 036 5 19.6 195.8 5 3.0 3.2 048 2 15.6 238.9 2 5.0 4.5 072 0 -999.0 -999.0 0 -999.0 -999.0 096 0 -999.0 -999.0 0 -999.0 -999.0 120 0 -999.0 -999.0 0 -999.0 -999.0
Verification statistics for: AL032015 CLAUDETTE
VT (h) NT OFCL OCD5 NI OFCL OCD5 000 6 4.9 4.9 6 3.3 2.5 012 4 45.4 36.3 4 0.0 5.0 024 2 94.2 103.5 2 2.5 18.0 036 0 -999.0 -999.0 0 -999.0 -999.0 048 0 -999.0 -999.0 0 -999.0 -999.0 072 0 -999.0 -999.0 0 -999.0 -999.0 096 0 -999.0 -999.0 0 -999.0 -999.0 120 0 -999.0 -999.0 0 -999.0 -999.0
Verification statistics for: AL042015 DANNY
VT (h) NT OFCL OCD5 NI OFCL OCD5 000 25 5.5 6.0 25 5.4 5.6 012 23 20.4 27.4 23 10.4 13.5 024 21 34.6 52.7 21 14.8 20.8 036 19 47.9 89.6 19 17.4 28.2 048 17 54.4 132.8 17 17.4 34.2 072 13 78.1 187.2 13 16.9 29.6 096 9 109.7 228.6 9 27.8 21.9 120 5 158.9 294.5 5 43.0 31.0

2015 Hurricane Season 27
Verification statistics for: AL052015 ERIKA
VT (h) NT OFCL OCD5 NI OFCL OCD5 000 15 7.9 8.1 15 0.7 0.7 012 13 29.0 33.1 13 4.6 4.5 024 11 57.8 43.7 11 6.4 7.0 036 9 81.0 70.6 9 7.2 8.8 048 7 91.2 98.2 7 7.9 9.3 072 3 118.5 166.0 3 15.0 21.7 096 0 -999.0 -999.0 0 -999.0 -999.0 120 0 -999.0 -999.0 0 -999.0 -999.0
Verification statistics for: AL062015 FRED
VT (h) NT OFCL OCD5 NI OFCL OCD5 000 31 4.1 4.1 31 1.0 1.1 012 29 19.0 29.4 29 3.4 6.4 024 27 30.6 50.0 27 6.7 10.0 036 25 39.5 80.4 25 8.6 13.7 048 23 45.9 112.8 23 7.6 17.1 072 19 68.3 196.1 19 7.9 23.6 096 15 87.9 297.4 15 6.3 33.8 120 11 104.1 411.6 11 6.4 29.0
Verification statistics for: AL072015 GRACE
VT (h) NT OFCL OCD5 NI OFCL OCD5 000 16 11.5 11.5 16 1.6 1.9 012 14 21.4 33.9 14 4.6 5.3 024 12 31.2 72.6 12 7.9 10.0 036 10 40.9 123.7 10 13.0 16.0 048 8 55.5 176.3 8 14.4 23.4 072 4 87.7 260.2 4 20.0 32.0 096 0 -999.0 -999.0 0 -999.0 -999.0 120 0 -999.0 -999.0 0 -999.0 -999.0
Verification statistics for: AL082015 HENRI
VT (h) NT OFCL OCD5 NI OFCL OCD5 000 10 13.0 13.2 10 7.5 7.5 012 8 24.3 47.0 8 4.4 4.9 024 6 48.5 101.2 6 3.3 3.5 036 4 84.9 147.2 4 5.0 6.5 048 2 129.5 156.7 2 10.0 15.0 072 0 -999.0 -999.0 0 -999.0 -999.0 096 0 -999.0 -999.0 0 -999.0 -999.0 120 0 -999.0 -999.0 0 -999.0 -999.0

2015 Hurricane Season 28
Verification statistics for: AL092015 NINE
VT (h) NT OFCL OCD5 NI OFCL OCD5 000 13 14.6 14.6 13 0.0 0.0 012 11 36.5 52.3 11 1.8 3.7 024 9 57.5 95.5 9 2.2 8.1 036 7 72.4 126.1 7 1.4 11.1 048 5 99.2 128.3 5 0.0 17.8 072 1 228.5 198.6 1 0.0 17.0 096 0 -999.0 -999.0 0 -999.0 -999.0 120 0 -999.0 -999.0 0 -999.0 -999.0
Verification statistics for: AL102015 IDA
VT (h) NT OFCL OCD5 NI OFCL OCD5 000 36 15.4 15.3 36 0.8 1.1 012 34 28.6 46.1 34 3.1 4.0 024 32 39.6 94.9 32 4.5 6.8 036 30 50.1 155.3 30 6.2 8.3 048 28 63.2 218.5 28 7.9 12.3 072 24 80.8 334.3 24 12.9 17.8 096 20 99.5 438.1 20 18.5 25.5 120 16 139.6 597.5 16 21.9 32.3
Verification statistics for: AL112015 JOAQUIN
VT (h) NT OFCL OCD5 NI OFCL OCD5 000 40 9.1 9.3 40 2.1 2.4 012 38 26.3 52.5 38 7.2 8.5 024 36 50.6 127.0 36 11.0 12.4 036 34 79.7 203.7 34 15.0 16.5 048 32 121.0 276.6 32 17.3 20.3 072 28 231.7 413.9 28 24.8 27.5 096 23 360.9 586.0 23 25.9 27.3 120 17 450.4 682.7 17 21.5 25.8
Verification statistics for: AL122015 KATE
000 12 4.1 4.1 12 4.2 4.2 012 10 34.8 98.7 10 5.5 7.4 024 8 65.6 263.1 8 8.8 9.4 036 6 110.9 474.0 6 11.7 11.7 048 4 197.4 750.6 4 18.8 14.3 072 0 -999.0 -999.0 0 -999.0 -999.0 096 0 -999.0 -999.0 0 -999.0 -999.0 120 0 -999.0 -999.0 0 -999.0 -999.0

2015 Hurricane Season 29
Table 7. Homogenous comparison of official and CLIPER5 track forecast errors in the eastern North Pacific basin in 2015 for all tropical cyclones. Averages for the previous 5-yr period are shown for comparison.
Forecast Period (h)
12 24 36 48 72 96 120
2015 mean OFCL error (n mi) 26.2 38.8 49.3 59.4 83.1 115.1 153.8
2015 mean CLIPER5 error (n
mi) 38.8 76.1 117.6 153.4 213.2 242.3 297.0
2015 mean OFCL skill relative to CLIPER5 (%)
32.5 49.0 58.1 61.3 61.0 52.5 48.2
2015 mean OFCL bias vector (°/n mi) 344/004 360/007 021/011 035/017 050/032 055/045 062/064
2015 number of cases 331 300 272 246 200 158 127
2010-2014 mean OFCL error (n mi) 23.4 36.1 46.8 59.2 89.1 124.2 160.8
2010-2014 mean CLIPER5 error (n
mi) 36.6 74.2 116.4 159.7 246.8 334.1 431.2
2010-2014 mean OFCL skill relative to CLIPER5 (%)
36.1 51.3 59.8 62.9 63.9 62.8 62.7
2010-2014 mean OFCL bias vector
(°/n mi) 321/001 312/001 090/001 091/005 089/015 074/031 048/040
2010-2014 number of cases 1310 1163 1020 889 665 478 318
2015 OFCL error relative to 2010-2014 mean (%)
12.0 7.5 5.3 0.3 -6.7 -7.3 -4.3
2015 CLIPER5 error relative to 2010-2014 mean (%)
6.0 2.6 1.0 -3.9 -13.6 -27.5 -31.1

2015 Hurricane Season 30
Table 8a. Homogenous comparison of eastern North Pacific basin early track guidance model errors (n mi) for 2015. Errors smaller than the NHC official forecast are shown in boldface.
Forecast Period (h)
Model ID 12 24 36 48 72 96 120
OFCL 23.3 36.9 47.3 55.9 73.4 103.7 136.8
OCD5 36.4 73.4 113.6 144.7 192.1 213.1 291.5
GFSI 26.1 41.5 52.8 64.8 88.2 124.7 163.1
GHMI 29.1 46.5 62.1 74.8 105.9 173.5 250.8
HWFI 27.7 43.7 57.1 69.2 93.0 121.5 167.1
EMXI 24.1 40.7 54.2 62.5 86.1 113.7 140.7
CMCI 30.6 50.4 66.9 85.5 125.7 151.4 189.5
EGRI 24.7 40.6 53.3 68.8 99.7 133.4 188.7
NVGI 30.4 51.1 70.4 89.7 125.5 163.8 205.5
GFNI 31.4 54.6 74.4 91.5 136.2 195.3 262.2
AEMI 25.9 42.8 55.5 65.8 90.8 117.7 144.2
FSSE 22.8 36.5 47.8 58.1 78.3 111.6 151.3
TVCE 23.1 36.2 46.6 55.2 71.1 103.6 141.4
LBAR 33.4 64.3 97.4 131.9 186.5 236.4 303.9
BAMD 37.3 65.0 91.7 110.8 125.7 177.9 248.9
BAMM 33.2 55.7 75.2 90.7 106.4 126.3 166.2
BAMS 43.3 77.4 107.7 128 136.3 148.7 196.2
TCLP 36.7 74.1 116 155.8 218.6 262.7 362.1
# Cases 222 203 186 165 127 93 75

2015 Hurricane Season 31
Table 8b. Homogenous comparison of eastern North Pacific basin early track guidance model bias vectors (º/n mi) for 2015.
Forecast Period (h)
Model ID 12 24 36 48 72 96 120
OFCL 007/005 014/009 018/012 025/015 050/024 063/047 075/052
OCD5 301/004 279/012 260/026 250/039 242/087 250/117 248/218
GFSI 013/007 010/011 015/013 026/014 050/026 060/057 068/066
GHMI 036/009 028/018 021/024 015/033 037/064 040/126 040/203
HWFI 352/010 350/015 341/016 336/017 001/009 075/028 093/024
EMXI 344/004 010/006 033/007 047/013 065/023 075/031 105/033
CMCI 021/006 030/011 045/015 051/025 055/048 061/092 070/103
EGRI 322/001 329/004 327/006 304/010 270/013 209/008 235/053
NVGI 334/011 323/020 315/026 314/037 318/054 334/069 352/101
GFNI 026/004 029/011 017/017 007/027 013/049 021/098 029/179
AEMI 340/007 344/012 353/014 004/015 038/027 058/064 067/080
FSSE 014/006 018/012 021/016 022/022 035/036 050/059 060/068
TVCE 005/005 009/010 007/013 007/015 037/022 053/045 056/049
LBAR 031/015 357/034 340/056 334/079 333/103 010/131 035/187
BAMD 003/017 001/030 357/038 356/042 355/041 032/085 045/136
BAMM 336/017 330/027 322/031 316/032 323/021 031/041 036/053
BAMS 337/021 329/033 321/041 316/043 305/031 350/019 245/013
TCLP 254/003 233/013 224/030 219/050 218/100 224/140 229/263
# Cases 222 203 186 165 127 93 75

2015 Hurricane Season 32
Table 9. Homogenous comparison of official and Decay-SHIFOR5 intensity forecast errors in the eastern North Pacific basin for the 2015 season for all tropical cyclones. Averages for the previous 5-yr period are shown for comparison.
Forecast Period (h)
12 24 36 48 72 96 120
2015 mean OFCL error (kt) 7.4 11.9 14.7 15.7 16.2 14.9 15.1
2015 mean Decay-SHIFOR5 error (kt) 9.4 15.6 20.2 22.9 24.6 26.7 25.9
2015 mean OFCL skill relative to Decay-
SHIFOR5 (%) 20.2 23.1 27.2 31.0 33.7 44.2 41.7
2015 OFCL bias (kt) -1.6 -2.9 -4.0 -5.3 -4.6 -4.3 -4.8
2015 number of cases 331 300 272 246 200 158 127
2010-14 mean OFCL error (kt) 5.9 9.7 12.4 13.9 15.4 16.2 14.7
2010-14 mean Decay-SHIFOR5 error (kt) 7.6 12.6 16.2 18.6 20.8 20.7 19.5
2010-14 mean OFCL skill relative to Decay-
SHIFOR5 (%) 22.4 23.0 25.9 25.3 26.0 21.7 24.6
2010-14 OFCL bias (kt) -0.5 -0.7 -1.5 -2.2 -2.2 -1.7 -0.7
2010-14 number of cases 1310 1163 1020 889 665 478 318
2015 OFCL error relative to 2010-14 mean (%) 25.4 22.7 18.5 12.9 5.2 -8.0 2.7
2015 Decay-SHIFOR5 error relative to 2010-14
mean (%) 23.7 23.8 24.7 23.2 18.3 29.0 32.8

2015 Hurricane Season 33
Table 10a. Homogenous comparison of eastern North Pacific basin early intensity guidance model errors (kt) for 2015. Errors smaller than the NHC official forecast are shown in boldface.
Forecast Period (h)
Model ID 12 24 36 48 72 96 120
OFCL 8.7 14.0 16.2 15.7 13.1 12.5 11.6
OCD5 10.9 18.0 22.6 23.4 21.3 25.5 21.1
HWFI 10.4 15.4 18.8 19.4 15.7 15.1 13.2
GHMI 11.7 18.8 24.0 24.2 20.1 21.1 17.3
GFNI 12.4 20.1 25.1 25.7 23.0 22.4 21.5
DSHP 9.6 15.7 18.5 18.3 15.1 13.7 13.5
LGEM 9.4 15.0 18.0 18.0 14.6 14.8 14.1
IVCN 9.6 14.7 17.2 16.9 13.3 13.4 11.8
FSSE 9.1 13.3 15.8 15.8 13.9 15.9 16.0
GFSI 12.0 18.3 22.1 22.7 19.7 18.4 21.3
EMXI 14.3 23.4 29.0 30.1 27.2 26.9 27.4
TCLP 11.3 20.3 26.7 28.9 27.8 29.7 25.8
# Cases 237 210 186 169 129 95 81

2015 Hurricane Season 34
Table 10b. Homogenous comparison of eastern North Pacific basin early intensity guidance model biases (kt) for 2015. Biases smaller than the NHC official forecast are shown in boldface.
Forecast Period (h)
Model ID 12 24 36 48 72 96 120
OFCL -2.3 -3.7 -4.0 -3.6 1.0 -1.2 -0.7
OCD5 -3.4 -7.3 -11.0 -13.6 -13.2 -20.5 -14.9
HWFI -6.1 -9.9 -12.6 -13.5 -9.9 -9.4 -4.7
GHMI -7.3 -14.9 -20.3 -19.3 -12.9 -8.5 -2.4
GFNI -8.3 -16.3 -21.9 -22.8 -17.5 -16.3 -11.5
DSHP -2.8 -4.6 -6.0 -6.7 -3.6 -3.7 -1.0
LGEM -2.8 -5.2 -7.0 -6.6 -3.4 -6.2 -7.6
IVCN -4.5 -8.4 -11.2 -11.3 -7.2 -6.8 -3.9
FSSE -3.4 -5.2 -6.4 -6.1 -2.4 -5.9 -5.4
GFSI -3.8 -4.0 -4.6 -4.4 2.4 5.2 11.8
EMXI -3.9 -7.0 -8.6 -7.8 -1.5 2.3 10.9
TCLP -5.5 -13.5 -19.7 -22.6 -22.5 -26.7 -21.6
# Cases 237 210 186 169 129 95 81

2015 Hurricane Season 35
Table 11. Official eastern North Pacific track and intensity forecast verifications (OFCL) for 2015 by storm. CLIPER5 (CLP5) and SHIFOR5 (SHF5) forecast errors are given for comparison and indicated collectively as OCD5. The number of track and intensity forecasts are given by NT and NI, respectively. Units for track and intensity errors are n mi and kt, respectively.
Verification statistics for: EP012015 ANDRES
VT (h) NT OFCL OCD5 NI OFCL OCD5 000 29 5.4 5.4 29 1.7 1.9 012 27 20.3 33.0 27 8.7 9.9 024 25 32.1 74.4 25 13.8 16.3 036 23 41.2 116.2 23 17.8 21.5 048 21 51.2 141.8 21 20.7 26.0 072 17 85.5 192.7 17 26.8 30.9 096 13 127.3 235.4 13 28.1 28.8 120 9 173.4 401.4 9 18.9 15.6
Verification statistics for: EP022015 BLANCA
VT (h) NT OFCL OCD5 NI OFCL OCD5 000 34 8.4 8.6 34 0.9 1.3 012 32 22.9 37.9 32 8.9 11.4 024 30 34.9 78.0 30 15.5 20.5 036 28 40.0 127.9 28 20.2 27.9 048 26 47.3 177.9 26 21.3 29.3 072 22 61.6 268.7 22 16.6 24.6 096 18 81.1 318.3 18 13.1 31.7 120 14 88.0 351.2 14 10.0 34.6
Verification statistics for: EP032015 CARLOS
VT (h) NT OFCL OCD5 NI OFCL OCD5 000 28 9.0 9.7 28 1.4 1.6 012 26 24.9 34.1 26 7.5 9.0 024 24 37.3 67.8 24 10.6 11.4 036 22 47.9 107.2 22 11.4 12.4 048 20 55.8 140.4 20 8.0 11.6 072 16 84.5 197.2 16 8.4 12.8 096 12 108.1 276.9 12 11.3 15.0 120 8 138.7 426.2 8 8.8 20.9

2015 Hurricane Season 36
Verification statistics for: EP042015 ELA
VT (h) NT OFCL OCD5 NI OFCL OCD5 000 1 12.0 12.0 1 0.0 0.0 012 1 23.8 26.6 1 0.0 4.0 024 1 29.1 58.7 1 0.0 11.0 036 1 83.4 135.3 1 10.0 11.0 048 1 107.0 194.4 1 10.0 14.0 072 0 -999.0 -999.0 0 -999.0 -999.0 096 0 -999.0 -999.0 0 -999.0 -999.0 120 0 -999.0 -999.0 0 -999.0 -999.0
Verification statistics for: EP052015 DOLORES
VT (h) NT OFCL OCD5 NI OFCL OCD5 000 29 12.2 12.3 29 5.2 5.3 012 27 18.3 30.9 27 9.6 11.9 024 25 23.3 48.1 25 13.8 16.7 036 23 29.8 71.3 23 14.1 21.0 048 21 33.8 87.6 21 16.2 24.8 072 17 41.3 98.5 17 21.2 29.1 096 13 35.7 118.8 13 23.1 27.5 120 9 53.6 139.3 9 26.7 15.3
Verification statistics for: EP062015 ENRIQUE
VT (h) NT OFCL OCD5 NI OFCL OCD5 000 23 6.8 6.6 23 1.1 1.1 012 22 21.6 32.6 22 3.6 4.3 024 20 31.9 61.8 20 6.0 6.1 036 18 37.1 83.6 18 4.4 7.3 048 16 40.1 98.5 16 5.6 6.1 072 12 50.1 136.2 12 5.0 4.7 096 8 70.3 153.3 8 2.5 5.3 120 4 116.1 179.1 4 5.0 15.0
Verification statistics for: EP072015 FELICIA
VT (h) NT OFCL OCD5 NI OFCL OCD5 000 6 10.7 10.7 6 0.0 0.0 012 4 19.1 30.5 4 3.8 5.3 024 2 39.2 88.3 2 2.5 4.5 036 0 -999.0 -999.0 0 -999.0 -999.0 048 0 -999.0 -999.0 0 -999.0 -999.0 072 0 -999.0 -999.0 0 -999.0 -999.0 096 0 -999.0 -999.0 0 -999.0 -999.0 120 0 -999.0 -999.0 0 -999.0 -999.0

2015 Hurricane Season 37
Verification statistics for: EP082015 EIGHT
VT (h) NT OFCL OCD5 NI OFCL OCD5 000 9 8.4 9.4 9 0.0 0.0 012 7 21.1 32.3 7 1.4 1.4 024 5 22.3 51.7 5 4.0 1.2 036 3 37.2 90.1 3 5.0 1.3 048 1 37.8 91.6 1 5.0 1.0 072 0 -999.0 -999.0 0 -999.0 -999.0 096 0 -999.0 -999.0 0 -999.0 -999.0 120 0 -999.0 -999.0 0 -999.0 -999.0
Verification statistics for: EP092015 GUILLERMO
VT (h) NT OFCL OCD5 NI OFCL OCD5 000 12 5.8 6.9 12 1.3 1.3 012 12 36.8 52.6 12 5.0 6.0 024 12 53.9 107.6 12 9.2 11.4 036 12 47.5 152.1 12 10.0 12.7 048 12 43.2 188.8 12 7.9 12.6 072 12 53.5 249.5 12 9.2 10.3 096 12 81.5 292.9 12 5.0 4.9 120 12 98.6 354.4 12 4.2 8.0
Verification statistics for: EP102015 HILDA
VT (h) NT OFCL OCD5 NI OFCL OCD5 000 9 5.7 5.7 9 4.4 4.4 012 9 20.8 21.9 9 12.2 14.2 024 9 41.5 40.4 9 23.9 27.2 036 9 70.9 59.9 9 32.8 40.6 048 9 97.7 76.2 9 35.6 46.9 072 9 127.0 104.4 9 25.6 31.4 096 9 158.6 152.7 9 18.3 19.9 120 9 195.0 250.6 9 13.9 15.0
Verification statistics for: EP112015 ELEVEN
VT (h) NT OFCL OCD5 NI OFCL OCD5 000 8 11.8 11.8 8 0.6 0.6 012 6 29.8 62.5 6 2.5 2.7 024 4 26.7 114.9 4 2.5 4.8 036 2 33.4 219.6 2 0.0 8.5 048 0 -999.0 -999.0 0 -999.0 -999.0 072 0 -999.0 -999.0 0 -999.0 -999.0 096 0 -999.0 -999.0 0 -999.0 -999.0 120 0 -999.0 -999.0 0 -999.0 -999.0

2015 Hurricane Season 38
Verification statistics for: EP122015 IGNACIO
VT (h) NT OFCL OCD5 NI OFCL OCD5 000 11 12.7 12.7 11 0.0 0.0 012 11 32.2 43.8 11 3.6 5.2 024 11 51.5 77.7 11 6.8 9.7 036 11 68.6 116.8 11 11.4 13.4 048 11 79.3 147.7 11 10.9 16.6 072 11 82.4 204.5 11 15.9 26.6 096 11 74.7 238.4 11 25.9 39.0 120 11 117.2 287.7 11 29.1 36.1
Verification statistics for: EP132015 JIMENA
VT (h) NT OFCL OCD5 NI OFCL OCD5 000 24 2.7 2.9 24 1.9 2.1 012 24 17.1 29.6 24 8.1 10.1 024 24 26.6 65.6 24 12.9 18.6 036 24 37.2 104.4 24 14.0 24.0 048 24 44.4 139.1 24 12.7 28.4 072 24 58.8 196.6 24 8.8 31.6 096 24 81.8 232.3 24 6.7 33.4 120 24 107.7 253.8 24 6.0 24.3
Verification statistics for: EP142015 KEVIN
VT (h) NT OFCL OCD5 NI OFCL OCD5 000 19 13.0 13.0 19 5.0 5.0 012 17 35.1 41.3 17 5.3 7.5 024 15 54.0 81.7 15 7.3 9.8 036 13 64.8 126.6 13 9.6 11.2 048 11 72.8 186.9 11 8.2 9.0 072 7 78.7 383.5 7 11.4 18.0 096 3 65.2 587.2 3 6.7 28.3 120 0 -999.0 -999.0 0 -999.0 -999.0
Verification statistics for: EP152015 LINDA
VT (h) NT OFCL OCD5 NI OFCL OCD5 000 18 8.2 8.2 18 2.5 2.5 012 16 25.7 38.7 16 10.9 12.5 024 14 33.0 68.6 14 16.8 21.3 036 12 38.4 104.4 12 14.6 21.0 048 10 31.4 139.8 10 16.0 20.8 072 6 59.1 247.3 6 16.7 21.2 096 2 161.4 353.3 2 7.5 9.0 120 0 -999.0 -999.0 0 -999.0 -999.0

2015 Hurricane Season 39
Verification statistics for: EP162015 SIXTEEN
VT (h) NT OFCL OCD5 NI OFCL OCD5 000 4 10.5 10.5 4 0.0 0.0 012 2 36.0 70.7 2 0.0 2.5 024 0 -999.0 -999.0 0 -999.0 -999.0 036 0 -999.0 -999.0 0 -999.0 -999.0 048 0 -999.0 -999.0 0 -999.0 -999.0 072 0 -999.0 -999.0 0 -999.0 -999.0 096 0 -999.0 -999.0 0 -999.0 -999.0 120 0 -999.0 -999.0 0 -999.0 -999.0
Verification statistics for: EP172015 MARTY
VT (h) NT OFCL OCD5 NI OFCL OCD5 000 14 9.8 9.9 14 1.4 1.4 012 12 29.7 40.0 12 6.3 7.6 024 10 39.5 78.0 10 7.0 5.4 036 8 42.2 123.6 8 5.0 11.8 048 6 42.4 189.9 6 5.0 13.3 072 2 37.0 327.7 2 7.5 22.5 096 0 -999.0 -999.0 0 -999.0 -999.0 120 0 -999.0 -999.0 0 -999.0 -999.0
Verification statistics for: EP182015 NORA
VT (h) NT OFCL OCD5 NI OFCL OCD5 000 7 13.8 13.8 7 0.0 0.0 012 7 30.2 30.7 7 0.7 2.4 024 7 34.7 41.0 7 3.6 3.7 036 7 42.4 54.2 7 3.6 4.6 048 7 66.8 68.2 7 9.3 9.4 072 7 152.2 84.8 7 28.6 14.6 096 7 290.2 110.3 7 33.6 21.6 120 5 485.3 161.5 5 37.0 28.0
Verification statistics for: EP192015 OLAF
VT (h) NT OFCL OCD5 NI OFCL OCD5 000 25 10.3 10.8 25 1.8 2.0 012 23 25.0 35.8 23 5.9 8.8 024 22 35.9 62.5 22 9.3 14.6 036 22 53.6 91.2 22 13.6 19.7 048 22 77.8 113.2 22 13.4 24.2 072 22 136.3 166.0 22 15.0 28.9 096 22 196.3 236.5 22 15.0 42.5 120 22 247.4 331.2 22 20.7 43.4

2015 Hurricane Season 40
Verification statistics for: EP202015 PATRICIA
VT (h) NT OFCL OCD5 NI OFCL OCD5 000 16 8.3 9.3 16 7.8 8.1 012 15 34.8 66.3 15 22.7 29.5 024 13 55.9 162.5 13 35.0 55.5 036 11 86.9 267.6 11 47.7 64.3 048 9 105.7 345.6 9 57.8 72.1 072 5 105.4 413.1 5 55.0 74.6 096 1 199.8 346.6 1 25.0 2.0 120 0 -999.0 -999.0 0 -999.0 -999.0
Verification statistics for: EP212015 RICK
VT (h) NT OFCL OCD5 NI OFCL OCD5 000 17 10.8 13.8 17 0.0 0.0 012 15 43.7 56.8 15 3.3 2.3 024 13 71.9 110.1 13 4.6 2.8 036 11 83.1 179.9 11 8.2 4.9 048 9 116.2 283.5 9 9.4 6.3 072 5 176.1 463.5 5 11.0 11.8 096 1 232.4 396.8 1 0.0 12.0 120 0 -999.0 -999.0 0 -999.0 -999.0
Verification statistics for: EP222015 SANDRA
VT (h) NT OFCL OCD5 NI OFCL OCD5 000 18 7.9 8.2 18 2.5 2.5 012 16 34.7 44.6 16 6.3 9.9 024 14 54.9 96.2 14 11.8 18.9 036 12 70.1 168.0 12 16.7 28.3 048 10 81.1 245.9 10 21.5 32.4 072 6 104.2 434.0 6 17.5 28.3 096 2 124.6 571.5 2 5.0 8.0 120 0 -999.0 -999.0 0 -999.0 -999.0
2015 Hurricane Season 41
Table 12a. Verification of 48-h probabilistic genesis forecasts for the Atlantic basin in 2015.
Atlantic Basin Genesis Forecast Reliability Table
Forecast Likelihood (%)
Verifying Genesis Occurrence Rate (%) Number of Forecasts
0 2 271 10 10 115 20 19 57 30 30 20 40 33 12 50 65 20 60 75 16 70 84 19 80 60 10 90 100 2 100 - 0
Table 12b. Verification of 48-h probabilistic genesis forecasts for the eastern North Pacific
basin in 2015.
Eastern North Pacific Basin Genesis Forecast Reliability Table
Forecast Likelihood (%)
Verifying Genesis Occurrence Rate (%) Number of Forecasts
0 3 333 10 14 133 20 24 78 30 23 47 40 54 35 50 50 40 60 64 25 70 82 33 80 88 24 90 82 17 100 - 0

2015 Hurricane Season 42
Table 13a. Verification of 120-h probabilistic genesis forecasts for the Atlantic basin in 2015.
Atlantic Basin Genesis Forecast Reliability Table
Forecast Likelihood (%)
Verifying Genesis Occurrence Rate (%) Number of Forecasts
0 0 45 10 14 203 20 17 103 30 30 56 40 45 33 50 78 18 60 72 29 70 89 19 80 70 27 90 100 8 100 - 0
Table 13b. Verification of 120-h probabilistic genesis forecasts for the eastern North Pacific
basin in 2015.
Eastern North Pacific Basin Genesis Forecast Reliability Table
Forecast Likelihood (%)
Verifying Genesis Occurrence Rate (%) Number of Forecasts
0 0 16 10 15 163 20 31 137 30 50 76 40 53 47 50 46 48 60 70 33 70 87 60 80 88 78 90 93 107 100 - 0

2015 Hurricane Season 43
Table 14. NHC forecast cone circle radii (n mi) for 2016. Change from 2015 values expressed in n mi and percent are given in parentheses.
Track Forecast Cone Two-Thirds Probability Circles (n mi)
Forecast Period (h) Atlantic Basin Eastern North Pacific Basin
3 16 (0: 0%) 16 (0: 0%) 12 30 (-2: -6%) 27 (1: 4%) 24 49 (-3: -6%) 42 (0: 0%) 36 66 (-5: -7%) 55 (1: 2%) 48 84 (-6: -7%) 70 (1: 1%) 72 115 (-7: -6%) 100 (0: 0%) 96 165 (-5: -3%) 137 (-6: -4%) 120 237 (12: 5%) 172 (-10: -5%)

2015 Hurricane Season 44
Table 15. Composition of NHC consensus models for 2016. It is intended that TCOA/TVCA would be the primary consensus aids for the Atlantic basin and TCOE/TVCE would be primary for the eastern Pacific.
NHC Consensus Model Definitions For 2016
Model ID Parameter Type Members
GFEX Track Fixed GFSI EMXI
TCOA Track Fixed GFSI EGRI GHMI HWFI
TCOE* Track Fixed GFSI EGRI GHMI HWFI
ICON Intensity Fixed DSHP LGEM GHMI HWFI
TVCA** Track Variable GFSI EGRI GHMI HWFI EMXI CTCI
TVCE** Track Variable GFSI EGRI GHMI HWFI EMXI CTCI
TVCX Track Variable EMXI (double weight) GFSI EGRI GHMI HWFI
IVCN Intensity Variable DSHP LGEM GHMI HWFI CTCI
* TCON will continue to be computed and will have the same composition as TCOE. ** TVCN will continue to be computed and will have the same composition as TVCA and TVCE. GPCE circles will continue to be based on TVCN.

2015 Hurricane Season 45
LIST OF FIGURES
1. NHC official and CLIPER5 (OCD5) Atlantic basin average track errors for 2015 (solid lines) and 2010-2014 (dashed lines).
2. Number of NHC official forecasts for the Atlantic basin from 1990-2015.
3. Recent trends in NHC official track forecast error (top) and skill (bottom) for the Atlantic basin.
4. 2011-15 NHC official track forecast error binned by initial intensity for the Atlantic basin. Weak tropical storms are in the 35-45 kt range and strong tropical storms are in the 50-60 kt range.
5. Homogenous comparison for selected Atlantic basin early track guidance models for 2015. This verification includes only those models that were available at least 2/3 of the time (see text).
6. Homogenous comparison of the primary Atlantic basin track consensus models for 2013-2015.
7. Homogenous comparison of the primary Atlantic basin track consensus models for 2015.
8. NHC official and Decay-SHIFOR5 (OCD5) Atlantic basin average intensity errors for 2015 (solid lines) and 2010-2014 (dashed lines).
9. Recent trends in NHC official intensity forecast error (top) and skill (bottom) for the Atlantic basin.
10. Homogenous comparison for selected Atlantic basin early intensity guidance models for 2015. This verification includes only those models that were available at least 2/3 of the time (see text).
11. Homogenous comparison for selected Atlantic basin early intensity guidance models for 2013-15.
12. 2015 NHC official track forecasts errors by tropical cyclone.
13. 2015 NHC official intensity forecasts errors by tropical cyclone.
14. NHC official and CLIPER5 (OCD5) eastern North Pacific basin average track errors for 2015 (solid lines) and 2010-2014 (dashed lines).
15. Number of forecasts for the eastern North Pacific basin from 1990-2015.
16. Recent trends in NHC official track forecast error (top) and skill (bottom) for the eastern North Pacific basin.
17. Homogenous comparison for selected eastern North Pacific early track models for 2015. This verification includes only those models that were available at least 2/3 of the time (see text).
18. Homogenous comparison of the primary eastern North Pacific basin track consensus models for 2015.
19. NHC official and Decay-SHIFOR5 (OCD5) eastern North Pacific basin average intensity errors for 2015 (solid lines) and 2010-2014 (dashed lines).

2015 Hurricane Season 46
20. Recent trends in NHC official intensity forecast error (top) and skill (bottom) for the eastern North Pacific basin.
21. Homogenous comparison for selected eastern North Pacific basin early intensity guidance models for 2015. This verification includes only those models that were available at least 2/3 of the time (see text).
22. Reliability diagram for Atlantic (top) and eastern North Pacific (bottom) probabilistic tropical cyclogenesis 48-h forecasts for 2015. The solid lines indicate the relationship between the forecasts and verifying genesis percentages, with perfect reliability indicated by the thin diagonal black line. The dashed lines indicate how the forecasts were distributed among the possible forecast values.
23. As described for Fig. 22, but for 120-h forecasts.

2015 Hurricane Season 47
Figure 1. NHC official and CLIPER5 (OCD5) Atlantic basin average track errors for 2015
(solid lines) and 2010-2014 (dashed lines).
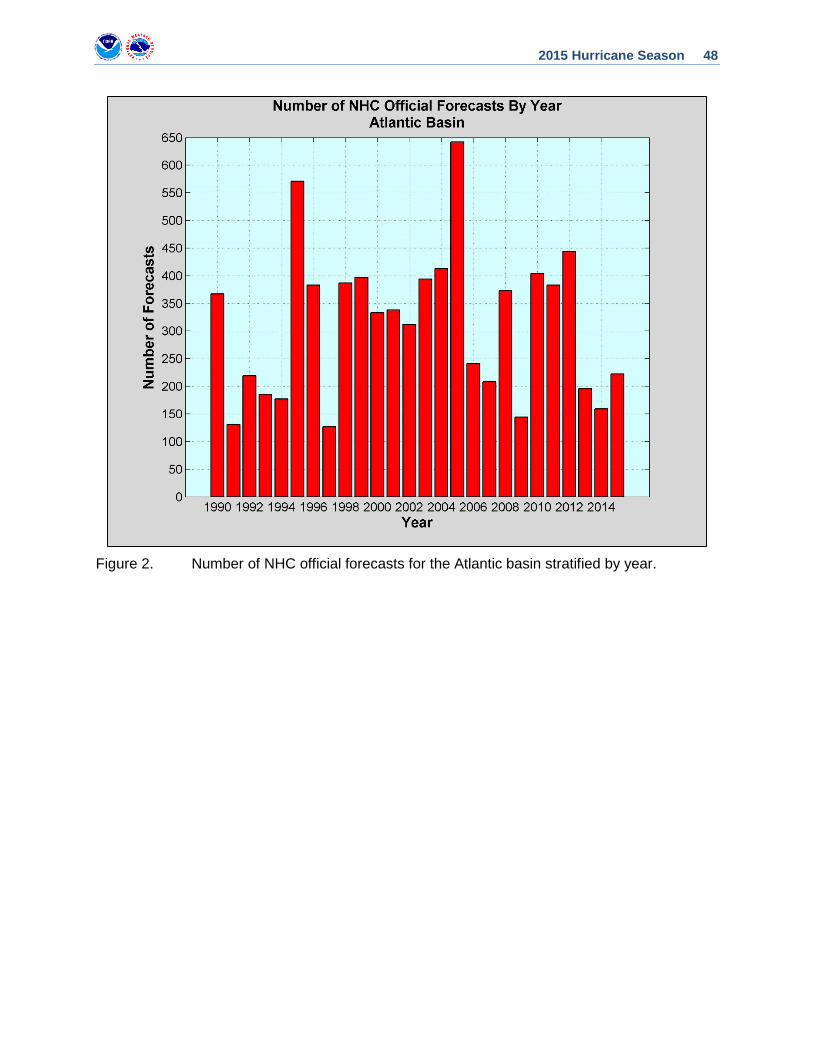
2015 Hurricane Season 48
Figure 2. Number of NHC official forecasts for the Atlantic basin stratified by year.

2015 Hurricane Season 49
Figure 3. Recent trends in NHC official track forecast error (top) and skill (bottom) for the
Atlantic basin.

2015 Hurricane Season 50
Figure 4. 2011-15 NHC official track forecast error binned by initial intensity for the Atlantic
basin. Weak tropical storms are in the 35-45 kt range and strong tropical storms are in the 50-60 kt range.

2015 Hurricane Season 51
Figure 5. Homogenous comparison for selected Atlantic basin early track models for 2015.
This verification includes only those models that were available at least 2/3 of the time (see text).

2015 Hurricane Season 52
Figure 6. Homogenous comparison for selected Atlantic basin early track models for 2013-
2015.

2015 Hurricane Season 53
Figure 7. Homogenous comparison of the primary Atlantic basin track consensus models for
2015.

2015 Hurricane Season 54
Figure 8. NHC official and Decay-SHIFOR5 (OCD5) Atlantic basin average intensity errors
for 2015 (solid lines) and 2010-2014 (dashed lines).

2015 Hurricane Season 55
Figure 9. Recent trends in NHC official intensity forecast error (top) and skill (bottom) for the
Atlantic basin.

2015 Hurricane Season 56
Figure 10. Homogenous comparison for selected Atlantic basin early intensity guidance
models for 2015.
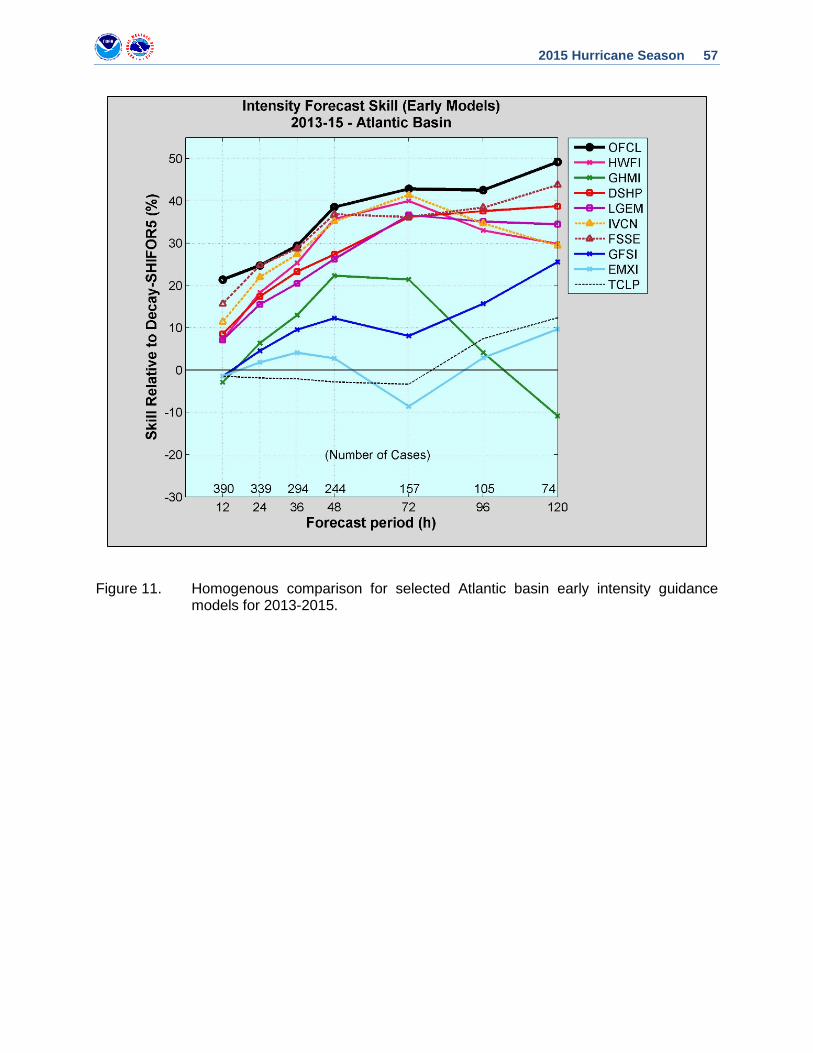
2015 Hurricane Season 57
Figure 11. Homogenous comparison for selected Atlantic basin early intensity guidance models for 2013-2015.

2015 Hurricane Season 58
Figure 12. 2015 NHC official track errors by tropical cyclone.

2015 Hurricane Season 59
Figure 13. 2015 NHC official intensity errors by tropical cyclone.

2015 Hurricane Season 60
Figure 14. NHC official and CLIPER5 (OCD5) eastern North Pacific basin average track
errors for 2015 (solid lines) and 2010-2014 (dashed lines).

2015 Hurricane Season 61
Figure 15. Number of NHC official forecasts for the Atlantic basin stratified by year.

2015 Hurricane Season 62
Figure 16. Recent trends in NHC official track forecast error (top) and skill (bottom) for the
eastern North Pacific basin.

2015 Hurricane Season 63
Figure 17. Homogenous comparison for selected eastern North Pacific early track models for
2015. This verification includes only those models that were available at least 2/3 of the time (see text).

2015 Hurricane Season 64
Figure 18. Homogenous comparison of the primary eastern North Pacific basin track
consensus models for 2015.

2015 Hurricane Season 65
Figure 19. NHC official and Decay-SHIFOR5 (OCD5) eastern North Pacific basin average
intensity errors for 2015 (solid lines) and 2010-2014 (dashed lines).

2015 Hurricane Season 66
Figure 20. Recent trends in NHC official intensity forecast error (top) and skill (bottom) for the
eastern North Pacific basin.
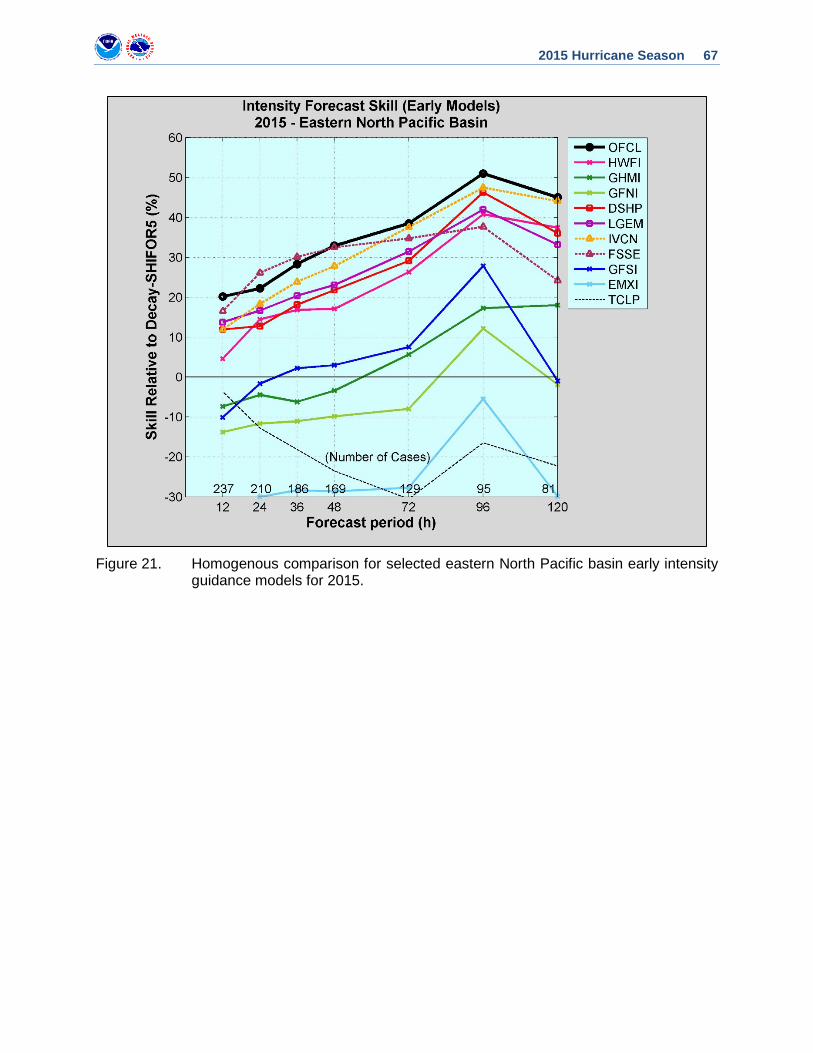
2015 Hurricane Season 67
Figure 21. Homogenous comparison for selected eastern North Pacific basin early intensity
guidance models for 2015.

2015 Hurricane Season 68
Figure 22. Reliability diagram for Atlantic (top) and eastern North Pacific (bottom) probabilistic tropical cyclogenesis 48-h forecasts for 2015. The solid lines indicate the relationship between the forecasts and verifying genesis percentages, with perfect reliability indicated by the thin diagonal black line. The dashed lines indicate how the forecasts were distributed among the possible forecast values.

2015 Hurricane Season 69
Figure 23. As described for Fig. 22, except for 120-h forecasts.