Embed Size (px)
Citation preview

GFDL Hurricane Model Ensemble Performance
During the 2012 Hurricane Season
Tim Marchok (NOAA / GFDL)
Matt Morin (DRC® HPTG / GFDL)
Morris Bender (NOAA / GFDL)
HFIP Team Telecon
12 December 2012
Acknowledgments:
Jason Dunion; Sytske Kimball; Rich Yablonsky; James Franklin;
Mark DeMaria; Andrea Schumacher; and John Knaff

Outline
• GFDL ensemble overview & methods
• Results: 2012 Cases
• Results: Verifications
• Website and Real-Time Products
• Summary Slide 2

GFDL Ensemble Overview
• Model configuration: Use same resolution as the operational GFDL model (3 nests with inner grid spacing of 1/12° (~9 km)).
• Perturbations: Modify observed TC parameters and model initial conditions to create spread in the model’s 5-day forecasts and show realistic possibilities of storm track and intensity evolution – Vortex size & intensity
• Goal: Represent the typical uncertainty in the storm’s reported observations
– Moisture fields; Sea-surface temperature • Goal: Represent the typical uncertainty in the model’s
initial fields around the storm’s core – Global model (for initial fields and boundary conditions)
• Goal: Include some degree of diversity in the large-scale environmental fields and steering flow
Slide 3

Hurricane Ensemble Membership
ATCF ID Description
GP00/GP08 Control forecast (same model as NCEP 2012 operational GFDL)
GP01/GP09 Unbogussed forecast using the 2012 GFDL control model
GP02/GP10 Increase NHC-observed Vmax +10%, R34 +25%, R50 +40%, ROCI +25%
GP03/GP11 Decrease NHC-observed Vmax -10%, R34 -25%, R50 -40%, ROCI -25%
GP04/GP12 Increase inner-core moisture by a max of +10%
GP05/GP13 Decrease inner-core moisture by a max of -10%
GP06/GP14 Increase SSTs by a max of +1°C within the initial extent of the TC
GP07/GP15 Decrease SSTs by a max of -2°C within the initial extent of the TC
GPMN Ensemble mean computed at each lead time where the member availability is at least 6 members (40% threshold)
Slide 4
• 16 members (15 perturbations + 1 control)
– Members 0815 have identical perturbations applied, but use GEFS Mean for initial and boundary conditions
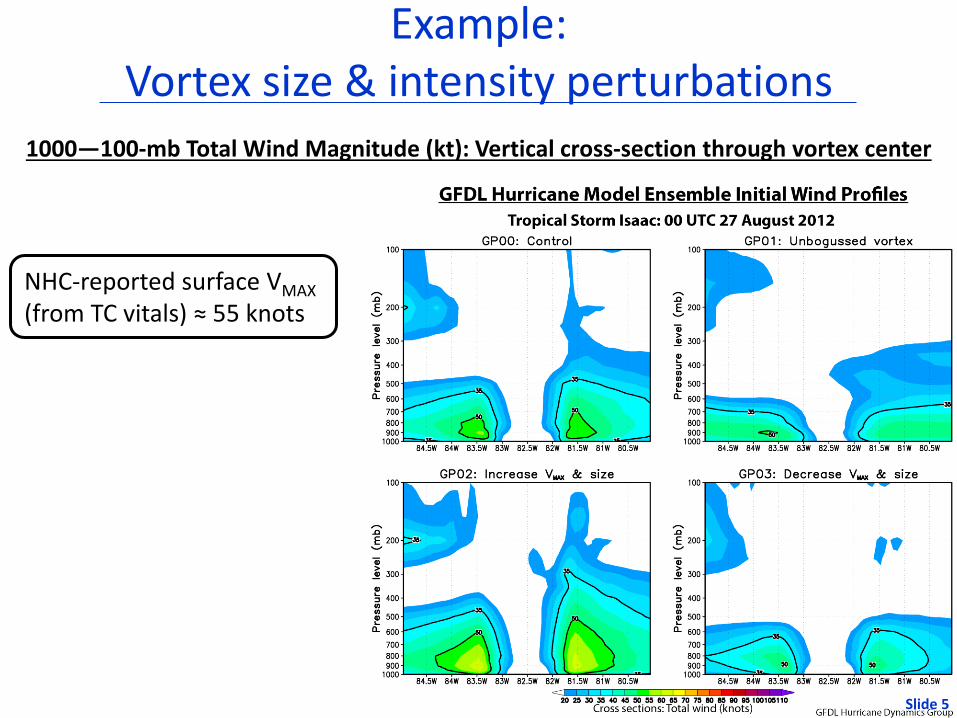
1000—100-mb Total Wind Magnitude (kt): Vertical cross-section through vortex center
Slide 5
NHC-reported surface VMAX (from TC vitals) ≈ 55 knots
Example: Vortex size & intensity perturbations
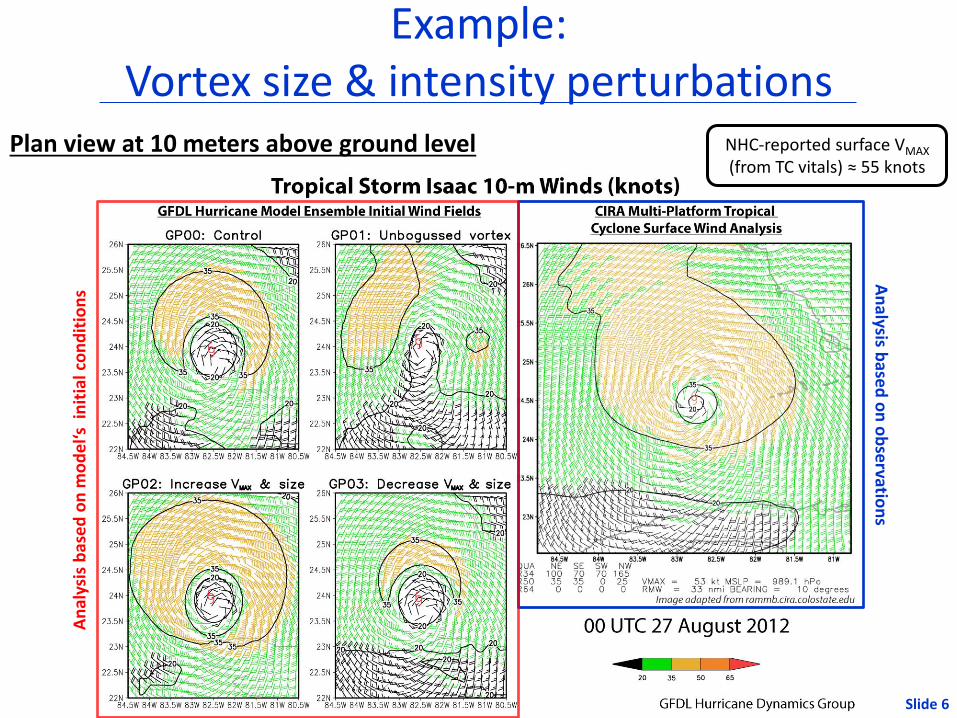
Plan view at 10 meters above ground level
An
alysis base
d o
n o
bse
rvation
s A
nal
ysis
bas
ed
on
mo
de
l‘s i
nit
ial c
on
dit
ion
s
Slide 6
Example: Vortex size & intensity perturbations
NHC-reported surface VMAX (from TC vitals) ≈ 55 knots

Example: Impact of vortex size & intensity perturbations on TC forecasts
Observed
In this particular case, bumping up the vortex’s intensity and wind radii observations (GP02) resulted in a more accurate track and intensity forecast compared to its complement member (GP03), the Control (GP00), and the unbogussed member (GP01). However, this is not always the case.
Slide 7

Slide 8
Example: Moisture perturbations
RH (%) r (g kg-1)

Example: Impact of moisture perturbations on TC forecasts
Observed
In this particular case, bumping up the vortex’s initial moisture profile (GP04) resulted in a more accurate track forecast compared to its complement member (GP05), while not perturbing the moisture (GP00) resulted in a more accurate intensity forecast.
Slide 9
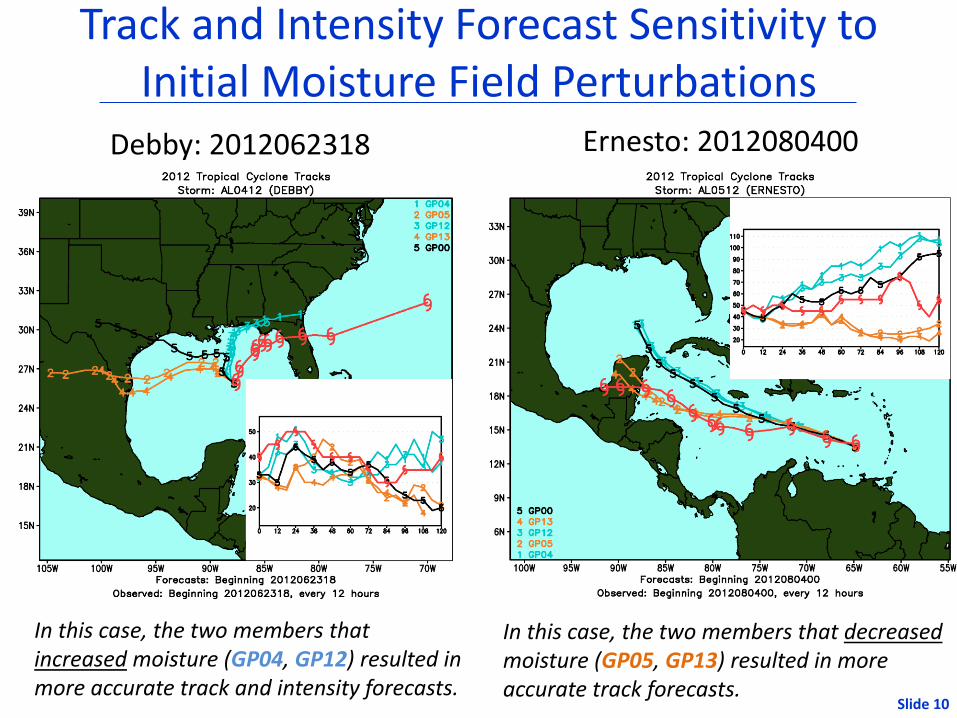
Track and Intensity Forecast Sensitivity to Initial Moisture Field Perturbations
Ernesto: 2012080400 Debby: 2012062318
In this case, the two members that increased moisture (GP04, GP12) resulted in more accurate track and intensity forecasts.
In this case, the two members that decreased moisture (GP05, GP13) resulted in more accurate track forecasts.
Slide 10

TRMM/TMI Analysis: 2011091100
GFS Analysis: 2011091100
GFDL Control Analysis: Nate 2011091100
GFDL (SST-2.0°) Analysis: Nate 2011091100
+
+
+
+
Courtesy of Rich Yablonsky / URI
Motivation for SST perturbations
Nate (2011)
Slide 11
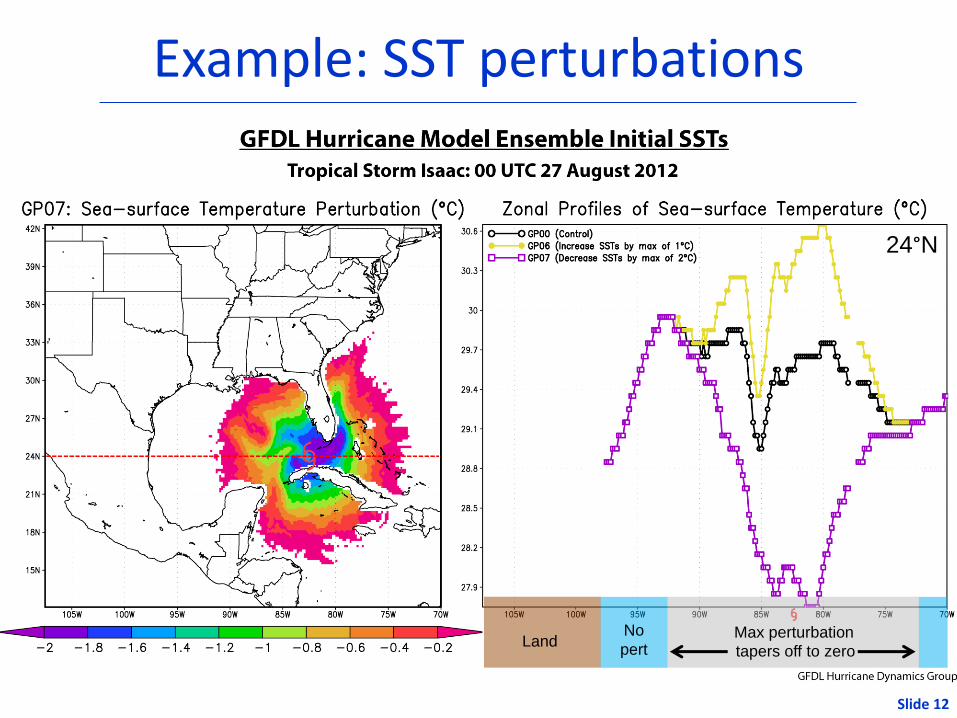
Example: SST perturbations
24°N
Land Max perturbation No
pert tapers off to zero
Slide 12

Example: Impact of SST perturbations
Observed
In this case, perturbing the initial SST field around the vortex (↑GP06, ↓GP07) did not result in a more accurate track and intensity forecast compared to the Control (GP00). Slide 13
In this case, the two members that decreased SST (↓GP07, ↓GP15) resulted in more accurate track forecasts than those which increased SST.

Outline
• GFDL ensemble overview & methods
• Results: 2012 Cases
• Results: Verifications
• Website and Real-Time Products
• Summary Slide 14

0
10
20
30
40
50
60
70
80
90
0
10
20
30
40
50
60
70
80
90
# C
ase
s
# cases at tau=00h (435 total)
# cases at tau=120h (134 total for GPMN)
Slide 15
Verified Forecasts for GFDL Ensemble 2012 Atlantic Season

Slide 16
Tropical Storm Debby
Ensemble mean (GPMN)
Slide 17
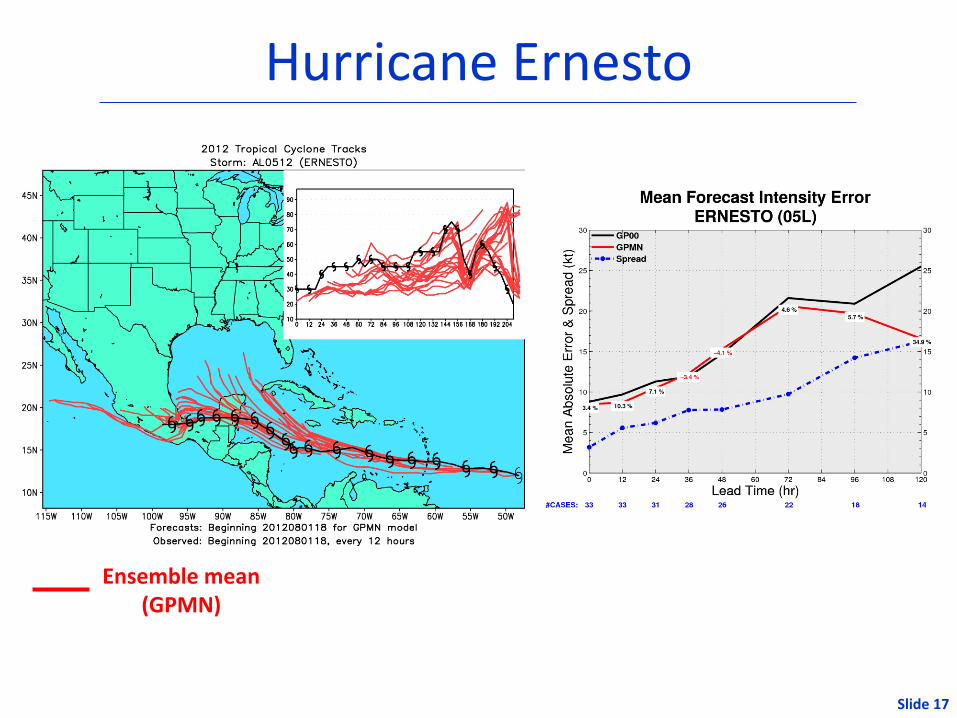
Hurricane Ernesto
Ensemble mean (GPMN)

Hurricane Isaac
Slide 18
Ensemble mean (GPMN)

Slide 19
Hurricane Leslie
Ensemble mean (GPMN)

Slide 20
Hurricane Michael
Ensemble mean (GPMN)

Slide 21
Hurricane Nadine
Ensemble mean (GPMN)
Slide 22
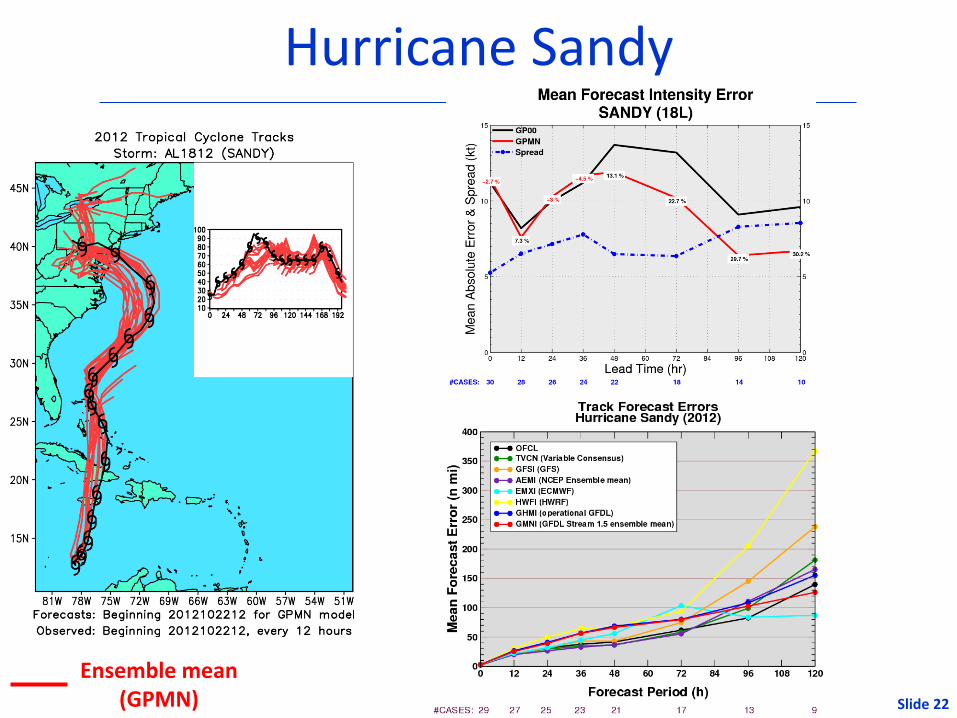
Hurricane Sandy
Ensemble mean (GPMN)
Outline
• GFDL ensemble overview & methods
• Results: 2012 Cases
• Results: Verifications
• Website and Real-Time Products
• Summary Slide 23

Results: Track Forecast Verifications (AL)
Overall, ensemble mean (GPMN) track has outperformed most of its members for the
Atlantic hurricane season this year.
Slide 24 GPMN improvement (%) over the Control is noted in the white text boxes

Results: Track Forecast Verifications (EP)
Slide 25 GPMN improvement (%) over the Control is noted in the white text boxes

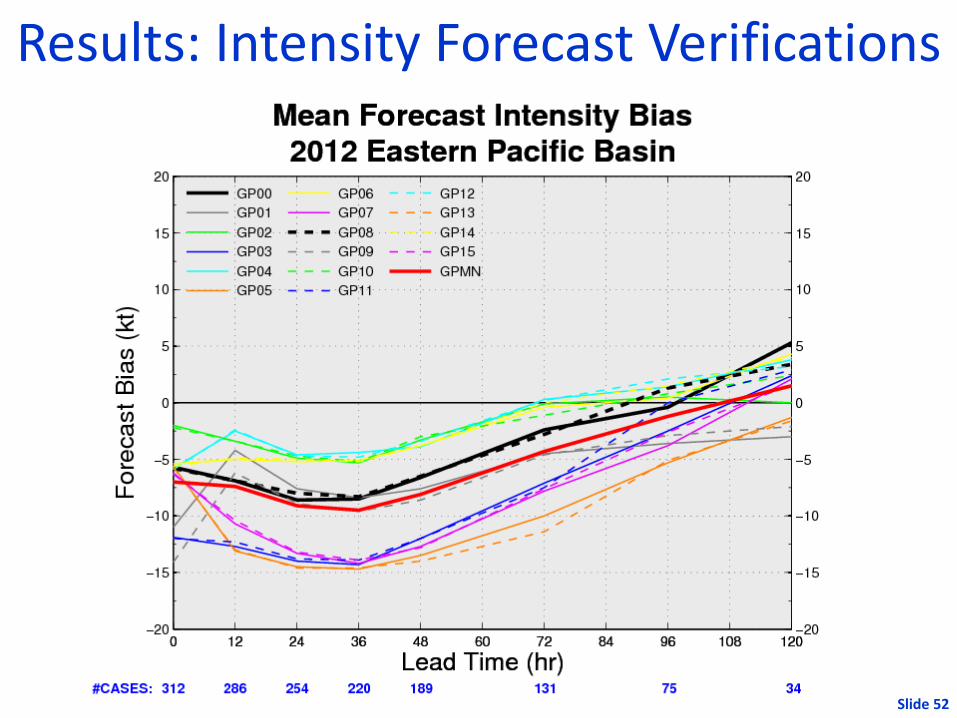
Results: Intensity Forecast Verifications (AL)
The ensemble mean (GPMN) intensity forecast outperformed most of its member forecasts for the Atlantic hurricane season this year [improvement over the Control
(GP00) is significantly more than it was for track].
GPMN improvement (%) over the Control is noted in the white text boxes Slide 26

Results: Intensity Forecast Verifications (EP)
GPMN improvement (%) over the Control is noted in the white text boxes Slide 27

Intensity Forecast Performance by Member Means
Slide 28
Size and moisture perturbations provide the most improvement out to 48h. At later lead times, the moisture perturbations outperform the size and SST members
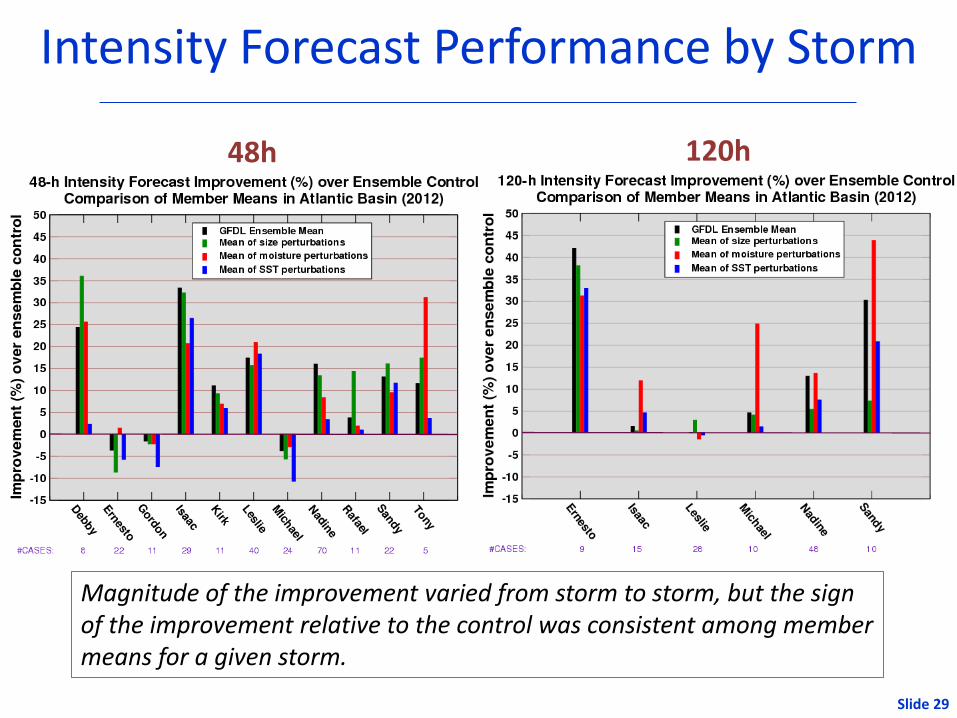
Intensity Forecast Performance by Storm
Slide 29
48h 120h
Magnitude of the improvement varied from storm to storm, but the sign of the improvement relative to the control was consistent among member means for a given storm.
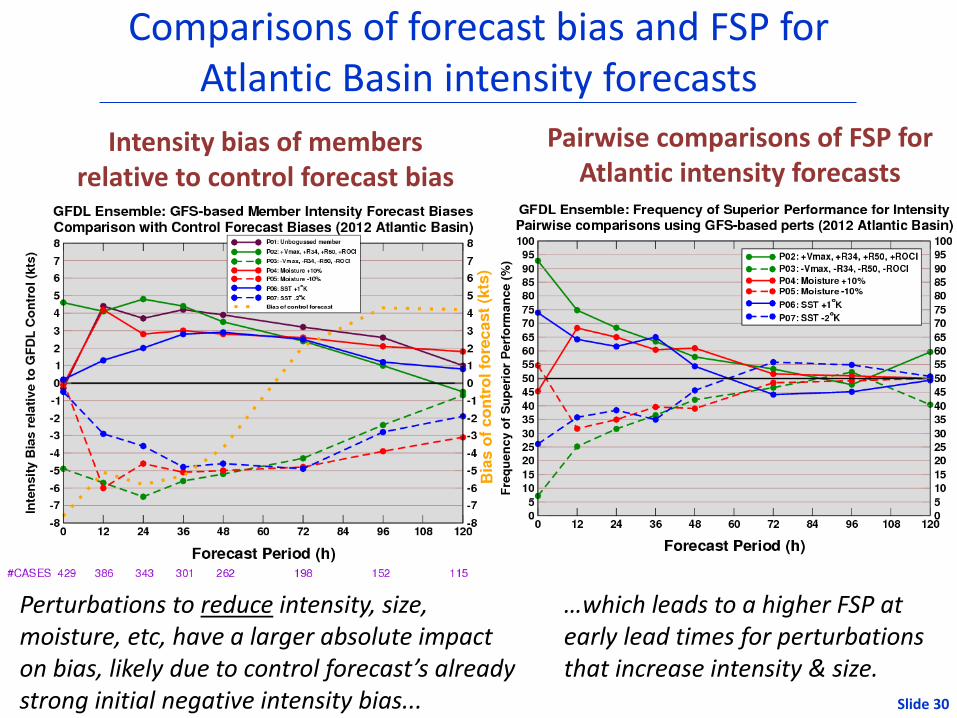
Comparisons of forecast bias and FSP for Atlantic Basin intensity forecasts
Slide 30
Intensity bias of members relative to control forecast bias
Pairwise comparisons of FSP for Atlantic intensity forecasts
Perturbations to reduce intensity, size, moisture, etc, have a larger absolute impact on bias, likely due to control forecast’s already strong initial negative intensity bias...
…which leads to a higher FSP at early lead times for perturbations that increase intensity & size.

Impact on Intensity Forecasts of Moisture Perturbations North and South of 20°N
Slide 31
Beyond 48h, there is a significant increase in the improvement from the moisture members for forecasts initiated south of 20oN.
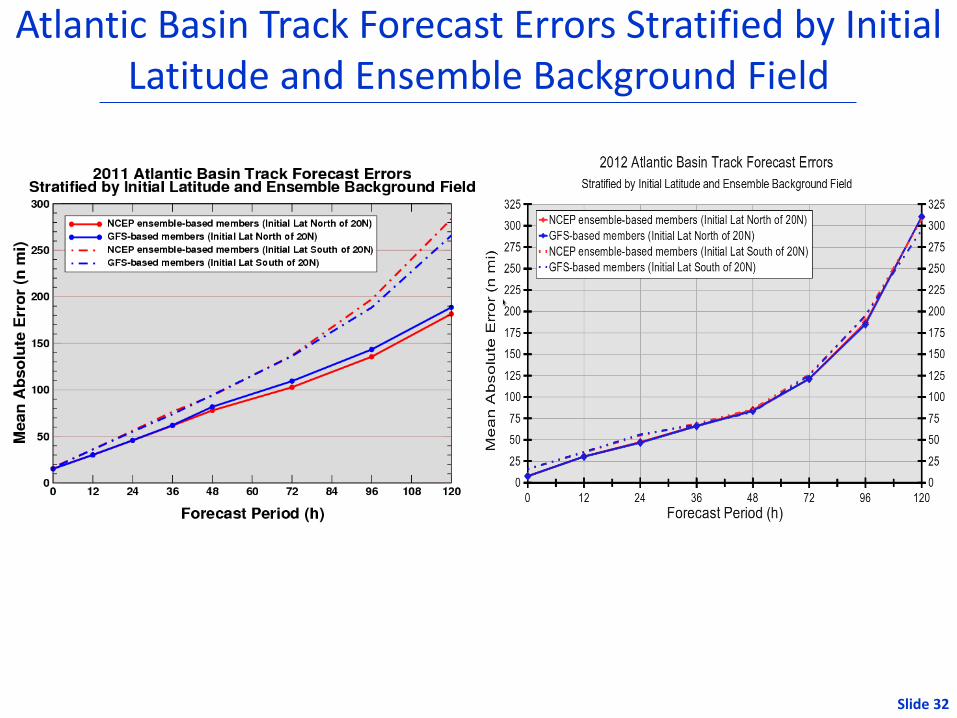
Slide 32
Atlantic Basin Track Forecast Errors Stratified by Initial Latitude and Ensemble Background Field
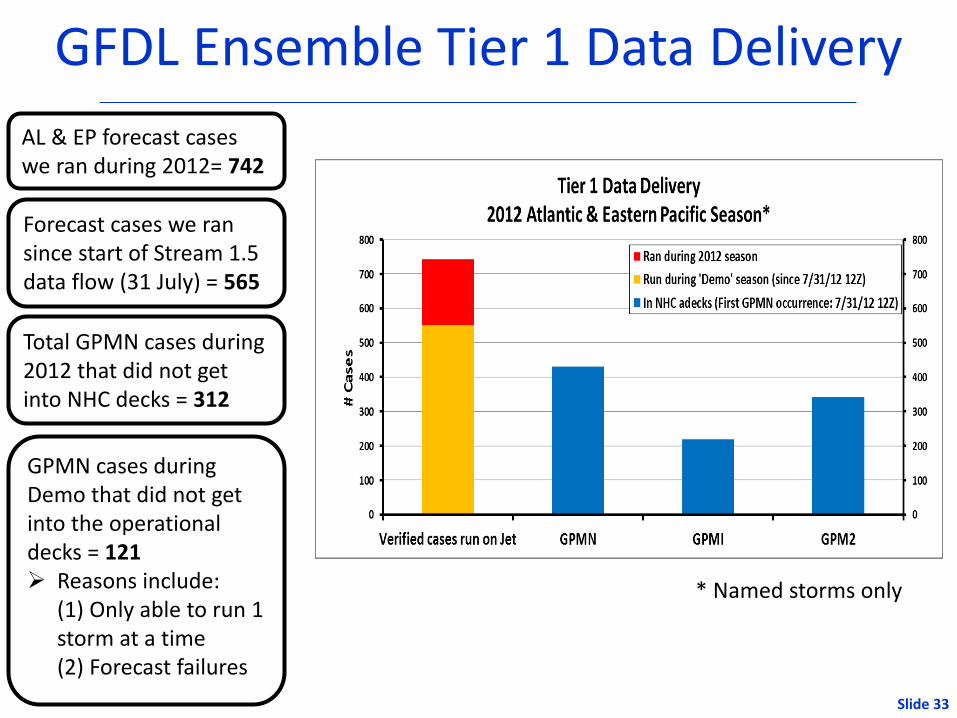
GFDL Ensemble Tier 1 Data Delivery
Slide 33
Forecast cases we ran since start of Stream 1.5 data flow (31 July) = 565
GPMN cases during Demo that did not get into the operational decks = 121 Reasons include:
(1) Only able to run 1 storm at a time (2) Forecast failures
AL & EP forecast cases we ran during 2012= 742
Total GPMN cases during 2012 that did not get into NHC decks = 312
* Named storms only
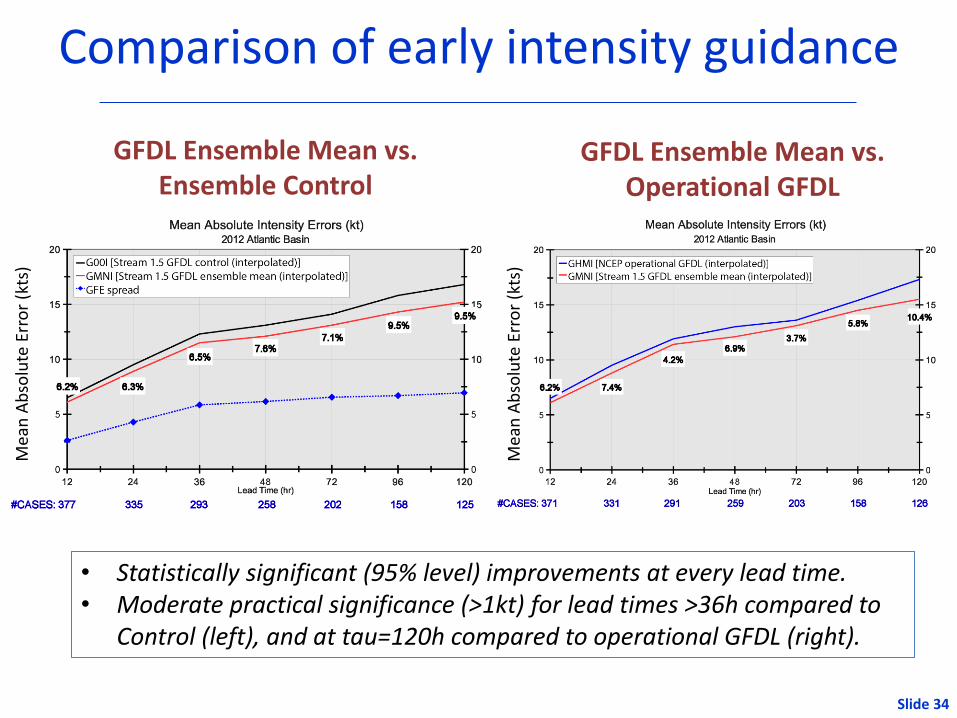
Comparison of early intensity guidance
Slide 34
Mea
n A
bso
lute
Err
or
(kts
)
Mea
n A
bso
lute
Err
or
(kts
)
GFDL Ensemble Mean vs. Ensemble Control
GFDL Ensemble Mean vs. Operational GFDL
• Statistically significant (95% level) improvements at every lead time. • Moderate practical significance (>1kt) for lead times >36h compared to
Control (left), and at tau=120h compared to operational GFDL (right).

Comparisons with other operational guidance
Slide 35
Intensity Track
• GFDL Ensemble mean (GMNI) was very competitive with top operational guidance for intensity forecasts (left), but with very little skill relative to Decay-Shifor (OCD5).
• GFDL Ensemble mean track forecasts (right) were slightly better than the operational GFDL, but not competitive with top operational guidance.
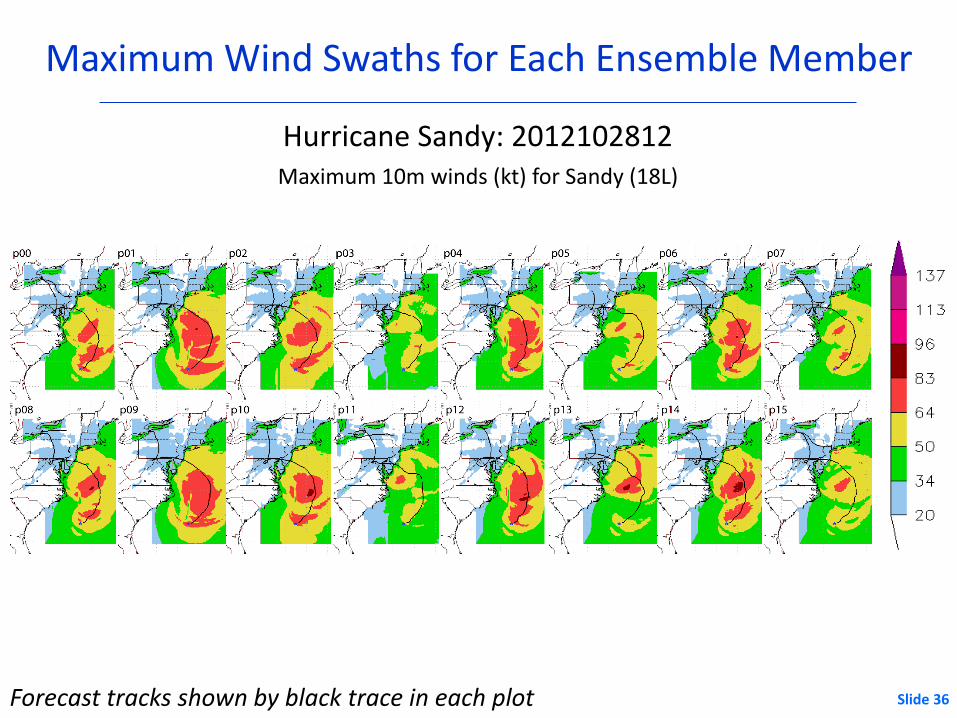
Forecast tracks shown by black trace in each plot
Maximum Wind Swaths for Each Ensemble Member
Maximum 10m winds (kt) for Sandy (18L)
Hurricane Sandy: 2012102812
Slide 36

Slide 37
Ensemble Wind Speed Probability Verification Sandy (18L) Init: 2012102812

Slide 38
• For Sandy, Brier
Skill Scores for 64-kt
wind speed
probabilities are
comparable between
the GFDL ensemble
and the Monte Carlo
model.
Ensemble Wind Speed Probability Verification
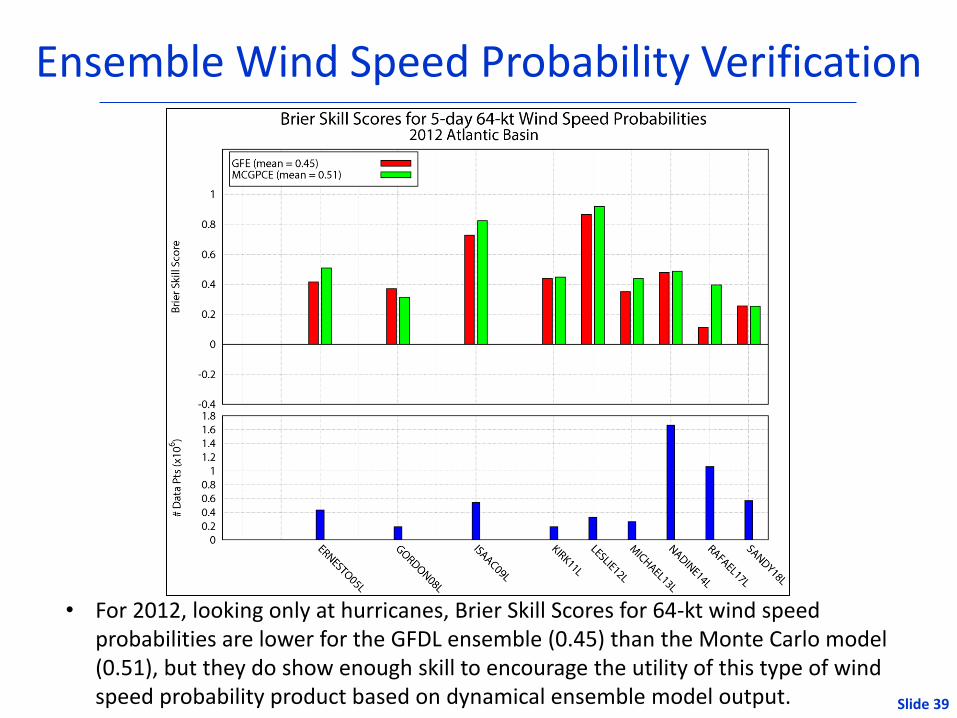
Slide 39
• For 2012, looking only at hurricanes, Brier Skill Scores for 64-kt wind speed probabilities are lower for the GFDL ensemble (0.45) than the Monte Carlo model (0.51), but they do show enough skill to encourage the utility of this type of wind speed probability product based on dynamical ensemble model output.
Ensemble Wind Speed Probability Verification

Outline
• GFDL ensemble overview & methods
• Results: 2012 Cases
• Results: Verifications
• Website and Real-Time Products
• Summary Slide 40
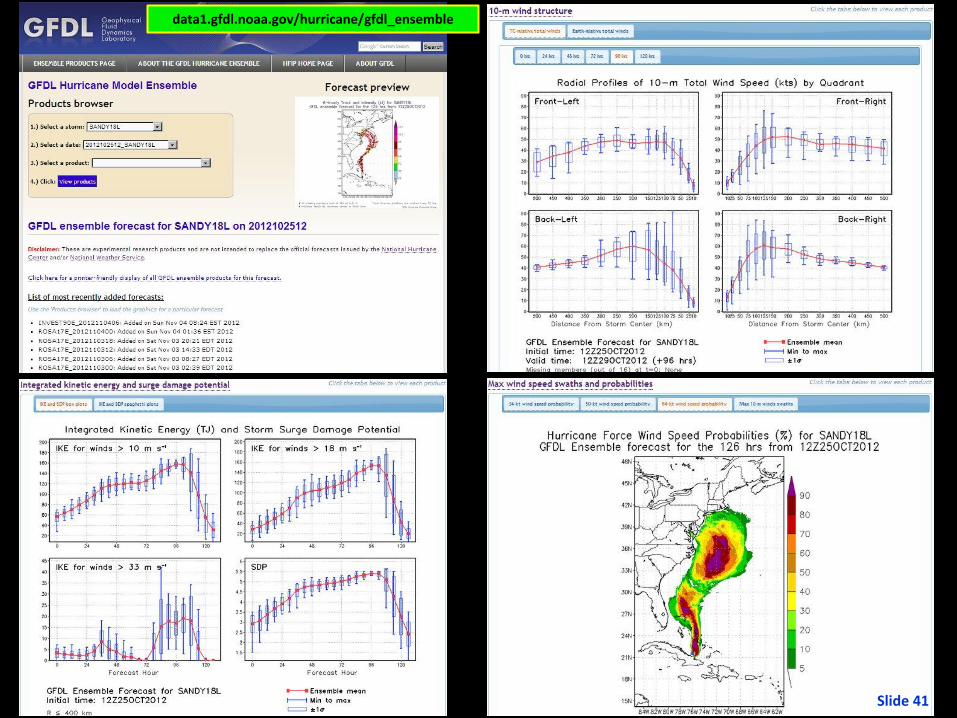
data1.gfdl.noaa.gov/hurricane/gfdl_ensemble
Slide 41

Cyclone Phase Space computed for each member
Hurricane Sandy: 2012102812
Slide 42
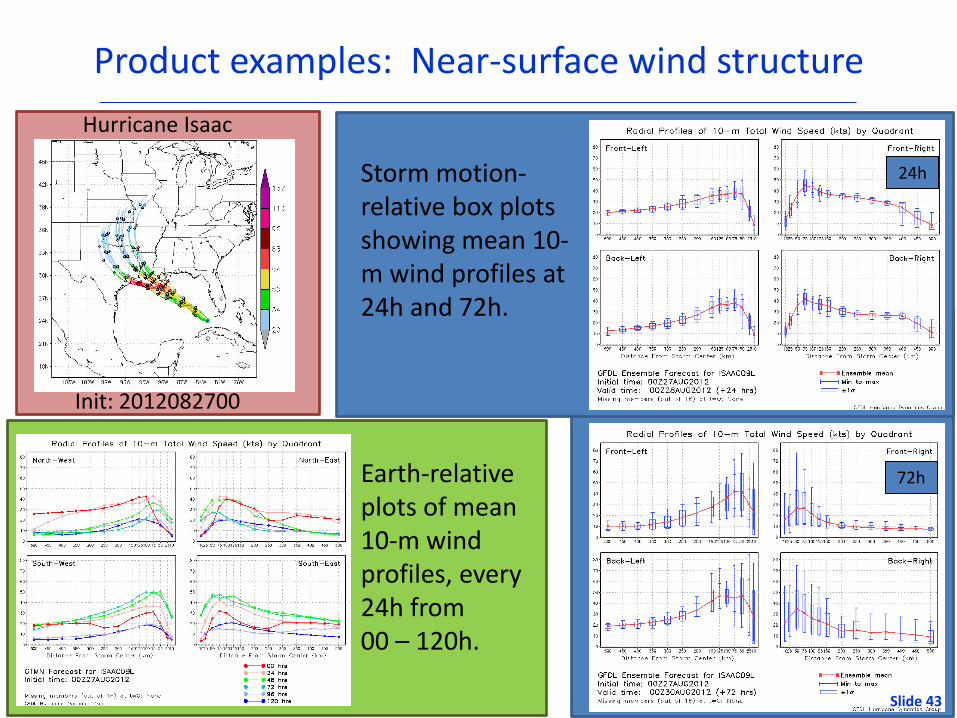
Product examples: Near-surface wind structure
Earth-relative plots of mean 10-m wind profiles, every 24h from 00 – 120h.
Earth-relative box plots showing mean surface wind profile at 72h.
24h
72h
Storm motion-relative box plots showing mean 10-m wind profiles at 24h and 72h.
Init: 2012082700
Hurricane Isaac
Slide 43

Summary
• Ensemble comprised of perturbations to the model vortex intensity and size, model moisture and SST fields, as well as background steering flow, was run for all Atlantic and eastern Pacific cases in 2012.
• For intensity, the ensemble mean forecasts in the Atlantic outperformed the control (G00I) and operational (GHMI) forecasts with statistically significant gains at all lead times, and with gains of moderate practical significance (>1 kt) over the control at lead times >36h, and over GHMI at 120h.
• For track, the ensemble mean forecasts in the Atlantic similarly outperformed G00I and GHMI with statistically significant gains at all lead times, but there were no gains that were considered to be of practical significance (>10 n mi).
Slide 44
Summary (cont.)
• For intensity, the member mean comprised of all +/- moisture members showed the most improvement over the control, especially at lead times >48h and for storms initialized south of 20N.
• Results for both track and intensity errors showed little difference between paired GFS- and GEFS-based members.
• Wind speed probability verification indicates potential for use of wind speed probability guidance from dynamical ensemble modeling systems.
• To be of more use in operations, work needs to be done to ensure forecasts complete in time for 6-h interpolation.
Slide 45
Page 46
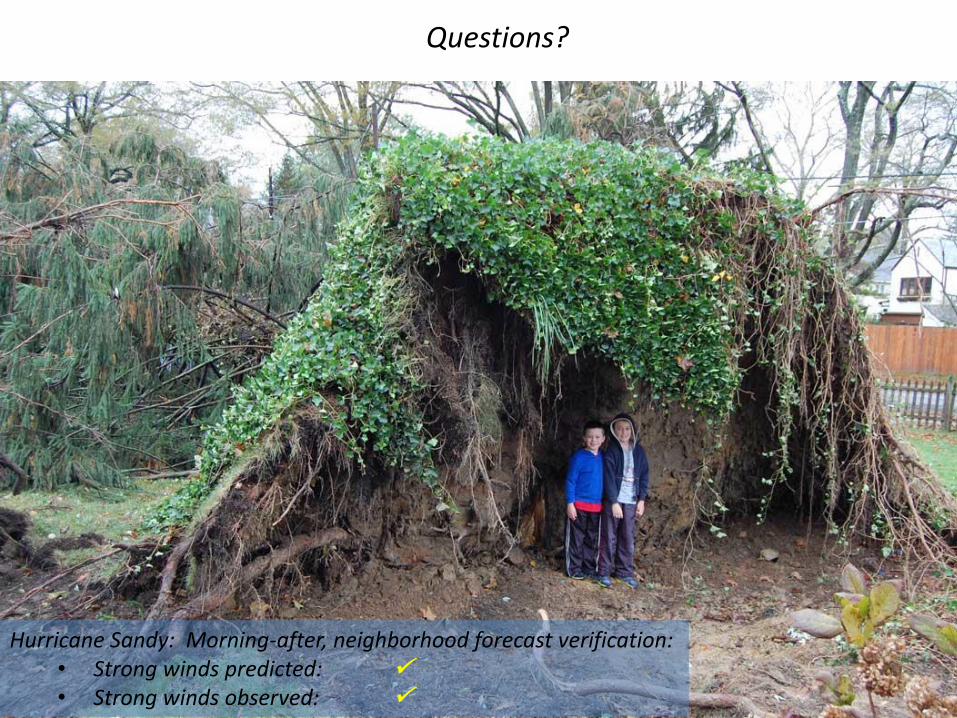
Questions?
Hurricane Sandy: Morning-after, neighborhood forecast verification: • Strong winds predicted: • Strong winds observed:

Extra Slides
Slide 47

Example: Moisture perturbations
Slide 48

Intensity Forecast Bias for Sandy
Slide 49

Track Forecast Errors for Sandy
Slide 50

Results: Intensity Forecast Verifications
Slide 51
Results: Intensity Forecast Verifications
Slide 52

Methods: Vortex size & intensity perturbations
• Created by modifying certain components of the GFDL synthetic axisymmetric vortex
– Perturbing certain “TC vitals” values from the NHC storm warning message
– Percentages shown below represent the typical max uncertainty in observations of cyclone wind size and intensity (per NHC recommendations)
Tropical Storm Isaac “vitals” for 00 UTC 27 August 2012
NHC 09L ISAAC 120827 0000 240N 0825W 285 062 0992 1007 0482 28 093 0334 0222 0148 0334 D 0111 -999 -999 0111 72 307N 895W
Max surface wind speed (m s-1) Perturbation = ±10%
Radius of outermost closed isobar (km) Perturbation = ±25%
Radii of 34-knot winds in each quadrant (km) Perturbation = ±25%
Radii of 50-knot winds in each quadrant (km) Perturbation = ±40% Slide 53

Differences between paired GFS/GEFS-based members were mostly not significant
Slide 54

![GFDL Summer School [2012] · Geophysical Fluid Dynamics Laboratory {insert date here} GFDL Summer School [2012] Introduction to NOAA/ GFDL Science V. Ramaswamy July 16, 2012. Geophysical](https://img.dokumen.tips/doc/110x75/5edc8ba6ad6a402d666740a3/gfdl-summer-school-2012-geophysical-fluid-dynamics-laboratory-insert-date-here.jpg)