Embed Size (px)
Citation preview

NBER WORKING PAPER SERIES
EXECUTIVE COMPENSATION:A NEW VIEW FROM A LONG-TERM PERSPECTIVE, 1936-2005
Carola FrydmanRaven E. Saks
Working Paper 14145http://www.nber.org/papers/w14145
NATIONAL BUREAU OF ECONOMIC RESEARCH1050 Massachusetts Avenue
Cambridge, MA 02138June 2008
We would like to thank George Baker, Edward Glaeser, Claudia Goldin, Caroline Hoxby, LawrenceKatz, and Robert Margo for their advice and encouragement throughout this project. Very helpfulcomments have also been received from Doug Elmendorf, Eric Hilt, Antoinette Schoar, Dan Sichel,and seminar participants at the DAE NBER meetings, AEA meetings, AFA meetings, and EHA meetings. We would also like to thank the staff at the Historical Collections and Danielle Barney of Baker Libraryfor making the data collection possible and Brian Hall and Jeff Liebman for providing us with theirdata. Yoon Chang, Yao Huang, Michele McAteer, Timothy Schwuchow, James Sigel, and AthanasiosVorvis provided outstanding research assistance. We gratefully acknowledge financial support fromthe Economic History Association, the Multidisciplinary Program in Inequality & Social Policy atHarvard University, and the National Science Foundation's Dissertation Completion Fellowship. Theviews in this paper do not necessarily reflect those of the Board of Governors of the Federal ReserveSystem, its staff, or the National Bureau of Economic Research.
NBER working papers are circulated for discussion and comment purposes. They have not been peer-reviewed or been subject to the review by the NBER Board of Directors that accompanies officialNBER publications.
© 2008 by Carola Frydman and Raven E. Saks. All rights reserved. Short sections of text, not to exceedtwo paragraphs, may be quoted without explicit permission provided that full credit, including © notice,is given to the source.

Executive Compensation: A New View from a Long-Term Perspective, 1936-2005Carola Frydman and Raven E. SaksNBER Working Paper No. 14145June 2008JEL No. G30,J33,M52,N82
ABSTRACT
We analyze the long-run trends in executive compensation using a new panel dataset of top executivesin large publicly-held firms from 1936 to 2005, collected from corporate reports. This historic perspectivereveals several surprising new facts that conflict with inferences based only on data from the recentdecades. First, the median real value of compensation was remarkably flat from the end of WorldWar II to the mid-1970s, even during times of rapid economic expansion and aggregate firm growth.This finding contrasts sharply with the steep upward trajectory of pay over the past thirty years, whichcoincided with a period of similarly large increases in aggregate firm size. A second surprising findingis that the sensitivity of an executive's wealth to firm performance was not inconsequentially smallfor most of our sample period. Thus, recent years were not the first time when compensation arrangementsserved to align managerial incentives with those of shareholders. Taken together, the long-run trendsin the level and structure of compensation pose a challenge to several common explanations for thewidely-debated surge in executive pay of the past several decades, including changes in firms' size,rent extraction by CEOs, and increases in managerial incentives.
Carola FrydmanMIT Sloan School of Management50 Memorial DriveE52-436Cambridge, MA 02142and [email protected]
Raven E. SaksU.S. Federal Reserve – Division of Research and St20th and C Streets NWWashington, DC [email protected]

1
1. Introduction
The compensation paid to CEOs of large publicly-traded corporations rose dramatically during
the 1980s and 1990s, stimulating much debate on the determinants of managerial pay (Murphy
1999, Hall and Murphy 2003). The discussion has been largely inconclusive, due partly to the
short time span of available data. By constructing a new long-run time series of executive pay
we are able to analyze the trends in the level and composition of pay over most of the twentieth
century. This new dataset allows us to differentiate between some of the most popular
explanations for the recent surge in compensation: managerial rent-seeking, a competitive labor
market for executives, and increases in managerial incentives.
To document the long-run trends in pay we hand collected a comprehensive panel dataset
on the compensation of individual executives based on proxy statements and 10-K reports from
1936 to 2005. Although our sample is mainly composed of executives employed in the largest
corporations in the economy, our results are broadly characteristic of the largest 300 publicly-
traded firms.
The data from earlier decades reveal several surprising facts that go against the current
view of top executive pay, which is primarily based on data from recent decades. First,
executive compensation was remarkably flat from the end of World War II to the mid-1970s, a
time in which firms grew rapidly. This stability contrasts sharply with the evidence from the
1980s to the present, when executive pay and firms expanded at almost the same rate. Thus, the
strong correlation between executive compensation and the aggregate market value of firms
documented in recent decades (Hall and Murphy 2003, Jensen and Murphy 2004, Gabaix and
Landier 2008) was much smaller prior to the mid-1970s.
2
A second finding that is surprising in light of inferences based on more recent data is that
stock option grants have been an important part of the compensation package since the 1950s.
Even though the value of option grants was low prior to the 1980s, executives have owned a
substantial number of stock options for the past 50 years. Using a measure of an executive’s
firm-related wealth that includes changes in the value of his holdings of stock and stock options,
we calculate consistent measures of the correlation between wealth and firm performance (often
called “pay-to-performance”) over the past 70 years. We confirm that this relationship
strengthened considerably from the 1980s to the present (Hall and Liebman 1998, Murphy
1999). However, this increase was not part of a long-run upward trend. The sensitivity of
changes in wealth to performance was about the same in the 1930s, 1950s and 1960s as it was in
the 1980s, but somewhat lower in the 1940s and 1970s. Although accurate for the 1970s, Jensen
and Murphy’s (1990) view that CEOs were paid as bureaucrats was not generally true in the past.
The strength of the incentives provided by these correlations is difficult to assess, but we find
that the magnitude of the correlation for most of our sample was not inconsequentially small.
Throughout most of the twentieth century, the wealth of an executive would have increased by
30 to 60 percent if she had been able to raise the firm’s rate of return from the 50th to the 70th
percentile of firm performance. Thus, recent decades were not the first period in which
compensation arrangements generated a strong link between the executives’ wealth and firm
value.
Although a comprehensive analysis of the causes of these trends is beyond the scope of
the present paper, the long-run data provide new evidence to evaluate some of the major
hypotheses for the recent surge in executive compensation. First, the run-up in CEO pay and the
expanded use of stock options have been linked to managers’ ability to extract rents from the

3
firm (Bebchuk and Fried 2003, Bebchuk and Fried 2004, Kuhnen and Zwiebel 2007). However,
both the level of pay and the use of options were lower from the 1950s to the 1970s than in more
recent years, even though corporate governance was arguably weaker in the earlier period. Thus,
this explanation does not seem to fit well with the changes in executive pay over time.
A second set of explanations relate executive pay to changes in firm size. High levels of
pay may be the result of firms’ competition for scarce managerial talent (Lucas 1978, Rosen
1981, Rosen 1982, Tervio 2007), leading to higher compensation in larger firms. Consistent
with this prediction, the cross-sectional correlation between the level of pay and a firm’s position
in the distribution of firm size was about 0.3 for most of our sample period. Extensions of this
theory also predict that compensation should rise along with increases in the size of the typical
firm in the market (Gabaix and Landier 2008). However, we find that shifts in the distribution of
firms’ market values over time were only weakly correlated with compensation prior to the mid-
1970s, casting doubt on the validity of this theory for earlier time periods. In addition, the
appearance of a strong correlation in more recent decades may be spurious, suggesting that this
model may not even explain the post-1970 growth in executive pay.
Another explanation for the high level of pay in recent years is the need to compensate
executives for the risk generated by a greater use of incentive pay since the 1980s.1 However,
we find a considerable sensitivity of managerial wealth to firm performance in the 1950s and
1960s and much weaker incentives in the 1970s without notable changes in the level of pay.
Thus, changes in pay-to-performance were not always accompanied by changes in the level of
compensation.
1 The optimal sensitivity of managerial wealth to firm performance may have increased in recent decades due to rising business risk (Inderst and Mueller 2006) or greater international competition (Cuñat and Guadalupe 2006)

4
It seems unlikely that these explanations can account for the long-run trends that we
document in this paper, suggesting that the major determinants of pay may have changed over
time. It is possible that the labor market for corporate executives operated differently in the past.
Other factors, such as improvements in board monitoring and changes in social norms, may also
have altered compensation arrangements. Thus, further studies of executive compensation
should address these long-run trends to improve our understanding of how the determinants of
pay have evolved over time.
2. Executive compensation data
A large fraction of the empirical research on executive compensation has focused on the period
after 1992 because data on managerial pay since that date are easily available in Compustat’s
Executive Compensation database (ExecuComp). The sources of these data are the proxy
statements of publicly-held corporations, which report the remuneration of the firm’s highest-
paid officers. Although ExecuComp does not start until 1992, the SEC has had similar
disclosure requirements since its inception in 1934.2 Thus, we construct a long-run panel dataset
on executive compensation by hand-collecting data for the years 1936 to 1991 from historical
proxy statements and 10-K reports, and using ExecuComp from 1992 to 2005.3 Although
disclosure requirements have evolved over time, firms’ corporate reports provide sufficiently
detailed information to allow us to track executive pay in a consistent manner over the longer
2 Corporations were required to disclose the compensation of top officers in 10-K reports starting in 1934, but many firms were reluctant to do so in the early years. By 1936 most of the firms included data on remuneration in these reports, and so we start our sample in that year. 3 Studies that have used proxy statements to study executive pay prior to1992 (although over shorter time periods than our sample) include Baker (1938), Roberts (1959), Lewellen (1968), Wattel (1978), Murphy (1985), Yermack (1995), and Hall and Liebman (1998). Due to differences in sample design and in the methodologies used to value the components of pay, these data cannot be used to provide a consistent description of the long-run evolution of pay.

5
run.4 These data are particularly important for constructing consistent measures of stock option
use, because options were valued differently in research conducted prior to the 1970s than the
common practice today.
To construct our dataset, we select the largest 50 publicly-traded corporations in 1940,
1960 and 1990. We identify the largest firms in 1960 and 1990 by ranking corporations in
Standard & Poor’s Compustat database according to their total value of sales. Compustat’s data
do not extend back to 1940, so for that year we rank firms in the Center for Research in Security
Prices (CRSP) database according to their market value.5 Because some firms appear among the
largest 50 in more than one year, our dataset covers a total of 101 companies. For each firm, we
collect annual data on the pay of the top officers for as many years as our sources allow. When a
firm in our sample merges with a firm outside of the sample, we continue to follow the
executives in the merged firm if the new firm retains the same name or if the industrial
classification of the new firm does not change (see Appendix Section 1.1 for details). The
resulting dataset is an unbalanced panel as companies enter and leave the sample over time.6
About 75 percent of the firms in our sample are in manufacturing industries, but our
dataset also contains communications, public utilities, and retail companies. Appendix Table A1
lists all of the firms in our sample and Appendix Table A2 shows the distribution of firms by 2-
digit SIC code.
4 Not only do these documents report information on salaries, bonus payments, stock options, and stock holdings, but they also contain detailed descriptions of compensation plans that allow for consistent measurement of each component of pay over time. 5 The considerable size of the data collection effort caused us to select a small number of firms based on rankings in three particular years. However, our intention was to select companies that were large for a reasonable period of time. Therefore, we use the value sales to measure firm size whenever possible, since it is less susceptible to transitory shocks than market value. A detailed description of the sample design is provided in the Data Appendix. 6 Firms enter the sample when they go public or when corporate records become available in the collection at the Baker Library of Harvard Business School (our main source of corporate reports). Companies exit the sample as they go bankrupt, become private, or are acquired by a foreign firm, among other reasons.

6
Because our dataset includes firms that were large at different points in time, it captures
some of the structural changes that were experienced by the economy over this 70-year period.
Although this sample is not representative of the economy as a whole, it comprises at least 20
percent of the market value of the S&P 500 in every decade, and more than 40 percent prior to
1970 (see Appendix Table A3). Because the sample includes all of the available years for each
of the selected firms, it reflects a broader segment of the economy than the largest 50 publicly-
traded firms alone. We discuss the representativeness of our sample in Appendix Section 3, and
conclude that it is representative of the largest 300 publicly-traded corporations. On the other
hand, the sample does not reflect the compensation practices of smaller or private firms.
Table 1 reports basic descriptive statistics of our main sample, which includes the three
highest-paid officers in each firm.7 There are more than 15,800 executive-year observations
between the years 1936 to 2005, for a total of 2,862 individuals. The job titles held by the
executives in our sample suggest that these officers were the main decision-makers in the firm
(see Table 2). More than 47 percent of these managers held the title “CEO,” “president,” or
“chairman of the board.”8 Furthermore, more than 80 percent of these officers also served on the
board of directors.
3. Long-Run Trends in Compensation
3.1 Trends in total compensation
7 Although we collected data on the five highest-paid officers in each firm whenever possible, corporate reports consistently listed only the three highest-paid officers prior to 1978. We limit our analysis to the top three officers in order to maintain a consistent group of individuals over time, but the results are robust to including the 4th and 5th highest-paid executives. 8 Restricting the analysis to CEOs is useful for comparing our sample to previous research, which has mainly focused on chief executive officers. Because the term “CEO” was not frequently used until the 1970s, identifying who held this title is not always straightforward. Previous studies suggest that this person was most often the president of the company, so we identify the president as the chief executive where the CEO is not explicitly mentioned (Mace 1971). In cases where we observe neither a CEO nor a president, we identify the chairman of the board as the CEO (about 2 percent of the observations).

7
Figure 1 shows the median real value of total compensation from 1936 to 2005.9 We define total
compensation as the sum of salaries, bonuses, long-term incentive payments, and the Black-
Scholes value of stock option grants. The figure reveals three distinct phases that form a J-
shaped pattern over the course of our sample period. During the first 15 years, the real value of
compensation fell from about $0.9 million to $0.75 million. Although more pronounced during
World War II, the decline in executive pay continued from the end of the war until the early
1950s. This period of deterioration was followed by 25 years of slow growth, averaging 0.8
percent per year from 1950 to 1975. Finally, the level of executive pay has climbed at an
increasing rate since the mid-1970s. Although compensation dipped briefly from 2001 to 2003,
it resumed a rapid rate of growth during the last two years of our sample. Thus, the rapid
increase in pay in the 1990s did not end with the collapse of the stock market boom in 2000.
More than 95 percent of the individuals in our sample fall above the 99.9th percentile of
the national distribution of wage and salary income documented by Piketty and Saez (2003).
Therefore, a comparison of executive pay to the earnings of a typical worker provides insight
into the evolution of earnings inequality at the top of the income distribution. We calculate
relative executive pay by dividing median compensation in our sample by average earnings per
full-time equivalent worker from the National Income and Product Accounts.
This measure of earnings inequality follows an even-more pronounced J-shaped pattern
over our sample period than the dollar value of executive pay (see the dashed line in Figure 1).
The real value of average earnings in the economy increased during the early years of our sample
even as the level of executive pay declined, leading to a sharp contraction in the gap between
these two groups from 1940 to 1944. Relative executive pay declined further until 1970, at
which point executive earnings began to rise faster than those of the average worker. By 1990, 9 Throughout the paper, real values are measured in year 2000 dollars using the Consumer Price Index.

8
relative executive pay had recovered its Depression-era level. The gap between executives and
workers expanded even further during the most recent 15 years, and by 2005 the median
executive in our sample earned 110 times average worker earnings—about twice the
corresponding ratio prior to World War II. Despite differences in the underlying source data
between our sample and the income tax records used by Piketty and Saez to calculate wage and
income shares, the trend in relative executive pay is similar to the share of the top 0.1 percent of
the national distribution of wage and salary income.10
3.2 The structure of executive compensation
Figure 2 decomposes the real value of total compensation into its three main components. The
short dashed line shows the median value of salaries plus any bonus that was both awarded and
paid out within the same year, which we refer to as a current bonus.11 These bonuses were
generally paid in cash, but some were also paid in company stock. The long-dashed line adds the
amount paid to each executive as part of a deferred bonus or long-term incentive payment.12 The
solid line, which replicates the real value of total compensation shown in Figure 1, adds the
Black-Scholes value of stock option grants.
10 Piketty and Saez use income tax records to estimate shares of aggregate wage and salary income. One disadvantage of income tax data is that they only contain information on the gains from exercising options. We use the value of stock option grants, which reflects the value of pay at the time of the award more accurately, and are not affected by subsequent movements in the firm’s share price or by the executive’s decision when to exercise the options. Moreover, the vast majority of employee stock options during the 1950s and 1960s were taxed as capital gains, and so would not have been reported on income tax returns as wages and salaries. Rather, they would have appeared as capital gains, but only upon the sale of the stock that had been purchased when the option was exercised. 11 Although it would be useful to separate salaries from current bonus payments, many firms reported only the sum of the two prior to 1992. In firms that did report these payments separately between 1947 and 1991 (about 20 percent of the sample in these years), the value of current bonus payments usually ranged between 20 and 45 percent of current pay, with no obvious trend. Therefore, grants of current bonuses do not appear to have followed the same upward trend as the use of long-term pay (discussed below). 12 We measure bonuses as the amount received during the year rather than the amount awarded (to be paid in the future) for consistency, because Compustat and some earlier proxy statements do not report information on the value of bonuses awarded.

9
During the first twenty years of our sample, compensation was composed mainly of
salaries and current bonuses. Although long-term bonuses were awarded to some executives as
early as the 1940s, they were not common enough to make a noticeable impact on median pay
until the 1960s.13 These long-term bonuses were usually based on the firm’s profits or net
income, with payment in cash or stock distributed in equal installments over a certain number of
years.14 These bonuses became a greater share of compensation over time, reaching more than
35 percent of total pay by 2005.
Stock option grants have also become a larger fraction of compensation over the course
of our sample period. Among executives receiving an option award, the median value of grants
fluctuated between 15 and 30 percent of total compensation from the mid-1950s to the mid-
1980s. The upper end of this range is not much less than the median value of 37 percent during
the option boom of the late 1990s, suggesting that options have been an important component of
executive pay since mid-century.15
Because the value of an option award relative to the total pay of those executives being
granted options has not risen greatly over time, the increasing importance of stock options
relative to median total compensation is largely due to an upward trend in the frequency of
grants. The use of employee stock options was almost negligible during the 1930s and 1940s. In
1950, tax reform legislation introduced the restricted stock option, a special type of option that
was taxed as a capital gain instead of as labor income. Consequently, executives paid a marginal
13 The 1950s were not the first period when incentive compensation mechanisms were a part of managerial pay. Historical accounts suggest that both current and deferred forms of incentive compensation were almost negligible prior to WWI but became commonly used during the 1920s (Taussig and Barker 1925, Baker and Crum 1935, Baker 1938, Roberts 1959). With the onset of the Depression and large declines in firm profits, many bonus plans were abandoned or suspended (Baker 1938). 14 The deferral period was generally around 5 years, although individual plans varied from 2 to 10 years. 15 The popular press also highlighted the significance of options as a form of executive remuneration during this earlier period, with headlines such as “Option Opulence” (Wall Street Journal, Feb. 1 1955) and “Stock Options Popular” (New York Times, Mar. 26, 1958).

10
tax rate on these options of only 25 percent instead of the 70 to 90 percent marginal rate they
faced on labor income. More than 40 percent of the firms in our sample instituted a restricted
stock option plan in the 5 years following this reform, suggesting that this tax policy had a
significant impact on executive pay.
Despite the proliferation of restricted stock option plans during this period, the awards
made under these plans were sporadic at first. Throughout the 1950s, only about 16 percent of
the executives in our sample were awarded an option in any given year. The frequency of stock
option grants has increased steadily since then. By the 1990s, the fraction of executives
receiving an option had reached 82 percent (see Figure 3).
Prior research on executive pay has found more infrequent option use during the 1970s
and the early 1980s than we find in our sample (Hall and Liebman 1998, Jensen and Murphy
2004, and Murphy 1999).16 The difference between our results and prior research can be partly
explained by firm size. Our sample is more heavily weighted towards large firms than other
samples, and large firms tend to grant options more frequently. However, several measurement
issues are also important in explaining these discrepancies. First, prior work on option use in the
1970s has relied on data on the gains from exercising options rather than direct evidence on
option grants. In our data, the probability of being granted an option during the 1970s was 16
percentage points higher than the probability of exercising an option, possibly due to poor stock
market performance during this period.17 The high frequency of stock option grants in our
sample is also related to the treatment of multi-year reporting of options. Many proxy statements
16 There is little evidence in prior research on the use of employee stock options prior to the 1970s. Lewellen (1968) provides a notable exception for the period 1940 to 1963. Although he claims that stock options were a much more important share of executive pay than our data suggest, his method of valuing options is substantially different from ours and is likely biased upward. See Section 3.2 of the Appendix for details. 17 The downturn in the market made the repricing of options a common practice during the 1970s. We exclude repriced options from our estimates of grants whenever it is possible to identify them.

11
issued from the late 1960s to the late 1980s reported option grants and exercises as 3- or 5-year
cumulative totals, making it difficult to ascertain the actual number granted or exercised in each
year. While our treatment of multi-year reporting biases the frequency of grants upwards, the
average and median values of options granted are unbiased. See Sections 2.2 and 3.2 of the
Appendix for further details.
3.3 Other forms of compensation
Our analysis does not include information on two other components of pay: pensions and
perquisites. Although proxy statements provide descriptions of pension plans, we are unable to
estimate the value of these benefits because many plans were based on an age-tenure profile of
the managers and we lack this information on most of the managers in our sample. We exclude
perquisites because firms were not required to report any information on this type of pay until the
late 1970s.18
The omission of pensions and perks may bias our estimate of the trend in total
compensation because they are not subject to personal income taxes at the time they are awarded,
so these methods of pay may have been more common in the 1950s and 1960s when tax rates
were particularly high. Thus, the growth rate in total pay (including both observed and
unobserved forms of compensation) may have been faster during these earlier decades than in
later years when the tax advantage of pensions, perks, and other non-taxable benefits was
smaller.
18 Regulation introduced in 1978 required firms to disclose the total amount of remuneration distributed or accrued in the form of securities or property, insurance benefits or reimbursement, and personal benefits. Perquisites and other personal benefits (above a minimum threshold) have been separately reported since 1993. However, the accuracy of data on perks is limited, and so most research has focused on whether a certain perk was offered rather than on its actual value (Rajan and Wulf 2006, Yermack 2006)

12
On the other hand, evidence from Lewellen (1968) suggests that pensions cannot account
for the low rate of growth in executive compensation observed during the 1950s and 1960s. He
reports that the after-tax value of retirement benefits was 15 percent of after-tax total pay from
1950 to 1963. Because pensions were taxed at a lower rate than cash compensation, the pre-tax
value of pensions relative to total pay was even lower than 15 percent. By contrast, Sundaram
and Yermack (2006) find increases in the actuarial value of pensions to be about 10 percent of
total CEO pay from 1996 to 2002, and Bebchuk and Jackson (2005) report a ratio of executives’
retirement benefits to total pay received during their entire service as CEO of about 34 percent in
2004. Thus, pensions do not appear to have been a larger fraction of total compensation in the
1950s or 1960s than they are today.
Furthermore, the following back-of-the-envelope calculation suggests that the combined
value of pensions, perquisites and other untaxed benefits would need to have been implausibly
large to explain the low growth rate of pay during the 1950s and 1960s. For the observable types
of compensation in our dataset, median pay increased from $0.74 million in 1950 to $0.82
million in 1970, an annual average growth rate of 0.5 percent. By contrast, median pay increased
by a factor of 4.4 from 1980 to 2000. If we assume that the value of unobserved forms of pay
was zero in 1950, these unobserved benefits would need to have amounted to $2.4 million in
1970 in order to achieve a rate of increase in total compensation similar to the 1980 to 2000
period ($0.74*4.4-$0.82=$2.4 million). This amount is almost three times higher than the
median level of salaries, bonuses and stock options at that time and strikes us as implausibly
large. Moreover, this number underestimates the necessary value of non-taxable benefits in 1970
if the actual level of unobserved benefits was greater than zero in 1950. Thus, while pensions
and perks may partly explain the slow growth rate of pay documented during the 1950s and

13
1960s, it is doubtful that including these benefits would alter our finding of a much lower rate of
increase in total pay during this period relative to later decades.
3.4 Differences among executives
Table 3 shows total compensation at the 10th, 25th, 50th, 75th and 90th percentiles of our sample.
The general pattern over time is similar across all groups, with relatively slow growth from the
1950s to the 1970s followed by large increases in the past 25 years. In contrast, the decline in
real pay that occurred during the 1940s was experienced only by executives at the higher end of
the distribution. Thus, this sharp contraction in the income distribution of executives suggests
that the “Great Compression” (Goldin and Margo 1992) occurred even among some of the
highest-paid individuals in the nation.
Increases in compensation during the last 20 years of our sample were more pronounced
for higher-paid executives. Whereas the ratio of pay at the 90th to the 50th percentile fluctuated
between 1.8 and 2.4 from 1936 to 1986, by 2005 this gap had risen to more than 3.5. This
widening inequality among managers is also reflected in the average level of executive pay (see
Table 3), which is more influenced by large outliers than the median. The difference between
mean and median compensation was relatively small and stable prior to the 1980s, but grew
substantially since then. In the 2000-2005 period, the average executive in our sample earned
nearly twice the remuneration of the median officer.
The fanning out of the distribution in executive pay has coincided with an increase in the
return to holding the title of “CEO.” The median ratio of a CEO’s total compensation relative to
the average pay of the other two highest-paid officers in his firm was 2.6 in the 2000-2005
period, a marked increase from the relatively steady ratio of 1.4 that prevailed prior to 1980 (see

14
Table 3).19 Nevertheless, increases in level of pay for non-CEOs were also substantial.
Therefore, the patterns documented in this paper are not specific to CEOs, but characterize the
remuneration of top management more generally.
3.5 Representativeness of the sample
Although the trends in pay are roughly similar for all of the executives in our sample, it is not
clear how well they reflect more general patterns in the compensation of top officers in the
economy. For one reason, the individuals in our sample were employed mainly in the largest
publicly-traded firms, where pay tends to be higher (Roberts 1956, Kostiuk 1990, Rosen 1992).
Thus, our data do not necessarily reflect remuneration practices in smaller firms. An added
consideration is how to interpret our data at points in time that are not close to 1940, 1960, or
1990—the years in which the firms in our sample were selected to be among the largest in the
economy. We evaluate the representativeness of our sample in Appendix Section 3, and
highlight the main results of that analysis here.
A simple graph of median pay in firms of different sizes shows that the trends in total pay
are similar in both the larger and smaller firms in our sample (see Figure 4). Managers of larger
firms were paid more, but compensation increased markedly in all firm-size categories during the
last 25 years. Similarly, compensation stagnated from 1950 to 1980 in firms of all sizes in our
sample. In Appendix Section 3.1 we evaluate the representativeness of salaries and bonuses in
our sample from 1970 to 2005 by comparing them to pay in similar-sized firms from other larger
datasets. Our data are similar to the other samples for firms that are among the largest 300 in the
economy, suggesting that salaries and bonuses in our sample are representative of this group.
19 We identify the CEO as the president of the company in firms where the title “CEO” is not used (see footnote 8). Results are similar if the chairman of the board is used instead.
15
We also evaluate the representativeness of our data over our entire sample period by assigning a
weight to each firm that is inversely proportional to its probability of being selected among the
500 largest publicly-held firms in each year. The unweighted median level of pay in our entire
sample closely matches the weighted median of the largest 300 firms in the economy.
In addition to offering a higher level of pay, large firms may also structure the
compensation package differently. Somewhat surprisingly, we do not find a strong correlation
between firm size and the share of stock options in total pay. Hall and Liebman (1998) find a
stronger positive relationship between option use and firm size in a sample that is more
representative of publicly-traded firms in the S&P 500 from 1980 to 1994. We attribute this
discrepancy to the fact that the smaller firms in our sample are only included if they were large
earlier on, if they will grow larger later in the sample, or if they are experiencing a temporary
negative shock. Therefore, the structure of pay in these firms may not be representative of the
typical small firm in the economy. In Appendix Section 3.3, we use the relationship between
option grants and firm size in the Hall-Liebman data to correct the level of total pay for the firms
in our sample. This exercise has little effect on the median level of total compensation in our
data and does not alter our conclusions about the long-run evolution of executive pay.
3.6 Interpreting the trends in the level of pay
It is doubtful that any single factor can explain the long-run trends in executive compensation,
and an analysis of all of the potential determinants of pay is beyond the scope of this paper.
Nevertheless, a long-run perspective adds new evidence against which to examine some of the
proposed explanations for the recent growth in compensation. We discuss some of these theories
below and investigate two in greater detail in the remaining sections of the paper.

16
Outsized increases in the level of total pay and stock option grants in recent decades have
often been related to managers’ ability to extract rents (Bebchuk and Fried 2004). However, the
long-run trends in pay seem inconsistent with this theory because both external and internal
corporate governance mechanisms were most likely weaker earlier in the century (Jensen 1993,
Holmstrom 2005). Among the firms in our sample, the median fraction of the board of directors
occupied by officers of the firm fell from 0.42 in 1950 to 0.18 in 1990.20 More generally, proxy
fights and takeovers were rare prior to the 1980s (Holmstrom and Kaplan 2001), boards of
directors have become smaller and more independent since mid-century (Lehn, Patro, and Zaho
2003), and both the ownership of institutional shareholders and shareholder activism have
increased since the 1950s (Khurana 2002, Gillian and Starks 2007). These aspects of corporate
governance are not comprehensive, nor do they rule out a positive effect of poor corporate
governance on compensation, but nevertheless they suggest that the ability of executives to set
their own pay may have diminished over time.21 On the other hand, improvements in board
diligence over time may actually have contributed to the upward trend in executive pay
(Hermalin 2005).
A second proposed explanation for recent increases in executive pay is related to
managerial talent and the labor market for executives. Theories of the span of control (Lucas
1978, Rosen 1982, Rosen 1992), superstars (Rosen 1981), and competitive assignment of CEOs
to heterogeneous firms (Tervio 2007, Gabaix and Landier 2008) predict a positive correlation in
the cross-section between firm size and compensation. In fact, a vast number of studies have
documented that CEO pay tends to be 0.3 percent higher in firms that are 1 percent larger (Rosen
20 Board membership was constructed by matching the names of the executives in our data to a list of the board directors from Moody’s Manual of Investments. Thus, the fraction of insiders in the board is probably underestimated since we lack information on grey directors. 21 For example, Bertrand and Mullainathan (2001) find that executives in corporations with weak corporate governance are remunerated for lucky outcomes.
17
1992). Moreover, extensions of these models propose that the variation in compensation over
time is related to aggregate firm size (Gabaix and Landier 2008). This framework seems
promising because recent decades have experienced large increases in both the level of pay and
the value of publicly-traded firms (Hall and Murphy 2003, Bebchuk and Grinstein 2005, Gabaix
and Landier 2008). However, the long-run trends are inconsistent with this hypothesis, as the
relationship between compensation and the market value of firms has not always been as strong
as it was in the past 25 years. Aggregate market capitalization (measured by the S&P 500 index)
increased considerably during the 1950s and 1960s, but the level of pay experienced little change
(see Figure 5).22 In Section 4 we present further evidence on the link between executive
compensation and firm size in order to better assess the role that this connection may have in
explaining the long-run evolution of managerial pay.
A third proposal relates the upward trend in compensation to the rising use of incentive
pay since the 1980s, as higher remuneration may be necessary to compensate executives for a
riskier stream of income. Among other problems, this hypothesis has been difficult to assess
because consistent estimates of the correlation between pay and performance are only available
since to the 1980s, a period of simultaneous increases in the level of pay and in pay-to-
performance. We return to this issue in Section 5 by calculating consistent measures of pay-to-
performance that span the past 70 years.
4. The relationship between the level of executive pay and firm size
4.1 Decomposition of the correlation between total compensation and firm size
22 Prior studies of executive pay relied on the gains from exercising options to value options prior to 1980, but these values are mechanically correlated with the market value of firms. Because we calculate the value of stock options granted using the Black-Scholes formula for the entire sample, our measures of total pay are not subject to this concern.

18
To better understand the relationship between firm size and the level of pay, Table 4 fully
decomposes this correlation into three main components: average firm size in each year
(reflecting the size of a typical firm in the market), average size of each firm across all years
(reflecting firm-specific factors), and the difference of firm size in each year from these year-
specific and firm-specific averages (reflecting transitory changes in firm size that are unrelated to
market fluctuations). We estimate the correlation between each of these factors and the
compensation of each executive in our sample from the following OLS regression:
0 1 2 3( ) ( ) ( ) ( ) ( ) ( ) [1]ijt t j jt t j ijtLn Compensation Ln S Ln S Ln S Ln S Ln Sβ β β β ε⎡ ⎤= + + + − − +⎣ ⎦
where Sjt is firm j’s size in year t, tS is the average size across all firms in our sample in year t,
and jS is the average size of firm j across all years. We measure firm size using the firm’s
market value and break the sample into two periods in order to examine how these correlations
have changed over time.23
Firm-specific and idiosyncratic components of firm size had a positive and significant
effect on compensation over the entire sample period (the coefficients were both around 0.2 to
0.3, and did not vary noticeably across periods). However, the role of aggregate market value
has changed markedly over time. During the second half of our sample, the relationship between
executive pay and the average market value of firms was roughly 1-for-1 (col. 3).24 However,
we estimate a much smaller coefficient of 0.1 in the first 40 years of our sample (col. 1). This
23 We use the average across firms to represent aggregate market size because it fits easily into a variance decomposition framework. However, our results are robust to using other proxies for aggregate market size including the median market value in our sample, average and median market value in the largest 500 publicly-traded firms, and the S&P index. 24 These results are in line with the effects reported by Gabaix and Landier (2008), who use a much larger sample of firms from ExecuComp from 1992 to 2004.

19
result cannot be explained by unusual factors related to the Depression or World War II, as we
find a similarly small coefficient for the period 1946 to 1975 (col. 2).25
The bracketed values in Table 4 report the fraction of the variance in compensation that
can be accounted for by each of the independent variables.26 The firm-specific component of
size explains between 13 and 17 percent of this variation in both periods, while idiosyncratic
shocks to firm size account for another three to four percent. By contrast, the importance of
aggregate firm size has changed substantially over time: it explains between 25 to 30 percent of
the variation in pay from 1976 to 2005, but only two percent in the first half of our sample. The
second panel of the table replaces the average size of each firm with a firm fixed effect,
providing a more flexible way to control for firm-specific factors. The estimated coefficients on
the other two variables are unchanged. Thus, the cross-sectional relationship between firm size
and executive pay has remained relatively stable over the past 70 years, while upward and
downward shifts in the distribution of firm size have only affected the level of compensation
more recently.27
4.2 Potential explanations for the changing role of aggregate market size
These preliminary results suggest that the dynamics of compensation arrangements have changed
over time. One reason for this change could be that the level of pay is currently tied to
contemporaneous fluctuations in firm size, whereas it was more responsive to lagged firm size in
25 These results also cannot be explained by an asymmetric response of pay to increases and decreases in firm size. When we interact average market size with a dummy variable indicating years of decline in aggregate market size, the estimated coefficient on the interaction term is zero in both sample periods and the coefficients on average firm size are unchanged. 26 These results are based on an ANOVA decomposition for each sample period. The fraction of the variance explained by each independent variable is the sum of squared residuals explained by that variable relative to the total sum of squared residuals of ln(compensation). 27 In Appendix Table A7, we show that the strong correlation between compensation and aggregate firm size was limited to the 1980s and 1990s. For all other decades in our sample, average market value accounts for less than 1 percent of the variation in executive pay.

20
the past. For example, this difference in timing would result from switching from accounting-
based to market-based measures of firm performance when determining incentive pay.
However, panel 3 of Table 4 shows little support for this conjecture. Although the average
market value in the previous year had a larger effect on compensation than the current value
during the earlier sample period, the sum of these two coefficients is still considerably smaller
than the corresponding sum in recent years.
Alternatively, our estimated coefficients in the earlier period may be biased downwards if
firms responded to the high personal income tax rates during this period by increasing
components of pay that we do not observe, such as pensions and perks. However, an exercise
similar to our back-of-the envelope calculation in Section 3.3 suggests that it is unlikely that
these components alone can explain the significant change in the correlation between aggregate
market size and the level of pay.28 If the growth rate of total compensation has a one-to-one
correlation with aggregate firm size (as we find for the recent period), the level of compensation
should have increased by a factor of 3.3 from 1950 to 1968. In this case, unobserved forms of
pay would need to have amounted to $1.6 million by 1968, an improbably high level of perks
and other benefits.
A third potential explanation is that the relevant measure of firm size has changed over
time. However, our results are robust to using the value of sales instead of market value (see
cols. 3 and 4 of Table 4).29 Although the coefficients are two to three times larger for aggregate
sales than aggregate market capitalization, the distribution of sales is far more dispersed (as
indicated by the standard errors) and the fraction of the variance of compensation explained by
28 To further study the implications of tax policy for the correlation of the level of pay and firm size, we have also analyzed the relationship between after-tax compensation and size. While the after-tax correlation of pay with average market size is stronger for the 1945-1975 period than the correlation with pre-tax compensation, it is still markedly weaker than the relationship between pay and firm size in later decades. 29 We could also consider firm earnings as a size proxy, but we lack data on this variable prior to the 1950s.

21
each of these variables is about the same. Thus, using the value of sales as an alternative
measure of firm size still suggests that the importance of the aggregate market was much smaller
earlier in the century.
It is tempting to conclude that aggregate firm size has become a key determinant of
executive pay during the past 30 years. However, these coefficients are only correlations and
may be biased by spurious upward trends in firm size and the level of compensation. Indeed,
adding a quadratic time trend to the regression reduces the coefficient on average market value a
bit (panel 4 of Table 4). Moreover, tests for non-stationarity cannot reject the null hypothesis
that there is a unit root in the residuals of equation 1 in either period.30 To address this concern,
we estimate the relationship between changes in compensation and changes in firm size (panel 5
of Table 4). The estimated effects of both the average size of the market and the idiosyncratic
component of firm size are notably smaller in this specification, and they both explain a much
smaller fraction of the variance in changes in pay than the corresponding specification in
levels.31 Thus, the seemingly-strong correlation between average firm size and the level of pay
of the past several decades may be driven by spurious correlation between the two variables.
In sum, a firm’s relative position in the distribution of firm size has accounted for about
20 percent of the variation in the level of compensation for our entire sample period. By
contrast, aggregate market size has become more strongly correlated with the level of executive
pay since the 1970s, although this relationship may be spurious.
30 Using Pesaran's (2007) panel unit root test, the null hypothesis of non-stationarity in the residuals of the second period has a p-value of 0.59. Therefore the presence of a unit root in the residuals cannot be ruled out. The p-value for the residuals in the early period is 0.01, suggesting that there is less likely to be a trend in the residuals in the first half of the sample. 31 Evidence from both Hall and Liebman’s 1980-1994 and ExecuComp’s 1992-2005 datasets confirms this result. Using the Hall-Liebman data, we find an elasticity of CEO pay with respect to average market value of 0.85 and the elasticity with respect to the idiosyncratic component of firm size of 0.32. The coefficients are -0.10 and 0.28 respectively for the specification in changes. Using all of the executives in ExecuComp, we find that the effect of average market value falls by half when the regression is estimated in changes instead of in levels.

22
5. The evolution of pay-performance sensitivities over time
Sparked by the rise in stock option use and a concurrent surge in the level of executive pay, a
marked increase in the correlation between managerial wealth and firm performance during the
past 20 years has brought agency problems to the forefront of research in executive
compensation (Murphy 1985, Jensen and Murphy 1990, Gibbons and Murphy 1990, Aggarwall
and Samwick 1999, Bertrand and Mullainathan 2001, Bebchuk and Fried 2004). Although the
recent surge in attention may lead to an impression that the conflict between managers and
shareholders was not important in earlier times, this topic has been a concern ever since the
separation of corporate ownership from corporate control in the early twentieth century (Baker
and Crum 1935, Berle and Means 1932, Chandler 1977). However, a scarcity of data from
earlier time periods has limited empirical studies of the long-run evolution of managerial
incentives.32 The availability of detailed information is particularly important for the case of
options, because changes in the value of stock option holdings account for a considerable portion
of the increase in pay-to-performance during recent decades (Hall and Liebman 1998). Studies
of option use prior to the 1970s used different methods to value options, and most estimates of
managerial incentives did not include stock option revaluations. Because our dataset allows us
to construct the portfolio holdings of stock and stock options for each executive, we are able to
calculate consistent estimates of the sensitivity of managerial wealth to firm performance over
the longer run.
5.1 Defining the appropriate measure of executive pay
32 We are only aware of one study that measures pay-to-performance using a long-term series. Boschen and Smith (1995) provide estimates from 1948 to 1990, but their sample may not show the entire picture because it is based on only 16 firms and does not include executives’ holdings of stock and stock options.

23
Managerial decisions are influenced not only by the remuneration awarded in a given year but
also by any other change in wealth that is tied to the performance of the firm (Jensen and
Murphy 1990, Hall and Liebman 1998). Since the value of equity and stock options in the firm
depends on firm value, a comprehensive analysis of pay-to-performance should include
revaluations of an executive’s stock and stock option holdings.33
By depicting the long-run evolution of option awards and holdings, Figure 3 shows that
stock options were already a major component of wealth by the 1960s. Although the fraction of
executives receiving stock options prior to the 1980s was relatively modest, the fraction of
individuals holding options was large. For example, 28 percent of the executives were granted
an option in any given year in the 1960s, but more than 64 percent held options during this
period. This difference arises because options had a long duration and vested slowly over time.
Options are now a regular part of the compensation package, so almost all executives receive and
hold options in a given year.
Equity holdings of top executives have declined over the century relative to the firm’s
total number of shares outstanding, with a more pronounced contraction among individuals who
hold a larger fraction of the firm (see Table 5).34 By 2005, median fractional stock holdings
were about one third of their pre-war level.35
33 Even though we consider a broader measure of changes in wealth than executive pay, we keep in line with the literature by referring to this correlation as pay-to-performance. 34 We collect information on equity holdings after 1942 from proxy statements. From 1935 to 1941, we construct stock holdings from an initial SEC report on holdings in 1935 and bi-monthly reports on the equity transactions of each officer The use of transactions data introduces noise in our measure of stock holdings, but we do not find evidence of a large bias. See the Appendix Section 2.4 for further details. 35 These results differ from Holderness, Kroszner and Sheehan (1999), who find higher stock ownership in 1995 than in 1935. There are two main explanations for this discrepancy. First, the increase in fractional holdings does not occur among the largest publicly-held firms in their sample, which are more comparable to our sample of firms. In addition, they focus on the holdings of all top officers and directors. When they restrict the sample to the top of the hierarchy, they find a similar decline in ownership: the holdings of the median CEO in their sample fell from 0.09 percent of shares outstanding in 1935 to 0.06 percent in 1995.

24
Table 6 compares the level of total compensation to changes in an executive’s wealth
brought about by revaluations of his stock and option holdings.36 We calculate these
revaluations based on the number of shares held at the end of the previous year and firm’s stock
market return during the fiscal year (adjusted for stock splits and dividends). The dollar value of
these changes in wealth increased in the past 25 years as the number of shares held by corporate
officers rose. For most of the post-war period, the median change in wealth—including all forms
of remuneration and revaluations of stock and option holdings—was 12 to 45 percent higher than
the median level of total compensation. Revaluations of stock and option holdings were larger in
the 1990s, as they amounted to 68 percent of total pay.
5.2 Defining measures of pay-to-performance
The empirical literature on executive compensation has used a wide range of specifications to
measure the correlation between pay and firm performance.37 Two common alternatives are the
dollar change in executive wealth per dollar change in firm value (or the Jensen-Murphy
statistic), and the dollar amount of wealth that an executive has at risk for a one percent change
in the firm’s value (or the value of equity at stake). The Jensen-Murphy statistic and the value of
equity at stake are each an appropriate measure of incentives for a specific type of managerial
decision.38 In a simple agency model that allows the marginal product of managerial effort to
vary with the value (or size) of the firm, the optimal level of effort (or strength of managerial
36 A limitation of our data is the lack of information on forms of wealth and earnings that are not related to compensation, such as dividends, capital gains, and non-firm related wealth. Unless otherwise specified, we use the term “wealth” throughout the paper to refer to firm-related wealth. 37 For a discussion of the statistics, see Jensen and Murphy (1990), Joskow and Rose (1994), Garen (1994), Hall and Liebman (1998), Murphy (1999), Aggarwall and Samwick (1999), and Baker and Hall (2004). 38 Both these statistics give an empirical measure of the correlation between pay and firm performance. While a higher pay-to-performance correlation will likely influence managerial actions, it is not clear that this correlation is caused by firms’ desire to provide incentives. Pay-to-performance correlations can also be the result of a bargaining or fairness model (Blanchflower, Oswald, and Sanfey 1996, Benjamin 2005). Although we cast our findings as incentives, we want to stress that we are only calculating a correlation.

25
incentives) depends on the type of CEO activity being considered (Baker and Hall 2004). The
Jensen-Murphy statistic is the correct measure of incentives for activities whose dollar impact is
the same regardless of the size of the firm, like buying a corporate jet, and the value of equity at
stake is appropriate for actions whose value scales with firm size, like restructuring the firm.
Studies that focus solely on compensation and ignore revaluations of equity and option
holdings often report a third measure of incentives: the percentage change in compensation for a
1 percent change in firm value (the elasticity of compensation). An analogous measure that
includes revaluations of wealth would be the elasticity of wealth to firm performance (i.e. the
percentage change in wealth for a percentage change in firm value). A log-log functional form
for incentives can be obtained theoretically as the optimal contract if utility is CRRA
(Himmelberg and Hubbard 2000) or from a model that embeds incentive pay in a competitive
labor market (Edmans, Gabaix, and Landier 2007).39 However, calculating this measure is
problematic because we do not observe the level of an executive’s total wealth but only firm-
related wealth. If non-firm-related assets trended upward or downward over the century,
ignoring these forms of wealth would lead to a systematic bias in our estimates of the level of
total wealth, and consequently a bias in estimates of the percent change in wealth. Therefore, we
focus on the Jensen-Murphy statistic and the value of equity at stake, but we return to this issue
in Section 5.5 by calculating the elasticity of changes in wealth to firm performance.40
5.3 Estimating pay-to-performance correlations
39 An additional benefit to calculating the elasticity is that it is not sensitive to changes in firm size, as are the other two measures we consider. 40 This concern is less important for the other two measures of pay-to-performance because the correlation between changes in non-firm related wealth and firm performance is less likely to have changed over time.
26
The value of equity at stake is the dollar value of wealth that an executive has at risk for a one
percent change in firm value. We estimate this statistic as EStβ)
from the following regression:
( . ) [2]ES ESijt t t jt ijtExec Wealth rα β εΔ = + +
where the firm’s j (real) rate of return during fiscal year t, jtr , measures the percentage change in
firm market value.41 To assess how EStβ has changed over time, we estimate the regression
separately for the periods 1937-40, 1941-1949 (excluding 1946), 1950-59, 1960-69, 1970-1979,
1980-1989 and 1990-1999, and 2000-2005.42 The dependent variable is the change in the real
value of all types of an executive’s firm-related wealth, calculated as the sum of total
compensation (salaries, bonuses, long-term incentive pay and stock option grants), changes in
the value of stock option holdings, and changes in the value of firm stock holdings.
We use a similar regression to estimate the Jensen-Murphy statistic, where the firm’s rate
of return is replaced by the dollar change in the market value of the firm:
( . Wealth) ( ) [3]JM JMijt t t jt ijtExec Shareholder Valueα β εΔ = + Δ +
where we measure the dollar change in shareholder value as 1, −tjjtVr , firm’s j rate of return
during fiscal year t multiplied by firm’s j market value in the previous year.
Because the distributions of compensation and wealth are highly skewed, OLS
regressions will not provide an accurate picture of the pay-to-performance sensitivity facing the
41 We ignore issues of repurchases of shares during the fiscal year, and use the rate of return to approximate the percentage change in firm value. 42 The distribution of rates of return in our sample of firms is unusually low and highly skewed in 1946, possibly due to the end of war contracts. Therefore, we exclude this year from all regressions. When this year is included, the Jensen-Murphy statistic estimated over the 1944-1948 period falls from $0.44 to $0.24, and the value of equity at stake goes from $8,664 to $7,822. Therefore, our finding of an unusually low pay-to-performance correlation in the 1940s would only be strengthened by including 1946.

27
typical executive in our sample.43 Therefore, we estimate equations [2] and [3] using a quantile
regression to fit the conditional medians of the data.44 Table 7 reports coefficient estimates and
standard errors for the Jensen-Murphy statistic and the value of equity at stake.45 With the
exception of the first and last decades of the sample, the magnitude of the standard errors
suggests that the coefficients are significantly different from one another.46 In accordance with
prior research, both measures show a large increase in pay-to-performance during the 1980s and
1990s (Hall and Liebman 1998, Murphy 1999).47 However, a historical perspective reveals a
more nuanced picture. The value of equity at stake trended upward over time, while the Jensen-
Murphy statistic followed a U-shaped pattern over the century.48
The correlation between pay and performance has been mainly driven by stock and stock
option revaluations (see Table 8). Prior to the 1970s, equity holdings were the primary factor
linking executive wealth to firm performance. Pay-to-performance has strengthened over time
with the increase in the number of options held by executives, and options have become the most
important type of wealth tying pay to performance in recent decades. However, the role of
equity holdings is still significant, and their correlation with firm performance has also increased
in recent decades.
43 For example, Aggarwall and Samwick (1999) find that OLS estimates of pay-performance sensitivities are between 2 to 7 times larger than those obtained from median regression. 44 Alternatively, we computed a robust regression that uses Huber and biweight iterations to down-weight large outliers (the rreg command in Stata), and estimated an OLS regression after trimming the highest and lowest percentiles from the distribution of changes in wealth. These methods yielded similar results. 45 Standard errors are bootstrapped, and account for correlation of observations within the firm. 46 The estimates for the 1930s do not appear to be significantly different from the 1940s, and the 2000s may not be different from the 1990s. The larger standard errors in these decades may be due to smaller sample sizes in these periods. Extreme heteroskedasticity prevents estimation of the entire sample in one regression to directly test the significance of the changes in the coefficients over time. 47 Our estimates of the value of equity at stake are consistent with those reported by Hall and Liebman (1998), but the Jensen-Murphy statistic is smaller. This discrepancy is partly due to larger firm size in our sample. Limiting our data to CEOs between 1993 and 1995, we obtain an estimate of $1.11 for a $1000 increase in firm value in firms among the top 100 of the S&P 500, $2.62 in firms ranked from 100 to 200, and $3.37 for the smallest firms in our sample. Hall and Liebman report a sensitivity of $5.29 for 1994, which is based on a random sample of about 500 of the largest firms between 1980 and 1994. 48 The trends in pay-to-performance are similar for both CEOs and other top executives.

28
5.4 Accounting for changes in the size of firms over time
The divergence between these two measures of pay-to-performance prior to the 1970s is partly
due to growth in the size of firms. While the Jensen-Murphy statistic tends to be negatively
correlated with firm size, the value of equity at stake is higher for larger firms.49 Because the
average market value of the firms in our sample increased by a factor of 3.5 from 1936 to 1970,
it is not surprising that the value of equity at stake increased while the Jensen-Murphy statistic
declined over this period. On the other hand, both measures rose from the 1970s to the 2000s
despite another 3.5-fold increase in firm size. Thus, the growth in pay-to-performance during the
past 30 years was strong enough to offset the natural downward trajectory of the Jensen-Murphy
statistic as firms became larger.
To correct the long-run trends in pay-to-performance for the secular increase in firm size,
we develop a regression-based method that relies on estimating pay-to-performance correlations
for firms in specific size categories in each decade, and then comparing estimates for a given
firm size from one decade to the next (see Appendix Section 4 for details). Since our firm-size
adjustments are formed by comparing pay-to-performance correlations in subsequent decades,
they do not provide size-adjusted estimates of the level of these correlations but only estimates of
how these correlations would have changed over time if firm size had remained the same.
Therefore, we index both the Jensen-Murphy statistic and the value of equity at stake to equal
one in the 1930s and use average size-adjusted growth rates in pay-to-performance to obtain a
new index value in each successive decade (see Figure 6). For comparison, the dashed lines in
Figure 6 show indexes based on growth in the unadjusted statistics.
49 Executives’ wealth constraints and risk aversion are plausible explanations for the well-known negative correlation between the Jensen-Murphy statistic and firm size (Demsetz and Lehn 1985, Schaefer 1998). See Baker and Hall (1998) for further discussion of the value of equity at stake.

29
Adjusted for firm size, pay-to-performance followed a W-shaped pattern from the 1930s
to the 1980s: its magnitude was about the same in the 1930s, the 1950s, the 1960s and the
1980s, and was somewhat lower in the 1940s and the 1970s. This pattern is largely driven by
changes in the correlation of equity holdings with firm performance. Pay-to-performance
strengthened considerably in the 1990s and 2000s, mostly due to a rising contribution from stock
option wealth. Thus, even after accounting for changes in firm size, the pay-to-performance
correlation was higher in the last 15 years of our sample than in any previous period.50
The unusually low correlations in the 1940s and 1970s are not easy to explain. Although
the correlation in the 1940 to 1945 period may have been held down by war-related
compensation practices, we find low pay-to-performance for the 1946 to 1949 period as well.
Thus, the war could only explain this lower correlation if its effects persisted for the entire
decade. Alternatively, the decline in incentives in the 1940s and 1970s might be driven by a
prevalence of negative economic shocks if executives’ wealth responds more strongly to
improvements than to deterioration in firm performance. However, this explanation is also
unlikely because we obtain the same W-shaped pattern when estimating pay-to-performance
with only positive changes in firm outcomes.51
5.5 Quantifying the size of the pay-to-performance correlation
In the standard principal-agent model, the optimal degree of managerial incentives is based on a
number of unobservable factors such as the agents’ risk aversion and the cost of managerial
effort. Therefore, there is no theoretical benchmark of the “optimal” degree of pay-to-
50 The small sample size for the 2000-2005 period makes it difficult to tell whether this increase reflects a transitory spike in pay-to-performance or whether it will be long lasting. 51 Jensen and Murphy (1990) interpret the low degree of pay-to-performance in the 1970s relative to the late 1930s as the result of political constraints following the increase in pay disclosure in 1942. The significantly higher correlations that we find in the 1950s and 1960s suggest that this was not the case.

30
performance against which to contrast our results (Haubrich 1994). Nevertheless, we gauge the
strength of incentives by calculating an executive’s monetary return for a meaningful
improvement in firm performance. Following Hall and Liebman (1998), we define a meaningful
(but modest) improvement in firm performance as a movement from the median rate of return to
the 70th percentile rate of return.
To estimate the wealth at stake from this improvement, we calculate the dollar change in
each executive’s stock and option holdings if the price of the firm increased from the median rate
of return in our sample (8.4 percent) to the 70th percentile rate of return (22.7 percent).52 The
median change in wealth across executives was over $2 million in the 1990s and 2000s, but
considerably smaller in earlier decades (col. 1 of Table 9). Even though the dollar value of these
changes in wealth rose significantly over time, the upward trend is not as steep when comparing
these dollar values to a broad measure of compensation that includes salaries, bonuses, stock
option grants, and revaluations of stock and options holdings at the median rate of return (col. 2).
With the exception of the 1940s, an improvement in firm performance from the 50th to the 70th
percentile has typically led to at least a 30 percent increase in this broad measure of
compensation.53 Moreover, the executive’s return to this improvement in firm outcomes was
about 50 percent of broad compensation in the 1960s, about as high as it was in the 1990s. Thus,
the incentive for an executive to undertake actions leading to an improvement in firm
performance of this magnitude has been substantial for most of our sample period. In other
words, it appears that managerial incentives have not been “wildly inefficient” for most of the
20th century, to paraphrase Hall and Liebman.
52 Table 8 shows that revaluations of stock and stock options account for virtually all of the relationship between wealth and performance. Therefore, we ignore changes in compensation for this exercise. 53 Although the median percent increases in the 1970s and in the 1980s are about the same, the pattern is U-shaped from the early 1970s to the late 1980s. Thus, we find a steady increase in managerial incentives from the mid-1970s to the late 1990s, a result consistent with Hall and Liebman’s 1980-1994 estimates.

31
Finally, we divide the percent increase in compensation broadly defined (col. 2 of Table
9) by the improvement in the rate of return from the median to the 70th percentile of
performance. Because the numerator is calculated from changes in wealth as opposed the level
of wealth, this measure reflects the elasticity of changes in wealth, a concept related to the
elasticity of wealth discussed above. This elasticity was greater than 1.9 for every decade in our
sample except the 1940s, and almost as large in the 1960s as it was in the 1990s and 2000s.
Thus, this measure of pay-to-performance also suggests that managerial incentives were not
small for most of the 20th century.
Although incentives were never inconsequential, we do find significant fluctuations in
pay-to-performance over time, as this correlation was much stronger in recent decades.54 This
result is not inconsistent with the theory that higher levels of pay have been needed to
compensate executives for optimal increases in the strength of incentives. However, this
explanation seems unlikely to fit the long-run trends in the level of pay because we find
meaningful increases in pay-to-performance in periods that experienced little change in
compensation.
We cast our findings in terms of managerial incentives, but we want to stress that we
simply document changes in the correlation between executive wealth and the market value of
firms. This correlation may motivate executives to improve firm value, but it does not reveal the
intentions of shareholders. Although the evolution of pay-to-performance may reflect changes in
54 One explanation for this regime shift in pay-performance sensitivities could be an increase in the aggregate demand for top executives (Himmelberg and Hubbard 2000).

32
the optimal contract between managers and shareholders, it also may be an unintentional
byproduct of other factors that have altered the structure of executive pay.55
6. Conclusion
In this paper, we document important changes in the level and the structure of executive pay
from 1936 to 2005. The real value of total compensation followed a J-shaped pattern over our
sample period. After a sharp decline during World War II, the level of pay increased at a modest
rate from the mid-1940s to the mid-1970s, and then rose at an increasing rate from the 1970s to
the present. The composition of executive compensation also changed considerably since the
1950s, as both stock options and other forms of incentive pay became larger shares of total
compensation over time.
The relative stagnation of compensation during the 1950s and 1960s is surprising because
the level of executive pay did not keep pace with the growing size of firms during this period.
By contrast, pay and firm size have been more strongly correlated in recent decades.
Decomposing the relationship between compensation and firm size into its cross-sectional and
time series components, we find that the cross-sectional relationship has remained relatively
stable over the past 70 years. On the other hand, while the level of pay moved almost one-to-one
with the average market value of firms over the past 30 years, this correlation was one-tenth to
one-third as large in the 1946-1975 period. Moreover, the strong correlation that we find in the
later period may be biased upward by spurious correlation in the market value of firms and the
level of pay.
55 Examples of these other possible factors include changes in the corporate governance of firms (Bebchuk and Fried 2004, Bertrand and Mullainathan 2001), tax advantages of certain instruments of pay (Hall and Liebman 2000), regulation (Rose and Wolfram 2000), and product market competition (Cuñat and Guadalupe 2006).

33
The transformation in the structure of compensation over the past fifty years has
important implications for managerial incentives because incentive pay ties an executive’s
wealth to the performance of the firm. Using a broad measure of executive compensation that
includes salaries, bonuses, stock option grants, and revaluations of stock and stock option wealth,
we find that the pay-performance sensitivities were considerable in most decades except the
1940s and the 1970s. Thus, compensation arrangements have served to tie the wealth of
managers to firm performance — and perhaps to align managerial incentives with shareholders’
interests — for most of the twentieth century.
The long-run trends in executive compensation allow us to reassess several common
explanations for changes in the level and structure of pay over the past several decades. The data
prior to the 1970s are inconsistent with theories of managerial rent-seeking, a competitive labor
market for executives, and increases in managerial incentives. These explanations may still help
to explain the recent surge in compensation, but only if the determinants of executive pay were
different in the past. Plausible reasons for such a shift may involve changes in the nature of the
tasks carried out by top executives (Murphy and Zábojník 2004, Frydman 2005), or in social
norms that may have constrained inequality in earlier decades (Piketty and Saez 2003).
Alternatively, changes in managerial pay over time may have been driven by other factors, such
as the development of alternative job opportunities for executives (Kaplan and Rauh 2006),
improvements in board diligence (Hermalin 2005), and the rise in peer group benchmarking
(Murphy 1999). By providing a contrast to recent data, the long-run trends in managerial pay
present a challenge that we hope will further our understanding of the determinants of executive
compensation.
34
References
Aggarwal, Rajesh K., and Andrew A. Samwick. 1999. “The Other Side of the Trade-Off: The
Impact of Risk on Executive Compensation,” Journal of Political Economy, Vol. 107, No.1: 65-105
Baker, George and Brian Hall. 2004. “CEO Incentives and Firm Size,” Journal of Labor
Economics, Vol. 22, Issue 2: 767-798.
Baker, John Calhoun, and William L. Crum. 1935. “Compensation of Corporation Executives: The 1928-1932 Record.” Harvard Business Review (Spring): 321-333.
Baker, John Calhoun. 1938. Executive Salaries and Bonus Plans. New York: McGraw-Hill
Book Company. Bebchuk, Lucian A., and Jesse M. fried. 2003. “Executive Compensation as an Agency
Problem,” Journal of Economic Perspectives, Vol. 17, Summer. Bebchuk, Lucian A., and Jesse M. Fried. 2004. Pay without Performance: The Unfulfilled
Promise of Executive Compensation. Cambridge: Harvard University Press Bebchuk, Lucian Arye and Robert J. Jackson. 2005. "Executive Pensions," Journal of
Corporation Law, Vol. 30, No. 4: 823-855 Bebchuk, Lucian Arye, and Yaniv Grinstein. 2005. “The Growth of Executive Pay.” NBER
Working Paper # 11443 Benjamin, Daniel J. 2005. “A Theory of Fairness in Labor Markets,” Harvard University
mimeo, November Berle, Adolf A. and Gardiner C. Means. 1932. The Modern Corporation and Private Property.
New Brunswick, NJ: Transaction Publishers. Bertrand, Marianne, and Sendhil Mullainathan. 2001. “Are CEOs Rewarded for Luck? The
Ones Without Principals Are.” Quarterly Journal of Economics 116(3): 901-32. Blanchflower, David G., Andrew Oswald and Peter Sanfey, 1996. "Wages, profits and rent
sharing," Quarterly Journal of Economics, Vol. 111, Issue 1: 227-251 Boschen, John F and Kimberly J. Smith. 1995. “You Can Pay Me Now and You Can Pay Me
Later: The Dynamic Response of Executive Compensation to Firm Performance,” Journal of Business, Vol. 68 (4): 577-608.

35
Chandler Jr., Alfred D. 1977. The Visible Hand. The Managerial Revolution in American Business. Cambridge, MA: Harvard University Press
Cuñat, Vicente and Maria Guadalupe. 2006. “Globalization and the Provision of Incentives
Inside the Firm: The Effect of Foreign Competition,” Working Paper. Demsetz, Harold and Kenneth Lehn. 1985. “The Structure of Corporate Ownership: Causes
and Consequences,” Journal of Political Economy 93: 1155-1177 Edmans, Alex, Xavier Gabaix, and Agustin Landier. 2007. “A Calibratable Model of Optimal
CEO Incentives in Market Equilibrium,” Working Paper. Frydman, Carola. 2005. “Rising through the Ranks: The Evolution of the Market for Corporate
Executives, 1936-2003,” Working Paper. Gabaix, Xavier and Agustin Landier. 2008. “Why Has CEO Pay Increased So Much?,”
Quarterly Journal of Economics, 123(1): 49-100. Garen, John E. 1994. “Executive Compensation and Principal-Agent Theory,” Journal of
Political Economy 102: 1175-1199 Gibbons, Robert, and Kevin J. Murphy. 1990. “Relative Performance Evaluation for Chief
Executive Officers”, Industrial and Labor Relations Review 43, No. 3 Gillan, Stuart L., and Laura T. Starks. 2007. “The Evolution of Shareholder Activism in the
United States,” Journal of Applied Corporate Finance 19: 55-73 Goldin, Claudia and Robert A. Margo. 1992. “The Great Compression: The Wage Structure in
the United States at Mid-Century.” Quarterly Journal of Economics 107 (February): 1-34. Hall, Brian J. and Jeffrey B. Liebman. 1998. “Are CEOs Really Paid like Bureaucrats?”
Quarterly Journal of Economics 113 (August): 653-691. Hall, Brian J. and Jeffrey B. Liebman. 2000. “The Taxation of Executive Compensation.” In Tax
Policy and the Economy, vol. 14, edited by James Poterba. Cambridge, MA: MIT Press. Hall, Brian J. and Kevin J. Murphy. 2003. “The Trouble with Stock Options.” Journal of
Economic Perspectives 17 (Summer): 49-70. Haubrich, Joseph G. 1994. “Risk Aversion, Performance Pay, and the Principal-Agent
Problem,” Journal of Political Economy 102: 258-276 Hermalin, Benjamin E. 2005. “Trends in Corporate Governance,” Journal of Finance 60: 2351-
2384

36
Himmelberg, Charles P. and R. Glenn Hubbard. 2000. “Incentive Pay and the Market for CEOs: An Analysis of Pay-for-Performance Sensitivity,” Columbia University mimeo.
Holderness, Clifford G., Randall S. Kroszner and Dennis P. Sheehan. 1999. “Were the Good
Old Days That Good? Changes in Managerial Stock Ownership Since the Great Depression,” Journal of Finance, Vol. 54 (2): 435-469
Holmstrom, Bengt. 2005. “Pay without Performance and the Managerial Power Hypothesis: A
Comment,” Journal of Corporation Law, Vol. 30: 675-702 Holmstrom, Bengt, and Steven N. Kaplan. 2001. “Corporate Governance and Merger Activity
in the U.S.: Making Sense of the 1980s and 1990s,” NBER Working Paper No. 8220 Inderst, Roman, and Holger M. Mueller. 2006. “CEO Compensation and Private Information:
An Optimal Contracting Perspective,” Working Paper. Jensen, Michael C. 1993. “The Modern Industrial Revolution, Exit, and the Failure of Internal
Control Systems,” Journal of Finance 48: 831-880 Jensen, Michael and Kevin J. Murphy. 1990. “Performance Pay and Top-Management
Incentives,” Journal of Political Economy, 98(2). Jensen, Michael C. and Kevin J. Murphy. 2004. “Remuneration: Where We’ve Been, How We
Got to Here, What are the Problems, and How to Fix Them.” ECGI Working Paper Series in Finance 44 (July).
Joskow, Paul L. and Rose, Nancy L. 1994. "CEO Pay and Firm Performance: Dynamics,
Asymmetries, and Alternative Performance Measures," NBER Working Paper No. W4976 Kaplan, Steven N. and Joshua Rauh. 2006. “Wall Street and Main Street: What Contributed to
the Rise in the Highest Incomes?,” Working Paper Kostiuk, Peter. 1990. “Firm Size and Executive Compensation,” Journal of Human Resources
25: 90-105. Kothari, S.P., Jay Shanken and Richard G. Sloan. 1995. “Another Look at the Cross-section of
Expected Stock Returns.” Journal of Finance 50: 185-224. Kuhnen, Camelia M., and Jeffrey H. Zwiebel. 2007. “Executive Pay, Hidden Compensation and
Managerial Entrenchment,” Working Paper. Khurana, Rakesh. 2002. Searching for a Corporate Savior. The Irrational Quest for
Charismatic CEOs. New Jersey: Princeton University Press Lehn, Kenneth, Sukesh Patro, and Mengxin Zhao. 2003. “Determinants of the Size and
Structure of Corporate Boards: 1935-2000.” Working Paper.

37
Lewellen, Willbur G. 1968. Executive Compensation in Large Industrial Corporations. New York: National Bureau of Economic Research.
Lucas Jr., Robert E. 1978. “On the Size Distribution of Business Firms,” The Bell Journal of
Economics 9, No.2: 508-523 Mace, Myles L. 1971. Directors, Myth and Reality. Boston, MA: Harvard Business School Press. Moore, Lyndon and Steve Juh. 2006. “Derivative Pricing 60 Years before Black-Scholes:
Evidence from the Johannesburg Stock Exchange,” Journal of Finance Vol. 61 No. 6: 3069-3098
Murphy, Kevin J. 1985. “Corporate Performance and Managerial Remuneration: An Empirical
Analysis.” Journal of Accounting and Economics 7: 11-42. Murphy, Kevin J. 1999. “Executive Compensation.” In Handbook of Labor Economics, vol. 3B,
edited by Orley Ashenfelter and David Card. Amsterdam, New York: North Holland. Murphy, Kevin J. and Ján Zábojník. 2004. “CEO Pay and Turnover: A Market Based
Explanation for Recent Trends." American Economic Review (Papers and Proceedings) 94: 192-196
Pesaran, M. Hashem. 2007. “A Simple Panel Unit Root Test in the Presence of Cross-Section
Dependence,” Journal of Applied Econometrics 22: 265-312 Piketty, Thomas and Emmanuel Saez. 2003. “Income Inequality in the United States: 1913-
1998.” Quarterly Journal of Economics 118: 1-39. Rajan, Raghuram G and Julie Wulf. 2006. “Are Perks Purely Managerial Excess?,” Journal of
Financial Economics 79: 1-33 Rose, Nancy L., and Catherine Wolfram. 2000. “Has the “Million-Dollar Cap” Affected CEO
Pay?,” American Economic Review, Papers and Proceedings, Vol. 90 No. 2: 197-202 Roberts, David. 1956. “A General Theory of Executive Compensation Based on Statistically
Tested Propositions,” Quarterly Journal of Economics 70: 270-294 Roberts, David. 1959. Executive Compensation. Glencoe, IL: The Free Press. Rosen, Sherwin. 1981. “The Economics of Superstars,” American Economic Review 71: 845-
858 Rosen, Sherwin. 1982. “Authority, Control and the Distribution of Earnings,” Bell Journal of
Economics 13: 311-323

38
Rosen, Sherwin. 1992. “Contracts and the Market for Executives.” In Contract Economics, edited by Lars Werin and Hans Wijkander. Cambridge, MA: Blackwell Publishers.
Schaeffer, Scott. 1998. “The Dependence of Pay-Performance Sensitivity on the Size of the
Firm,” Review of Economics and Statistics 80: 436-443 Smith, Clifford W. Jr. and Jerold L. Zimmerman. 1976. “Valuing Employee Stock Option Plans
Using Option Pricing Models,” Journal of Accounting Research 14: 357-364 Sundaram, Rangarajan K. and David Yermack. 2005. "Pay Me Later: Inside Debt and its Role in
Managerial Compensation," NYU, Law and Economics Research Paper No. 05-08 Taussig, F. W. and W. S. Barker. 1925. “American Corporations and Their Executives: A
Statistical Inquiry.” Quarterly Journal of Economics 40 (November): 1-51. Tervio, Marko. 2007. “The Difference That CEOs Make: An Assignment Model Approach,”
Working Paper Wattel, Harold L. 1978. Chief Executive Officer Compensation. New York: Hofstra University. Yermack, David. 1995. “Do Corporations Award CEO Stock Options Effectively?” Journal of
Financial Economics 39: 237-269. Yermack, David. 2006. “Flights of Fancy: Corporate Jets, CEO Perquisites, and Inferior
Shareholder Returns,” Journal of Financial Economics 80: 211-242
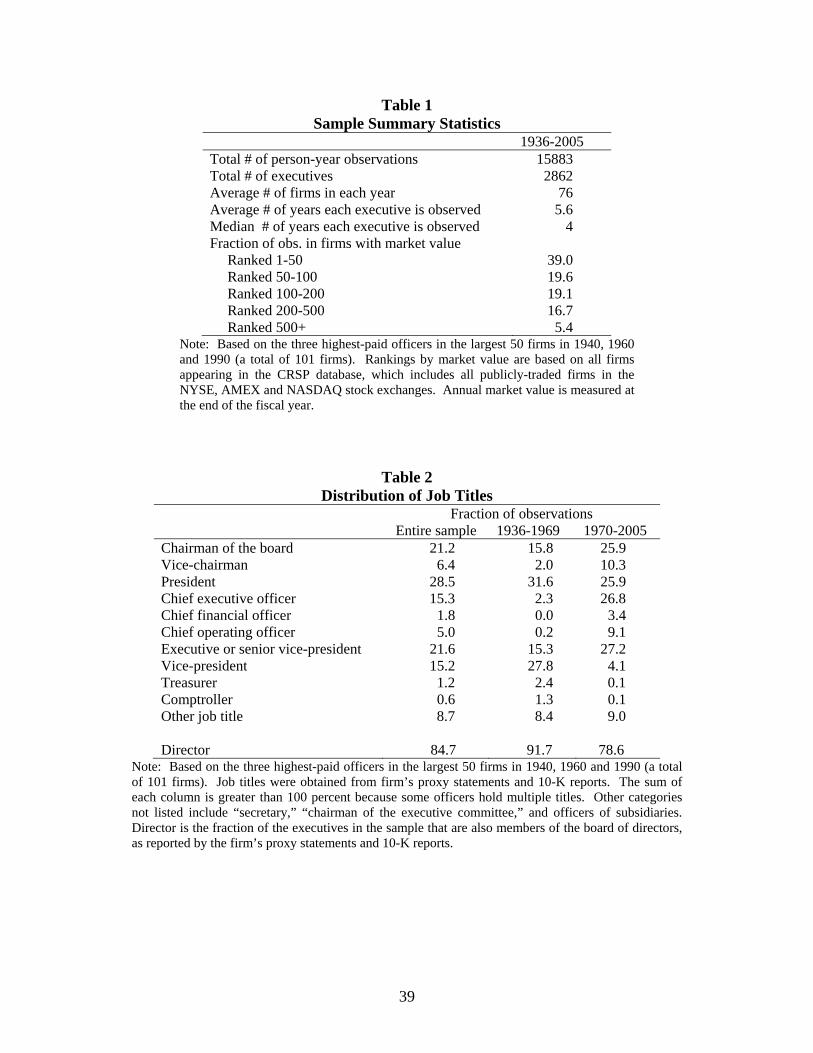
39
Table 1 Sample Summary Statistics
1936-2005 Total # of person-year observations 15883 Total # of executives 2862 Average # of firms in each year 76 Average # of years each executive is observed 5.6 Median # of years each executive is observed 4 Fraction of obs. in firms with market value
Ranked 1-50 39.0 Ranked 50-100 19.6 Ranked 100-200 19.1 Ranked 200-500 16.7 Ranked 500+ 5.4
Note: Based on the three highest-paid officers in the largest 50 firms in 1940, 1960 and 1990 (a total of 101 firms). Rankings by market value are based on all firms appearing in the CRSP database, which includes all publicly-traded firms in the NYSE, AMEX and NASDAQ stock exchanges. Annual market value is measured at the end of the fiscal year.
Table 2 Distribution of Job Titles
Fraction of observations
Entire sample 1936-1969 1970-2005 Chairman of the board 21.2 15.8 25.9 Vice-chairman 6.4 2.0 10.3 President 28.5 31.6 25.9 Chief executive officer 15.3 2.3 26.8 Chief financial officer 1.8 0.0 3.4 Chief operating officer 5.0 0.2 9.1 Executive or senior vice-president 21.6 15.3 27.2 Vice-president 15.2 27.8 4.1 Treasurer 1.2 2.4 0.1 Comptroller 0.6 1.3 0.1 Other job title 8.7 8.4 9.0 Director 84.7 91.7 78.6
Note: Based on the three highest-paid officers in the largest 50 firms in 1940, 1960 and 1990 (a total of 101 firms). Job titles were obtained from firm’s proxy statements and 10-K reports. The sum of each column is greater than 100 percent because some officers hold multiple titles. Other categories not listed include “secretary,” “chairman of the executive committee,” and officers of subsidiaries. Director is the fraction of the executives in the sample that are also members of the board of directors, as reported by the firm’s proxy statements and 10-K reports.

40
Table 3 Real Value of Total Compensation by Percentile
(Millions of $2000) 1936 -
1939 1940 - 1945
1946 - 1949
1950 - 1959
1960 - 1969
1970 - 1979
1980 - 1989
1990 - 1999
2000 - 2005
Three Highest-Paid Officers 10th percentile 0.36 0.4 0.36 0.39 0.45 0.47 0.57 0.91 1.31 25th percentile 0.53 0.59 0.53 0.55 0.60 0.64 0.85 1.35 2.19 50th percentile 0.85 0.80 0.72 0.77 0.83 0.93 1.33 2.36 4.08 75th percentile 1.24 1.15 1.01 1.09 1.18 1.31 2.05 4.43 9.42 90th percentile 1.80 1.59 1.53 1.63 1.66 1.84 3.18 8.29 16.9
average 0.97 0.95 0.85 0.94 0.99 1.09 1.74 4.35 7.63
Median CEO 1.11 1.07 0.90 0.97 0.99 1.17 1.81 4.09 9.20 Median Other Top Officers 0.74 0.70 0.65 0.67 0.74 0.82 1.12 1.89 3.02 Within-Firm Ratio of CEO to Other Top Officers 1.50 1.48 1.38 1.43 1.29 1.42 1.58 2.00 2.58
Note: Distribution of total compensation in the sample executives from 1936 to 2005. Total compensation is the sum of salaries, bonuses, long-term bonus payments, and the Black-Scholes value of stock option grants. Based on the three highest-paid officers in the largest 50 firms in 1940, 1960 and 1990 (a total of 101 firms). In firms where the title “CEO” is not used, the CEO is identified as the president of the company. Other top officers include any executive among the three highest-paid who is not the CEO. The within-firm ratio is the median across firms of the ratio of the CEO’s total compensation to the average compensation of the two other highest-paid officers in the firm.

41
Table 4 The Correlation between Compensation and Firm Size
Firm Size = Ln(Market Value) Firm Size = Ln(Sales) 1936-1975 1946-1975 1976-2005 1946-1975 1976-2005 (1) (2) (3) (4) (5) Panel 1: DV = Ln(Compift)
Average Size in Year t [fraction variance explained]
.088** (.026) [.010]
.137** (.025) [.020]
.935** (.035) [.332]
.157** (.032) [.017]
2.65** (0.11) [.259]
Average Firm Size [fraction variance explained]
.208** (.033) [.145]
.212** (.032) [.164]
.292** (.032) [.135]
.305** (.037) [.220]
.358** (.041) [.113]
Size – Firm Avg. – Year Avg. [fraction variance explained]
.182** (.038) [.039]
.199** (.041) [.036]
.264** (.032) [.043]
.240** (.052) [.041]
.346** (.048) [.032]
Panel 2: With Firm Fixed Effects Average Size in Year t .135**
(.024) .969**
(.037) .149**
(.031) 2.63**
(0.11) Size – Year Avg. .218**
(.040) .313**
(.028) .277**
(.046) .389**
(.046) Panel 3: Including Lagged Size and Firm FE
Average Size in Year t -.019
(.037) .622**
(.086) .240**
(.074) 2.31**
(0.23) Average Size in Year t-1 .152**
(.041) .378**
(.083) -.088 (.063)
.362* (.210)
(Size – Year Avg.) in Year t .183**
(.040) .369**
(.038) .203**
(.045) .401**
(.067) (Size – Year Avg.) in Year t-1
.020 (.041)
-.064** (.029)
.084** (.030)
-.040 (.043)
Panel 4: Including Quadratic Time Trend and Firm FE
Average Size in Year t .035
(.032) .750**
(.082) .143* (.079)
-.312* (.171)
Size – Year Avg. .217**
(.038) .309**
(.028) .272**
(.046) .391** (.042)
Panel 5: DV = ∆Ln(Compift) ∆ Average Size in Year t .012
(.031) .210**
(.080) .087* (.049)
.172 (.174)
∆ Size – ∆ Year Avg. .092**
(.032) .277**
(.035) .077**
(.024) .145
(.116) Note: The dependent variable in panels 1 to 4 is the logarithm of total compensation for each executive and the dependent variable in panel 5 is the change in ln(compensation). Total compensation is the sum of salaries, bonuses, long-term bonus payments, and the Black-Scholes value of stock option grants, measured in $2000 and based on the three highest-paid officers in the largest 50 firms in 1940, 1960 and 1990 (a total of 101 firms). Size is measured by the logarithm of the firm’s market value in columns (1) to (3) and by the logarithm of the firm’s total sales in columns (4) to (5), both measured in $2000. Standard errors are shown in parentheses and are clustered by firm. Panel 1 decomposes firm size into three components: the average size of all firms in the sample in year t (to proxy for aggregate market size), the average size of the firm the executive works for over the entire sample, and the deviation in the size of the executive’s firm from its average firm size and the average size of all firms in that year. Panel 2 controls for firm fixed effects. Panel 3 includes firm fixed effects and measures of firm size in the prior year. Panel 4 includes firm fixed effects and a quadratic time trend. Panel 5 controls for changes in firm size. Values in brackets show the fraction of the total variance explained by each independent variable based on an ANOVA decomposition for each sample period. Standard errors are in parentheses and are clustered by firm. * denotes significance at the 10% level and ** denotes significance at the 5% level.

42
Table 5 Managerial Stock Holdings Relative to Shares Outstanding
(Percentage Points) 25th
percentile 50th
percentile 75th
percentile CEOs
(median)
Other Highest-Paid Officers
(median) 1936-1940 .019 .111 .402 .130 .088 1941-1949 .010 .038 .159 .048 .031 1950-1959 .011 .035 .109 .043 .031 1960-1969 .012 .037 .103 .047 .034 1970-1979 .008 .023 .064 .039 .019 1980-1989 .008 .019 .054 .029 .015 1990-1999 .011 .030 .084 .069 .021 2000-2005 .010 .028 .074 .072 .018
Note. The proportion of managerial stock holdings relative to shares outstanding at the 25th, 50th, and 75th percentiles are based on the three-highest paid executives in the 50 largest firms in 1940, 1960, and 1990 (a total of 101 firms). In firms where the title “CEO” is not used in the proxy statement, the CEO is identified as the president of the company. Other top officers include any executive among the three highest-paid who is not the CEO. The ownership of stock by each executive was obtained from SEC bi-monthly reports on security holdings and transactions from 1935 to 1942, from firm’s proxy statements from 1942 to 1992, and from ExecuComp from 1992 to the present.
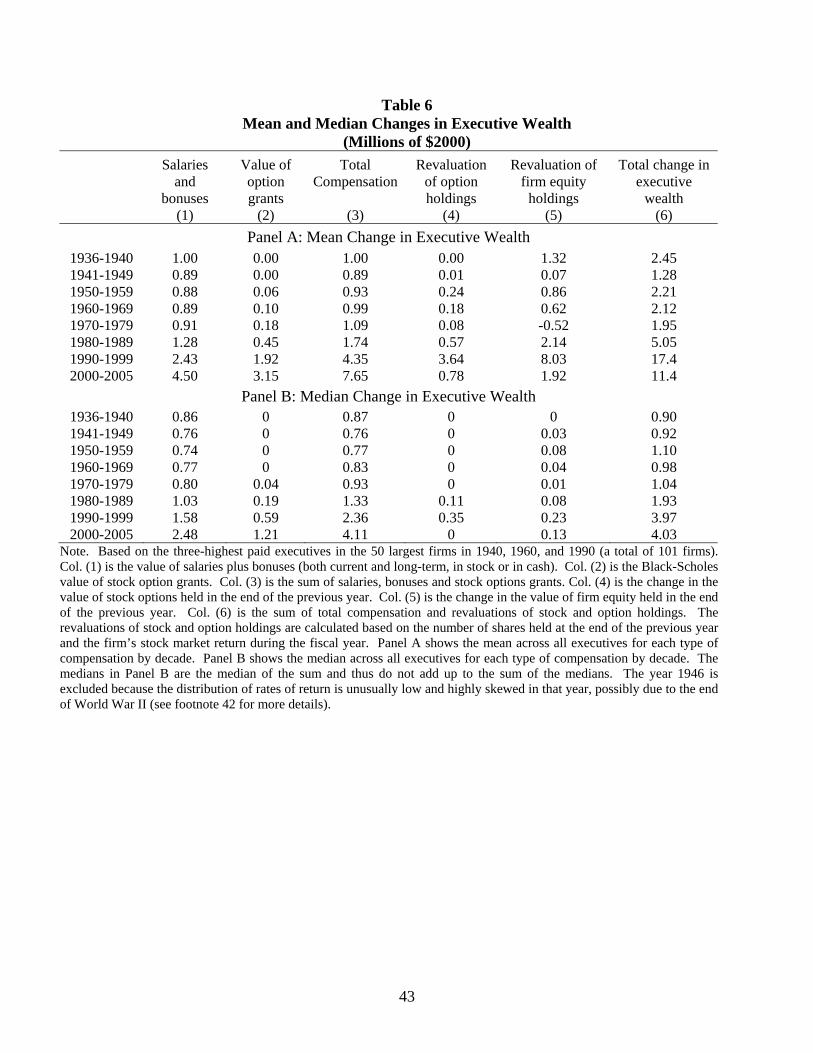
43
Table 6 Mean and Median Changes in Executive Wealth
(Millions of $2000) Salaries
and bonuses
Value of option grants
Total Compensation
Revaluation of option holdings
Revaluation of firm equity
holdings
Total change in executive
wealth (1) (2) (3) (4) (5) (6)
Panel A: Mean Change in Executive Wealth 1936-1940 1.00 0.00 1.00 0.00 1.32 2.45 1941-1949 0.89 0.00 0.89 0.01 0.07 1.28 1950-1959 0.88 0.06 0.93 0.24 0.86 2.21 1960-1969 0.89 0.10 0.99 0.18 0.62 2.12 1970-1979 0.91 0.18 1.09 0.08 -0.52 1.95 1980-1989 1.28 0.45 1.74 0.57 2.14 5.05 1990-1999 2.43 1.92 4.35 3.64 8.03 17.4 2000-2005 4.50 3.15 7.65 0.78 1.92 11.4
Panel B: Median Change in Executive Wealth 1936-1940 0.86 0 0.87 0 0 0.90 1941-1949 0.76 0 0.76 0 0.03 0.92 1950-1959 0.74 0 0.77 0 0.08 1.10 1960-1969 0.77 0 0.83 0 0.04 0.98 1970-1979 0.80 0.04 0.93 0 0.01 1.04 1980-1989 1.03 0.19 1.33 0.11 0.08 1.93 1990-1999 1.58 0.59 2.36 0.35 0.23 3.97 2000-2005 2.48 1.21 4.11 0 0.13 4.03
Note. Based on the three-highest paid executives in the 50 largest firms in 1940, 1960, and 1990 (a total of 101 firms). Col. (1) is the value of salaries plus bonuses (both current and long-term, in stock or in cash). Col. (2) is the Black-Scholes value of stock option grants. Col. (3) is the sum of salaries, bonuses and stock options grants. Col. (4) is the change in the value of stock options held in the end of the previous year. Col. (5) is the change in the value of firm equity held in the end of the previous year. Col. (6) is the sum of total compensation and revaluations of stock and option holdings. The revaluations of stock and option holdings are calculated based on the number of shares held at the end of the previous year and the firm’s stock market return during the fiscal year. Panel A shows the mean across all executives for each type of compensation by decade. Panel B shows the median across all executives for each type of compensation by decade. The medians in Panel B are the median of the sum and thus do not add up to the sum of the medians. The year 1946 is excluded because the distribution of rates of return is unusually low and highly skewed in that year, possibly due to the end of World War II (see footnote 42 for more details).

44
Table 7 Correlation of Changes in Executive Wealth with Firm Performance, 1936-2005
Note. Based on the three-highest paid executives in the 50 largest firms in 1940, 1960, and 1990 (a total of 101 firms). The change in executive wealth is defined as the sum of total compensation (salary, bonuses, and stock options granted during the year) and the revaluation of stock and stock option holdings. The Jensen-Murphy statistic is calculated by regressing the dollar change in each executive’s wealth on the dollar change in the executive’s firm market value during the year (measured in thousands). The Equity at Stake is calculated by regressing the dollar change in each executive’s wealth on the percentage change in the executive’s firm value, measured by the firm’s rate of return. Results are based on median regressions estimated separately for each decade. Bootstrapped standard errors are given in parentheses and are clustered by firm. The year 1946 is excluded because the distribution of rates of return is unusually low and highly skewed in that year, possibly due to the end of World War II (see footnote 42 for more details).
Dollar change in wealth for $1000 change in firm
market value (Jensen-Murphy)
Dollar change in wealth for a 1 percent increase in firm’s rate of return
(Equity at Stake)
1936 – 1940 1.14 (0.66)
18,075 (5,122)
1941 – 1949 0.380 (0.121)
7,738 (1,867)
1950 - 1959 0.359 (0.096)
23,378 (2,865)
1960 - 1969 0.292 (0.125)
40,269 (7,067)
1970 - 1979 0.128 (0.048)
22,822 (3,710)
1980 - 1989 0.258 (0.072)
37,086 (5,151)
1990 - 1999 0.774 (0.270)
135,527 (22,986)
2000 - 2005 0.474 (0.092)
151,508 (30,123)
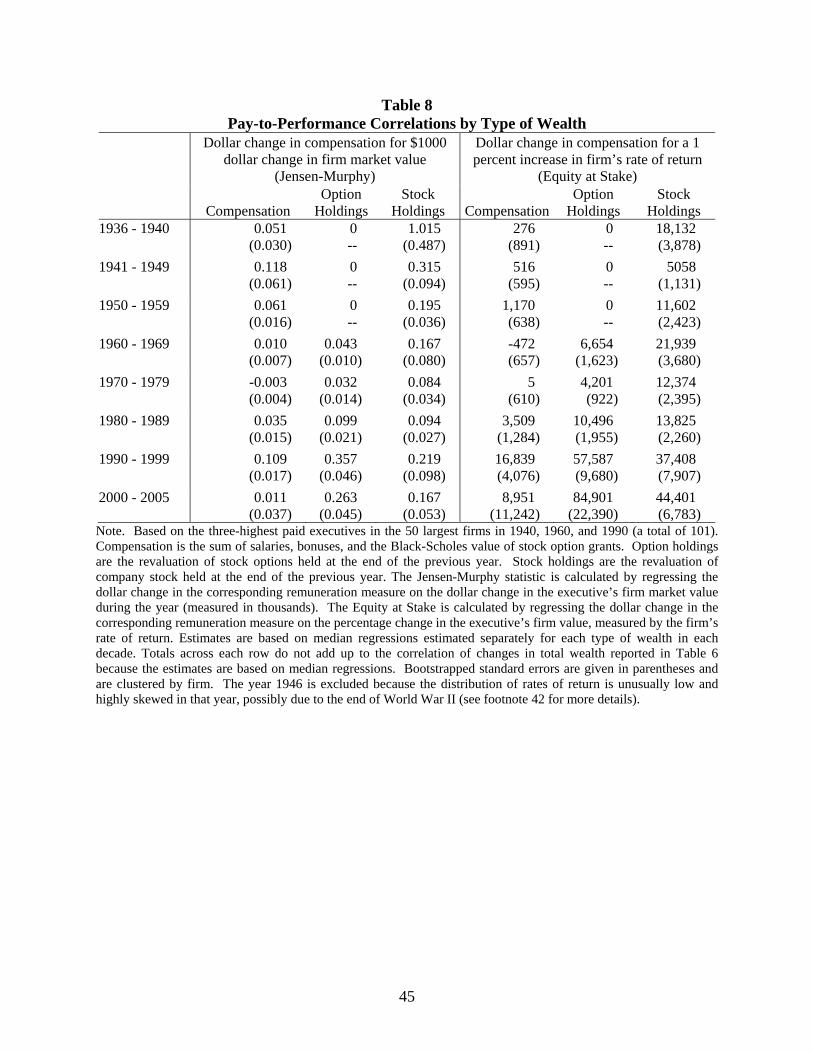
45
Table 8 Pay-to-Performance Correlations by Type of Wealth
Dollar change in compensation for $1000 dollar change in firm market value
(Jensen-Murphy)
Dollar change in compensation for a 1 percent increase in firm’s rate of return
(Equity at Stake)
Compensation Option
Holdings Stock
Holdings CompensationOption
Holdings Stock
Holdings 1936 - 1940 0.051
(0.030) 0 --
1.015 (0.487)
276 (891)
0 --
18,132 (3,878)
1941 - 1949 0.118 (0.061)
0 --
0.315 (0.094)
516 (595)
0 --
5058 (1,131)
1950 - 1959 0.061 (0.016)
0 --
0.195 (0.036)
1,170 (638)
0 --
11,602 (2,423)
1960 - 1969 0.010 (0.007)
0.043 (0.010)
0.167 (0.080)
-472 (657)
6,654 (1,623)
21,939 (3,680)
1970 - 1979 -0.003 (0.004)
0.032 (0.014)
0.084 (0.034)
5 (610)
4,201 (922)
12,374 (2,395)
1980 - 1989 0.035 (0.015)
0.099 (0.021)
0.094 (0.027)
3,509 (1,284)
10,496 (1,955)
13,825 (2,260)
1990 - 1999 0.109 (0.017)
0.357 (0.046)
0.219 (0.098)
16,839 (4,076)
57,587 (9,680)
37,408 (7,907)
2000 - 2005 0.011 (0.037)
0.263 (0.045)
0.167 (0.053)
8,951 (11,242)
84,901 (22,390)
44,401 (6,783)
Note. Based on the three-highest paid executives in the 50 largest firms in 1940, 1960, and 1990 (a total of 101). Compensation is the sum of salaries, bonuses, and the Black-Scholes value of stock option grants. Option holdings are the revaluation of stock options held at the end of the previous year. Stock holdings are the revaluation of company stock held at the end of the previous year. The Jensen-Murphy statistic is calculated by regressing the dollar change in the corresponding remuneration measure on the dollar change in the executive’s firm market value during the year (measured in thousands). The Equity at Stake is calculated by regressing the dollar change in the corresponding remuneration measure on the percentage change in the executive’s firm value, measured by the firm’s rate of return. Estimates are based on median regressions estimated separately for each type of wealth in each decade. Totals across each row do not add up to the correlation of changes in total wealth reported in Table 6 because the estimates are based on median regressions. Bootstrapped standard errors are given in parentheses and are clustered by firm. The year 1946 is excluded because the distribution of rates of return is unusually low and highly skewed in that year, possibly due to the end of World War II (see footnote 42 for more details).

46
Table 9 The Strength of Managerial Incentives:
Change in Wealth Due to Raising the Firm’s Rate of Return from the 50th to the 70th Percentile Median Across Executives
$ change in wealth Percent change in wealth =
50th
(1)total comp.+ wealth at rate of returnΔ
Elasticity =
70th 50th
(2)rate of return rate of return−
(1) (2) (3) 1936 – 1940 278,611 29.6 2.07 1941 – 1949 103,838 9.8 0.68 1950 - 1959 246,359 27.7 1.93 1960 - 1969 624,862 51.9 3.63 1970 - 1979 353,664 30.4 2.12 1980 - 1989 652,647 30.3 2.11 1990 - 1999 2,212,950 55.8 3.90 2000 - 2005 3,851,259 60.9 4.26
Note. Based on the three-highest paid executives in the 50 largest firms in 1940, 1960, and 1990 (a total of 101). The dollar change in wealth is defined as the revaluation of stock and option holdings assuming a rate of return at the 70th percentile (22.7%) minus the revaluation evaluated at the 50th percentile rate of return (8.4%). Col. (1) shows the median of this value across executives in each decade. The percent change in wealth is the dollar change in wealth for each individual executive divided by the total change in an executive’s wealth at median firm performance, defined as the revaluation of stock and option holdings at the 50th percentile rate of return plus salaries, bonuses and stock option grants. Col. (2) presents the median of this value across executives in each decade. Col. (3) approximates an elasticity of changes in wealth to changes in firm performance by dividing col. (2) by the percentage difference in firm value between the 50th and 70th percentiles of firm performance (22.7 – 8.4 = 14.3%). The year 1946 is excluded because the distribution of rates of return is unusually low and highly skewed in that year, possibly due to the end of World War II (see footnote 42 for more details).

47
Figure 1 Median Value of Total Compensation, 1936-2005
Note: Total compensation is composed of salary, bonuses, long-term bonus payments, and stock option grants. Relative compensation is defined as total compensation divided by total wage and salary accruals per full-time equivalent employee from table 6.6 of the National Income and Product Accounts. Based on the three highest-paid officers in the largest 50 firms in 1940, 1960 and 1990 (a total of 101 firms).
Figure 2 Structure of Total Compensation, 1936-2005
Mill
ions
of 2
000
Dol
lars
(log
scal
e)
year
salary+bonus sal.+bonus+long-term pay sal.+bonus+ltp+options granted
1940 1950 1960 1970 1980 1990 2000
1
2
3
4
5
Note: Each line shows the median value of compensation defined as an increasing number of types: salary and current bonuses (paid out in stock or in cash); salary, current bonuses, and long-term incentive payments (paid out in stock or in cash); and salary, current and long-term bonuses, and the Black-Scholes value of stock options granted. Based on the three highest-paid officers in the largest 50 firms in 1940, 1960 and 1990 (a total of 101 firms).
Mill
ions
of 2
000
Dol
lars
year
Rat
io to
Ave
rage
Ear
ning
s
real value (left) rel. to avg. worker (right)
1940 1950 1960 1970 1980 1990 2000
0.6
1.2
1.8
2.4
3.0
3.6
4.24.8
20.0
40.0
60.0
80.0
100.0
120.0

48
Figure 3 Fraction of Top Executives Granted and Holding Stock Options
Frac
tion
of E
xecu
tives
year
option grants > 0 option holdings > 0
1940 1950 1960 1970 1980 1990 2000
0
.2
.4
.6
.8
1
Note: Based on the three highest-paid officers in the largest 50 firms in 1940, 1960 and 1990 (a total of 101 firms). Option grants>0 shows the fraction of executives in the year that were granted at least one stock option. Option holdings>0 shows the fraction of executives in the year that held at least one stock option. When not explicitly listed in proxy statements, stock option holdings are calculated based on the history of stock option grants and stock option exercises for each individual. The fraction of executives granted options includes imputations for cases when the annual grants are not listed, but the cumulative number options awarded to each individual over a multi-year period is reported. See Appendix Section 2.3 for details on the imputation.
Figure 4 Median Total Compensation by Firm Size
Mill
ions
of 2
000
Dol
lars
, log
scal
e
year
rank<=100 100<rank<=300 300<rank
1940 1950 1960 1970 1980 1990 2000
0.5
1.0
2.0
5.0
8.0
11.0
Note: Total compensation is composed of salary, bonuses, long-term bonus payments, and stock option grants. Based on the three highest-paid officers in the largest 50 firms in 1940, 1960 and 1990 (a total of 101 firms). Rank<=100 is the median total compensation across all executives in the sample in firms ranked among the top 100 according to market value in the year; 100<rank=300 is median total compensation for the executives in firms ranked 101 to 300; 300<rank is median total compensation for the executives in all firms in the sample that ranked bellow 300 in the year. Rankings by market value are based on all firms appearing in the CRSP database, which includes all publicly-traded firms in the NYSE, AMEX and NASDAQ stock markets. Market value for each firm is measured at the end of the fiscal year.

49
Figure 5 Total Compensation and the S&P Index
Mill
ions
of 2
000
Dol
lars
year
S&P
Inde
x Re
lativ
e to
CPI
(200
0=1)
Median Compensation (left) S&P Index (right)
1940 1950 1960 1970 1980 1990 2000
1
2
3
4
5
.1
.2
.4
.6
.8
11.2
Note: Total compensation is composed of salary, bonuses, long-term bonus payments, and stock option grants. Based on the three highest-paid officers in the largest 50 firms in 1940, 1960 and 1990 (a total of 101 firms). The S&P index is expressed relative to the CPI and equals 1 in 2000.
Figure 6 Unadjusted and Size-Adjusted Indexes of Pay-to-Performance
1930
s=1
decade
unadjusted JM adjusted JM unadjusted ES adjusted ES
1936-40 1941-49 1950-59 1960-69 1970-79 1980-89 1990-99 2000-05
1
3
5
7
9
Note. Based on the three-highest paid executives in the 50 largest firms in 1940, 1960, and 1990 (a total of 101 firms). All measures are indexed to 1 for the 1936-40 period. Results are based on median regressions estimated separately for each decade. The unadjusted ES is the value of equity at stake and the unadjusted JM is the Jensen-Murphy statistic estimated from equations 2 and 3 in the text. The Jensen-Murphy statistic is calculated by regressing the dollar change in the corresponding remuneration measure on the dollar change in the executive’s firm market value during the year (measured in thousands). The Equity at Stake is calculated by regressing the dollar change in the corresponding remuneration measure on the percentage change in the executive’s firm value, measured by the firm’s rate of return. To control for the effect of changes in firm size on these statistics, the adjusted JM and ES statistics are computed from similar regressions that include controls for firm size and their interaction with firm performance. Size adjustments are described in detail in Section 5.4 and Appendix Section 4. The year 1946 is excluded because the distribution of rates of return is unusually low and highly skewed in that year, possibly due to the end of World War II (see footnote 42 for more details).