Embed Size (px)
Citation preview
FINDING FUNDING FOR ENERGY EFFICIENCY IMPROVEMENTS AT WATER UTILITIES
Jonathan Gledhill Water-Energy Sustainability Symposium 2010
September 29, 2010
Summary
• Water Utilities Offer Enormous Opportunities for Energy Efficiency• Energy Efficiency Funding is a New Source of Capital for Water
Utilities• Opportunities
– Federal Funding– Electric Utilities and other Private Sector Sources
• Regulatory and Cultural Challenges• Case Study• Getting your organization ready
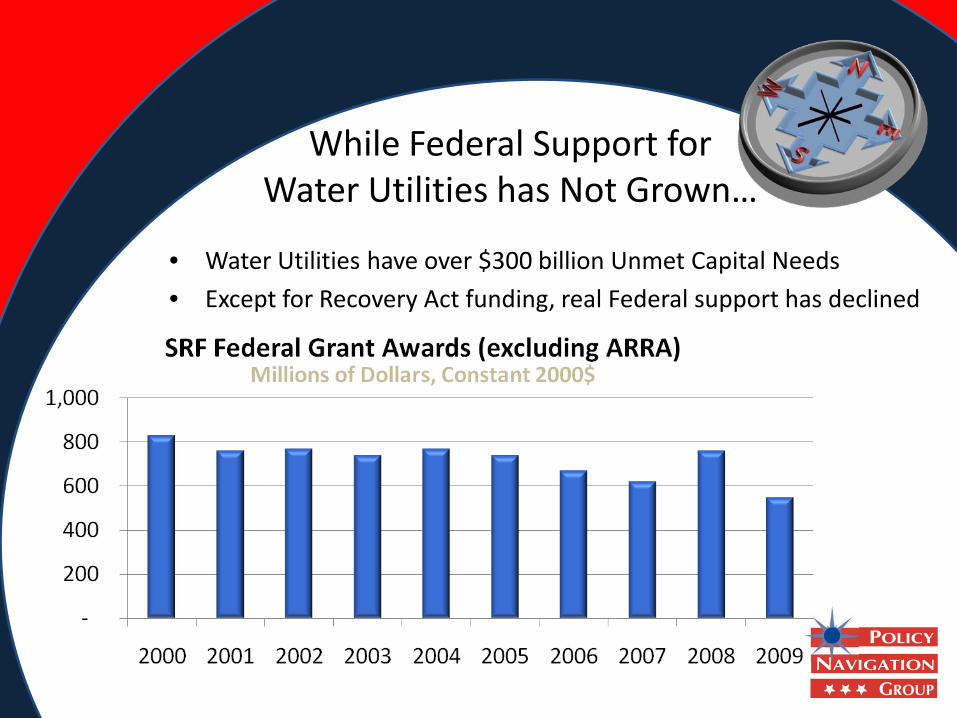
While Federal Support for Water Utilities has Not Grown…
• Water Utilities have over $300 billion Unmet Capital Needs• Except for Recovery Act funding, real Federal support has declined
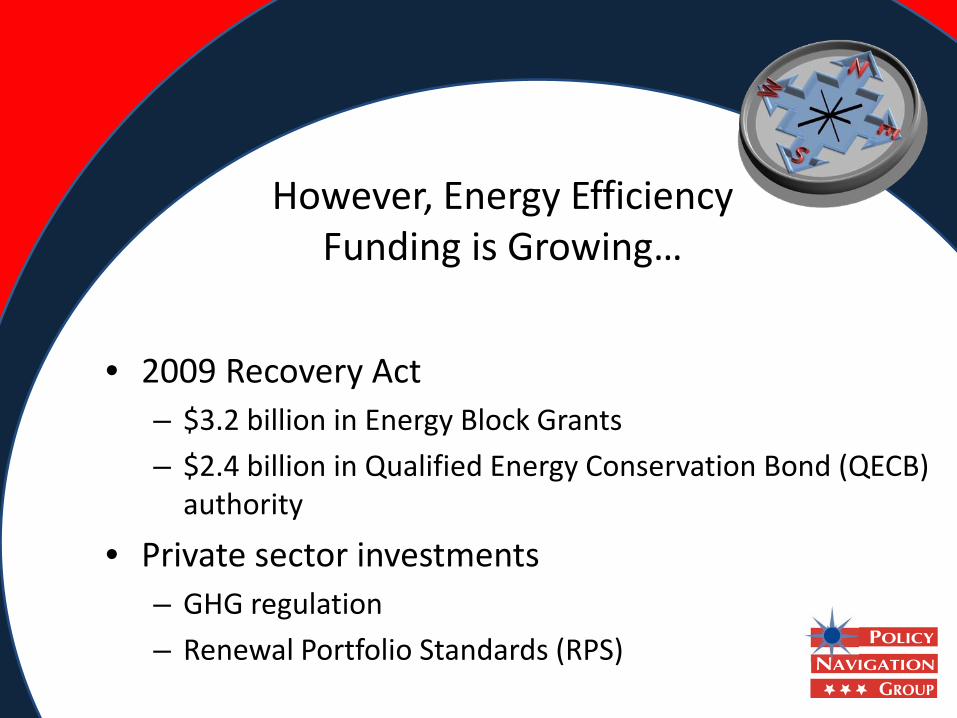
However, Energy Efficiency Funding is Growing…
• 2009 Recovery Act– $3.2 billion in Energy Block Grants– $2.4 billion in Qualified Energy Conservation Bond (QECB)
authority
• Private sector investments– GHG regulation– Renewal Portfolio Standards (RPS)
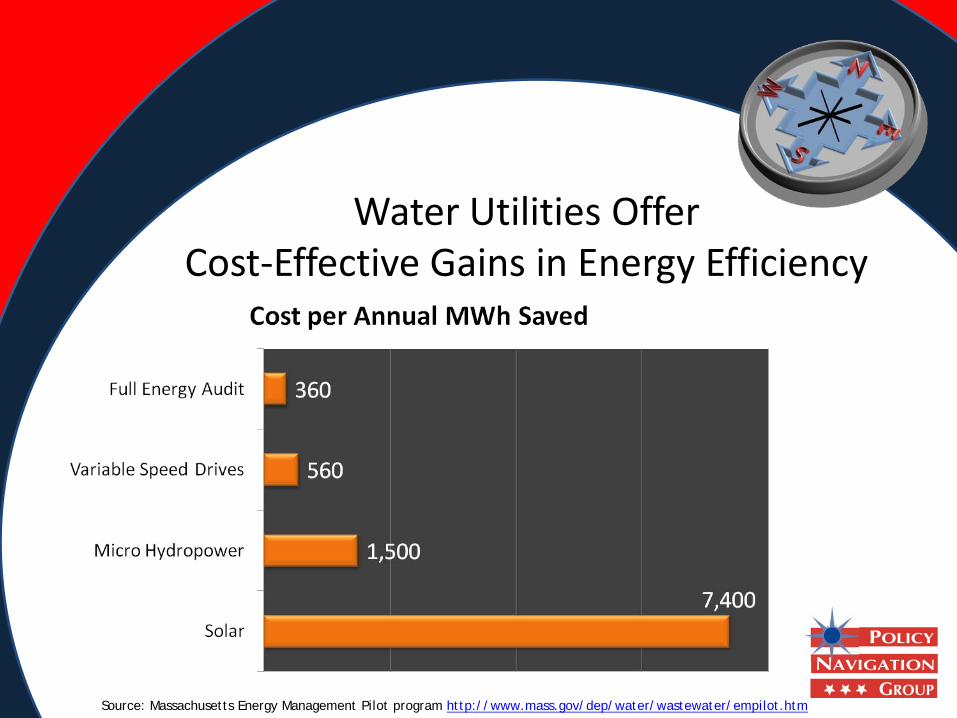
Water Utilities Offer Cost-Effective Gains in Energy Efficiency
Source: Massachusetts Energy Management Pilot program http://www.mass.gov/dep/water/wastewater/empilot.htm
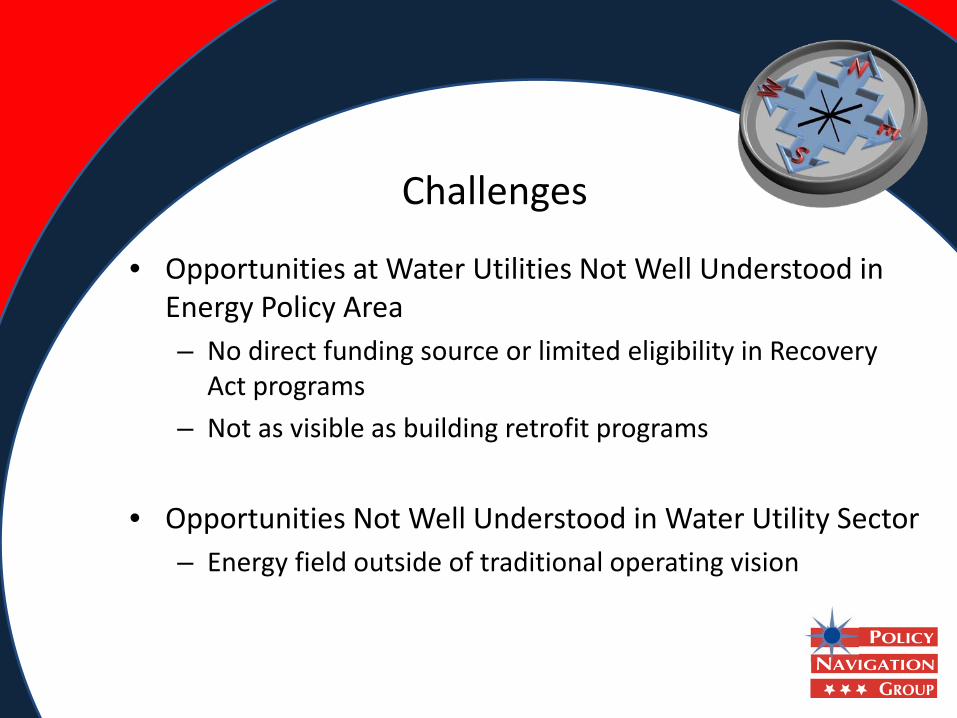
Challenges
• Opportunities at Water Utilities Not Well Understood in Energy Policy Area– No direct funding source or limited eligibility in Recovery
Act programs– Not as visible as building retrofit programs
• Opportunities Not Well Understood in Water Utility Sector– Energy field outside of traditional operating vision
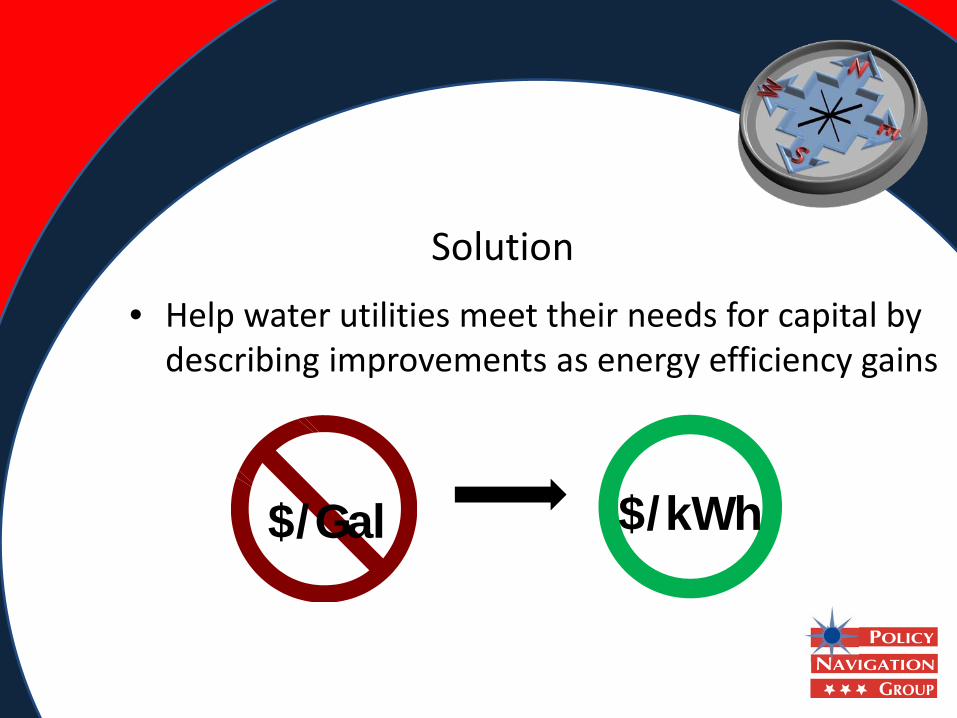
Solution• Help water utilities meet their needs for capital by
describing improvements as energy efficiency gains
$/Gal $/kWh
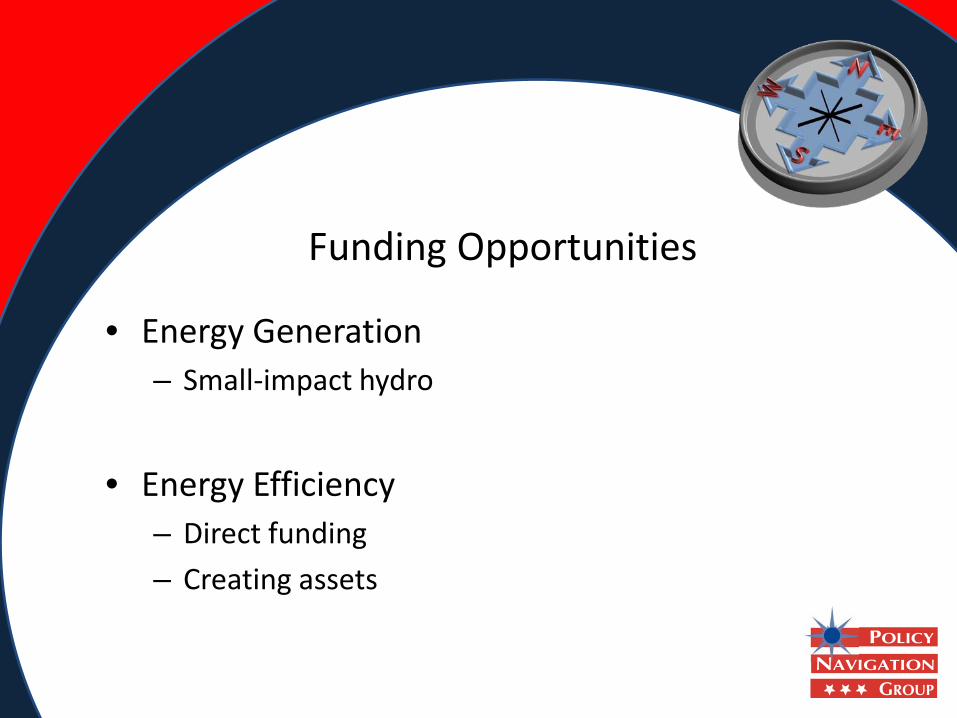
Funding Opportunities
• Energy Generation– Small-impact hydro
• Energy Efficiency– Direct funding– Creating assets
Energy Generation
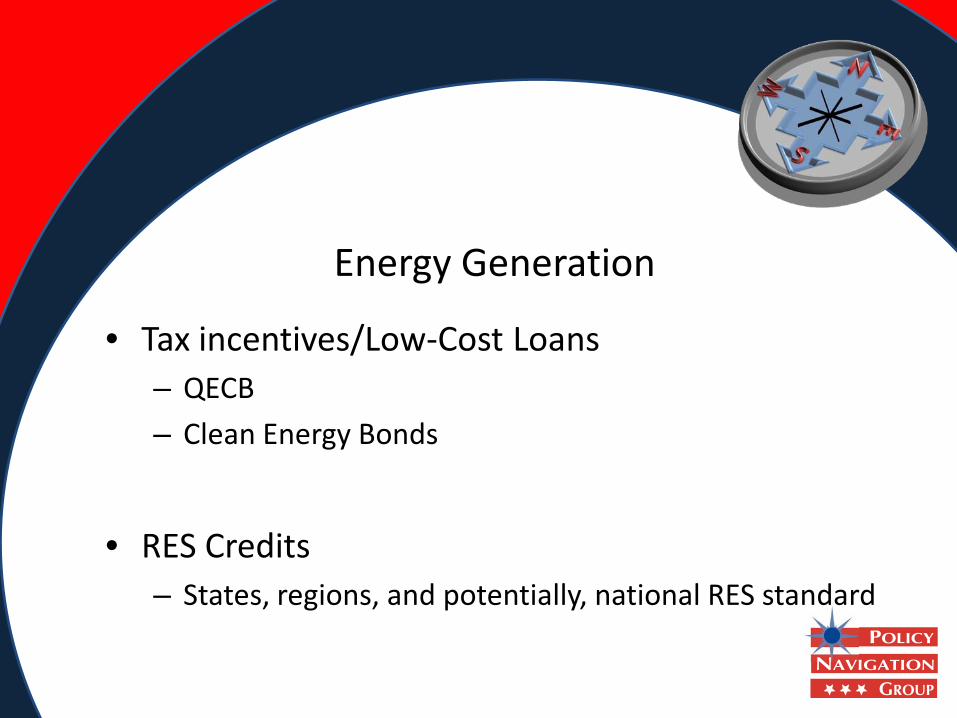
• Tax incentives/Low-Cost Loans– QECB – Clean Energy Bonds
• RES Credits– States, regions, and potentially, national RES standard
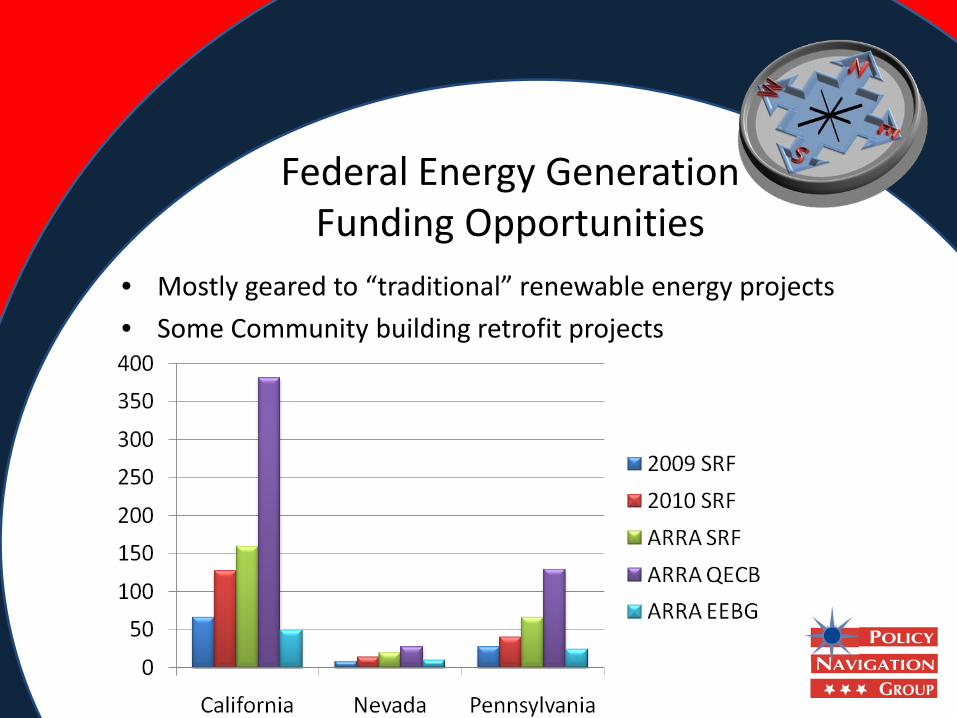
Federal Energy Generation Funding Opportunities
• Mostly geared to “traditional” renewable energy projects• Some Community building retrofit projects
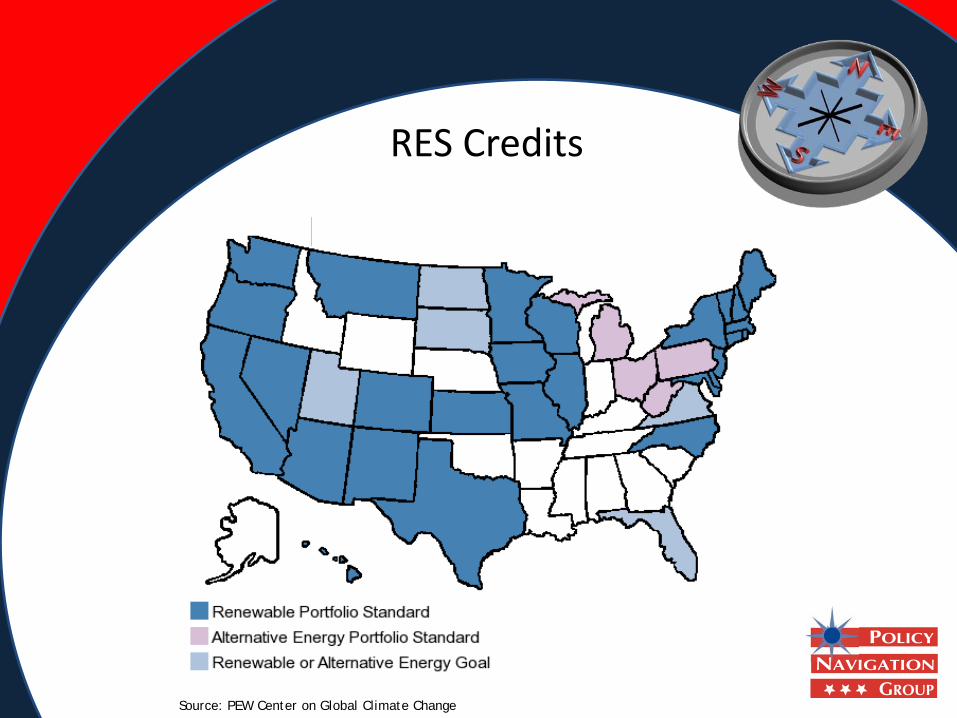
RES Credits
Source: PEW Center on Global Climate Change

RES Credits – Benefit to UtilitiesSubmersible Micro Turbine Project Units
Cost of Project 150,000 $
Energy Savings 325 MWh/yr
Energy Savings 325,000 kWh/yr
Price of Tier I Credit 0.00365 $/kWh
Credit Value 1186.25 $/yr
Present Value of Credit Value $9,422 $
Energy Savings 29,510 $/yr
Credit Value 1,186 $/yr
Simple Payback 5.08 yr
With Credit Value 4.89 yr
Energy Generation
• Main focus of tax/loan incentives not geared to utilities– Incentives are not cash -- Tax incentives may not matter to non-
profits– Conservative borrowing practices– Potential projects are too small to attract third-party investors
• However, RES credits can add to the rate of return of a viable project

Energy Efficiency Funding
• Energy Efficiency Block Grants– Federally-funded, state administered– States can set priorities– States received $2.8 billion through Recovery Act
• Private Sector
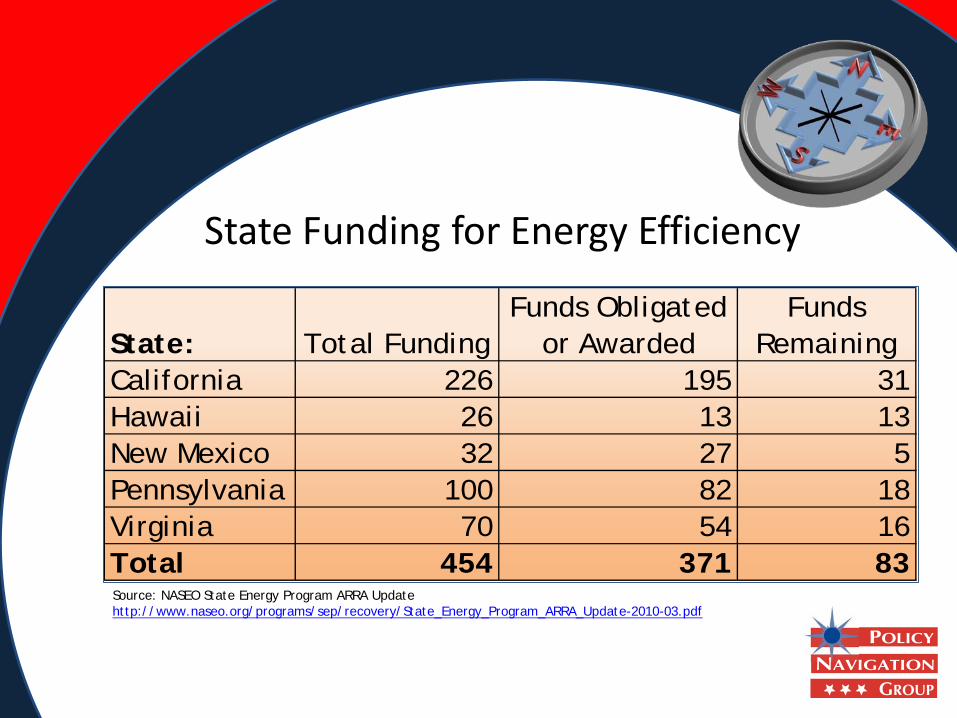
State Funding for Energy Efficiency
State: Total FundingFunds Obligated
or Awarded Funds
RemainingCalifornia 226 195 31Hawaii 26 13 13New Mexico 32 27 5Pennsylvania 100 82 18Virginia 70 54 16Total 454 371 83Source: NASEO State Energy Program ARRA Updatehttp://www.naseo.org/programs/sep/recovery/State_Energy_Program_ARRA_Update-2010-03.pdf

Energy Efficiency Opportunities – Private Sector
• Two Major Trends are creating new markets for energy efficiency credits– Renewal Portfolio Standards– Compliance with GHG legislation and regulation
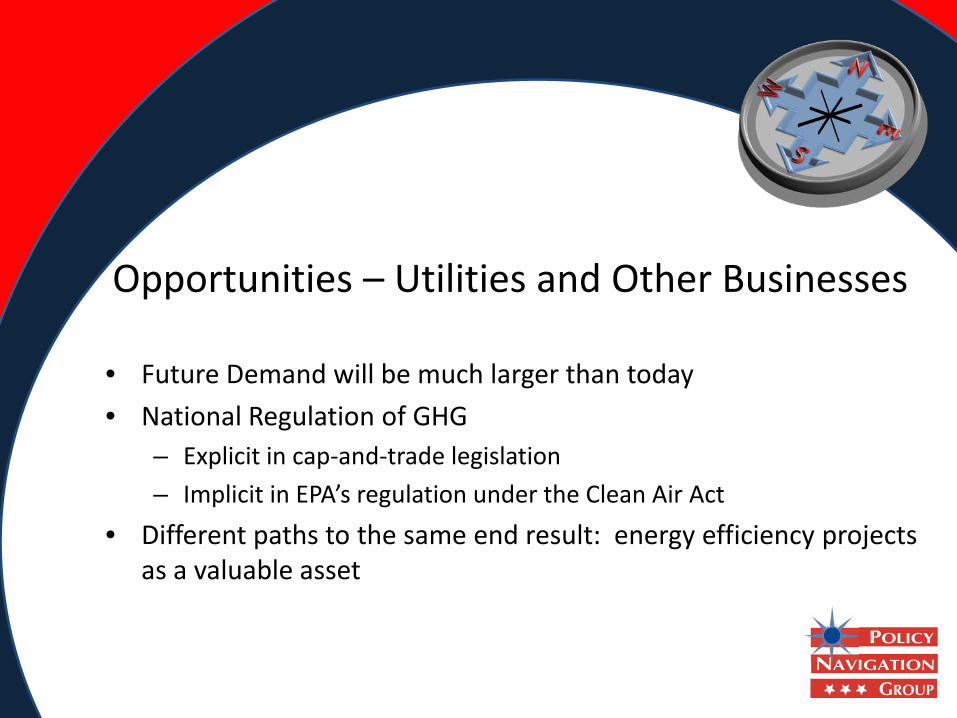
Opportunities – Utilities and Other Businesses
• Future Demand will be much larger than today• National Regulation of GHG
– Explicit in cap-and-trade legislation– Implicit in EPA’s regulation under the Clean Air Act
• Different paths to the same end result: energy efficiency projects as a valuable asset
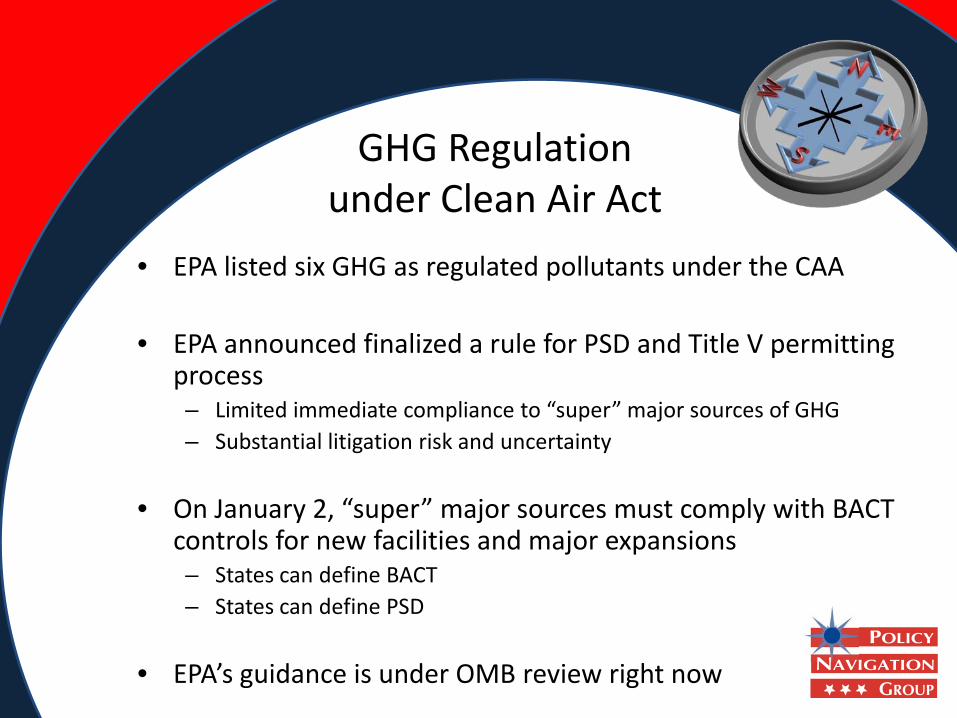
GHG Regulation under Clean Air Act
• EPA listed six GHG as regulated pollutants under the CAA
• EPA announced finalized a rule for PSD and Title V permitting process– Limited immediate compliance to “super” major sources of GHG– Substantial litigation risk and uncertainty
• On January 2, “super” major sources must comply with BACT controls for new facilities and major expansions– States can define BACT – States can define PSD
• EPA’s guidance is under OMB review right now

GHG Regulation under Clean Air Act –Magnitude of the Impact
• Suppose a utility wants to build a 100 MW power plan– About 1 % of capacity added in 2007 in the US
• Suppose State says BACT requires a 10 percent reduction in the grid– $0.15 kW/h is the value of electricity on the margin– 70 percent capacity rating
• Utility must spend at least $8.8 mil on energy efficiency projects
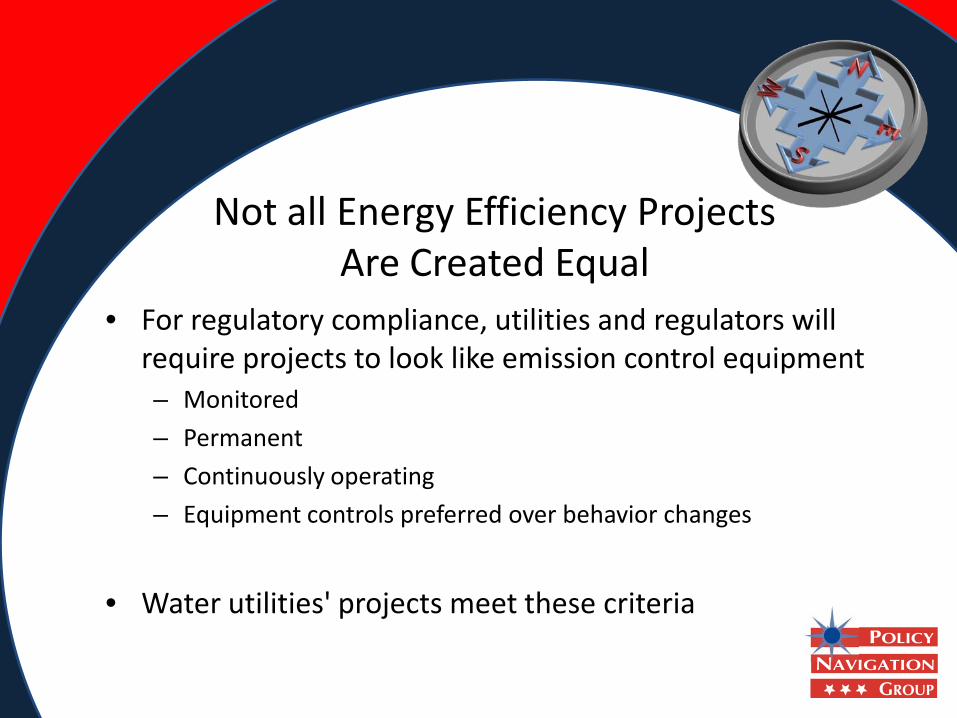
Not all Energy Efficiency Projects Are Created Equal
• For regulatory compliance, utilities and regulators will require projects to look like emission control equipment– Monitored– Permanent– Continuously operating– Equipment controls preferred over behavior changes
• Water utilities' projects meet these criteria
How Can Water Utilities Capitalize?The Challenges
• Finding new energy efficiency opportunities• Positioning capital projects as energy efficiency opportunities • Educating utilities and government agencies • Understanding energy efficiency policies, procedures, and
markets• Maximizing opportunities in rapidly evolving policy field
Case Study: Bucks County Water & Sewer Authority
• We are overcoming these challenges by combining expertise in financing, in energy efficiency, and in water utility operations– Alliance to Save Energy– Policy Navigation Group– Bucks County Water and Sewer Authority
• Create active energy management plans for water utilities
BCW&SA
• Created in 1962• $65 million in Annual Revenue• 78,000 Retail Water and Sewer Customers• 385,000 Wholesale and Retail Population Served in Bucks and
Montgomery Counties, PA• Have Grown by 300% over the last 15 Years through
Acquisitions
The Energy Challenge for BCW&SA
• PA Rate Cap removal– Estimated increase in electric rates of 15-30% beginning 1-1-2011
• Estimated cost of the Cap removal Approx. $750,000 to $900,000 Annually.
• Ultimately to Reduce Carbon Footprint

Further Information
Jonathan GledhillPolicy Navigation Group
http://www.policynavigation.com


![Monitoring Naphthalene Catabolism Bioluminescence with ... · Mineralization. Naphthalene metabolism was monitored byusing a mineralization procedure to measure conversion of["4C]naphthalene](https://img.dokumen.tips/doc/110x75/5e86f458fffce403b43df98f/monitoring-naphthalene-catabolism-bioluminescence-with-mineralization-naphthalene.jpg)