Embed Size (px)
Citation preview

Nanofiltration Mass Transfer at the Entrance Region of a SlitLaminar Flow
Vıtor M. Geraldes,† Viriato A. Semiao,‡ and Maria N. de Pinho*,†
Chemical Engineering Department and Mechanical Engineering Department, Instituto Superior Tecnico,Av. Rovisco Pais, 1049-001 Lisboa, Portugal
A numerical model to predict laminar flows hydrodynamics and concentration polarization ofsalt aqueous solutions in a slit is proposed and experimentally validated. Physical modelingfor the flow and for the mass transfer process is incorporated, in association with the osmoticpressure constitutive equation and a variation law for the membrane intrinsic rejection coefficient.The finite volume formulation is used with the SIMPLE algorithm to solve the discretizedequations derived from the partial nonlinear differential equations of the mathematical model.The convection terms of the transport equations are discretized by the second-order hybrid centraldifferences/upwind scheme. The experimental cell is a slit 200 mm × 30 mm × 2 mm thatsimulates the two-dimensional hydrodynamic flow conditions of the open feed channel of a spiralwound module. The predicted values at the hydrodynamic entrance region for differentpermeation velocities and rejection coefficients for sodium sulfate solutions, and for a singleSchmidt number of 850, are compared against the corresponding experimental values and exhibitan excellent agreement. A new mass transfer correlation Stp ) 1 + 3.68 × 10⁻⁴(x/h)-1.11Re0.95Rep
-1.79 is proposed.
1. Introduction1.1. Preamble. There is currently considerable
interest from industries that are water intensive usersto support the development of efficient and low-costwater purification systems, such as membrane pro-cesses, to minimize waste production approaching theconcept of total water recycling. In membrane pressure-driven processes (reverse osmosis, RO; nanofiltration,NF, and ultrafiltration, UF) selective membranes areused to reject totally or partially the solute and topermeate the solvent, usually water. Due to thisrejection, there is an increase of the solute concentrationat the membrane surface. This phenomenon, known asconcentration polarization, has adverse effects on themembrane performance: membrane fouling and de-crease of productivity/permeated water quality. This isparticularly important for large-scale plants that usecompact modulesshigh ratio of permeation area tovolumeslike the spiral wound ones.
As a result, the design and optimization of membranemodules for pressure-driven membrane processes re-quire a quantitative and precise analysis of concentra-tion polarization. The film theory has been widely usedto quantify this phenomenon in pressure-driven pro-cesses. However, this theory relies on simplifyingassumptions that can be rather severe. Empirical masstransfer correlations used in combination with the filmtheory are only adequate for low mass transfer fluxesand impermeable walls. However, these assumptionsare not always valid in NF systems with high perme-ation rates and in the presence of mixing promoters thatinduce recirculation zones in the flow.
The phenomenon of flow separation of internal flowscaused both by sudden expansions and placement of
obstacles in test-sections geometries is well-known. Theinterest of such flows to engineering equipment design,mainly as far as heat and mass transfer processes areconcerned, has been stressed in many publications sincethe early sixties.1-3
However, only much later the advancement on theoryand experimental techniques required to thoroughlystudy and understand such flows reached a state ofacceptable development.4-6 The better insight of thoseflows yielded the development of numerical techniquescapable of solving the elliptic nonlinear differentialtransport equations governing such flows.7
Prediction codes capable of computing the hydrody-namics in recirculating flows in channels to a reasonabledegree of accuracy exist. However, these predictive toolsare far from being employed as a means of managingrationally the fluid flows to enable the enhancement ofmass transfer and the optimization of membranesprocesses.
Computational fluid dynamics (CFD) together withmass transfer modeling can, therefore, be used in thefeed-side of membrane modules to calculate the crucialvariables that influence the solute mass accumulationat the membrane surface. This allows for the predictionof the concentration polarization without resorting tosimplifying approaches such as the film theory.
The present research addresses the quantification ofmass transfer in an open slit and its dependence on thelaminar feed flow hydrodynamics through the use ofCFD. This work is of crucial importance to the designand optimization of spacers for spiral wound modules.
1.2. Numerical Predictions on Membrane Pro-cesses. In the open literature different numericalmethods have been used to quantify the concentrationpolarization phenomenon: finite differences, finite ele-ments, and finite volumes.
There are not many attempts to simultaneously modelthe hydrodynamic and the mass transfer processes in
* Corresponding author. Fax: +351 1 849 92 42. Tel.: +3511 841 74 88. E-mail: [email protected].
† Chemical Engineering Department.‡ Mechanical Engineering Department.
4792 Ind. Eng. Chem. Res. 1998, 37, 4792-4800
10.1021/ie980198k CCC: $15.00 © 1998 American Chemical SocietyPublished on Web 11/14/1998

two-dimensional flows within the feed-side of pressure-driven membrane modules. One of the first attempts8
describes the application of a simplified model using thefinite differencing approach to solve the transportequation predicting the solute concentration profiles inRO. This author used an analytical velocity profile9 forthe laminar flow in a slit and neglected the axialdiffusion of the solute concentration in order to obtaina parabolic transport equation that was subsequentlysolved with the Crank-Nicholson discretization method.The same problem was differently solved10 by assuminga slip velocity condition at the membrane surface. Inthat case, to obtain the velocity profiles, the authorssolved the momentum transport equations for laminarflow using the regular perturbations method. Withthese velocity profiles the solute continuity equation wassolved by the implicit finite-difference technique. Pre-dictions in UF of the concentration polarization in a slitwith laminar flow and a variable rejection coefficienthave also been presented.11,12 The first work11 describedthe use of a nonconservative discretization method that,to ensure results independent of the grid, required muchtoo fine grids. The anomalous results obtained were dueto the lack of a systematic grid independence study.Making recourse to analytical solutions for the velocityprofiles and using the Crank-Nicholson discretizationmethod for the transport equation of the solute concen-tration, the second group of authors12 reported predic-tions and grid independence tests for the same case.
Besides finite difference techniques the method offinite elements has also been used to predict theconcentration polarization in UF and RO processes. TheGalerkin finite elements were used to predict the soluteconcentration distribution in a RO slit and to study theeffect of spacers.13 These authors used other workers’velocity profiles avoiding the numerical solution of thecontinuity and momentum equations. More recently,predictions for the solute concentration, the pressure,and the velocity fields in a three-dimensional UF slit,using the finite elements method, were presented.14 Thesize of the algebraic equations system was such that theauthors were obliged to resort to supercomputers inorder to make possible its solution. The study waslimited to low Schmidt numbers (below 300) because ofnonconvergence problems, and hence, it was not possibleto validate the model against experimental data.
A third numerical approach to predict such phenom-ena is the finite volume formulation. With the use ofthe upwind scheme to discretize the convection termsof the transport equations, two-dimensional predictionsof the solute concentration, the pressure, and thevelocity fields were presented.15,16 The first group ofauthors15 have presented predictions for UF in tubularmembrane modules, assuming that the flow was gov-erned by parabolic transport equations. This work wasthen extended to parametric studies of recirculatingflows in membrane modules.16
The use of first-order discretization schemes, like thepure upwind, together with coarse grids may lead tosevere inaccuracies17,18 due to the truncation error or,when the flow streamlines are skewed to the grid, tofalse diffusion problems. Central differencing, in turn,has been shown to possess high-convection instabilityproblems.
The hybrid second-order scheme,19 which combinesthe upwind and the central differencing techniques, was
used20 to overcome the above-mentioned drawbacks inthe prediction of the polarization concentration in a two-dimensional developed laminar flow in a slit. Forvalidation purposes, other authors’ analytical solutionsfor the velocity profiles9 and for the solute massconcentration21 were used. The predicted results werein excellent agreement with the analytical solutions andthe grid independence study performed showed that agrid comprising 109 × 50 nodes was fine enough.
As very early concluded,22 mass transfer is enhancedby boundary layer removal techniques, and the designand optimizing of NF/RO equipment should take thatinto consideration. In fact, the feed flow managementhas to ensure the control of the boundary layer and ofthe mixing of the boundary layer with the main streamat frequent intervals and with the minimum pumpingpower requirements.
This paper addresses the NF mass transfer depen-dence on the hydrodynamic boundary layer through theuse of CFD incorporating the finite volume approachwith the hybrid second-order scheme. The CFD pro-gram developed in this work represents a tool able tosimulate not only boundary layer flows in open chan-nels, which are dealt herein, but also more intricateflows such as those with recirculation zones occurringin modules with netlike spacers. This is in contrast witha simplified and limited approach such as the boundarylayer theory. Predictions of velocities, pressure, andsolute concentration profiles at the feed-side entranceregion (developing boundary layer) of a laboratory slitwith a permeable wall are presented. The experimentalresults are in good agreement with the predicted valuesover a wide range of circulating velocities and pressures.The intrinsic rejection coefficients are made to vary withthe permeation velocities.
1.3. The Studied Case. The separation systemstudied in this work is sketched in Figure 1 and consistsof a rectangular channelsslitswith half-height h, thebottom wall being a NF selective membrane that rejectsthe solute and permeates the solvent. The aqueous feedsolution circulates tangentially to the membrane inlaminar flow. A hydraulic permeability Ah and anintrinsic rejection coefficient f ′ ) (ωAm - ωAp)/ωAmcharacterize the membrane.
For the numerical predictions, it was assumed thatthe aqueous solution exhibits constant density andviscosity and that the solute diffusivity is also constant.Gravity effects were not considered. The experimentalresults of permeation of sodium sulfate solution, for asingle Schmidt number of 850, validate the numericalpredictions of concentration polarization.
Figure 1. NF slit with developing velocity profile showing theincrease of concentration at the membrane surface.
Ind. Eng. Chem. Res., Vol. 37, No. 12, 1998 4793

2. Mathematical Model
In a steady-state two-dimensional laminar flow, withconstant fluid density, viscosity and mass diffusioncoefficient, as in the present case, equations for themotion and for the solute transport of a nonreactingbinary solution in Cartesian coordinates are the follow-ing:
In the previous equations u and v are the velocitycomponents in the x and y directions, respectively, F isthe fluid density, p is the pressure, µ is the fluidviscosity, ωA is the mass fraction of species A, and DABis the binary mass diffusion coefficient.
Although the case studied herein refers to a two-dimensional boundary layer flow, a typical situationwhere the axial mass and momentum diffusion termsare negligible, eqs 1-4 were not simplified accordingly.The authors followed this approach in order to developa model that is descriptive of flows as those occurringin spiral wound modules (slits with spacers), where themomentum and mass conservation equations exhibit nodominant terms. Additionally, the numerical method(and the associated computer code) must be versatileenough so that changes in the geometry or in the flowstructure (e.g., the appearance of recirculating zones bythe placement of spacers) do not require special effortin the performance of the predictions.
The magnitude order of the different terms appearingin eqs 1-4 is very easily extracted from the modelresults, as the values of all the dependent variables areknown for every grid node covering the physical domain.Therefore, the present model enables in a simple waythe performance of parametric analysis.
For the sake of numerical modeling simplicity, theprevious eqs 1-4, governing the laminar flow hydrody-namics and the mass transfer in a slit, can be writtenin the general form of a generic φ-property transportequation, containing a convection, a diffusion, and asource term:
Here Sφ and Γφ are, respectively, the source term andthe diffusitivity coefficient of φ.
At the feed membrane surface the u-velocity is zeroand the v-velocity is the permeation velocity vp and isproportional to the effective operating pressure. The
mass fraction at the membrane surfacesωAmsis giventhrough a mass balance that equals the total flux in thefeed membrane side to the permeated flux. The osmoticpressure difference, ∆Π, is related to the transmem-brane solute mass fraction difference through theosmotic coefficient, b.
Mathematically, these boundary conditions are ex-pressed by
In contrast with the vast majority of the literature, theintrinsic rejection coefficient is made variable accordingto the following relation:22
Under operating conditions for minimal polarizationconcentration (higher values of the circulating Reynoldsnumber where the intrinsic rejection coefficient valuef ′ approaches the apparent rejection coefficient valuef) there was experimental evidence of f ′ dependence onvp. Moreover, a close agreement between the modelpredicted values and the experimental ones was ob-tained with the variation of f ′ with vp made explicitthrough eq 10.
The constants b1 and b2 are characteristic of a givenmembrane-solute system. These constants were ob-tained by numerical adjustment to the experimentalpoints for the studied membrane-solute system. Thevp symbol appearing in eq 10 stands for the localpermeation velocity calculated by the model at eachboundary grid node.
3. Numerical Model
The set of differential equations describing the NFseparation process in a slit is solved by the finite volumeformulation.23 This method entails subdividing thephysical domain into a number of finite volumes or cells,by generating a suitable grid fitting the physical do-main. Figure 2 shows a scheme of the grid used that isgenerated in such a way that the faces of the controlvolumes are located midway the neighbor grid lines.This procedure ensures that the physical boundarysurfaces coincide with the faces of the boundary controlvolumes.
The solution algorithm was embodied in a version ofthe TEACH code7 for two-dimensional recirculatingflows. The convection terms were discretized by thehybrid central differences/upwind scheme,19 which usesa switching strategy between the second-order (centraldifferencing) and the first-order (upwind) methods,according to the value of the local Peclet number. Theuse of coarse grids might lead to false diffusion problemsif the flow streamlines were skewed to the grid. In the
(i) mass conservation
∂u∂x
+ ∂v∂y
) 0 (1)
(ii) momentum conservation in the x-direction
u∂u∂x
+ v∂u∂y
) -1F
∂p∂x
+ µF(∂2u
∂x2+ ∂
2u∂y2) (2)
(iii) momentum conservation in the y-direction
u∂v∂x
+ v∂v∂y
) - 1F
∂p∂y
+ µF(∂2v
∂x2+ ∂
2v∂y2) (3)
(iv) conservation of solute A
u∂ωA
∂x+ v
∂ωA
∂y) DAB(∂2ωA
∂x2+
∂2ωA
∂y2 ) (4)
Fu∂φ
∂x+ Fv∂φ
∂y- Γφ(∂2
φ
∂x2+ ∂
2φ
∂y2) - Sφ ) 0 (5)
x ) 0 ∀y u ) u0 v ) 0 ωA ) ωA0 (6)
x ) l ∀y ∂u∂x
) 0 ∂v∂x
) 0∂ωA
∂x) 0 (7)
y ) 0 ∀x u ) 0 v ) vp ) - Ah(∆P - ∆Π)
∆Π ) bf ′ωAm DAB
∂ωA
∂y) vpωAf ′ (8)
y ) 2h ∀x u ) 0 v ) 0∂ωA
∂y) 0 (9)
f ′ ) 1
1 +b1
vp+ b2
∆Pvp
(10)
4794 Ind. Eng. Chem. Res., Vol. 37, No. 12, 1998

present case, however, as the values of the permeationvelocity are several orders of magnitude smaller thanthose for the tangential velocity, the flow is almostaligned with the grid and numerical diffusion can,therefore, be neglected. The use of higher order schemes,such as the QUICK scheme,17 that are more computingdemanding, are not justified in flows of the type studiedhere.
The finite-difference equation representing the dis-cretized form of the general differential eq 5 is givenby20,23
where P is the control volume grid node, Ap ) ∑nAn, and∑ denotes summation over the four neighboring nodes(see Figure 2). One such equation exists for every scalarvariable at every grid node. In the case of the velocitiessimilar equations apply, but the control volumes aredisplaced such that they pass through the pressuresdriving the component in question, necessitating minorchanges to the coefficients expressions. This procedureconstitutes the well-known staggered grid strategy.
In the slit predictions, the SIMPLE algorithm23
calculates the velocities and pressure. As described bythe author,23 this algorithm involves the solution of themomentum equations using the prevailing pressures,p*, to yield an intermediate velocity field denoted byu* and v*; then velocity corrections are defined andlinked to corresponding pressure corrections by relationsof the following form:
where Dnu and Dn
v are evaluated from the relevantmomentum equation. In the previous equations sub-scripts b and n stand for the boundary of the controlvolume and for the neighbor grid nodes, respectively.
Equations 12a,b are substituted into the integratedform of the continuity equation to give:
from which p′ and, hence, u′ and v′ are determined.Equation 13 may be recognized as a form of Poissonequation for the pressure correction, in which S0 )-∑bmb is the local mass imbalance of the momentum-based u* and v* velocities. After the solution of thisequation, corrections are applied by setting u ) u* +u′, v ) v* + v′, and p ) p* + p′ and the entire procedureis repeated until the momentum and the continuityequations are both satisfied. The calculations of theremaining dependent variables are incorporated into theabove sequence.
A form of the Gauss-Seidel line-by-line iterationprocedure obtains the solution of the individual sets oflinear algebraic equations that result from the integra-tion of the differential equations in the control volumescovering the physical domain.
The grid independence study for NF calculationsshowed that the grid used comprising 35 × 30 nodes inthe x and y directions, respectively, was fine enough.
An expansion factor, defined by the ratio of the meshsize of the grid between two consecutive nodes, wasmade equal to 1.1 in the x-direction and 1.15 in they-direction. The grid was more refined with respect tox-direction near the inlet because the velocity gradientsare more pronounced in this region, and it was also morerefined with respect to the y-direction near the mem-brane surface as the solute mass fraction gradients aremore pronounced there.
4. Experimental Section
4.1. Permeation Cell. NF permeation tests areperformed within a stainless steel cell shown in Figure3. The cell consists of two detachable parts. The upperpart is a high-pressure chamber provided with v-shapedinlet and outlet openings for optimal flow distributionof the feed solution. The lower part is the membranestand, provided with an outlet opening for the with-drawal of the membrane permeated product solution.The effective area of the membrane in the cell is 60 cm2
(20 cm length and 3 cm width). The wet membrane ismounted on a stainless steel porous plate embedded inthe lower part of the cell such that the surface layer ofthe asymmetric membrane faces the feed solution onthe high-pressure side of the cell. A wet Whatman filterpaper is placed between the membrane and the porousplate to protect the membrane from abrasion and alsoto aid the flow of the product solution through theporous plate. Under operating conditions of NF, theporous plate and the filter paper offer practically noresistance to fluid flow. The upper and lower parts ofthe cell are set in proper alignment with rubber O-ringcontacts between the high-pressure chamber and thewet membrane. The channel for the circulation of thepressurized feed is a slit with the large area surfacesbeing parallel and separated by a very narrow distanceof 2 mm. This slit height exhibits a very small dimen-sion when compared to the other channel dimensionsand, therefore, simulates the feed channel of spiralwound modules.
The CD-NF-50 membrane (supplied by SEPAREM,Biella, Italy) is a thin film composite membrane withan active layer of TFZ (poly(trans-2,5-dimethyl)pipera-
Figure 2. Location of a scalar variable control volume in the grid.
(AP - SP)φp ) ∑n
Anφn + SU (11)
u′b ) Dnu(p′n - p′P) (12a)
v′b ) Dnv(p′n - p′P) (12b)
Dnu )
∂ub
∂(pn - pP)(12c)
Dnv )
∂vb
∂(pn - pP)(12d)
APp′p ) ∑Anp′n + S0 (13)
Ind. Eng. Chem. Res., Vol. 37, No. 12, 1998 4795

zinethiofurazanamide) and a porous layer of PES (poly-ether sulfone). The several samples of membranes usedin the permeation tests have a hydraulic permeabilityin the range of 10-11-1.3 × 10⁻¹¹ m2 s kg-1.
4.2. Installation. The NF laboratory setup consistsof a stainless steel feed tank with a volume of 2 L. Thetemperature control of the feed solution is assuredthrough a thermostated fluid circulating in a jacketaround the feed tank. The temperature is measured atthe cell inlet with a J-type thermocouple.
The feed solution is pressurized through a diaphragm-dosing pump, with a maximum flow rate of 120 L h-1,and a pulsation dampener is used for absorption ofpressure fluctuations. The pressure is measured at boththe inlet and outlet of the NF cell through pressuretransducers with an accuracy of (0.015 × 10⁵ Pa. Tocontrol the pressure applied one makes recourse to abackpressure valve that possesses an electropneumaticPID controller.
The solutessodium sulfatesis of pro analysis gradedelivered from Merck. Deionized water is used with amaximum conductivity of 2 µS cm-1 at 25 °C. Theconcentrations of the feed and of the permeated streamsare measured using a CRISON conductimeter, model525, with a cell constant of 1 cm-1.
The data acquisition and the temperature and pres-sure control are performed using a PC.
4.3. Procedure. The pure water flux is measuredfor pressure values of 10 × 105, 20 × 105, 30 × 105, and40 × 105 Pa in order to evaluate the hydraulic perme-ability. The membranes are first compacted for 3 h at50 × 105 Pa and 25 °C.
A first set of experiments is performed with theobjective of determining the flux and the rejectioncoefficient of sodium sulfate aqueous solutions using thefull membrane length (20 cm). For this set of tests, twosolutions of sodium sulfate (2 g and 7 g L-1) are used,and tests with circulating velocities corresponding toReynolds numbers of 100, 250, 500, and 1000 andpermeation velocities corresponding to ∆P of l0 × 105,20 × 105, 30 × 105, and 40 × 105 Pa are carried out.
A second set of experiments is performed to study themass transfer in the hydrodynamic entrance region ofthe slit. For that, the membrane regions correspondingto the fully developed flow are sealed through animpermeable thin film. The membrane lengths testedare 1.5, 3, and 6 cm, which are, respectively, the slitentrance lengths relative to circulation Reynolds of 250,500, and 1000. Three solutions of sodium sulfate areused: 2, 7, and 14 g L-1. The values of operatingpressure ∆P are 20 × 105, 30 × 105, and 40 × 105 Pa.All the experimental tests are performed for a singleSchmidt number of 850.
Figure 3. Schematic diagrams of the experimental installation and of the top view and longitudinal cross-section of the NF cell.
4796 Ind. Eng. Chem. Res., Vol. 37, No. 12, 1998
The hydraulic permeability of the membrane is al-ways measured before and after the permeation of thedifferent sodium sulfate solutions used in the experi-ments in order to verify the membrane fouling.
The flux and the rejection coefficients, f, are measuredfor all the above-described operating conditions.
The solution temperature was 25 ( 0.5 °C for all thepermeation tests.
The physical properties of the sodium sulfate solutionwere obtained from the literature.24
5. Results
All the experimental results and all the predictionspresented below are referred to a single Schmidtnumber of 850.
5.1. Experimental and Numerical Characteriza-tion of the NF Selective Permeation System. Thepermeation results for the Na2SO4 solutions with con-centrations of 2 and 7 g L-1 are shown in Figures 4a,band 5a,b.
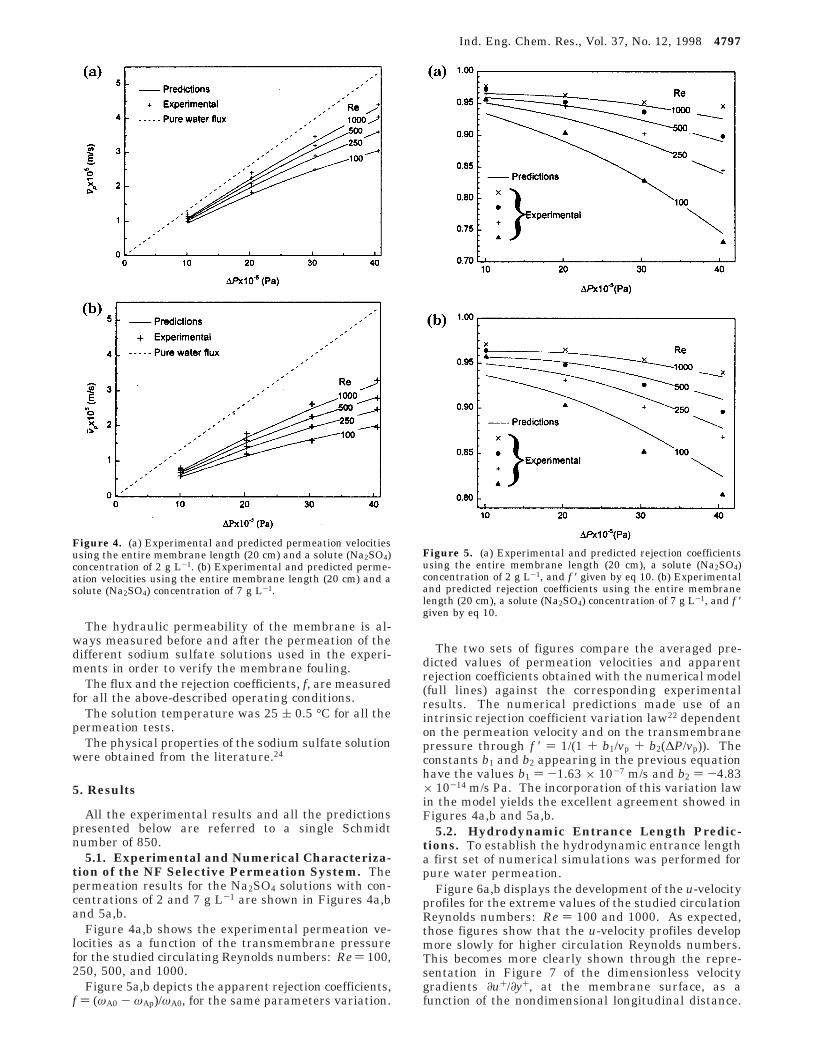
Figure 4a,b shows the experimental permeation ve-locities as a function of the transmembrane pressurefor the studied circulating Reynolds numbers: Re ) 100,250, 500, and 1000.
Figure 5a,b depicts the apparent rejection coefficients,f ) (ωA0 - ωAp)/ωA0, for the same parameters variation.
The two sets of figures compare the averaged pre-dicted values of permeation velocities and apparentrejection coefficients obtained with the numerical model(full lines) against the corresponding experimentalresults. The numerical predictions made use of anintrinsic rejection coefficient variation law22 dependenton the permeation velocity and on the transmembranepressure through f ′ ) 1/(1 + b1/vp + b2(∆P/vp)). Theconstants b1 and b2 appearing in the previous equationhave the values b1 ) -1.63 × 10⁻⁷ m/s and b2 ) -4.83× 10⁻¹⁴ m/s Pa. The incorporation of this variation lawin the model yields the excellent agreement showed inFigures 4a,b and 5a,b.
5.2. Hydrodynamic Entrance Length Predic-tions. To establish the hydrodynamic entrance lengtha first set of numerical simulations was performed forpure water permeation.
Figure 6a,b displays the development of the u-velocityprofiles for the extreme values of the studied circulationReynolds numbers: Re ) 100 and 1000. As expected,those figures show that the u-velocity profiles developmore slowly for higher circulation Reynolds numbers.This becomes more clearly shown through the repre-sentation in Figure 7 of the dimensionless velocitygradients ∂u+/∂y+, at the membrane surface, as afunction of the nondimensional longitudinal distance.
Figure 4. (a) Experimental and predicted permeation velocitiesusing the entire membrane length (20 cm) and a solute (Na2SO4)concentration of 2 g L-1. (b) Experimental and predicted perme-ation velocities using the entire membrane length (20 cm) and asolute (Na2SO4) concentration of 7 g L-1.
Figure 5. (a) Experimental and predicted rejection coefficientsusing the entire membrane length (20 cm), a solute (Na2SO4)concentration of 2 g L-1, and f ′ given by eq 10. (b) Experimentaland predicted rejection coefficients using the entire membranelength (20 cm), a solute (Na2SO4) concentration of 7 g L-1, and f ′given by eq 10.
Ind. Eng. Chem. Res., Vol. 37, No. 12, 1998 4797
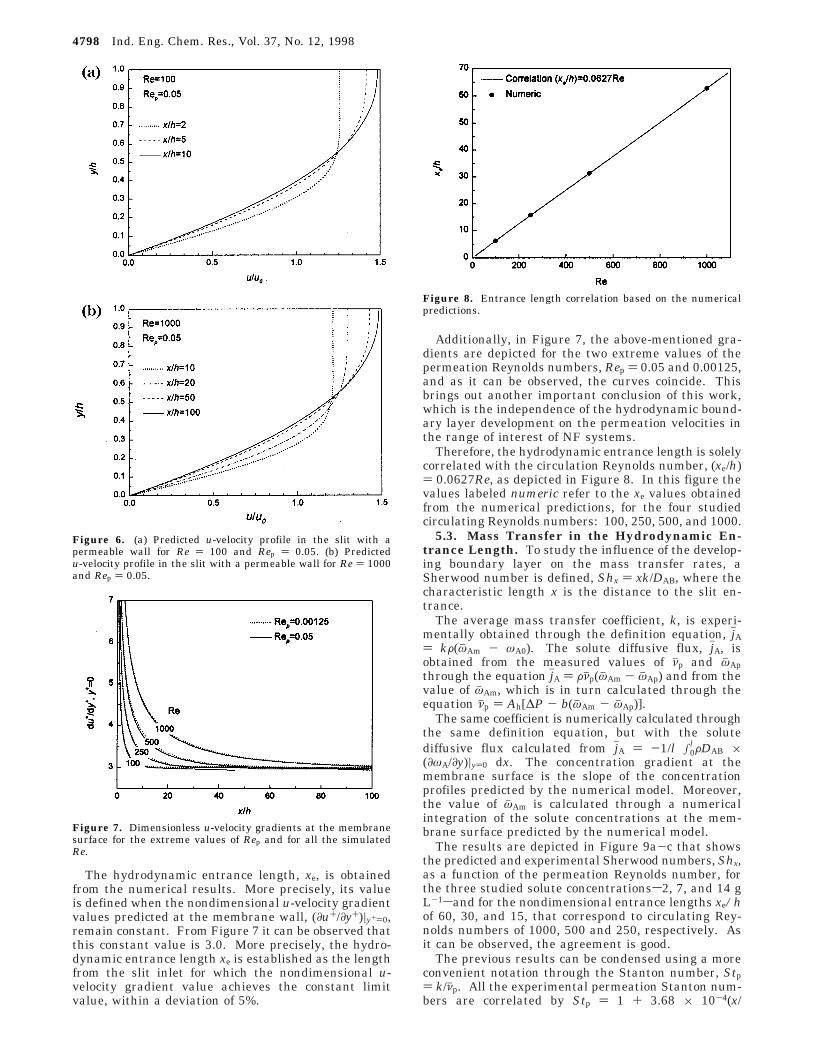
The hydrodynamic entrance length, xe, is obtainedfrom the numerical results. More precisely, its valueis defined when the nondimensional u-velocity gradientvalues predicted at the membrane wall, (∂u+/∂y+)|y+)0,remain constant. From Figure 7 it can be observed thatthis constant value is 3.0. More precisely, the hydro-dynamic entrance length xe is established as the lengthfrom the slit inlet for which the nondimensional u-velocity gradient value achieves the constant limitvalue, within a deviation of 5%.
Additionally, in Figure 7, the above-mentioned gra-dients are depicted for the two extreme values of thepermeation Reynolds numbers, Rep ) 0.05 and 0.00125,and as it can be observed, the curves coincide. Thisbrings out another important conclusion of this work,which is the independence of the hydrodynamic bound-ary layer development on the permeation velocities inthe range of interest of NF systems.
Therefore, the hydrodynamic entrance length is solelycorrelated with the circulation Reynolds number, (xe/h)) 0.0627Re, as depicted in Figure 8. In this figure thevalues labeled numeric refer to the xe values obtainedfrom the numerical predictions, for the four studiedcirculating Reynolds numbers: 100, 250, 500, and 1000.
5.3. Mass Transfer in the Hydrodynamic En-trance Length. To study the influence of the develop-ing boundary layer on the mass transfer rates, aSherwood number is defined, Shx ) xk/DAB, where thecharacteristic length x is the distance to the slit en-trance.
The average mass transfer coefficient, k, is experi-mentally obtained through the definition equation, jhA) kF(ωj Am - ωA0). The solute diffusive flux, jhA, isobtained from the measured values of νjp and ωj Apthrough the equation jhA ) Fνjp(ωj Am - ωj Ap) and from thevalue of ωj Am, which is in turn calculated through theequation νjp ) Ah[∆P - b(ωj Am - ωj Ap)].
The same coefficient is numerically calculated throughthe same definition equation, but with the solutediffusive flux calculated from jhA ) -1/l ∫0
l FDAB ×(∂ωA/∂y)|y)0 dx. The concentration gradient at themembrane surface is the slope of the concentrationprofiles predicted by the numerical model. Moreover,the value of ωj Am is calculated through a numericalintegration of the solute concentrations at the mem-brane surface predicted by the numerical model.
The results are depicted in Figure 9a-c that showsthe predicted and experimental Sherwood numbers, Shx,as a function of the permeation Reynolds number, forthe three studied solute concentrationss2, 7, and 14 gL-1sand for the nondimensional entrance lengths xe/hof 60, 30, and 15, that correspond to circulating Rey-nolds numbers of 1000, 500 and 250, respectively. Asit can be observed, the agreement is good.
The previous results can be condensed using a moreconvenient notation through the Stanton number, Stp) k/νjp. All the experimental permeation Stanton num-bers are correlated by Stp ) 1 + 3.68 × 10⁻⁴(x/
Figure 6. (a) Predicted u-velocity profile in the slit with apermeable wall for Re ) 100 and Rep ) 0.05. (b) Predictedu-velocity profile in the slit with a permeable wall for Re ) 1000and Rep ) 0.05.
Figure 7. Dimensionless u-velocity gradients at the membranesurface for the extreme values of Rep and for all the simulatedRe.
Figure 8. Entrance length correlation based on the numericalpredictions.
4798 Ind. Eng. Chem. Res., Vol. 37, No. 12, 1998

h)-1.11Re0.95Rep-1.79. As depicted in Figure 10, which
compares this experimental correlation with the corre-sponding predicted Stanton numbers, the fitting is good.
6. Conclusions
Boundary layer removal is intrinsically associatedwith mass transfer enhancement. Although in engi-neering practice devices such as spacers in spiral woundmodules have been successfully used to achieve this
goal, their design has been based on empirical methods.The systematic quantification of the effect of the devel-oping boundary layer in the mass transfer rates in openchannels through the CFD tool is indispensable torationally design optimal spacer geometries. The presentpaper, making recourse to this CFD tool, quantifies themass transfer in the entrance region of an open rect-angular channel yielding the following mass transfercorrelation for the slit entrance region: Stp ) 1 + 3.68× 10⁻⁴(x/h)-1.11Re0.95Rep
-1.79.This correlation is experimentally confirmed for a
wide range of NF conditionssRe ) 100, 250, 500, and1000, ∆P ) l0 × 105, 20 × 105, 30 × 105, and 40 × 105
Pa, and for a single Schmidt number of 850sand forintrinsic rejection coefficients dependent on vp and ∆P:f ′ ) 1/(1 + b1/νp + b2(∆P/νp)).
The boundary layer develops in the channel entrancelength (xe/h) ) 0.0627Re, which, as predicted by theCFD model, is independent of the permeation velocitiesin the range of interest for NF and, therefore, dependsonly on the circulating Reynolds number.
Nomenclature
Ah ) hydraulic permeability, m2 s kg-1
An ) coefficient of the finite difference equations for nodesneighbor of P (N, S, E, W)
AP ) coefficient of the finite difference equations for nodeP
b ) osmotic coefficient, defined by b ) Π/ωA, Pab1, b2 ) constants characteristic of a given membrane-
solute system (eq 10)DAB ) binary mass diffusion coefficient, m2 s-1
f ′ ) intrinsic rejection coefficient of the membrane, definedby f ′ ) (ωAm - ωAp)/ωAm
f ) apparent rejection coefficient of the membrane, definedby f ) (ωA0 - ωAp)/ωA0
h ) channel half-height, mjA ) solute diffusive flux, kg m-2 s-1
jhA ) average solute diffusive flux over the membranelength, kg m-2 s-1
k ) mass transfer coefficient, m s-1
l ) channel length, mmb ) mass flux at the boundary of a control volume, kg
s-1
p ) pressure, Pap* ) guessed pressure field for SIMPLE, Pap′ ) correction pressure field for SIMPLE, Pa
Figure 9. (a) Experimental and predicted Shx at the hydrody-namic entrance region of the slit (x/h ) 60 and Re ) 1000). (b)Experimental and predicted Shx at the hydrodynamic entranceregion of the slit (x/h ) 30 and Re ) 500). (c) Experimental andpredicted Shx at the hydrodynamic entrance region of the slit (x/h) 15 and Re ) 250).
Figure 10. Comparison of the mass transfer correlation basedon experimental values (Stp ) 1 + 3.68 × 10⁻⁴(x/h)-1.11Re0.95Rep
-1.79)against the corresponding predicted Stp numbers.
Ind. Eng. Chem. Res., Vol. 37, No. 12, 1998 4799

Re ) circulation Reynolds number, defined by Re ) Fu0 ×2h/µ
Rep ) permeation Reynolds number, defined by Rep ) Fνp× 2h/µ
S0 ) mass imbalance in a control volume (eq 13)Shx ) local Sherwood number, defined by Shx ) xk/DABSP, Su ) linearized source term coefficientsStp ) permeation Stanton number, defined by Stp ) k/vjpSφ ) source term in the transport equation of φu ) velocity component in the x-direction, m s-1
u+ ) nondimensional velocity component in the x-direction,defined by u+ ) u/u0
u′ ) correction velocity component in the x-direction forSIMPLE, m s-1
u0 ) inlet uniform velocity in x-direction, m s-1
u* ) guessed velocity component in x-direction for SIMPLE,m s-1
v ) velocity component in the y-direction, m s-1
v′ ) correction velocity component in the y-direction forSIMPLE, m s-1
v* ) guessed velocity component in y-direction for SIMPLE,m s-1
vp ) permeation velocity, m s-1
vjp ) experimental permeation velocity, m/sx ) spatial direction, mxe ) hydrodynamic entrance length, my ) spatial direction, my+ ) nondimensional distance, defined by y+ ) y/h
Greek Symbols
∆P ) operating transmembrane pressure, Pa∆Π ) transmembrane osmotic pressure, Paφ ) generic property (eq 5)Γφ ) diffusivity coefficient of φ, kg m-1 s-1
F ) fluid density, kg m-3
µ ) fluid viscosity, Pa sωA ) solute mass fraction, kgsolute/kgsolutionωA0 ) inlet feed solute mass fraction, kgsolute/kgsolutionωAm ) solute mass fraction in the membrane surface,
kgsolute/kgsolutionωAp ) solute mass fraction in the permeate, kgsolute/kgsolutionωj Am ) average value of ωAm over the membrane length,
kgsolute/kgsolutionωj Ap ) average value of ωAp over the membrane length,
kgsolute/kgsolution
Literature Cited
(1) Abbott, D. E.; Kline S. J. Experimental investigations ofsubsonic turbulent flow over single and double backward-facingsteps. ASME J. Basic Eng. 1962, 84, 317.
(2) Seban, R. A. Heat transfer to the turbulent separated flowsof air downstream of a step in the surface of a plate. ASME J.Heat Transf. 1964, 86, 259.
(3) Goldstein, R. J.; Eriksen, V. L.; Olson, R. M.; Eckert, E. R.C. Laminar separation reattachment and transition of flow overa downstream-facing step. ASME J. Basic Eng. 1970, 91, 732.
(4) Durst, F.; Whitelaw, J. H. Aerodynamic properties ofseparated gas flows: existing measurements techniques and new
optical geometry for the laser-Doppler anemometer. Prog. HeatMass Transf. 1971, 4, 311.
(5) Kumar, A.; Yajnik, K. S. Internal separated flows at largeReynolds number. J. Fluid Mech. 1980, 97, 27.
(6) Armaly, B. F.; Durst, F.; Pereira, J. C. F.; Schonung, B.Experimental and theoretical investigation of backward-facing stepflow. J. Fluid Mech. 1983, 127, 437.
(7) Gosman, A. D.; Ideriah, F. J. K. TEACH-T: A generalcomputer program for two-dimensional, turbulent, recirculatingflows; Mech. Eng. Dep., Imperial College: London, 1976.
(8) Brian, P. L. T. Concentration polarization in reverse osmosisdesalination with variable flux and incomplete salt rejection. Ind.Eng. Chem. Fundam. 1965, 4 (4), 439.
(9) Berman, A. S. Laminar flow in channels with porous walls.J. Appl. Phys. 1953, 24 (9), 1232.
(10) Singh, R.; Laurence, L. Influence of slip velocity at amembrane surface on ultrafiltration performance: I. Channel flowsystem. Int. J. Heat Mass Transf. 1979, 22, 721.
(11) Lebrun, R. E.; Bouchard, C. R.; Rollin, A. L.; Matsuura,T.; Sourirajan, S. Computer simulation of membrane separationprocesses. Chem. Eng. Sci. 1989, 44 (2), 313.
(12) Bouchard, C. R.; Carreau, P. J.; Matsuura, T.; Sourirajan,S. Modeling of ultrafiltration: predictions of concentration polar-ization effects. J. Membr. Sci. 1994, 97, 215.
(13) Bhattacharyya, D.; Back, S. L.; Kermode, R. I. Predictionof concentration polarization and flux behavior in reverse osmosisby numerical analysis. J. Membr. Sci. 1990, 48, 231.
(14) Henriksen, P.; Hassager, O. Simulation of transportphenomena in ultrafiltration. Chem. Eng Sci. 1993, 48 (17), 2983.
(15) Rosen, C.; Tragardh, C. Computer simulation of masstransfer in the concentration boundary layer over ultrafiltrationmembranes. J. Membr. Sci. 1993, 85, 139.
(16) Pellerin, E.; Michelitsch, E.; Darcovich, K.; Lin, S.; Tam,C. M. Turbulent transport in membrane modules by CFD simula-tion in two dimensions. J. Membr. Sci. 1995, 100, 139.
(17) Leonard, B. P. A stable and accurate convective modelingbased in quadratic upstream interpolation. Comput. Methods Appl.Mech. Eng. 1979, 19, 59.
(18) Leschziner, M. A. Practical evaluation of three finitedifference schemes for the computation of steady-state recirculat-ing flows. Comput. Methods Appl. Mech. Eng. 1980, 23, 293.
(19) Spalding, D. B. A novel finite difference formulation fordifferential expressions involving both first and second derivatives.Int. J. Num. Methods Eng. 1972, 4, 557.
(20) Geraldes, V.; Semiao, V.; Pinho, M. N. Mass transfer in aslit with semipermeable nanofiltration/reverse osmosis membranewalls. Submitted for publication, 1998.
(21) Sherwood, T. K.; Brian, P. L. T.; Fisher, R. E.; Dresner, L.Salt concentration at phase boundaries in desalination by reverseosmosis. Ind. Eng. Chem. Fundam. 1965, 4 (2), 113.
(22) Sherwood, T. K.; Brian, P. L. T.; Fisher, R. E. Desalinationby reverse osmosis. Ind. Eng. Chem. Fundam 1967, 6 (1), 2.
(23) Patankar, S. V. Numerical heat transfer and fluid flow;McGraw-Hill Book Co.: New York, 1982.
(24) Sourirajan, S. Reverse Osmosis; Academic Press: NewYork, 1970.
Received for review March 30, 1998Revised manuscript received September 9, 1998
Accepted September 16, 1998
IE980198K
4800 Ind. Eng. Chem. Res., Vol. 37, No. 12, 1998
![[XLS]ncseducation.comncseducation.com/Result-on-Website.xls · Web viewMordijiush J. Sangma SLIT-2247 Akash Boro SLIT-2248 Anisha Das SLIT-2249 Udit Narayan Roy SLIT-2250 Michael](https://img.dokumen.tips/doc/110x75/5ab167d47f8b9a6b468c7b61/xls-viewmordijiush-j-sangma-slit-2247-akash-boro-slit-2248-anisha-das-slit-2249.jpg)