Embed Size (px)
Citation preview

REPORT DOCUMENTATION PAGE O>JD"I «"DO'ti**- ::< '5*" *Or "in tlOO .' "V — )'■ ^
•tifj^l ,.■»<? — pi«*«-« -r - ..a ' ; v-g-jt-M-"•%' -u
■.»C4 .."<"j -^ ,i ÜJZJ - - •' ■
, |*.r.r<|
' D+r *'•«>•>»
.< 1 •• .r: :
AFRL-SR-BL-TR-98-
1. AGENCV USE ONir {Leave blank) 2. REPORT DATE
12/10/97 3. REPORT TYPE AND DATES COVERED
Final Technical, 8/1/93 - 7/31/97 4. TITLE AND SUBTITLE
AASERT: Graduate Student Support for Studies of Plasma Loaded Backward Wave Oscillators
6. AUTHOR(S)
Y. Carmel
7. PERFORMING ORGANIZATION NAME(S) AND AODRESS(ES)
University of Maryland, College Park College Park, MD 20742-3511
9. SPONSORING/MONITORING AGENCY NAME(S) AND ADDRESS(ES)
Air Force Office of Scientific Research/PKC 110 Duncan Avenue, Suite B 115 Boiling AFB, DC 20332-8080 CN^
S. FUNDING NUMBERS
F49620-93-10456
8. PERFORMING ORGANIZATION REPORT NUMBER
N/A
10. SPONSORING/MONITORING AGENCY REPORT NUMBER
11. SUPPLEMENTARY NOTES
12a. DISTRIBUTION/AVAILABILITY STATEMENT
General distribution D18TRI1UTION STATEMENT A
ApproTfi for pobtl* Distribution UnHmttad
12b. DISTRIBUTION CODE
13. ABSTRACT (Maximum 200 words)
This grant partially supported the work of three graduate students at'/he Institute for Plasma Research,. University of Maryland. These students actively participated in and greatly contributed to the research program on studies of plasma loaded backward wave oscillators, funded by AF0SR.
19980115 214 WHC QUALITY INSPECTED 2
14. SUBJECT TERMS
Plasma Backward Wave Oscillators
17. SECURITY CLASSIFICATION OF REPORT
18. SECURITY CLASSIFICATION OF THIS PAGE
19. SECURITY CLASSIFICATION OF ABSTRACT
IS. NUMBER OF PAGES 55
16. PRICE- COOE
20. LIMITATION OF ABSTRACT
MSN 7S-".00i 2SO-S510 Stjpüa'd "-orm 298 !Rev 2-89)

FINAL TECHNICAL REPORT
AASERT: Graduate Student Support for Studies of Plasma Loaded Backward Wave Oscillators
AFOSR Grant Number: F49620-93-10456 "Parent" Award AFOSR Grant Number: F49620-92-J-0152
for the period August 1,1993 to July 31,1997
Research conducted under the auspices of Air Force Office of Scientific Research
Technical Director: Dr. Robert Barker Telephone: (202) 767-5011

Executive summary
This grant partially supported the work of three graduate students at the Institute for
Plasma Research, University of Maryland: James Weaver, David Gershon and Evan Pert.
Those students actively participated and greatly contributed to the research program. Details
of the main technical achievements can be found in the annual report. The work itself was
presented at scientific conferences and published in refereed journals. The following selected
publications are attached as an appendix to this document:
1) "Plasma Influence on the Dispersion properties of Finite-Length, Corrugated Waveguides", A. Shkvarunets, S. Kobayashi J. Weaver, Y. Carmel, J. Rogers, T. Antonsen,, V. L. Granatstein, W.W. Destler, K. Ogura, and K Minami, Physical Review E., 53,3 (1996).
2) "Electromagnetic Properties of Corrugated and Smooth Waveguides Filled with Radially Inhomogeneous Plasma", A. Shkvarunets, S. Kobayashi, J. Weaver, Y. Carmel, J. Rogers, T. Antonsen,, V. L. Granatstein, W.W. Destler, IEEE Trans, plasma science, Special Issue on HPM, 24,3, pp 905-918 (1996).
3) "Comparative study of microwave sintering of Zinc Oxide at 2.45, 30 and 83 GHz", A. Birnboim, D. Gershon, J. Calame, A Birman, Y. Carmel, J. Rodgers B. Levush, Yu. V. Bykov, A.G. Eremeev, V.V. Holoptsev and V.E. Semenov, D. Dadon, L.P. Martin , M. Rosen and R. Hutcheon, accepted for publication in Journal of the American Ceramic Society (1997).
4) "Low Cost Infrared Temperature Measurement and Optimal Process Control in Microwave Sintering Systems", J.P. Calame, Y. Carmel, E. Pert and D. Gershon, 24th IEEE International Conference on Plasma science, San Diego, May 19-22, 1997, (Paper lD01,pl59).

Appendix (copies of selected paners)

PHYSICAL REVIEW E VOLUME 53, NUMBER 3 MARCH 1996
Plasma influence on the dispersion properties of finite-length, corrugated vaveguides
A. Shkvarunets, S. Kobayashi, J. Weaver, Y. Carmel, J. Rodgers, T. M. Antonsen, Jr., V. L. Granatsldn W. W. Destler, K. Ogura,* and K. Minami*
Institute for Plasma Research, University of Maryland, College Park, Maryland 20742 (Received 13 October 1995)
We present an experimental study of the electromagnetic properties of transverse magnetic modes in a corrugated-wall cavity filled with a radially inhomogeneous plasma. The shifts of the resonant frequencies of a finite-length, corrugated cavity were measured as a function of the background plasma density and the dispersion diagram was reconstructed up to a peak plasma density of 1012 cm-3. Good agreemen: with a calculated dispersion diagram is obtained for plasma densities below 5X10" cm'1.
PACS number(s): 5140.MJ, 84.40.Fe, 52.40.Fd, 52.25.Sw
Spatially periodic electrodynainic structures are an essen- tial part of many sources of high power, coherent, electro- magnetic radiation [1]. In particular, cylindrical corrugated waveguides are used in relativistic microwave generators such as the backward wave oscillator where kinetic energy from a linear electron beam is transferred to electromagnetic waves [2-7]. The backward wave oscillator uses a finite- length corrugated cavity and a cylindrically symmetric linear relativistic electron beam. The beam interacts with the first spatial harmonic of the corrugated resonator when the phase velocity of the mode, u/kt, equals the longitudinal velocity of the beam, vz.
Advantages of such oscillators are high power handling capability, frequency stability, as well as relative simplicity of beam formation, injection and propagation through the corrugated resonator. Additional capabilities include modest frequency tunability by changing the beam voltage and con- trol of the output microwave power by changing the beam current. These two also represent limitations if greater flex- ibility is desired. Broadband frequency tuning is impossible and the output power is limited by deterioration in the elec- tron beam quality as the beam current approaches a substan- tial fraction of the vacuum space charge limit. A promising solution to these two limitations of relativistic backward wave oscillators is to fill the beam propagation channel with a tenuous background plasma, thereby considerably chang- ing both the beam propagation conditions and the electro- magnetic properties of the system [8-14].
Beam propagation in a background plasma is affected by the ratio of the plasma electron density, Nt,, to beam electron density, Nb. As this ratio increases, more of the beam self space charge field is neutralized by the background plasma, thereby reducing the space charge effects on the beam qual- ity. Under these conditions a much larger beam current can propagate through the system without big sacrifices in beam quality (low Au,/u, ratio).
Plasma influence on the electromagnetic dispersion prop- erties of waveguides can be described by the parameter lOplw, where w/( and w arc the electron plasma frequency and the frequency of the vacuum waveguide mode, respec-
. lively. The plasma upshifts the electromagnetic branches of
'Permanent address: Niigata University, Niigata City, Japan.
1063-651X/96/53(3)/2045(4)/S10.00 53
vacuum TM modes in waveguides as approximately given by <ti\—<a2
p+at1 where u0 is the upshifted frequency of the plasma filled resonator. If a strong guiding magnetic field (B,) is applied (eBt/ym*>w0,w„), only TM modes will be upshifted. TE modes will remain unaffected because these modes have a zero longitudinal Et component of electric field.
The above two properties of plasma loaded waveguides, namely frequency upshifts and greater current carrying capa- bilities, have been observed in experiments where micro- wave generators were driven by relativistic beams of elec- trons. Plasma filled backward wave oscillators have demonstrated both frequency upshift and efficiency enhance- ment [8,15,16]. In plasma filled relativistic TE,3 gyrotron experiments both the beam current and output power were increased threefold over the corresponding vacuum case [17]. In other studies [18], plasma filled smooth waveguides servea as the interaction region for relativistic plasma micro- wave oscillators, where the propagation of both fast (W*,>e) and slow (w/k,<c) TM„, modes were studied.
There are many papers devoted to the calculation and measurement of the dispersion characteristics and resonant frequencies of empty corrugated cavities; but our paper re- ports experimental measurements of dispersion characteris- tics of plasma-filled, corrugated cavities. In this research we have modified the well known resonant cavity technique [19], in which the changes in the resonant frequencies of a cavity surrounding the plasma are related to the changes in the plasma density. The comparison of plasma influence on these resonances in both smooth and corrugated cavities is the main tool of the present research. In our studies we take into account two important factors: (a) the effects of radial nonuniformities in the plasma density and (b) finite-length effects in corrugated wall cavities, which leads to the forma- tion of discrete axial modes. In a finite-length, plasma loaded structure the axial wave numbers are quantized affecting the spectral characteristics of the system. We were able to mea- sure the full dispersion diagram of a plasma loaded, finite- length, corrugated waveguide up to a peak plasma density of 10" cm'5.
In the present study, plasma creation, propagation and fill- ing of the cavities were accomplished in the same manner as in earlier work [15]. A brief description is given below while in depth information can be found in Ref. [22]. The experi-
R2045 O 1996 The American Physical Society

R2046 A. SHKVARUNETS et al. 53
TUNGSTEN PROBE
REFLECTED MICROWAVE SIGNAL
PLASMA COLUMN
Äywwwv.
»ITTECTION AND DATA ACQUITION SYSTEM
ANTKNNA
PROBE CIRCUITRY AND DATA ACQUISmON SYSTEM
FIG. 1. A schematic diagram or u spatially periodic slow wave structure loaded with a radially inhomogeneous plasma and coupled to a radiating antenna. Also shown are the electromagnetic launcher and a long, movable tungsten probe used to measure the plasma density profile.
merits were performed in a 1.5 m long stainless-steel vacuum vessel inserted in a 1 m long solenoid producing a magnetic field of Bj=11.3 kG (cyclotron frequency=32 GHz). The plasma was generated by a coaxial flashover pulsed gun, coated with titanium hydride [20], pulsed at up to 15 kV, and positioned up to 40 cm away from one end of the solenoid. As a result, a plasma column approximately 1 m long and 2 cm in diameter was created. The plasma density profile, the electron plasma density (Np) and temperature (Tt) are time dependent. All were measured with a long, thin movable tungsten Langmuir probe mounted perpendicular to the plasma column as shown schematically in Fig. 1. Abel's transform was used to convert the probe saturation current (taken at various radial positions) to a radial plasma density profile. The results indicate that the plasma column had roughly a bell-shaped profile with a radius, Rp, (measured at 70% peak density) of 1.2 cm at 400 ^isec and 1.7 cm at 800 /xsec. To illustrate temporal behavior of the plasma in the column, an oscillogram of the electron saturation probe cur- rent is presented in Fig. 2(a). The calibrated temporal depen- dence of the absolute peak plasma density (to be described later) is presented in Fig. 2(b), where the solid line is the plasma density averaged over many shots. A peak electron plasma density of Np= 1.5X 1012 cm"3 is established 200 ju,sec after initiation of the plasma gun, and is a monotoni- cally decreasing function of time.
Two interchangeable plasma filled cavities—both smooth and corrugated—were studied with identical plasma loading. The corrugated cavity, shown schematically in Fig. 1, had a wall radius (Rw) varying sinusoidally according to Rw=Ro+h cos^ltrzld). Here Ä0=1.62 cm is the average radius, ft = 0.4 cm is half the peak to peak amplitude of the wall corrugations, and d= 1.66 cm is the longitudinal period of the wall corrugation. The corrugated cavity length was L - 14.1 cm, which correspond to 8.5 periods. This extra half period allows coupling of the corrugated cavity to an exter- nal radiating antenna, as shown in Fig. 1. The smooth cavity used in the experiment was carefully designed to have simi- lar resonant frequencies and mode structure as the corrugated cavity. Its radius was /?,,= 1.62 cm and its length L= 15.1 cm. The resonant frequencies in vacuum for the smooth cav- ity were in the range from 6.9 to 9.936 GHz and the fre- quency range for the corrugated cavity were from 7.4 to 8.8 GHz. The plasma column penetrated both cavities through a
(a)
__ 20
- 10 ■ Tt "~* " *
lb)
tc)
(d)
500 TIME 'tiMcl
1000
FIG. 2. The temporal evolution of (a) electron saturation current of the tungsten probe, (b) the temporal behavior of the peak plasma density—the solid line is the plasma density averaged over many shots, (c) the seven axial resonances associated with a plasma loaded, smooth-wall cavity for excitation frequency of 10 GHz, (d) the eight resonances associated with a plasma loaded, corrugated wall cavity (excitation frcqucncv=K.°5 GHz).
diaphragm collimutor with a diameter of 2 cm, which is smaller than the diameter of both the smooth and the corru- gated cavities. In this way the same degree of plasma-filling was achieved in both cavities.
In this study an approach was used to study the electro- dynamic properties of the cavities that took advantage of the time varying nature of pulsed plasma loading: If a fixed fre- quency higher than a resonant frequency of the evacuated cavity is externally applied, a dramatic change in the re- flected signal occurs when the plasma density has (he proper value to shift the resonance frequency up to the applied fre- quency. The experimental setup for measuring the reflection, shown schematically in Fiy. 1, yielded the oscillograms shown in Fig. 2(c) (for smooth wall cavity) and Fig. 2(d) (for corrugated wall cavity). The large initial signal is associated with an electromagnetic wave propagating below the plasma frequency [15,18,21] and should not be confused with the cavity modes.
The research was performed in two steps. The first step was to study the shifts of the resonances of a smooth cavity due to the background plasma in order to get an independent, absolute calibration for the plasma density measured by the Langmuir probe. In the second step the shifts of the discrete resonant frequencies of the corrugated cavity were measured as a function of the background plasma density and the dis- persion curve was reconstructed up to a peak plasma density of 10l2cm-3.
The goal of the first step was to independently character- ize the plasma column. A specifically developed code [22] was used to calculate the dispersion curve of TMm mode in a circular, smooth infinite waveguide of radius Ä0= 1.617

53 PLASMA INFLUENCE ON THE DISPERSION PROPERTIES OF R2047
10 i
M
M Jy/Ur i i
%
(a)
7 8 9 10 11 12 13 FREQUENCY (GHz)
12
■T 9 I
-o 6
•
n ■ 1 /•J c SB
•M^—— /*- 6
(b)
7.5 8.0 8.5 9.0 9.5
FREQUENCY (CHz)
- FIG. 3. (a) The calculated frequency upshifts of the eigenmodes of a smooth-wall cavity as a function of the background plasma density (the measured radial profile of the plasma density was taken into account), (b) The measured frequency upshifts of two of the eigenmodes, n= 1,6, of a plasma loaded corrugated wall cavity.
cm, filled with radially inhomogeneous plasma of radius Rp=l.Q8 cm. The basis for the code was a numerical solu- tion of Maxwell equations under the restrictions of azimuthal symmetry and an arbitrary plasma profile. In this work, an infinite guiding magnetic field was assumed and the plasma collimator effect (a "truncated" profile) was taken into ac- count. The actual measured plasma profile was used, except that the plasma density was considered zero for r>Rp. The dispersion curve generated in this way was used to calculate the frequency shift of the TM0|„ axial modes of a plasma filled smooth walled cavity, and the results are shown in Fig. 3(a). The solid lines correspond to resonances with axial mode number n = 1,2, ... ,8 from left to right. It shows that the plasma shifts the resonance frequencies of the individual axial modes. An increase in plasma density corresponds to an upward movement along the vertical axis. As an example, one can see that when the plasma density is in the range 0<Afp<9xlO" cm-3, the resonance condition can be sat- isfied for seven discrete TMm„ modes when the resonator is excited at a fixed frequency of 10 GHz (vertical dashed line). At this excitation frequency the resonance condition for mode number n = 7 is satisfied for plasma density of Np=lX\0™ cm"3, mode n = 6 31/^ = 4X10" cm"3 and so on up to /i=l at Np = 8.65X10" cm"3.
In the experiment, many shots were taken to cover the frequency range from 7 up to 12 GHz (the cutoff of the TMU2 in the corrugated cavity is about 14 GHz while in a smooth-wall cavity it is 16 GHz). Mode numbers can be assigned to the experimentally observed resonances by care- ful comparison of these shots and the important restriction that a mode frequency can only be upshifted by the plasma. The higher the plasma density, the higher upshift. Once the
time dependent resonance for a specific injection frequency was known, the plasma density at that moment is given by the code calculation. As an example, for an applied fre- quency of 10 GHz, as in Fig. 2(c), the resonance condition for the TM0|7 is satisfied at f = 900 /tsec and a plasma den- sity of Np=7X 1010 cm "3 is taken from Fig. 3(a); next is the TM016atf=473/isecandtf;,=4X10" cm"3 and so on up to mode TM0u at f=305 pscc and #,, = 8.65X10" cm"3. This calibration, for many shots, shown in Fig. 2(b), was then used in the next phase of our study.
In the second step of our research the complete dispersion curve of a plasma loaded, spatially periodic, corrugated cav- ity was measured. The above experimental procedure was repeated, this time with a plasma-filled corrugated cavity, except that the plasma density is now known from the mea- surements described above. From the reflected power oscil- logram shown in Fig. 2(d) (the excitation frequency is 8.9S GHz) one can see that resonant conditions for TMoi» modes are satisfied for n ** 8 at / = 736 ^tsec, n = 7 at I = 573 ^.sec and so on up to n= 1 at f=323 /xsec. A series of pulsed measurements performed with different excitation frequen- cies were used to plot the plasma density versus the applied frequency for the discrete TM0i„ resonances of the corru- gated cavity. The final step is to assign wave numbers to the modes in order to finish constructing the dispersion diagram. The order in which the individual modes appear in the oscil- logram as the applied frequency is changed clearly indicates the appropriate mode number, n = 1 to 8. The problem of assigning resonant wave numbers, kz, to this index was solved by using the same approach (and experimental data) presented earlier for empty cavities [23], where the reso- nances of evacuated closed and open (i.e., coupled to a radi- ating antenna) corrugated cavities were measured. Very good agreement between measurements and calculated resonant frequencies suggests that for an open corrugated cavity, the wave number ktn is given by kz„ = (n- l/2)rr/L0 rather than kz„ = nTr/L0 as in the smooth close cavity case (L0 = total cavity length). Experimental data for n= 1 and n = 6 are pre- sented in Fig. 3(b). Solid lines represent the result of aver- aging through experimental points. The lines make it pos- sible to determine the measured dependence of resonant frequency of given resonant wave number, kin, on the plasma density. For example, if Np = 5'Xl0li cm"3, the n = \ and n = 6 curves in Fig. 3(b) determine that the corre- sponding resonance frequencies are 8.47 and 9.17 GHz, re- spectively.
The full result of this procedure, shown in Fig. 4, is the dispersion diagram of the plasma-filled corrugated cavity. The points connected with the solid line are experimental. The lowest curve is for Np = 0, the next one up is for Np=l0u cm-3 and so on for 2, 5, and 8X10" cm"3. The independently calculated [24] dispersion curves for an infi- nitely long, corrugated waveguide loaded'with the same plasma densities is superimposed in the figure. The geometry used for these calculations was close to the experimental parameters (Rp = 0.75 cm, /?0= 1.499 cm, /i = 0.406 cm, d= 1.67 cm). One can see that calculated frequency upshift of the dispersion curve of the TMo, mode due to the pres- ence of the plasma is very close to the measured data (Aui/o><2%) as long as the plasma density is below 5X10" cm"3. Above this value the measured upshift is

R2048 A. SHKVARUNETS et al. 53
10.0 THEORY
EXPERIMENT
• VACUUM
DN,»lxlOIIcm"1
■ 2x10" A 5x10" A 8x10"
4.0
WAVE NUMBER (cm"
FIG. 4. The measured (points) and calculated (dashed lines) dispersion curve of a plasma loaded slow wave cavity for various background plasma densities.
somewhat less than anticipated by theory. Also, the plasma causes flattening of the dispersion diagram, especially above a plasma density of 5 X 101' cm ~\ but the measured flatten- ing is less than predicted by the calculation. The allowed
passband (the difference between the upper cutoff and the lower cutoff) for the TM„, mode in vacuum is about 1.25 GHz. When the plasma density is 8x 10", this difference is reduced to less than 0.6 GHz.
In conclusion, we were able to measure the complete dis- persion curve of TM01(I modes of a plasma loaded, finite- length corrugated cavity. The measurement is in good agree- ment with calculations below peak plasma densities of 5X10" cm"-1. Frequency shifts as high as 1.3 GHz were measured for the TMm mode. It is expected that plasma effects presented in this work will enable electronic fre- quency tunability over a wide range (>2()%) in backward wave oscillators [15] and free electron lasers [25]. Experi- mental and theoretical work using plasma columns in coupled cavity traveling wave tubes (CCTWTs) demon- strated the possibility of achieving a very large instantaneous bandwidth (>40%) as well as high efficiency (>35%) and high power [26].
The authors gratefully acknowledge the support of AFOSR. We thank B. Levnsh, G. Nusinovich, D. Goebel, and S. Miller for helpful discussions and J. Pyle and D. Co- hen for technical assistance. Thanks also lo ARL Adclphi personnel lor their help and the use of their facilities.
[1] For example. Applications of High-Power Microwaves, edited by A. V. Gaponov-Grekhov and V. L Granatstein (Artech House, Boston. 1994), Chap. 2.
[2] N. F. Kovalev ct al., JETP Lett. 18, 138 (1973). [3] Y. Carmel et al., Phys. Rev. Lett. 33, 1278 (1974).
- [4] J. A. Swegle et al., Phys. Fluids 28, 2882 (1985). [5] B. Levush et al., Phys. Fluids B 4, 2293 (1992). [6] J. Nation, Appl. Phys. Lett. 17, 491 (1970). [7] S. D. Korovin et al. (unpublished). Also E. Schamiloglu et al.
(unpublished). [8] R. W. Schumacher et al., in IEEE 18th International Confer-
ence on Plasma Science (IEEE, Piscataway, NJ, 1991), p. 135. [9] W. R. Lou ct al., Phys. Rev. Lett. 67, 18 (1991); 67 2481
(1991). [10] Y. Carmel et al., Phys. Rev. Lett. 62, 2389 (1989). [II] A. T. Lin and L Chen, Phys. Rev. Lett. 63, 2808 (1989). [12] G. Benford and X. Zhai, Phys. Lett. 186, 330 (1994). [13] M. V. Kuzelcv ct al., Fiz. Plazmy 13, 1370 (1987) [Sov. J.
Plasma Physics 13, 793 (1987)].
[14] M. Button and A. Ron, Phys. Rev. Lett. 66, 2468 (1991). [15] Y. Carmel et al., Phys. Fluids B 4, 2286 (1992). [16] Yu. P. Bliokh et al., Fiz. Plasmy 20, 767 (1994) [Plasma Phys.
Rep 20, 690 (1994)]; also see V. S. Ivanov et al., Sov. Phys Tech. Phys. 26, 5 (1981).
[17] V. I. Krementsov et al., JETP 75, 2151 (1978). [18] I. A. Sclivnnov et al.. Plasma.Phys. 15, 1283 (1989). [19] For example, P. J. Paris vt til., J. Appl. Phys. 67, 124 (1990)
and references therein. [20] A. Ben-Amar Baranga a al.. Rev. Sei. Instrum. 56, 1472
(1985).
[21] A. W. Trivelpicce and R. W. Could, J. Appl. Phys. 30, 1784 (1959).
[22] A. G. Shkvarunets el al., IEEE Trans. Plasma Science (to be published).
[23] W. Main et al., IEEE Trans. Plasma Sei. 22, 566 (1994). [24] K. Ogura ct al., i. Phys. Soc. Jpn. 61, 4022 (1992). [25] M. R. Ried et al.. Int. J. Electron. 65, 533 (1988). [26] V. I. Perevodchikov et al. (unpublished).

IEEE TRANSACTIONS ON PLASMA SCIENCE. VOL. 24. NO. 3. JUNE 1996 905
Electromagnetic Properties of Corrugated and Smooth Waveguides Filled with
Radially Inhomogeneous Plasma Anatoly G. Shkvarunets, Satoru Kobayashi, James Weaver, Yuval Carmel, Senior Member, IEEE,
John Rodgers, Thomas M. Antonsen. Jr., Member, IEEE, Victor L. Granatstein, Fellow, IEEE, and William W. Destler, Fellow, IEEE
Abstract—Creation and diagnosis of plasma in microwave de- vices remains one of the primary challenges of plasma microwave electronics. In the present work we deal with 1) diagnostic techniques for characterization of radially nonuniform plasma columns suitable for use in high-power microwave sources and 2) the effects of such plasmas on the electromagnetic properties of finite length, spatially periodic slow wave structures. Exper- imental studies were performed both for a strong and a weak guiding magnetic field. Using a combination of a microwave resonator (A"-band) and a Langmuir probe, both the plasma peak density and its transverse profile were measured in situ (prior to beam propagation). The frequency upshifts of the TMoin modes in an open corrugated cavity were measured as a function of the background plasma density. The dispersion diagrams were reconstructed, for the first time, up to a peak plasma density of 1012 cm-3. Frequency upshifts and "flattening" of the dispersion curves were observed for both strong and weak guiding magnetic fields. For plasma density above 5 x 10" cm-J the frequency upshifts are less than anticipated by theory.
I. INTRODUCTION
THE FIELD of plasma microwave electronics concerns the excitation of microwaves by the injection of an electron
beam into plasma [1], [2]. In many cases, plasma is introduced into an established vacuum microwave source to enhance its performance. Under these conditions, two improvements can be realized: operation at higher injected beam currents and control of the RF interaction region via the injected plasma [3]-[9]. The increase in beam current can lead to higher output powers while the latter can result in higher interaction efficiency and frequency tuning through control of plasma density in the device [8], [10], [11]. These effects have been observed in a number of devices including a plasma-filled relativistic TEn gyrotron [12], a plasma-filled smooth waveguide amplifier [8], and a relativistic plasma-filled backward wave oscillator (BWO) [4], [10]. In the gyrotron experiments, both the beam current and output power were increased threefold over the vacuum case. In the plasma-filled smooth waveguide, beam injection enabled the generation of slow, {u)/k2)<c, waves [13], [14]. Here, u,kz. and c are
Manuscript received September 22. 1995: revised February 16. 1996. This work was supported by the U.S. Air Force Office for Scientific Research.
The authors are associated with the Electrical Engineering Department and the Institute for Plasma Research at the University of Maryland. College Park. MD 20742-3511 USA (email: [email protected]).
Publisher Item Identifier S 0093-3813(96)05190-9.
the angular frequency, axial wavenumber, and speed of light, respectively.
For our studies in plasma microwave electronics we used a relativistic BWO because it is well understood, has relatively good efficiency without plasma [15]-[21], and is relatively easy to fill with plasma. Experimental work demonstrated a significant increase in operating efficiency and a tunable upshift due to the introduction of background plasma. Creation and diagnosis of plasma in microwave devices remains one of the primary challenges of plasma microwave electronics. The simplicity and high degree of ionization created by externally mounted flashover guns [26] led to their use in plasma- filled microwave BWO's [10]. Since the plasma influences the electromagnetic properties of the RF interaction region, its spatial and temporal characteristics should be known. It is the purpose of this work to develop in situ diagnostics to measure those properties, i.e., the axial and radial profile of the plasma density and its temporal characteristics (prior to elecuon beam injection). The second goal of this work is to study the electromagnetic properties of a finite length, corrugated cavity filled with radially inhomogeneous plasma. Understanding these properties will aid in developing tunable efficient plasma microwave oscillators and amplifiers.
Langmuir probes were a natural choice for measuring the spatial and temporal profiles of the plasma density, but the determination of an absolute magnitude for the density from probe data remains fundamentally incomplete due to a low accuracy of plasma density measurement. The reason is that often in magnetized plasmas particle diffusion across magnetic field is too low to prevent distortion of the plasma layer from which the probe current is being collected [23]. While the problem of distortion can sometimes be associated with an imprecise definition of the probe collection area, the flashover gun introduced further problems in that it emits ultraviolet light that created a burst of electron emission from the vessel walls and the probe itself. As a result, it was impossible to ac- curately measure the Volt-Ampere (V-I) probe characteristics. One more problem in measuring the absolute plasma density using a probe technique is the influence of particle energy distribution function on the probe current. The measurement of the energy distribution function of electrons is especially difficult in decaying plasmas and in the presence of ultraviolet radiation.
0093-3813/96SO5.O0 © 1996 IEEE

SHKVARUNETS el al.: ELECTROMAGNETIC PROPERTIES 907
Solenoid
Plasma Column
Vacuum Vessel
Movable Probe
Fig. 2. Cross-sectional view of the moveable probe for measuring the transverse profile of the plasma density.
B. Diagnosis of Pulsed Plasma with a Langmuir Probe
The probe was first operated with a dc bias that was varied between shots. These experiments established two re- producible saturation levels with negative probe current (elec- trons) for positive biases greater than 40 V and positive probe current for negative biases less than 0 V. Attempts to plot the V-I characteristics for different moments failed because of relatively large scatter in the data. To overcome this problem, a low-impedance pulsed bias (5 ßs) was applied to the probe at various times during the plasma lifetime. As a result, the electron branch of the V-I characteristic curve for different times was successfully recorded. These data are for B = 9 kG, for which the electron Larmour radius p = 2.5 x 10⁻³
mm (at UT = 1 eV) is much less than the probe diameter (0.13 mm). Under these conditions the plasma may be considered highly magnetized. If the plasma electrons are thermalized, a simple one-dimensional probe theory may be used to calculate the V-I characteristic of the electron probe current
I{U)=I,exp{-U/UT)
I, = 2.7x 10~12[4/2 / ne ds.
0)
(2)
In these equations / is the probe current, U is the retarding probe potential (for electrons) relative to the plasma potential, Is is the saturation current, UT the electron temperature, Sp is the probe collecting area, and ne is the electron den- sity. Examples of the measured V-I curves for two specific moments (100 ßs and 600 ßs delay with respect to the plasma gun firing) are shown in Fig. 3. In the experiment, two families of V-I characteristics were observed; knee-less [Fig. 3(a)] and knee-like (Fig. 3(b)]. The first was observed for t < 500 /xs, the second for t > 500 /is. The curve slope gave us the temperature in these two cases. 1.9 eV for Fig. 3(a) and 0.9 eV for Fig. 3(b). The problem was to determine the saturation current for the knee-less family of curves (t < 500 ps) shown in Fig. 3(a). Any current above the straight section may be considered as the saturation current, making an accurate determination of the plasma density difficult. Specifically, the plasma density from Fig. 3(a) is in the range of 1.3 - 2.7 x 1012 cm-3. In contrast, this range is much smaller in Fig. 3(b) (1.4 - 1.5 x 10u cm-3), for which the plasma density measured by the electromagnetic technique was 1.35 x 10u cm-3. We concluded, therefore, that a fast (5 ßs)
0.0
-l.o:
■5 -2.0:
-3.0
1 1
■ 1 ..••■■"'
- 1 / 1 /
■ 1
1
1 1 1
..' 1 I / 1 —^_,
1 1 ! 1 ! 1 1 1 1
1 1 1
lqOjisec 1 1 . ! 1 1 1 1 1
0 5 10 15
PROBE BIAS (V) (a)
20
0.0
3 -1.0
- -2.0
-3.0
I 1 I 1
1 1
1 /I—*■"• 1 ' 1
i £ i 1 1 1 ]
— — — 1 T
i \ i - 'j \
1 1 1 1 1 1
': If "j 1 1 1 600 ji sec
-,!,!, I , 1 ,
-2 0 8 10
PROBE BIAS (V) (b)
Fig. 3. Examples of typical electron branches of the V-I curves of the Langmuir probe characteristic (semilog scale). The experimental conditions: B = 9 kG, t/gun = 11 KV, rgun = 40 cm. The pulsed bias (T ~ 5 ps) was applied at delay times of (a) 100 /is and (b) 600 /xs.
pulsed Langmuir probe can be used to measure both the plasma temperature and density in the case of "classic" knee-type V-I curves. Nonideal probe characteristics are the reason for using the electromagnetic technique for independently measuring the absolute plasma density. The probe data were therefore used to measure the plasma density profile, assuming that the electron energy distribution is not dependent on radius.
The electron saturation current in the dc bias mode was used to measure the plasma density profile. The axisymmetry assumption simplifies plasma profile calculations from the probe's signal. Namely, precise specification of the chord could be abandoned and only the perpendicular distance from the probe to the central axis recorded. With this distance specified, the radial density distribution could be calculated through application of the Abel transform, thereby producing local density values from a signal that represented a set of line-integrated densities. In the experiments, the radial profile proved to have a roughly Gaussian shape. A Gaussian is invariant under the Abel inversion. Consequentially, the chord probe measurement can be treated as a plasma radial distribution function. An example of a radial profile is shown in Fig. 4. As a result of this activity we have developed the necessary tools to allow us to make relative measurements of

SHKVARUNETS it al;. ELECTROMAGNETIC PROPERTIES 909
a reduction in the reflected signal measured by the detector and established the time at which the shifted frequencies of resonances equaled the applied frequency. Thus, the amount of shifted frequency was a controlled variable and the time for occurrence of a shifted mode was the observed variable.
Figs. 5 and 6 describe our diagnostic approach by way of a specific example. First, the relative, transverse plasma profile was measured (a typical profile is shown in Fig. 4). Next, the electron saturation current temporal dependence was measured for a fixed probe position (going through the center of the plasma column) and the result is shown in Fig. 5(a). Fig. 5(b) shows the reflected microwave signal from the smooth cavity when loaded by the same plasma column and excited by a fixed frequency (/ = 10 GHz). These two figures give us two pieces of information: 1) the time at which each resonance condition is satisfied and 2) the probe saturation current at the same time. The last item needed to measure the absolute plasma density is given in Fig. 6, which shows the calculated resonance frequency of each of the individual axial modes (TMoin, n = 1 to 8) as a function of the peak background plasma density. The actual measured plasma profile was used to calculate those shifted frequencies. In the calculations, the profile presented in Fig. 9(b) was used, except that plasma collimation was taken into account. The plasma density was considered to be zero for r>Rp [dashed line in Fig. 9(b)]. The plasma influence and resulting time behavior is illustrated graphically in Fig. 6. In this figure the vertical line corresponds to the fixed frequency applied to the cavity (10 GHz in this example). The plasma density in the cavity decays monotonically in time, which corresponds to a downward motion along this vertical line. Since the plasma density decays monotonically in time, each subsequent resonance can then be assigned its proper mode number in sequence. The first spike in reflected signal shown in Fig. 5(b) corresponds to the intersection of the vertical line (Fig. 6) with the n = 1 axial mode, the second with the n = 2 mode, and so on until the last spike corresponds to the n = 7 mode. The mode number must be correctly assigned through careful choice of the excitation frequencies and comparison of separate shots.
For times less than 200 ßs from plasma gun firing [Fig. 5(b)], the plasma density is large enough to enable excitation of plasma guide modes [29]. These waves can be excited if the peak plasma frequency (fp) is higher than the externally applied frequency (/). These waves are mostly trapped inside the plasma column (see Fig. 15, case 3). Under these conditions longitudinal resonances are not expected. Therefore, for fp > /, nonresonant RF losses are due to excitation of these modes as seen in Fig. 5(b). This issue was also studied in [36].
This procedure benefits us in two ways. First, we can calculate the absolute plasma density as a function of time; the result is shown in Fig. 7(a). In this case the Bz = 9 kG, the gun was mounted at zgun = 24 cm and was pulsed at Ugun = 14 kV. The solid points represent the measured values, and the solid curve is an average curve through the points. The gun does have a small degree of shot-to-shot variation. The rapid plasma decay means that this variation produces the scatter seen in the plots. Second, this procedure also enables us to get
H 2 w cc cc D u UJ CO
O es c
> B
< 2 U So K: O
U w H tu Q
Bz = 9 kG
(a)
Bz = 9 kG f = 10GHz
-40
I , \ R ! ;
t ■ f- L AM1/_ _ . L wV\Vr/ 6 7
: 1 ^JMAJ v^_y 500
TIME bisec)
(b)
1000
Fig 5. (al Temporal dependence of the electron saturation probe current for an axially positioned probe (R = 0). (b) Temporal dependence of the reflected microwave signal (oscillogram). The experimental conditions: B = 9 kG.
= 14 KV. and = 24 cm.
7 8 9 10 11 12 13
FREQUENCY (GHz)
Fig. 6. The plasma influence on the longitudinal resonances of TM01n
modes of a plasma-filled smooth cavity, as calculated by the code (see the Appendix): Ru. = 1.6 cm, L = 15.1 cm. k„ = irin/L).n = 1.2.•••.8. The transverse profile of the plasma was taken from Fig. 9(b). except that a plasma outer boundary was assumed at r = 1.08 cm. due to collimation by the collimator. B: = oo was assumed.
the probe calibration curve, namely the relation between the probe current and the plasma density. Recall that previously the proportionality constant between the pfobe current and the plasma density was not known exactly.
III. RESULTS FROM PLASMA DESNITY MEASUREMENTS
A survey of the plasma dependence on system parameters showed that the plasma gun voltage was not seen to have a significant effect on the peak plasma density or on its radial

SHKVARUNETS el at.: ELECTROMAGNETIC PROPERTIES 911
l.U i!
\ '; Bz!=2kG >-
0.5
\. i: **\ l!
C/3 Z Q
.T i j
•
3 i i t i 1! ••• 1 1 1 1 1 1 1 1
(a)
(b)
RADIUS (cm) Fig. 9. The transverse profile of the plasma column outside the cavities. Experimental points are shown as black circles and the result of averaging is shown as a solid line. The vertical dashed line is the boundary of the plasma profile after the plasma collimator (profile inside the cavity), (a) B: = 2 kG, J."gu„ = 11 kV, ;gun = 40 cm. (b) B: = 9 kG, tgu„ = 14 kV, igun = 24 cm. The profiles were used in the calculations to reconstruct the dispersion diagram of the corrugated cavity.
filling of the waveguide, while the dashed lines correspond to the vacuum case. The passbands are upshifted as the plasma density increases. Microwave generation [14]—[21] is represented in Fig. 10(b) as the intersection of the beam line, the slope of which corresponds to the electron velocity, with the dispersion curve representing the possible modes of the structure. A new set of modes appear below the lowest passband. These modes were named periodic Trivel- piece-Gould (PTG) modes [4]. They represent an extension of the well-known Trivelpiece-Gould [29] modes of a smooth waveguide to the corrugated case. As can be seen from the diagram, the beam line also intersects the dispersion curve for these new modes. The frequency band of these modes is 0</</p. Alternatively, these modes can be excited if / < fp. In this study we emphasize examination of the plasma- induced changes in the electromagnetic properties of the TMoi passband (/>/p), even though the PTG modes were also observed.
A sketch of the experimental configuration is shown in Fig. 11. The same antenna, circulator, oscillator, detector, and probe were used for this experiment as in the smooth cavity experiments described in Section n. The 8.5-period corrugated structure is a replica of the one used in the high power hot test experiments [10]. One end (left in Fig. 11) is a waveguide section below cutoff and the other end is a linear uptaper attached to the peak of the last half period. For these experiments a metallic end plug is used to seal the input
h T^-CONDUCTOR
1 " Vf^^fV^- ELECTRON ^ I .'.'.'.'.' .^ BEAM
Kb ......
-I—T-1-PLASMA--. X Bz = ~ «»»it»
ZQS^n/ko
(a)
25 Np = 0 Np = l.OxlO11 cm-3
WAVENUMBER kz (cm-1) (b)
Fig. 10. (a) Schematic diagram of a corrugated-wall waveguide uniformly filled with plasma, (b) The dispersive characteristics: the upper curves are the familiar TMon family of modes modified by the plasma. The lower curves are the branches of the low frequency (/ < Fp — 2.84 GHz) FTGoi mode [4].
INCIDENT MICROWAVE SIGNAL
CORRUGATED OPEN CAVITY
REFLECTED MICROWAVE SIGNAL
DETECTOR LAUNCHER
Fig. 11. Schematic diagram of a plasma-loaded open corrugated cavity experiment. The cavity is excited by a microwave-signal, and the reflections are measured by a crystal detector.
waveguide and provide support for the antenna used to launch waves in the structure.
In a finite length structure, the continuous dispersion curve of TM01 mode of an infinitely long structure, shown in Fig. 10(b), is reduced to a number of discrete points in

SHKVARUNETS el al:. ELECTROMAGNETIC PROPERTIES 913
10 LBz = 9 kG EXPERIMENT
Np = 8x lo" cm"3
5 2
1
0
THEORY
(a)
WAVENUMBER (cm" )
(b)
Fig. 13. Reconstructed dispersion diagrams of plasma-filled, corrugated cav- itv. The svmbols thai are connected by solid lines represent experimental data and those connected by dashed lines represent the theory [35] for a rectangular plasma column of radius 0.75 cm and B-. = oc. (a) D= = 9 kG. rsiin = 14 kV. ;gun = 24 cm. The peak plasma density, from the bottom up. Sv = 0.1.2.5, and S x 10" cm-3, (b) B: = 2 kG. f.'gUn = 11 kV, CgU„ = 40 cm. The peak plasma density, from the bottom up, Sp = 0.1,2.5, and 8 x 10" cm-3.
in the calculation {Rp = .75 cm,i?o = 1.499 cm, h = 0.406 cm.z0 = 1-67 cm). One can see that measured frequencies of the dispersion curve of the TMni mode in the presence of the plasma are very close to the calculated ones (SUJ/LJ < 1%) for the plasma density that is below 5 x 1011 cm-3. Above this value the measured upshift is less than anticipated by theory. This difference is probably due to the fact that the rectangular plasma profile used in the calculation [35] is somewhat different from the actual transverse profile, even though both have the same average radius. Also, the plasma causes flattening of the dispersion diagram, especially above a plasma density of 5 x 1011 cm-3. The allowed passband (the difference between the upper cutoff and the lower cutoff) for the TM0i mode in vacuum is about 1.25 GHz. When the plasma density is 8x 10¹¹, this difference is reduced to less than 0.5 GHz.
The result of the analysis procedure for Bz = 2 kG is shown in Fig. 13(b), where experimental points are connected with solid lines. The dashed line is the calculated dispersion curve for an empty corrugated waveguide. The plasma densities are .Vp = 0.1.2,5. and 8 x 10" cm-3 from the bottom up. One can see that in the case of a weak magnetic field, the plasma influences the dispersion curve in much the same way as in the case of a strong magnetic field. No calculations of the B. = 0 case are available for comparison. However, the results can be compared with those of a strong magnetic field.
V. SUMMARY AND DISCUSSION
The primary challenges of plasma microwave electronics, namely the creation and diagnosis of plasmas inside high power microwave devices, can be successfully solved as demonstrated in this paper. In the present work we deal with 1) diagnostics techniques for characterization of radially nonuniform plasma columns suitable for use in high power microwave sources and 2) the effects of such plasmas on the electromagnetic properties of finite length spatially periodic slow wave structures [37] operating in X-band (8-12 GHz).
A single Langmuir probe technique cannot be used alone for precise characterization of magnetized plasma columns, especially for measurements of the electron plasma density. However, using a combination of a novel cylindrical resonant cavity technique supported by accurate numerical calculations of the plasma influence on cavity resonances and a long thin plasma probe we were able to characterize pulsed plasma columns. The peak density (higher than 1012 cm-3) and spatial distribution (transverse and axial) of the plasma was measured as a function of the applied magnetic field (2 to 10 kG) and the plasma gun operating conditions.
By applying a combined probe-microwave technique to plasma-filled open corrugated cavities we were able to mea- sure the complete dispersion curve of TMoin modes of a plasma-loaded finite-length corrugated cavity. The measure- ment demonstrated the frequency upshifts and "flattening" of the dispersion curves of plasma-loaded corrugated cavities immersed in a strong guiding magnetic field, in agreement with theoretical predictions [31], [32]. It should be emphasized that these measurements describe the plasma condition and the electromagnetic properties of a plasma loaded BWO prior to electron beam injection. Other researchers [3] showed that electron beam propagation and confinement can be maintained in an unmagnetized plasma-filled BWO.
For the case of small magnetic fields, a very similar behavior was measured. Theoretical calculations for this case, however, are not readily available. Frequency shifts as high as 1.5 GHz above the vacuum frequency of 7.5 GHz (for n = 1) were measured. The allowed passband (the difference between the upper cutoff and the lower cutoff) for the TMni mode in vacuum is about 1.25 GHz. When the plasma density is 8 x 1011 cm-3, the allowed passband is reduced to less than 0.5 GHz.
Comparing the cases of high and low magnetic field demon- strated that the guiding magnetic field does not drastically affect the electromagnetic properties of both smooth-walled and corrugated plasma-loaded cavities, as long as the plasma frequency is below the signal frequency.
Both magnetized and nonmagnetized plasmas can be suc- cessfully used to fill corrugated cavities to control the electro- magnetic properties and make these structures more flexible interaction regions in beam driven microwave tubes [3], [10]. Such improvements can lead to electronic frequency tunability over a wide range (>20%) in backward wave oscillators and to a significant increase in operating efficiency [10].
A plasma-loaded coupled-cavity microwave amplifier re- cently demonstrated [33] a large instantaneous bandwidth

SHKVARUNETS et al.: ELECTROMAGNETIC PROPERTIES 915
(a)
DIELECTRIC CONSTANT
Q UJ N J <
si O z
DIELECTRIC CONSTANT
10 CO
z <
J on Z o u
o y
B W J a Q
W >
<
UJ
10
0.6 1.2 RADIUS (cm)
1.8
Fig. 14. The transverse profiles of ihe normalized plasma density (solid line) and the dielectric constant (dashed line) for: (a) a plasma-filled cylindrical waveguide; (b) a cylindrical waveguide filled with a solid dielectric and a plasma column. These profiles were used in the calculations, results of which are presented in Figs. 15 and 16.
part of the waveguide, where the beam must propagate. As can be seen in Fig. 16 (case 1), Ez decreases significantly in the center of the waveguide because of the so-called "surface" solution for the fields. Plasma filling can improve the situation by increasing the fields in the center, as demonstrated in Fig. 16 (case 2). Moreover, by changing the plasma density, the coupling coefficient can be controlled for optimizing the system to the beam current.
The dielectric lining has very little effect on the plasma waves (compare Fig. 15, case 3 and Fig. 16, case 3). As a result, if a beam-plasma guided-waves interaction takes place in a simple plasma-filled waveguide, this interaction is expected to be only weakly dependent on the nature of the surrounding slow wave structure.
The code convergence was tested by changing the number of steps, s. The solution was found to be stable for 50 < s < 4000. The highest sensitivity to the number of steps was found at the highest plasma density, Np = 2 x 1012 cm-3 and a sharp plasma boundary (the case treated in the paper as a plasma-loaded smooth cavity and infinitely large magnetic field). It was found that the solution converges at s = 3000 and oscillates around a mean value with accuracy of ~10-5. Decreasing the number of cells (s), led to a decreased accuracy. For s = 400, it was ~10~4, and s = 100 gave
RADIUS WAVENUMBER (cm" )
Fig. 15. Right: The dispersion curve for a cylindrical waveguide of .radius R = l.S cm. loaded with a plasma column of radius Rp = 1.2 cm. B-_ = x. Case 1: TMoi mode in an empty waveguide. Case 2: TMoi mode in a plasma-loaded waveguide. A"p = 7 x 10" (Trivelpiece-Gould) mode, Np = 7 x 10' profiles of the longitudinal electric field. E:. The curves labeled 1, 2, 3 are the field profiles of the corresponding cases, all calculated for k = 3 cm-1.
PLASMA DIELECTRIC
~3. Case 3: Plasma guide ~3. Left: The transverse
1 A \ '
N / ■ \ ttJ
—~^ \i "\^ 2
N : \ W : \
u
RADIUS
0 2 4 6 8 10
WAVENUMBER (cm-1)
Fig. 16. Right: The dispersion curve for a cylindrical waveguide of radius R = 1.8 cm. loaded with a plasma column R,, = 1.2 cm. and a dielectric {( = 10)1.2 cm<r<1.8 cm. This is a model representation of a slow wave structure loaded with a plasma (see [33]). D-. = oo. Case 1: TMoi mode in an empty waveguide. Case 2: TMoi mode in a waveguide loaded with plasma. <v\, = x 10' and a dielectric (e = 10). Case 3: Plasma guide (Trivelpiece-Gould) mode in a waveguide loaded with plasma. A'p = 7x10" cm-3, and a dielectric (e = 10). Left: The transverse profile of the longitudinal electric field. E:. The curves labeled 1. 2. 3 are the field profiles of the corresponding cases, all calculated for k = 3 cm-'.
~10-3. We chose to use 5 = 400 in our calculations, giving an accuracy of at least 10-4.
ACKNOWLEDGMENT
The authors are grateful to K. Ogura and K. Minami of Niigata University for helpful discussions and performing

SHKVARUNETS et at.: ELECTROMAGNETIC PROPERTIES 917
Satoru Kobayashi received the B.S. and M.S. degrees in geological science from Kyoto University. Japan, in 1986 and 1989. respectively, and the M.S. degree in physics from Washington State University. Pullman, in 1991. He is currently a graduate student in the Department of Physics at the University of Maryland. College Park.
John Rodgers. for a biography, see this issue, p. 686
Thomas M. Antonsen, Jr. (M'87), for a photograph and biography, see this issue, p. 757.
James Weaver received the B.S. degree in physics from the Massachusetts Institute of Technology. Cambridge, in 1992. He is currently a graduate student in the Department of Electrical Engineering at the University of Maryland at College Park.
Victor L. Granatstein (S 59-M 64-SM Sfc-F 92) biography, see this issue, p. 665.
tor J phoiograpn and
YuvaJ Carmel (S'66-M'69-SM'90). for a biography, see this issue, p. 851. William W. DesUer (M'84-SM'90-F'92). for a photograph and biography, see this issue, p. 686.

f-L
Comparative study of microwave sintering of Zinc Oxide at
2.45,30 and 83 GHz(a).
A. Birnboim, D. Gershon, J. Calame, A. Birman, Y. Carmel, J. Rodgers and
B. Levush,
Inst. of Plasma Research, University of Maryland, College Park, MD, USA.
Yu. V. Bykov, A.G. Eremeev, V.V. Holoptsev and V.E. Semenov
Inst. of Applied Physics, Russian Academy of Science, Nizhny Novgorod, Russia.
D. Dadon, L.P. Martin and M. Rosen
Department of Materials Science and Engineering, Johns Hopkins University,
Baltimore, MD, USA.
R. Hutcheon
Chalk River Laboratories, Chalk River, Ontario K0J1 JO, Canada.
(a) Parts of this work were presented at the Microwave Processing of Materials
Symposium, San Francisco, CA, April 8-12, 1996, paper 03.3
Abstract
Temperature gradients that develop in ceramic materials during microwave heating
are known to be strongly dependent on the applied microwave frequency. To gain
better understanding of this dependence, identical samples of ZnO powder compacts
were microwave heated at three distinct widely separated frequencies of 2.45, 30 and
83 GHz and the core and surface temperatures were simultaneously monitored. At
2.45 GHz, the approximately uniform "volumetric" heating tends to raise the
temperature of the sample as a whole, but the interior becomes hotter than the exterior
due to heat loss from the surface. At 30 and 83 GHz, this interior to exterior
temperature difference was found to be reversed, especially for high heating rates.
This reversal resulted from increased energy deposition close to the sample's surface
associated with reduced skin depth. A model for solving Maxwell's equations was
incorporated into a newly developed two-dimensional (2-D) heat transport simulation
code. The numerical simulations are in agreement with the experimental results.
Simultaneous application of two or more widely separated frequencies is expected to
allow electronic tailoring of the temperature profile during sintering.
1. Introduction
The use of microwave energy for processing ceramics has recently become an
attractive area for research and innovation. Microwave heating is volumetric, direct,
instantaneous and selective. These characteristics can yield materials with improved
mechanical and physical properties. Among the potential advantages of microwave
processing of ceramic materials are: accelerated densification rate, controlled grain
growth and uniform microstructure, achievement of high density without the use of
sintering aids, improved sinterability of large bodies of complex shape, and enhanced
mechanical properties. A summary of some recent studies is given in a series of
review articles published in a special issue devoted to microwave processing [1].
To use these potential advantages to optimize a specific microwave sintering
process, a number of technical challenges need to be addressed. For example, the
approximately uniform volumetric power absorption allows a very high heating rate,
but it does not guarantee a homogeneous temperature distribution. The volumetric
heating uniformly raises the temperature of the entire sample, but heat loss from the
surface causes the exterior to become cooler than the interior. Thus in ceramic
materials with poor thermal conductivity, large thermal gradients can develop in the
sample. The magnitude, sign and temporal evolution of these gradients are a function
of the applied frequency. These thermal gradients, which are often negligible in
conventional oven sintering, may lead to the development of undesirable density
gradients during microwave sintering [2].
Fig. 1 shows the measured normalized skin-depth (the skin depth, 8, divided by the
sample radius, rsamph = 1.6cm), as a function of temperature for ZnO at a frequency of
2.45GHz. The skin-depth is a measure of the penetration of the electromagnetic field
into a material. It depends on the complex permittivity of the material (s = s' -je")
and on the operating frequency (f) and is given by:
^ ~ ;=====■ (\\

where c is the velocity of light. Since 8 is much larger than the sample's radius for
T<700°C, a quasi-homogeneous electromagnetic energy deposition inside the sample
is expected. At higher temperatures and frequencies, 5 decreases to less than r5ample
(the higher the frequency the lower the value of S). Once the skin-depth becomes
much less than rsample , heat deposition is concentrated at the surface, and the
temperature difference {AT = T^-T^,) is expected to decrease and may even
become negative. Another advantage of higher frequencies is a more uniform filed
distribution for a given applicator size.
At high heating rates, these gradients may cause non-uniform properties and even
cracking of the sample. One possible solution to this problem , proposed in Ref. [3],
is to simultaneously apply two microwave sources operating at widely separated
frequencies (2.45 and 30 GHz). By dynamically and independently adjusting the output
power of each of the two sources, it is possible to control the rate and spatial
distribution of the energy deposition within the material being processed. This
approach allows the temperature profile in the sample to be electronically "tailored"
and, thereby, makes it possible to combine a high heating rate with a homogeneous
temperature distribution. Also, it should be noted that the additional high frequency
microwave source is expected to facilitate rapid heating of low-loss ceramics such as
pure oxides and nitrides without the need for auxiliary heating, currently used in many
microwave ceramic sintering applications [3].
As a first step towards the development of multi-frequency microwave heating
processes, a comparative study of microwave heating of zinc oxide (ZnO) samples at
2.45, 30 and 83 GHz was performed. ZnO is widely used in the manufacture of
varistors and is of commercial importance. It is particularly suitable for studies of
rapid microwave sintering due to its medium loss tangent at 2.45, 30 and 83 GHz for
all temperatures and its relatively low sintering temperature (1100°C). In the present
study, identical samples were microwave processed at the three frequencies, and for
each frequency the temporal evolution of the temperature difference in the sample was
measured at 15 °C/min. For 30 GHz this temperature difference was also measured at
30 and 75 °C/min. The densification curves, p = p(T), were experimentally

determined for all three frequencies. Measurement of the dielectric properties, and
assuming a simple temperature dependence of the thermal conductivity allowed the
simulation of the microwave sintering process, with good agreement with the
experimental results.
In section II the experimental set-up and procedures, as well as the results, are
presented. In section III, the principles of modeling of the microwave sintering
process are discussed. These include determination of the dielectric and thermal
properties and their dependence on the temperature and density. In section IV,
numerical simulations are presented and compared to the measurements. The final
section contains a summary of the main results and conclusions of the research.
■2. Microwave sintering of ZnO ceramic samples.
Identical green ZnO samples were prepared from a commercial high purity (>0.99)
zinc oxide powder (particle size less than 5um) by uniaxially binderless pressing to
form cylinders 32 mm in diameter and 15 mm in height. The density of the compacted
cylinders was measured to be 52% ± 2% of the crystal theoretical density {p!h = 5.61
g/cm3). The sample was imbedded in a powdered insulation contained in an Alumina
enclosure. Diagrams of the microwave sintering sample fixture and insulation, as well
as a block diagram of the microwave processing furnace are shown in Figs. 2 and 3
respectively.
A sheathed, grounded type K thermocouple (outer diameter of 0.32 cm), inserted
into a hole drilled into the center, measured the core temperature. The surface
temperature was measured using a second type K thermocouple in contact with the
cylinder's curved surface. The thermal response time of the thermocouples is under
two seconds, which is short compared to the characteristic time scale of the
temperature variations. Microwave sintering was performed in highly overmoded
applicator equipped with a power feedback loop, shown schematically in Fig. 3.. The
computer regulated the rate of temperature rise (the core temperature, Tcore, for the
2.45 GHz experiment and the surface temperature, Tsurfact , for 30 and 83 GHz

experiments). All samples were heated at a preset rate until a desired temperature was
obtained and then cooled down. In the 2.45 GHz experiments, the microwave furnace
power was reduced in a controlled way after reaching the desired maximum
temperature in order to mimic the slower cool-down of a thermal oven in a previous
experiments (with an initial cooling rate of ~4°C/min) [2,5]. In the 30 and 83 GHz
experiments, the power was turned off and the samples freely cooled down in the
thermal insulation (with initial cooling rate of ~20°C/min). In all cases the processing
gas was air (the effect of the processing gas on the heating is discussed in Ref. [4]).
All the experiments reported in this work were performed under similar conditions.
Details of the processing parameters are summarized in table I. Although different
powders were used as insulation in some experiments, the difference in their dielectric
losses will not have a large effect on the temperatures in the sample because of their
very low density.
In Fig. 4 the relative bulk density of the sintered samples, R = p/pth , js plotted
versus the maximum core temperature attained in different experiments for microwave
as well as conventional heating (the issue of density gradients in the sample was
addressed in [2] ). The densification data for 2.45 GHz microwave heating exhibit a
different behavior from that of conventional heating, as shown in Ref. [2], Although
the densification curve for 30 and 83 GHz resembles closely that of conventional oven
processing, this fact does not mean that the densification rates are identical for both
processes due to some differences in the cooling rate in each cases. The samples
processed at 30 and 83 GHz spent somewhat less time at elevated temperatures
compared to those processed in the conventional furnace.
The temperature gradients developed in the microwave heated sample depend on
thermal insulation, and the intensity and spatial distribution of microwave power
absorption. The spatial distribution is determined by the sample dielectric properties
which are functions of the sample temperature and microwave field frequency. Thus,
the temperature gradients also depend on the temperature, frequency, and heating rate!
Further understanding of this dependence is critical to the successful implementation

of microwave sintering as a ceramic processing method. In the present work this
dependence was studied and the results are presented below.
In Fig.5 the temperature difference (AT=Tcore-Tsulface) measured at constant heating
rate of 15°C/min is plotted against the core temperature for three samples heated at
2.45, 30 and 83 GHz. In Fig. 6a the temperature difference AT is shown versus the
core temperature for 30 GHz microwave heating at two heating rates, 15 °C/min and
75 °C/min. Initially, the measured temperature difference AT is positive and increases
with the core temperature increase until a maximum value is achieved. During this
initial stage the higher the heating rate the higher the value of dAT/dTcore. This is
confirmed by a comparison of the two traces in Fig. 6a and an analysis of the 2.45
GHz trace in Fig. 5. Fig. 5 indicates an increase in JAT/dTcore when the heating rate
was abruptly changed from 1 °C/min to 15 °C/min (this occurs at Tcore =200°C). The
behavior of the measured temperature difference AT is consistent with quasi-uniform
energy deposition in the sample volume during the initial heating stage.
After peaking, the temperature difference AT begins to decrease while the core
temperature is still rising. Such a behavior can be caused by a) a change in the power
deposition profile in the sample, b) an increase in the thermal conductivity of the
sample, and c) a decrease in thermal conductivity of the insulation. The first factor is
related to a shorter penetration of the microwave field into the sample and is the
dominant factor. At high heating rate at 30 GHz processing, a temperature reversal is
observed. This reversal (negative gradient) is shown in Fig. 6b.
Ultrasonic velocity and microstructure measurements [5] were performed on
selected samples in order to evaluate sample integrity and potential differences in the
elastic properties. Pore shape and size have a large effect on the elastic properties, and
therefore on the ultrasonic velocity of porous materials. If significantly different pore
structures evolved in the samples when prepared by the different techniques, this
should be manifested in differences in the velocity-density relations. The longitudinal
ultrasonic velocity versus density was measured for samples heated in the conventional
furnace and in microwaves at 83 and 2.45 GHz. The data of all measured samples are
observed to exhibit the v, = v0 (p/p^ behavior [5] previously found for both thermal

and 2.45 GHz microwave processed samples (w = 1.5 and v«r=6000 m/sec). The
conclusion is that there is no measurable effect on the elasticity-porosity relation
inherent to the use of microwave energy for sintering of this material system.
3. Modeling of Microwave Sintering of ZnO Samples
The description of the Microwave sintering process requires a combined solution
of two problems related to different physical disciplines. First, one has to solve
Maxwell's equations in order to get the instantaneous power deposited at each point
of the system. Then the heat conductivity that is responsible for redistribution and
losses of the absorbed energy has to be properly treated. Both problems are highly
nonlinear as the permitivity, specific heat, conductivity coefficients and even the
density and the dimensions of the sample are changing with temperature, which in
itself is determined by those parameters and by the frequency and power of the
microwave source. The equations describing those two processes have to be solved
with complicated boundary conditions related to the detailed structure of the sample,
its isolating environment and the oven.
It is obvious that such a complicated problem cannot be solved analytically, and
numerical methods are required. In this section we describe the code developed in
order to simulate the Microwave sintering process. The heat conduction problem is
described in a two-dimensional cylindrical (r,z) geometry, thus adequate for an exact
description of any configuration that has an axial symmetry. We use an orthogonal
mesh with variable cell size in both r and z directions. The electromagnetic energy
deposition problem is treated approximately taking into account the changes in the
electromagnetic field as it penetrates into the sample. We now describe in more detail
the treatment of the various physical processes involved.
3.1 Electromagnetic Energy deposition
Three dimensional [6] and ray tracing approach [7] can be used to simulate this
problem. The difficulty with 3-D approach is the need for very large memory and
computing time to adequately model complex and time dependent systems, especially

in highly overmoded cavities. Ray tracing is problematic because the assumption of
small change in field intensity over one wavelength breaks down when modeling high
loss materials (for calculation of the electromagnetic energy deposition the local, not
the average, field is essential).
We calculate the energy absorption using a 1-D model, which is reasonable for heating
in overmoded cavities where the electromagnetic fields are relatively uniform, leading
to uniform sample illumination. The electromagnetic field penetration into the sample
is calculated taking into account the instantaneous dielectric properties of the sample
and its thermal insulation.
The electromagnetic power absorbed per unit volume is given by [8]
P=2Kfs0e"|E|2/2 (2)
Where f is the applied microwave frequency, s = s' - js" is the relative complex
permitivity of the material, s0 is the permitivity of free space, and E(r,z,t) is the local
complex amplitude of the microwave electric field in the material. This field is
determined by the solution of the Helmholz equation
V2E + K
2E = 0 (3)
Where K = 2K/ (U^S)''2 is the propagation vector of the electromagnetic wave and
|io is the free space permeability.
The dependence of the complex permitivity of ZnO on the density was discussed in
great detail in [9]. In this work, however, the complex permitivity was measured
during thermal heating as a function of the temperature and density. These
measurements were done using a cavity perturbation technique, as reported in
references [4,13]. The permitivity of ZnO, of initial density 0.52Pth (Plh is the
theoretical density), was measured at a heating rate of 15°C/min from room
temperature to ~ 1100 °C, where p ^ pth . The results (Fig. 7) show that both the
real (s') and imaginary (s") parts of the complex permitivity, are fairly constant up to
700 °C and significantly increase above this temperature. In particular, E" changes by
three orders of magnitude (from -0.12 to -120). In the course of heating,

10
densification occurs so that these measurements reflect the actual variation of the
permitivity with the temperature and density for a heating rate of 15°C/min. We
assumed that the material maintains its maximum permittivity value achieved during
densification even during the cool down phase.
Also shown in Fig. 7 is the variation of the normalized skin-depth (5/^^ ) with
temperature. Note that below 700°C 5/r^^ »1, which confirms the quasi-
homogeneous energy deposition inside the sample at the initial stage of heating. At
somewhat higher temperatures, 8/^,. becomes less than unity and the higher the
frequency the lower the value of Ö/r^e. Once S/r«.^ « 1, heat deposition is
concentrated at the sample's surface and the temperature difference AT drops and may
become negative.
The permitivity of the Alumina casting (density of 0.24 g/cc) was taken to be
E = 4.5-j-0.0001.
The room temperature permitivity of ZnO had been measured over a wide range of
densities (52% - 98%) and frequencies (0.2 - 20 GHz) [5]. Both s' and s" , seem to
exponentially decrease with respect to frequency and the slope weakly depends on the
density of the sample. Since this density dependence was hard to parameterize, the
same linear dependence on log(f) was assumed for all densities. The decrease in
permitivity with frequency was approximated by
£(f,T)=E(2.45GHz,T)[l-0.55 1og10(f(GHz)/2.45)] (4)
This dependence was extrapolated up to 83 GHz (while keeping e'>l). We note that
the simulation results are not particularly sensitive to the exact frequency dependence
of the permitivity, since the major factor in determining the skin-depth is the 1/f term
in Eq.(l). Thus, for frequencies above 30GHz (and medium to high temperatures), the
electromagnetic energy is deposited near the sample surface.
Once the complex permitivity in each cell is known we calculate the field
penetration separately in the radial and axial directions using a planar approximation
(the impedance.matching technique). The power absorbed per unit volume in each cell
in

11
is then calculated as the sum of the contributions from both directions. Though this is
only an approximate treatment it describes the main features of non-uniform
absorption throughout the sample (with preferential energy absorption near the
surfaces). We did not find essential differences in the conclusions of this paper about
the temperature gradients, when we used only the radial energy deposition instead of
both r and z contributions. This is due to the fact that at the first stages of heating the
only important feature is the heat conduction, which is described exactly. At the last
stages, the energy is absorbed near the surfaces of the sample, and the energy
absorption through the bases of the cylindrical sample does not affect much the
gradients in the radial direction.
We now describe the energy deposition due to an electromagnetic wave
propagating in the z direction. For any radial position (a constant r) the 1-D wave
propagation in cell i is described by two plane waves of unknown amplitudes. One is
propagating in the forward direction (Ef ) and the other in the opposite direction (Ef):
Ei = E,T exp (-JKft) + Er exp (jK&) (5)
Here K,=2^f (Uo£0ei )12 is the propagation factor of the electromagnetic wave in the i-
th cell, E, is the relative permitivity of the i-th cell and & is the coordinate measured
from the top of the i-th cell, (see Fig. 8). On the free boundary of the system the
amplitude Ef is assumed to be the known amplitude of the incident electromagnetic
wave. The impedance method is used to solve the problem and arrive at specific
values for each of the unknown wave amplitudes Ef, Ef, Ef [10]
The power per unit volume deposited in each cell of width d, from this single
incident wave is computed as
xfeo£"J' Ui=^^^E;e-Jkl!+E:eJ^)d: (6)
In order to simulate waves propagating in the opposite direction, a second incident
wave of amplitude equal to the first wave (Ef) but uncorrected in phase is assumed to
impinge on the bottom of the cylinder (see Fig 8). The total heating power deposited
11

12
in cell i !s P; - U; + U„.i+l. This approach allows one to find the spatial distribution of
the power deposition in the system. The actual value of P; can be calculated once the
amplitude of the incident wave Ef is known.
3.2 Heat conduction
The heat conduction equation in cylindrical coordinates with axial symmetry (no
tangential gradients) is given by
T(r,z,t) is the temperature at point (r,z) at time t, c„ and K are the specific heat and the
thermal conductivity coefficient of the material occupying point (r,z) and p is its
density. P is the absorbed power discussed in section 3.1.
A finite difference code that solves equation (7) was developed. As mentioned, we
use an orthogonal mesh with variable cell size. Thus we can have small cells in the
interesting regions (i.e. the sample) and wider cells in other regions. A variable mesh
within a material zone enables a smooth change from small to large cells. The mesh is
changing during the calculation as the sample shrinks when densification occurs.
The temperature in each cell is advanced in time by solving exactly the two-
dimensional temperature field (without splitting). Several options of boundary
conditions are allowed. The details of the code will be described elsewhere. In this
paper we shall only describe the physical database used in the simulations presented in
the next chapter.
Measurements of the thermal conductivity of ZnO after being sintered to density of
3.72 and 5.20 g/cc may be found in [11]. However, we do not have data for the
conductivity during the sintering process and for the insulation. The conductivity is
expected to increase during sintering, as the grains are merging and densification
occurs. We modeled this behavior by a power law dependence of the conductivity on
temperature. The results shown in the next chapter were obtained by describing the'
conductivity coefficient by
n

13
K = Ko (T/520) " (8)
where K« =5.34 -lO'3 W/cm/ °C , and T is measured in °C. At low temperatures the
conductivity was bounded by K > 0.5 K». After densification the high conductivity
obtained at 1100 °C was maintained during the cooling process. The conductivity of
the insulation powder was Ko and the conductivity of the Alumina was given by the
manufacturer, and described by the function
K=8-10"* + a(T-500) W/cm/°C (9)
where a =8-10"7 forT < 500 °C and a = 16-10'7 for T> 500 °C.
3.3 Specific Hent
The temperature dependence of the specific heat in the range relevant to ZnO
sintering was taken from [ 12] and fitted to the curve [3 ]
Cp=-9880/T2+7.43-lO^T+0.58 J/g/°K (10)
where T is in °K.
The specific heat of the Alumina cast was taken to be 1.09 J/ g/ °K .
3.4 Densification curve
The density of the ZnO sample is increasing during the sintering. The relative density
(p /p ü.) is not changing up to 600 °C . Above that it is given in our model by
(p/pth)= l-exp(-0.00586(T-463.7) for T < 1150,
and
(p/p,h)=0.776 + 0.1792-10-3T for T> 1150
where T is measured in °C.
The code verifies that this function in each cell is monotonically increasing and does
not exceed unity.
11
14
4. Simulation of the sintering experiments
The details of the experimental setup were given in section 2. Because of symmetry it
is enough to simulate a quarter of the geometry shown in Fig 2. The electromagnetic
solution, however, is taking into account the full height of the system as described in
3.1.
The details of the materials and mesh used in the simulation are given in table II.
The graphs presented later are the results of simulations with a total number of 5520
cells that describe the sample (initial relative density 0.52), the ZnO powder (relative
density 0.12) and the Alumina cast. The mesh of the low-density powder was arranged
in the z direction as a geometrical series, allowing very fine cells near the sample and
broader cells far from it. Since the results converge with respect to the number of
cells, it is enough to use only half the number of cells in each direction (total of V4
number of cells). We used a mirror boundary conditions on the axes, and imposed
room temperature boundary conditions on the outer surface of the Alumina cast. This
is justified since our measurements show that this temperature never exceeds 100 °C.
Fig. 9 shows the measured results of a 2.45 GHz sintering (experiment z34). The
three lines describe the core temperature (T««), the outer boundary temperature of the
sample on the equator (we shall refer to this as surface temperature (T^«)) and the
input microwave power (in W). The temperature controller was programmed to track
a four segment (1, 15, -6.8 and -3.5 °C/min) Tcore history shown in Fig.9. We see
that in order to maintain the 15 °C/min heating rate, a complicated microwave power
history is required. This is due to the strong temperature dependence of the ZnO
permittivity on temperature. We see that when Tcore*500 °C, the core is further heated
without power increase and even when the power is lowered. As done in the
experiment a PID feedback algorithm for the input power was used in the simulation in
order reproduce the desired Tcore. Also, this new approach is advantageous because of
the uncertainties in values of some physical parameters (permittivity, thermal
conductivity, densification scheme) and the sensitivity of the sintering process to these
parameters.
1/4

15
The results of our simulation are compared in details to the experiment in Figs.
10a-lOd. Fig. 10a shows Tcorefrom the experiment and the simulation. The two curves
are almost identical. Fig. 10b compares the surface temperature. The agreement is
quite good if we remember the three orders of magnitude changes in the permitivity,
the non-linearity of the problem and the approximations made for the conductivity
coefficients and the absorption model. A comparison of the temperature difference as
a function of core temperature is given in Fig 10c. The temperature difference is rising
to the same maximal value, and then decreases, though more rapidly in the simulation.
Fig. lOd compares the measured input microwave power with the one used in the
simulation. The plotted simulation curve is magnified by 1.33. This factor might
represent energy losses in the experiment and compensate for the approximations in
the calculation.
It order to investigate the behavior of the temperature difference at higher
frequencies we performed similar simulations at 30 and 83 GHz. The feedback
algorithm was designed to give the same Tcore as in the 2.45 GHz calculation. The
temperature difference as function of T««, as calculated for 2.45, 30 and 83 GHz, is
shown in Fig. 11. The temperature difference curves of all three frequencies are very
similar up to 700 °C, since the conductivity dominates the process. As the permitivity
starts its rapid increase, the temperature difference at 2.45 GHz rises up to 310 °C.
The high frequency radiation is already completely absorbed near the surface and the
temperature difference changes sign rapidly after reaching a maximal value of 190 and
170 °C, for the 30 and 83 GHz frequencies, respectively. The fact that we get a
negative differences already at Tcore of 760 °C suggests that by adding a high frequency
source at this instant to the already existing 2.45GHz source will enable us to greatly
reduce the temperature difference. By simultaneously using two (or more) microwave
sources with an independent, dynamic power control we hope to be able to "tailor" the
temperature difference during processing. To confirm this suggestion a detailed
design of the power profile of both sources is needed and it should be followed by an
experimental demonstration.
i<

16
5. Summary and conclusion
One of the advantages of microwave processing is its ability to generate high
heating rates. Unfortunately, these high heating rates tend to increase the core-surface r
temperature difference which are intrinsic to microwave processing. The magnitude
and sign of these differences depend on the thermal and dielectric coefficients, the
frequency of the applied electric field and the heating rate. Multi-frequency processing
with an independent dynamic control of the power at each frequency is expected to
enable external control of these gradients. In this work a comparative study of
processing at three different, widely separated frequencies (2.45, 30 and 83 GHz) was
reported. The temperature differences (AT=Tcore - 7^«,) during heating was
measured for all three frequencies. The difference increases with temperature and
peaks at about Tcore =800°C. For the 30 and 83 GHz processing, the decrease in the
temperature difference is rapid, and sign reversal (surface temperature being higher
than the core temperature) is observed for 30 GHz processing at T = 950°C and a
heating rate of 75°C/min. The magnitude of the temperature difference was observed
to increase with the heating rate. Also measured were: (a) the densification curves for
each of the microwave frequencies, (b) the dielectric permittivity of ZnO at a
frequency of 2.45 GHz from room temperature and green-state density to 1200°C
where nearly theoretical density is achieved. These results suggest that simultaneous
application of two or more widely separated frequencies is expected to allow
electronic tailoring of the temperature profile during sintering.
A two dimensional code based on simultaneous solution of the heat equation and
Maxwell's equations was developed. Taking into account were the dependence of the
thermal, dielectric and densification properties of ZnO on temperature, density and
frequency. A temperature feedback algorithm for controlling the microwave power, as
in the experimental set-up, is also included. The computational results are in good
agreement with the measurements, thus giving confidence in the code as a useful tool
for understanding microwave sintering experiments. Simulations at various frequencies
show that the temperature gradients developed with high frequency microwave
sources are smaller than those obtained with low frequency (for the same Tcore history),
\A

17
and become negative at about 760 °C. The main change in behavior already occurs at
30 GHz and the difference between 30 and 83 GHz processing small (for ZnO). This is
also observed experimentally as might be seen from Fig 5.
Acknowledgments
This work was supported by the Division of Advanced Energy Projects, U.S.
Department of Energy, under grant number DE-FG02-94ER12190. Partial support
provided by the Air Force Office of Scientific Research (MURI program on HPM), by
the Air Force Office of Scientific Research (Directorate of Aerospace and Material
Sciences), by the Army Research Office, by NATO Linkage Grant HTECH LG-
940364 and by the Russian Basic Research Foundation, grant 95-02-05000-a. The
authors are grateful to K. I. Rybakov and D. Abe for useful discussion and comments
during this research.
IT
■•»•■■•. .:ir-itjjtvf- ■■■ ••„■'.-'^k«iv

18
Frequency Powder Control Process Heating rate [GHz] insulation thermocouple gas [ C/minj
2.45 ZnO
(0.12Plh)
core air 1 uC/min to 200UC
then 15 °C/min
30 A1203
(0.2Pdl)
surface air 15.30&75 °C/min
83 AJ203
(0.2Plh)
surface air 15U C/min
Table I. Processing parameters for microwave sintering of ZnO at three frequencies
Material Density
[g/cm3]
Outer radius
[cm]
Half height
[cm]
Nr N,
Sample ZnO 2.917 1.60 0.76 48 20
Powder
Insulation
ZnO 0.673 2.54 7.00 78 50
Cast A1203 0.240 3.81 8.25 92 60
Table II. Parameters used in the simulation. Nr and Nz are the accumulated cell
numbers in the r and z directions.
10

19
References
1) Material Research Society Bulletin, Special Issue on Microwave Processing of
Materials, 18, 11 (1993)
2) D. Dadon, L.P. Martin, A. Birman, Y. Carmel, D. Gershon, J.P. Calame, B. Levush
and M. Rosen "Temperature and Porosity Gradients Developed During Non-
isothermal Microwave Processing of ZnO" J. Mat. Synth, and Proc. 4, 2, 1996.
3) A. Birman, B. Levush, Y. Carmel, D. Gershon, D. Dadon, L.P. Martin and M. Rosen,
"Modeling of Multi-frequency Microwave Sintering of ZnO Ceramic" in Ceramic
Transactions, 59, Microwave: Theory and Application in Material Processing III., D.
E. Clark, D. C. Folz, S. J. Oda and R. Silberglitt, eds. (American Ceramic Society,
Cincinnati, OH, 1995), pp 305-312.
4) D. Dadon, Y. Carmel, A. Birman, D. Gershon, R. Hutcheon L.P. Martin, B. Levush
and M. Rosen, 'Electromagnetic Driven Heat Front during Microwave Heating of
ZnO", submitted to Physical Review Letters.
5) L. P. Martin, D. Dadon, D, Gershon, M. Rosen, A. Birman, B. Levush and Y. Carmel:
"Ultrasonic and Dielectric Characterization of Microwave and Conventionally Sintered
ZnO", in press, J. Am. Ceramic. Soc. (October 1996)
6) M. Subirates,Y. Yao, M. Iskander and J. kiggans "FDTD Simulations of Microwave
Sintering in Large (500/400 liter) Multimode Cavities", MRS Spring 1996 Meeting,
san Francisco, April 8-12, paper 010.2, p 250.
7) L. Feher, G. Link and M. Thumm, "The Mira/Thesis-code for Resonator Design and
Modeling of Millimeterwave Material Processing" MRS Spring 1996 Meeting, san
Francisco, April 8-12, paper 016.5, p 255.
8) W. Sutton in Microwave Processing of Ceramic Materials, Am. Cer. Soc. Bull. 68,
376-85 (1989).
9) J. P. Calame, A. Birman, Y. Carmel, D. Gershon, B. Levush, A. A Sorokin, V.
Semenov, D. Dadon, L.P. Martin, M. Rosen: "A Dielectric Mixing Law for Porous
Ceramics Based on Fractal Boundaries", J. Appl. Phys. 80, 7, 1996.
10) X. D. Yu, V. V. Varadan, V. K. Varadan, "Modeling Microwave Heating of Ceramic"
in Ceramic Transactions, 21, Microwave: Theory and Application in Material
in

20
Processing, D. E. Clark, F. D. Gac and W. H. Sutton, eds. (American Ceramic
Society, Westerviile, OH, 1991), pp. 167-176.
11) Y.S. Touloukian, R.W. Powell, C.Y. Ho, P:G. Klemens, "Thermophysical Properties
of Matter" ,The TPRC Data Series (Plenum New-York 1970).
12) J.Wang and R. Raj, "Estimates of the Activation Energies for Boundary Diffusion
from Rate-Controlled Sintering of Pure Alumina, and Alumina Doped with Zirconia
or Titania." J. Am. Ceramic. Soc, 73, pp. 1172-79, 1990.
13) R. Hutcheon, M. de Jong, F. Adams, G. Wood, J. McGregor and B. Smith, "A System
for Rapid Measurements of RF and Microwave Properties up to 1400C", The Journal
of Microwave Power and Electromagnetic Energy, 27 pp. 93-99 1992.
nn

21
Figure caption
Figure 1. The skin depth normalized to the sample's radius (#rsample) as a function of
the temperature for ZnO at 2.45 GHz.
Figure 2. Diagram of the microwave sintering fixture. Sample diameter and height
3.2 and 1.524 cm. Inner diameter and height of the low density Alumina enclosure
5.08 and 14 cm. Outer diameter and height of the enclosure 7.62 and 16.5 cm.
Figure 3. Schematic diagram of the overmoded microwave processing furnace with
a computerized feedback control of the temperature / microwave power.
Figure 4. Densification curves (Relative density, p/p,h ) versus the maximum core
temperature for ZnO samples sintered in microwave (2.45, 30, and 83 GHz) and
thermal ovens.
Figure 5. The measured temperature difference (AT=Tcore - T^« ) versus Tcore for
ZnO. Data are for a heating rate of 15°C/min at three different microwave frequencies
(2.45, 30, and 83 GHz).
Figure 6. (a) The measured temperature difference (AT=Tcore - T^«) for microwave
sintering of ZnO at 30 GHz for two heating rates 15 °C/min and 75 °C/min. (b) same,
but expanded scale.
Figure 7. The measured real (s') and imaginary (s") parts of the complex permittivity
of ZnO versus temperature at 2.45 GHz. The normalized skin-depth (#rsample) is also
shown.
Figure 8. Cell structure and notations used in the impedance matching solution for the
electromagnetic wave within the sample and its insulation.
Figure 9. Measured parameters during the ZnO sintering process.
Figure 10. Comparison between the measured and the calculated parameters:
a. Calculated and measured T^ versus time.
b. Calculated and measured T^« versus time.
c. Calculated and measured temperature difference versus core temperature.
d. Calculated and measured microwave power versus time.
">i

22
Figure 11. Calculated temperature difference AT versus core temperature for 2.45 30 and öj uhtz microwave frequency. '
*>n

. k.
o o o T H r-i rH T H C
O o CM
• rH
•
•
• O o o • rH
m •
• Ü 0
• O *^^
• O 00 V
• u • 3
• 4-i A O cd
• N o CD
8 V • O ft •
O s • M
O
• ® H O • S3 O
•
•
CN o
' •
• o O O r- H T-
O rH r-i c 5
.ordures . _ I J/9]
smpei s,aidures/i^dap-ui3|s

Microwave irradiation
'S/.
^^IJJJ^J JV , . ■ J J U U U V
Low density Alumina
Surface thermocouple
Core thermocouple
r,>>

Process Gas
0 Microwave Source (1,2,3)
r ^ Highly Overmoded Applicator
Computerized
Controller
Incident Power
Reflected Power
Core Temperature Signal
Surface Temperature Signal
1) 2.45 GHz. Magnetron (3 kw) 2) 30 GHz 2nd Harmonic Gyrotron (10 kw) 3) 83 GHz Gyrotron (5 kw)
%3

i i i
V \ % \ \
D
,D
O oo Ö
%* K]
Ö
o o CM
d •i—i
0Ü ö ö ö ö
^J_ »i-l -r-H .|—1 .pH
H^ ^ S S ÖÜÜÜÜ Gjo o o o > io m o o O H H CO CO
CO hH C H-j tSl N N
=H ^ O O CO H CN co co co ■ t
> D O
o o o
i *
\<QJ
o o oo
CD
Ö
o o LOCO
©
Ü
J-l
JH
ft
in d/d ^isugp 9ApB|9H

Ü
O
cd o OH
a EH 0)
o O
[00] aoBjuns 9J00
X" J, = xv
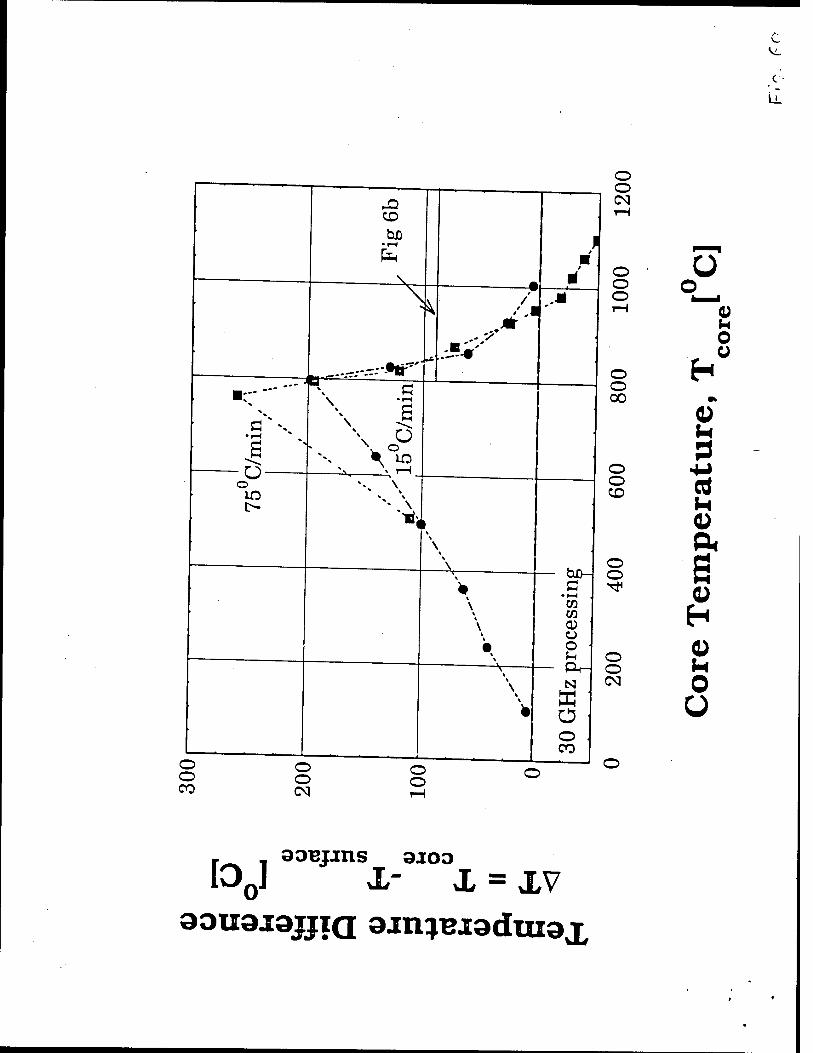
o o CO
.3" *-
-O — o
CD
• 1-1
\
O O
\ \
Ö •l-H
ö w °
/
o o CM
o o o
\
■ hD- C
• 1—1 cc CO CD o o s-l CM N
O o CO
o o
o o 00
o o CD
o o
o o cq
ü Q
o u
cd
0)
0) H In o Ü
100J X" X = XV

—i—i * i i i , o [- r- , r_
' | o rH
N ' ■ w / . o /
o / . - co .. / 8 ©
/
o rH rH
hfl / Ö / issa /
■
ü / ■
o / __ a / o
Ö •1—1 n—"— -H ° O
' £ / rH
/ o » / o er
/ / i
O - Ö
/ / ^ 1
O N - O
■ / 1 O i / . /
/ / J ■ 6 /
/ \ /
/ —-*c , , o
o ' J ' L. 1_ o m o oo 1
f \ 3; 3BJJIIS 3Ji DO
Ü
H 0)
o Ü
i^V x- x=xv

[ dldniBs
V9] snipBj s^dures/qjdap-ui^s o o
Ü
3 CO M V
S H
V
(u3 2? ,3) AJIApjJUuad 3APBPH

Incident wave E,+
£1=80 Reflected wave
£2
Ef+
Si te"
En=Eo

o
[All JaAlOd 3ABMOIOJX\[
P o
-[125
- 10
0
750
10 c^ oo "1 o 1 1 1 T..
■
^
' # ^ *
■ o *t '—~~ - o
.-^ r~ CO
<£r t
^<^-~ """"^-».^ >
1 •—^
^-^ XT:.— o •iH
S . -
^V-r:
1No o
0)
" \ • a \ ' * •IH
5 ä \\ \ H
ow
surf
core
- fc H H o o rrr ! 1
: i \\ i iH i 1 \li '
■
: i V:"
-j—i—■__ i A 1 1 , 1 _1_ L l ,
\\i
o w O o o ■J
o w o
o 10
J—'—'—i—L_
O 10
-»—i-—i i—LI O
o
[00J 3Jn;BJ3dui3X

o o
H
core
core
■a H c; •d
-w v
ula 3
(A o d 13 V O a
Ö
s s H
o o 0)
[OQ] am^BJ3dui3x

a B
B H
o
ex
LL
[Do] am^Bjaduiax

Low Co« .„frared Temperatur, Me.suren.en, and Op.taai Process C„„«rol in Microwave Sintering Systems*
J.P. Calame, Y. Carmel, E,Pert, and D. Gershon Institute for Plasma Research, Univ. of Maryland
• College Park, MD 20742
r . Abstract
J£Z^£%££?Z£** * *» >" - «* Ana, products with
devices. Suchco<nPl^LPZT^:!™rrm *" """" ^"^ " structures, ceramic insulators, and £ta supTm Z11 "" " SeVCTS a"d mode c°nml
heating cycles which are made possWe bv *?ml . f f^"™ reSU" from ,he raPid
important issue for ^^^ÄT' ^ °f ™— An temperature at multiple posiuons in fos«SvT^Zr ^TT """"«T«1« °f
investigating the application of direct detect ,L, • Y ° been experimentally problem. We have designed and mil?, 7' Ct"nmeraü lnft!red thermocouples to this conjunction with movXgotZ2BaF?'Z "f ' """ °f "*" ^'^ '" wavelengths as long as 20 microns) F™ JT . 2 P"CiÜ comPonents («Wch operate to ■his systfm to conven iona™kZt^SZZZZT"* "*"?"* ^ "P"*««* * materials. thermocouples and optical pyrometers will be described for several
Ä^SSr? °" a detailed b°*8' °f "» electromagnetic be measured a,~2r .ocl" TS IT** ""^ 'en,perature ™ "*- infer „ha, ,s happe^g in t^Tes, 0f thTobie«'d '^ *?» """"""'o"5 ™St be "5ed » simulations cam,o. be performed tnr^ tiL If• T? ^ I!"'6™8 pr0CeSS Such »-P'« used to form a processmg pto of acttüT I, T^™5' be done P™' to the sintering and control can thenbe used fo compensate fodiZ "'l"0"^ ***"• C'°Sed '°°P Process
concept will be described °mpenSa,e &r dlffe'enees between reality and the simulations. This
' Work supported by AFOSR/MURI program on High Power Mcrowaves and an ARO STIR
To Temperature Measurement
JZZZ™ZZa™Pl] T "*""»» si"'-"8 - be measured by pyrometers, ^M^SS^^^L0^ "T*™"- ** -lor optical very simple, they grossly distort .he rZT ,h.e""°COUpleS «* '"expensive ($I0-$200) and
power ^^^:^^:z^tx^!^t:^ *trin
changes in optical system L^S^öÄ^S!"" SamP'e "^ *"" expensive, (S4K-I5K), and canno, operate bZj^Zl'CrZ "*"^ multiple temperature sensors for nm..« V ° C The expense lmP1,es that having Vrt^tvaJ^^^SZ^Z^ >°d- «« quichly become
«•*- ,„„d.. open loop control -u*ÄÄ-^Ä^TS*

bdowltf ZTZT m0re reaSOnable <SIK-15K)' n0ninvasive- but "» canno, opera« Mow about 600 C and are very senstuve to changes in emissivity and optical system ansm,ss,v,.y. As an alternative, we have been actively investigating a new device™ own as an nfrared Thermocouple", which consists of a non-invasive, direct I dete^! IIV
^conductor dtode. These devices are remarkably inexpensive (S400), an re pond over a very
u™e&, —7^? oT'pTie **» '°tdeteCt SUCh l0ng ""*'•■ * '-es ensures a
ZiZi 0 "l 0 ,tZ?, • Fu"hOTnore' "» R wavelengths are considerably larger than the
numbers of these sensors can be economically used in a complex industrial nXce wW le fa
msfgnST * maChine 'he 'eraPera,Ure me™' ^ « can be'Idl^
/V(i)<tt = 8*rAc </A
A5 e^/^-i (1)
The wavelength of peak radiation in microns is eiven bv 25?onAT WU™T- »U * A senes of these blackbody curves are shown \Z£?^^£££%£££ * radtanon is given off; the peak at 500 X occurs at 3 urn and at 20 °C ,h7„.I , n ., Plotted in Fig 1 are the transmissivities for a 3 J t^do^f IS^ *""
10000.00
10O0.00
100.00
10.00
—I r 100
L 0 ° 2 4 6 « «0 12 14 16 18 20
Wavelength Cum)
Figure 1. Blackbody curves at various temperatures and transmission of various matenals
for^,^
focusing lenses, and manageable sensitivity to hutnidity. T^^SX^"™'^ measurement setup w„hi„ the microwave furnace is shown in Fig. 2 Thes Eld
ermocoup es" contort with the optical system must be calibrated agauns, „t nary thermocouple for each specnc material to be processed. We have perl J d suc ' "ahLions for
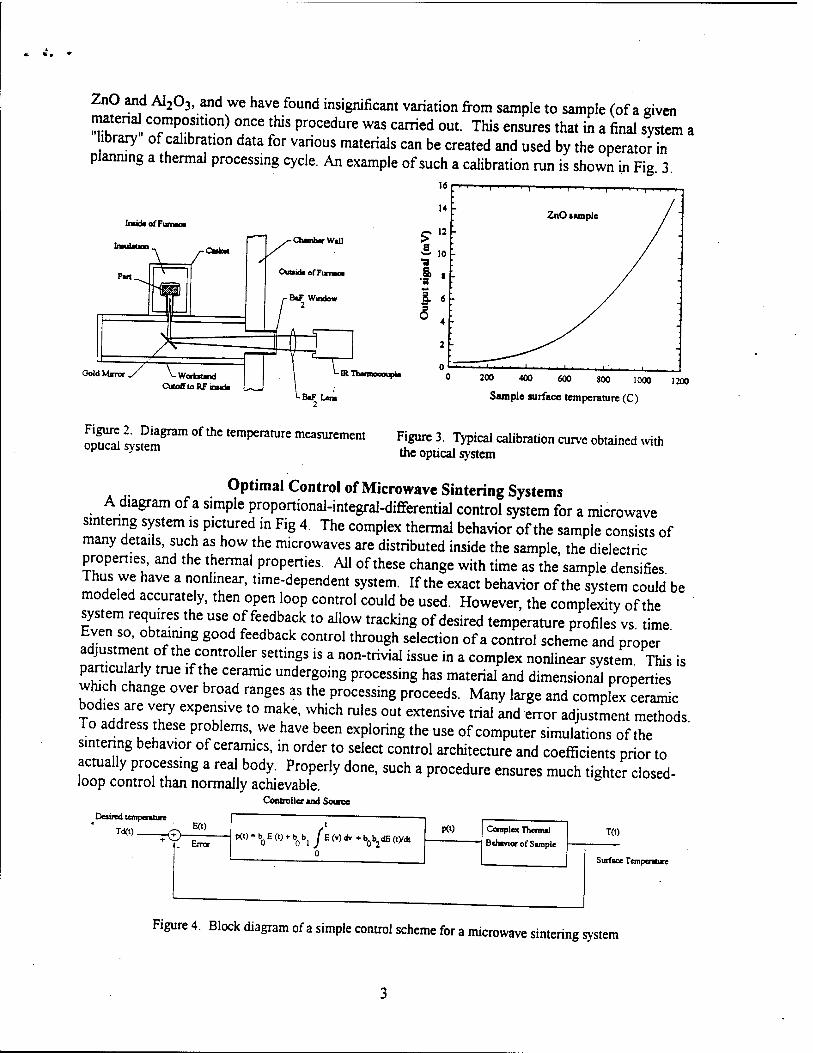
ZnO and A1203, and we have found insignificant variation from sample to sample (of a given material composition) once this procedure was carried out. This ensures that in a final system a library of calibration data for various materials can be created and used by the operator in
planning a thermal processing cycle. An example of such a calibration run is shown in Fig 3
Inaida of Fumao*
dumb* Wall
Oold Minor Tbannoeoupla 200 400 600 800 1000
Sample surface temperature (C)
1200
Figure 2. Diagram of the temperature measurement optical system Figure 3. Typical calibration curve obtained with
the optical system
Optimal Control of Microwave Sintering Systems A diagram of a simple proportional-integral-differential control system for a microwave
sintering system is pictured in Fig 4. The complex thermal behavior of the sample consists of many details, such as how the microwaves are distributed inside the sample, the dielectric properties and the thermal properties. All of these change with time as the sample densities Thus we have a nonlinear, time-dependent system. If the exact behavior of the system could be modeled accurately, then open loop control could be used. However, the complexity of the system requires the use of feedback to allow tracking of desired temperature profiles vs time Even so, obtaining good feedback control through selection of a control scheme and proper ' adjustment of the controller settings is a non-trivial issue in a complex nonlinear system This is particularly true if the ceramic undergoing processing has material and dimensional properties which change over broad ranges as the processing proceeds. Many large and complex ceramic bod.es are very expensive to make, which rules out extensive trial and error adjustment methods To address these problems, we have been exploring the use of computer simulations of the sintering behavior of ceramics, in order to select control architecture and coefficients prior to actually processing a real body. Properly done, such a procedure ensures much tighter closed- loop control than normally achievable.
Controller and Source
Deaired temperature
Toft) . r©- Eft)
Error p(t) - bQ E (I) + bQ b[ y E (v) dv ♦ bQb2dE (iydt
P(0 Complex Therm«!
Behavior of Sample TO)
Surface Temperature
Figure 4. Block diagram of a simple control scheme for a microwave sintering system

To accomplish such modeling, the ceramic body is divided up into meshes suitable for finite difference or finite element modeling. At any given time the meshes are assigned an appropriate set of dielectric and thermal properties depending on the temperature and density of the mesh element. The electromagnetic fields throughout the body are solved by finite element analysis, leading to a known power deposition in each mesh. These power densities are used in conjunction with the current temperatures to get new temperatures, by solving the time dependent heat equation. Similarly, the densification and therefore shrinkage is modeled with a densification equation. The process is then repeated. Obviously such a computation is very difficult in full 3D, so we have been concentrating on ID slab models at present. Figure 5 shows the results of simulations of a 3.3 cm thick slab of initially 52% dense ZnO pressed ceramic body surrounded by 4 cm of 12% density ZnO powdered insulation, when subjected to a surface power density Ps(t) (W/m2) that linearly increases with time according to P/t)=Rt. Simulated results of core and surface temperatures for/? = 300 and 600 WnrV1 are shown.
Surfaoe Temperature
— Core Temperature
20 40
Time (min)
12
- li
- 10 - 9 0
3 - 8 «
7 fe
h. I - J 60
4 'S u -3 a -2
- 1
- 0 60
Figure 5. Results of simulations of zinc oxide sintering with linearly increasing applied power
To investigate how to set up the control system, these simulations were used in conjunction with a simple first order nonlinear model of the ceramic system behavior
dT(t) dt
= o0(T)p(t)-ai(T)nty (2)
At any given temperature and time the linearized Laplace transform model for the ceramic was approximated by
F(s) = ^L s + ai (3)
From an analytical control system analysis the transfer behavior of a PI (proportional-integral), incrementally linear control system under these assumptions was found to be given by

T(s) = aob0(s + bi)
s + (a, + a0b0)s + bla0b0 Td(s) (4)
where the PI control function was assumed to be C(s) = b0 + bgbj/s, and derivative control was not employed at this point. The gain (proportional) coefficient b0 was using proportional band formalism (Bp) equal to 5% of the span, and the integral term was selected to create optimal damping of transients. The relevant equations are
f dT
dt + °\Tn m max
aoTmB. ^-^ ™ where Tm is the maximum desired temperature and dT/dt is the maximum desired heating rate. For nonlinear optimal control, these coefficients Z>, would be functions of temperature since a, are temperature dependent. We have found that for the simple example presented here that it suffices to simply set the a, in the above equations to constants equal to the average values of the a,/7) over the relevant range of temperatures, to arrive at constant control coefficients. Simulated results of this procedure are shown in Fig 6, for a constant rate heating profile T/t) of 60 °C/min. Clearly the surface temperature follows an appropriate linear ramp. In future work on complex bodies exhibiting more drastic temperature variations we will undoubtedly need to utilize the more general nonlinear, optimal control scheme in which the bt are allowed to vary (in the manner that the simulations predict) as the process proceeds.
1400
1200
^ 1000
I 800 CO
fi. 600
Surface Temperature
Core Temperature
Applied Power
10 U
Time (min)
20
h 18
16
14 3
h12 ¥
■3 -6 i)
X - 4
-2
0 20
Figure 6. Simulation with optimal PI control at 60 C/min.
Due to the self insulating properties of ceramic materials, coupled with the volumetric nature of the microwave heating process, core temperatures exceed surface temperatures. This is clearly seen in the Fig. 6 simulations. Such gradients are also observed in experiments. One way to prevent gradients is to apply a conventional heat source to the surfaces of the ceramic undergoing
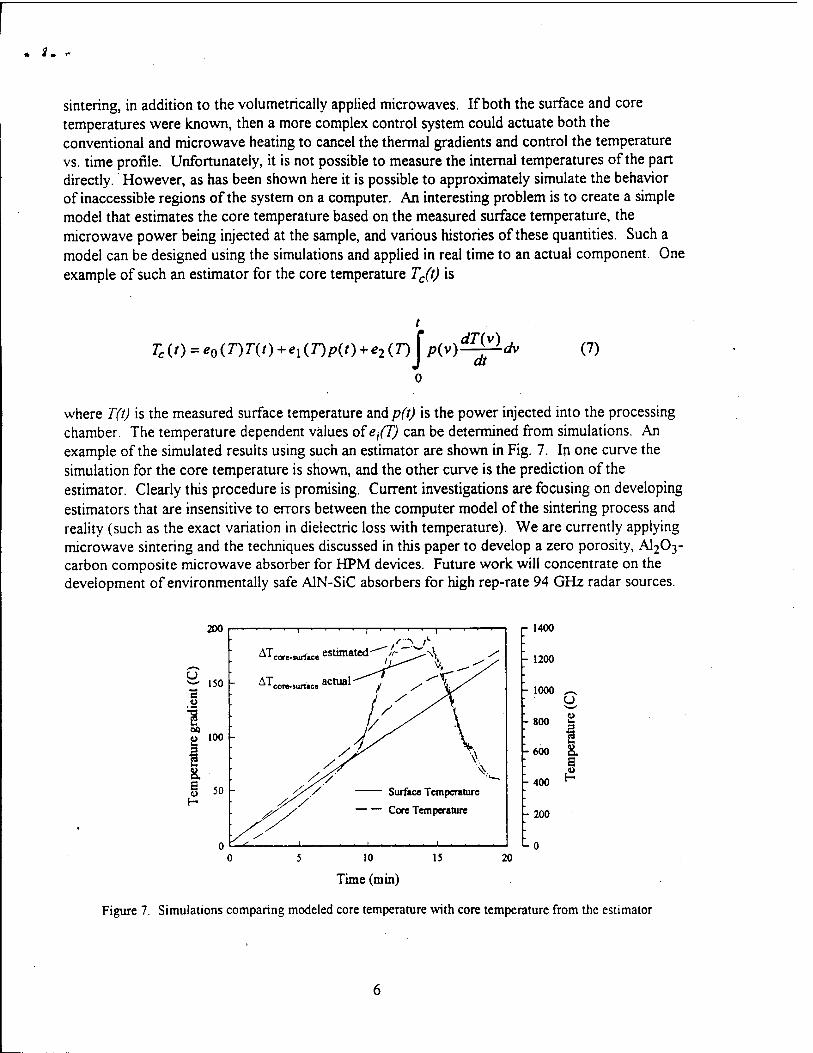
sintering, in addition to the volumetrically applied microwaves. If both the surface and core temperatures were known, then a more complex control system could actuate both the conventional and microwave heating to cancel the thermal gradients and control the temperature vs. time profile. Unfortunately, it is not possible to measure the internal temperatures of the part directly. However, as has been shown here it is possible to approximately simulate the behavior of inaccessible regions of the system on a computer. An interesting problem is to create a simple model that estimates the core temperature based on the measured surface temperature, the microwave power being injected at the sample, and various histories of these quantities. Such a model can be designed using the simulations and applied in real time to an actual component. One example of such an estimator for the core temperature Tc(t) is
Tc(t) = e0(T)T(t)+el(T)p(t) + e2(T) J p(v)—^-dv (7)
where T(t) is the measured surface temperature and p(t) is the power injected into the processing chamber. The temperature dependent values ofe/T) can be determined from simulations. An example of the simulated results using such an estimator are shown in Fig. 7. In one curve the simulation for the core temperature is shown, and the other curve is the prediction of the estimator. Clearly this procedure is promising. Current investigations are focusing on developing estimators that are insensitive to errors between the computer model of the sintering process and reality (such as the exact variation in dielectric loss with temperature). We are currently applying microwave sintering and the techniques discussed in this paper to develop a zero porosity, AI2O3- carbon composite microwave absorber for HPM devices. Future work will concentrate on the development of environmentally safe AIN-SiC absorbers for high rep-rate 94 GFIz radar sources.
200
AT. -turtice estimated-"".«-~" ^,-\\
Surface Temperatun
Core Temperature
r 1400
1200
h 1000
800
L0 10
Time (min) 20
CJ
-600 Si s
400 H
- 200
Figure 7. Simulations comparing modeled core temperature with core temperature from the estimator