Embed Size (px)
Citation preview

MPRAMunich Personal RePEc Archive
Quality Work-Life as predictor toOrganisational Commitment undercontrasting Leadership Styles: I.TResponses from Pakistan’s privatesoftware houses
Riffat Faizan and Nasreen Zehra
ABMS - Open University of Switzerland, Scientific ResearchInstitute of Behavioral Psychology (SRIBP)
28 August 2016
Online at https://mpra.ub.uni-muenchen.de/73973/MPRA Paper No. 73973, posted 24 September 2016 11:03 UTC

Quality Work-Life as predictor to Organisational
Commitment under contrasting Leadership Styles:
I.T Responses from Pakistan's private software
houses
Riffat Faizan
Department of Business and Management, ABMS - Open University of Switzerland, Zurich,
Switzerland, EU
Email: [email protected]
Nasreen Zehra
Department of Research and HR Consultancy - I.T Sector of Karachi, Scientific Research
Institute of Behavioral Psychology (SRIBP), Karachi, PAK
Email: [email protected]
Scientific Research Institute of Behavioural Psychology (SRIBP)

Global Journal of Management and Administration
August 2016, Volume 16, issue 6, version 1.0
Online ISSN: 2249-4588 & Print ISSN: 0975-5853
Quality Work-Life as predictor to Organisational Commitment
under contrasting Leadership Styles: I.T Responses from Pakistan's private
software
By Riffat Faizan & Nasreen Zehra
ABMS Open University Switzerland & Scientific Research Institute of Behavioral
Psychology (SRIBP)
Abstract
This study investigate the dimensions of organisational commitment under transformational
and transactional leadership style while considering the attributes of Quality Work-life
prevailing in Pakistan's private software houses. Theoretical framework is developed by
considering studies commenced in last three decades on similar topic. This study considers
positivist paradigm with objective epistemology, realism ontology, and hyopthetico-
deductive quantitative method to explore the relationship between research variables. The
sample size for study is 408 participants from 10 mega cities of Pakistan through combining
probability and non-probability sampling technique. Self-administered survey questionnaire
was circulated through HR department of targeted firms.
Results showed that transformational leadership has strong significant relationship with all
dimensions of organisational commitment whereas transactional leadership has positive
relationship with affective and continuance commitment. Employees prefer transformational
leadership style and their level of commitment is driven by existing QWL programme.
This paper contributes to expansion of body of knowledge regarding QWL and organisational
commitment under considered leadership styles in developed economies. This paper is unique
in terms of strategic approach such as deductive quantitative approach under scientific
paradigm.
Key words: Quality Work-Life; Transformational Leadership; Transactional Leadership;
Organisational Commitment; Job Satisfaction;

Introduction
I.T sector of Pakistan has gained dramatic boom in recent years. According to the official
statistics of SMEDA Pakistan (2014) after 2008 recession, I.T sector's contribution to GDP
has increased by 13% while in GNP of country, it contributes 9% and the rate is inclining at a
constant rate since last five years. According to Tribune National Newspaper (2015) small
software houses have been consistently contributing to the economy of Pakistan. The survey
have revealed that alone in Karachi, there are over 700 unregistered software houses that are
operating but contributing to the domestic economy of Pakistan. Interestingly a press report
issued by Pakistan Press Foundation (2013) revealed that 63% of I.T sector's contribution
comes from telephone and software firms but despite heavy contribution there are delays in
launching projects such as 3G, 4G, Data base collaboration, etc. One of the reasons for delays
in project is credited to organisational functioning system. There are several other factors
such as political uncertainty, lack of IT universities, high rate of illiteracy, etc however this
research only focuses in the dimension of organisational functioning system to investigate the
relationship between organisational commitment, quality work-life and leadership styles.
The reason behind it is that these software houses offers cheap services and develop projects
for local, international and interlinked MNCs. Despite high contribution there is high
employee turnover evident as 21% employee turnover is shown in the report of Pakistan
Press Foundation in 2013. Since this sector is contributing to the economy of Pakistan, thus it
is essential to evaluate employee’s satisfaction working in these private software houses.
According to Nanjundeswaraswamya and Swamy (2015) the employees' individual needs
must not be overlooked at the expense of technological needs when designing jobs. Thus, it is
essential for the management to design a job that is aligned with the human features
including; satisfying them, their work and workplace environment (Nanjundeswaraswamya &
Swamy, 2015). Therefore, it is vital to construct job in a manner that it fulfils both; human as
well technological needs.
The above argument emphasis that nowadays it is essential to enrich job design by moving
away from traditional job designs where only organisational need was determine through
effective and efficient use of technology. In other words, Quality of Work-Life (QWL)
should be the focus of the organisations in modern era. The concept means developing an
organisational support system that enables management to deal with their workforce as not
just workers but resources to facilitate them in demonstrating high level of performance.

Moreover, employee participation, interpersonal relationship, empowerment, autonomy etc
are new interventions to concept and scope of QWL by transforming from socio-technical
system to versatile programme used to improve employees' commitment and work life
experiences. The quality of workers tends to increase due to these features of QWL as it tends
to improve their involvement in job at workplace.
The organisational commitment include; affective, normative, and continuance commitment
(Mowday et al., 1982; Allen and Meyer, 2001; Haque & Yamoah, 2014). The idea of
developing organisational commitment among workers is to ensure that they work for
attainment of organisational goal and remain motivated and directed to it. However, the
organisational commitment is not just developed through organisational support system but
there is a need of proper leadership at the organisation. Now it is vital to understand the
concept of leadership before emphasising on its significance in creating organisational
commitment. Leaders who are effective are individuals having the ability to influence and
inspire others in certain ways to accomplish desired goals. The organisational performance
and organisational commitment of employees are affected by various types of leadership
styles (Nahavandi, 2006; Nanjundeswaraswamya & Swamy, 2015). According to Yair et al.,
(2003), employees overall satisfaction and job related satisfaction is strongly predicted by
transformational leadership style. Interestingly, Ogbonna and Harris (2002) argued that
innovative and competitive culture significantly influences the organisational performances
to large extent. In other words, organisational culture has an impact on the organisational
performance whereas, leadership style influenced the organizational Culture and thus
organisational performance is influenced by leadership style in organisational setting.
Aim
Aim of this study is to increase understanding about linkage of leadership styles with QWL
and Organisational commitment of employees in the I.T sector of Pakistan. In addition,,
investigating the relationship between leadership styles and QWL and organisational
commitment respectively. Hence, in order to examine the relationship between variables, we
undertake transformational and transactional leadership style based on the findings of Haque
et al., (2015) to take that research further by exploring the elements of QWL and dimensions
of organisational commitment.
Hypotheses

Following are the hypotheses:
H1: QWL of employees is not significantly influenced by transformational leadership style.
H1': QWL of employees is significantly influenced by transformational leadership style.
H2: QWL of employees is not significantly influenced by transactional leadership style.
H2': QWL of employees is significantly influenced by transactional leadership style.
H3: Organisational commitment (affective commitment, normative commitment, and
continuance commitment) of employees is not significantly affected by transformational
leadership style.
H3': Organisational commitment (affective commitment, normative commitment, and
continuance commitment) of employees is significantly affected by transformational
leadership style.
H4: Organisational commitment (affective commitment, normative commitment, and
continuance commitment) of employees is not significantly affected by transactional
leadership style.
H4': Organisational commitment (affective commitment, normative commitment, and
continuance commitment) of employees is significantly affected by transactional leadership
style.
Literature Review
Quality of Work Life
Hackman and Oldham (1980) described QWL as the favorable working environment that
supports and promoted satisfaction by providing employees with rewards, job security and
career growth opportunities. The work environment enables to fulfill employees’ personal
needs is considered as an important factor to provide a positive interaction effect, which will
lead to an excellent QWL. Cunningham and Eberle (1990) emphasized that the personal
needs are satisfied when rewards from the organization, such as compensation, promotion,
recognition and development meet their expectations. The elements that are relevant to an
individual’s QWL include the task, the physical and social work environment within the
organization, organizational system and relationship between life on and off the job. Chan

and Einstein (1990) explained QWL reflects as a concern for people’s experience at work,
their relationship with other people, their work setting and their effectiveness on the job.
European Foundation for the Improvement of Living Conditions 2002 described that the
QWL is a multidimensional construct, made up of a number of interrelated factors that need
careful consideration to conceptualize and measure. QWL is associated with job satisfaction,
job involvement, motivation, productivity, health, safety, job security, competence
development and balance between work and nonwork life. Quality of work life is a process
by which an organization responds to employee needs for developing mechanisms to allow
them to share fully in making the decisions that design their lives at work. Saraji and Dargahi
(2006) study explained QWL as a comprehensive, department wide program designated to
improve employee satisfaction, strengthening workplace learning and helping employees had
better manage, change and transition by conducting descriptive and analytical study. QWL
programs will benefit both employees and management, by mutually solving work related
problems, building cooperation, improving work environments, restructuring tasks carefully
and fairly managing human resource outcomes and payoffs according to the study of Rose et
al. (2006).
According to Rethinam and Ismail (2007), QWL is a multi-dimensional construct, made up
of a number of interrelated factors that need careful consideration to conceptualize and
measure. It is associated with job satisfaction, job involvement, motivation, productivity,
health, safety and well-being, job security, competence development and balance between
work and non-work life and also he concluded as QWL from the perspective of IT
professionals is challenging both to the individuals and organizations. However, from the
literature it can be summarized that QWL may be viewed as a wide-ranging concept, which
includes satisfaction towards work, participative management and improve work
environment. It is evident from the available literature, there is very less research work has
been undertaken in SMEs area. Based on the available literature important Nine Quality of
Work Life components are considered for the present research, they are: Work environment,
Organization culture and climate, Relation and cooperation, Training and development,
Compensation and Rewards, Facilities, Job satisfaction and Job security, Autonomy of work,
Adequacy of resources, which are more appropriate for Pakistani private software houses in
I.T sector.
QWL model is undertaken in this study however it is determined under organisational
support programme. This organisational support program include; Job security, work
environment, T&D, Compensation and reward, Organisational culture, work related facilities
and resources, interpersonal relationship, and autonomy of work.
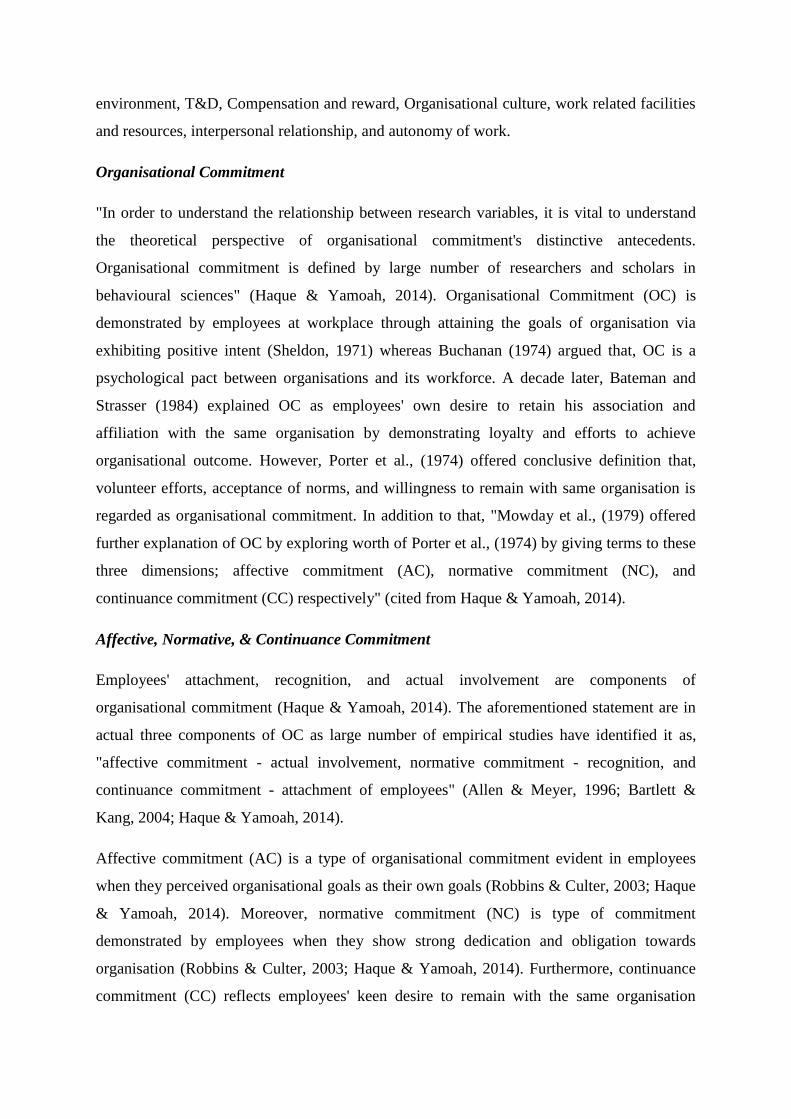
Organisational Commitment
"In order to understand the relationship between research variables, it is vital to understand
the theoretical perspective of organisational commitment's distinctive antecedents.
Organisational commitment is defined by large number of researchers and scholars in
behavioural sciences" (Haque & Yamoah, 2014). Organisational Commitment (OC) is
demonstrated by employees at workplace through attaining the goals of organisation via
exhibiting positive intent (Sheldon, 1971) whereas Buchanan (1974) argued that, OC is a
psychological pact between organisations and its workforce. A decade later, Bateman and
Strasser (1984) explained OC as employees' own desire to retain his association and
affiliation with the same organisation by demonstrating loyalty and efforts to achieve
organisational outcome. However, Porter et al., (1974) offered conclusive definition that,
volunteer efforts, acceptance of norms, and willingness to remain with same organisation is
regarded as organisational commitment. In addition to that, "Mowday et al., (1979) offered
further explanation of OC by exploring worth of Porter et al., (1974) by giving terms to these
three dimensions; affective commitment (AC), normative commitment (NC), and
continuance commitment (CC) respectively" (cited from Haque & Yamoah, 2014).
Affective, Normative, & Continuance Commitment
Employees' attachment, recognition, and actual involvement are components of
organisational commitment (Haque & Yamoah, 2014). The aforementioned statement are in
actual three components of OC as large number of empirical studies have identified it as,
"affective commitment - actual involvement, normative commitment - recognition, and
continuance commitment - attachment of employees" (Allen & Meyer, 1996; Bartlett &
Kang, 2004; Haque & Yamoah, 2014).
Affective commitment (AC) is a type of organisational commitment evident in employees
when they perceived organisational goals as their own goals (Robbins & Culter, 2003; Haque
& Yamoah, 2014). Moreover, normative commitment (NC) is type of commitment
demonstrated by employees when they show strong dedication and obligation towards
organisation (Robbins & Culter, 2003; Haque & Yamoah, 2014). Furthermore, continuance
commitment (CC) reflects employees' keen desire to remain with the same organisation

(ibid). Now that, all three antecedents of OC have been understood, there is a need to
evaluate it in relations with leadership style existing in Pakistan's I.T sector. Interestingly, the
previous work of Haque et al., (2015) showed that female employees are motivated to
perform well under transformational leadership style however the organisational commitment
and QWL is still not explored in depth to generalize results. Moreover, the large number of
studies is carried out in Western part of world thus this study examines the relationship in
eastern context. In other words, there is a gap in literature that the previous findings are more
generalised to western style of leadership and companies whereas both QWL and OC needs
to be examined in relation with leadership styles in Eastern part of the world.
Leadership Styles
Leadership is a social influence process in which the leader seeks the voluntary participation
of subordinates in an effort to reach organization goals (Omolayo, 2007). Today’s
organizations need effective leaders who understand the complexities of the rapidly changing
global environment. If the task is highly structured and the leader has good relationship with
the employees, effectiveness will be high on the part of the employees (Smith, 1998). Smith’s
study further revealed that democratic leaders take great care to involve all members of the
team in discussion, and can work with a small but highly motivated team. Barchiesi and La
Bella (2007) measures the leadership effectiveness, leadership role and its influence on
performance, leadership behaviors and attitudes. It was found that high leadership indexes are
not related to past performance records, but it is associated with higher potentiality of
enhanced performance and higher reputation of organization pointing in the direction of a
meaningful influence of behavioral complexity and dynamics on the leadership perceived
level. Voonl et al. (2011) used the factors like salaries, job autonomy, job security, workplace
flexibility to investigate the relationship between leadership styles and employee job
satisfaction, study revealed that transformational leadership style has a stronger relationship
with job satisfaction.
Fang et al. (2009) identified that leadership style can affect organizational commitment, job
satisfaction positively and job satisfaction intern can affect organizational commitment and
performance. Leadership is largely culturally orientated, embracing traditional beliefs, norms
and values, and a preoccupation (Prideaux & Be, 2007). According to Victor and Soutar
(2005), leadership style is significantly influenced by the leader’s immediate and extended

family, clan, and tribe. This study finds the linkages between organizational leadership and
business ethics, thereby making a contribution toward increasing the quality of organizational
life which may have a positive influence on both members of the organization and the wider
community. Ye et al. (2011) explained that employees’ perceptions about transactional or
transformational leadership style of executive, both have highly positive correlation with
perceptions about executive’s encouragement factors of its innovation climate. According to
Podsakoff et al. (1990), leadership behavior can affect trust and satisfaction of employees to
organization and organizational citizenship behavior, further enhances the relationship
between leadership style and organizational commitment directly. Mc Neese-Smith D (1995)
explained how leadership behavior of hospital directors significantly positively and related to
productivity, work satisfaction and organizational commitment of staff. Transactional
leadership is considered as the subordinates’ rewards though their efforts and performance.
Wang (2008) compared the Transactional leadership, Transformational leadership theory is
deemed to improve the subordinates’ performance by changing the motives and values of
employees. Bernard et al. (1990) divided leadership style into transformational leadership and
transactional leadership. Transformational leadership has the characteristics of individual
influence, spiritual encouragement and intellectual stimulation. They often take individual
into consideration, establish vision and aim inside, create open culture, trust the staff to reach
their goals and give full play for staff's potential. Transactional leadership is focused on
staff’s basic and external demand, the relationship between leaders and subordinates is based
on the contract. They tend to attain organizational goal by pacific job roles and mission
design, their basic purpose is to maintain a stable organization. However from the available
literature it can summarize the different types of leadership styles and their effect on
employee satisfaction, team work, organizational change and employee performance. From
the literature review it is identified that these styles need to be evaluated with respect to the
components of Quality of Work Life and organisational commitment, which are more
appropriate for I.T Firms in Pakistan.
Research Methodology
Research Paradigm and Philosophy
Research paradigm indicates intent, choice, and motivation of researcher by following a
pattern associated with concepts and assumption through logical sequence of attaining
knowledge and interpreting it (MacKenzie & Knipe, 2006). Mack (2010) explained paradigm

is resultant of three main attributes including; ontology, epistemology, and methodology
respectively. In this research we followed Mack (2010) explanation of paradigm for
determining present research framework. Moreover, Easterby-Smith et al., (2015) identified
positivist/scientific paradigm that consider quantitative methods whereas socio-
anthropological paradigm follows qualitative methods. This research comes under
scientific/positivist paradigm due to quantitative nature.
The ontology for present study is "realism" as from the theoretical framework it has been
confirmed that relationship between QWL, organisational commitment and style of
leadership exist thus ontological stance is "reality exist out there in business world".
Moreover, the epistemology is "objective" because the body of knowledge is extracted
directly from the subjects in objective manner. Additionally, deductive approach is used to
commence quantitative research in collecting and sorting data thus methodology include
adoption if quantitative methods so that findings are supported through numerical
significance. After careful determination of ontological, epistemological stance, and
methodology we explored the axiological view by considering the criterion of inclusion of
private business sector functioning in various cities of Pakistan. Additionally, the axiology
also includes the notion that QWL's attribute play significant role in developing and
strengthening organisational commitment. Furthermore, specific style of leadership
determines the organisational commitment of workforce.
According to Sekaran & Bougie (2012) explained research philosophy as the basic
foundation to construct and follow research design and approach in commencing research.
On the other hand, Saunders et al., (2012) argued that research philosophy is the first layer of
research onion serving the basic construct to lay research strategy. Considering, positivist
paradigm, this study follows "positivist research philosophy" due to nature and approach of
research.
Research Design and Approach
Longitudinal study takes more than year while cross-sectional study design tends to complete
within one year (Sekaran & Bougie, 2012). In this study, researchers opted for cross-sectional
research design as the study completed in less than year. Additionally, deductive approach is
study in which data is deduced to reach conclusion by testing hypotheses constructed at the
start of research and inductive approach induce data to reach conclusion (Sekaran & Bougie,
2012). In present study, researchers used hypothetico-deductive model to commence this

research. Since, the approach was deductive therefore hypotheses were established in the start
of research through theoretical framework in order to investigate the relationship between
research variables.
Nature and Type of Research
The nature of present study is exploratory because this study attempts to explore the nature of
relationship between variables at hand. Since, this research is based on the assumption to
expand the body of knowledge about research variables existing in organisational setting
therefore it is "basic" type of research. Moreover, the research is causal-effect as it seeks to
investigate the causes and effects among research variables.
Sample size and technique
Sample is subset of population (Sekaran & Bougie, 2012). Since, it is difficult to include
entire population therefore sample set is considered to study and generalise findings to
population as sample is representative of population (Bryman, 2013). Thus, it is essential to
determine the appropriate sample set. To determine sample size, we used statistical formula
explained by Charan and Biswas (2013).
n =
m
1 + m - 1
N
n=Sample size
N=Population size
m =
z=1.64 for 90% confidence level
P=Preliminary estimate of percentage (90%)
E=Accuracy desired (10%)
Sample Size =
Sample Size =
Sample Size = 242.06
[
[
]
Z² ×P × (1 - P)
Ɛ²
[1.64² × 0.90 × (1-0.90)]
0.01²
2.6896 × 0.90 × (1 - 0.90)
0.0001
0.24206
0.0001

Sample Size = 242
For this m value and the population size = 785 (registered software houses with SMEDA
Pakistan), and the sample size "n" is determined through earlier mentioned formula.
n =
n = 184.9
n = 185 (round figure)
Therefore, the minimum sample size required for this study is 185 private software houses
operating in Pakistan. Moreover, through preliminary research, it is confirmed that in each
targeted city of Pakistan there are 20 on average private software houses working thus 11
were minimum number of firms targeted as it constitute 55% representation. This was done
to ensure more than 50% of firms are at least targeted from all cities of Pakistan.
Approximately 200 software houses were approached and 189 responded while 11 did not
participated however it was ensured that on average 2 participants are included from each
organisation. According to Waliman (2001) probability and non-probability are two basic
types of sampling techniques. Moreover, Sekaran & Bougie (2012) explained that in
probability sampling each event has equal chance of selection while in non-probability
sampling technique each event's selection chances are unequal. The researchers have
combined various probability and non-probability (sampling technique) to reach targeted
audience. Purposive, stratified, snowball, and convenience sampling is combined to reach
targeted audience.
Data Collection
Data collection include primary source of extraction directly from respondents at first hand.
Self-administered survey questionnaire developed through TYPEFORM was used to collect
information. Through HR department of each targeted firm was contacted through email by
informing them about the purpose of research. With the consent of HR department, survey
was circulated. The data collection process was from February 2016 to May 2016. Highest
rate of response came from Karachi, Lahore, and Islamabad due to high private software
houses operating in these business-hub cities.
242
1 +
242 - 1
785

Data Analysis Tool
Since, this is quantitative research thus researchers used SPSS 23.0 for analysis of data. Data
were coded and entered to SPSS (23.0) software to generate and quantify findings. The
reason for opting to SPSS is because it is cost-effective in quantitative research. According to
Prabhakar (2008) in social science researches, SPSS is cost-effective and user-friendly
software package. Through 5 point Likert scale, responses related to QWL and organisational
commitment under transactional and transformational leadership was examined. Through
correlation and regression, the significance of relationship is measured and model summary,
co-efficient standardised beta along with ANOVA containing R², β, and F to reflect the
variation, strength, and acceptance of results.
Ethics, Reliability, Validity, and Credibility
According to Guillemin & Gillan (2004), ethical concerns and dilemmas are often faced by
researchers during research phase. Since, this study involved humans therefore ethical
considerations were made because any study involving human must maintain ethical
standards to avoid long-term consequences. Since, HR department of targeted firms were
informed about the purpose of research and each participant was prior to participation in
research. Furthermore, participants were ensured that information shared by them will be kept
confidential and information will only be used for academic purpose. Additionally, Mizayaki
& Taylor (2008) stated that when researcher comes in direct contact with participants there
are chances of biased responses. In order to avoid it, researchers used HR department so that
no direct involvement creating biased responses emerge.
For the purpose of validity, researchers opted for 'content validity' by using the content of an
instrument's appropriateness during and prior to research process. Adequate measures were
considered by researchers to measure questions and flow of the question's structure is
appropriately maintained. Moreover, in order to ensure credibility aspect is maintained,
researchers considered all similar type of organisations and out of selected organisation,
opted for organisations that were linked with the nature of the study. Furthermore, objective
of study, research instruments' copies along with cover letter explaining research purpose
were sent to targeted organisations. Once permission was granted, HR department was
approached to administer research instrument on behalf of researchers.
However, researchers could have used the Cornbach's alpha to measure the reliability of
items in a questionnaire but since researchers adapted the scales used by early researchers

such as Allen & Meyer, (1991); Bass and Avolio (1994) Full Range MLQ Model and WMS;
Haque and Yamoah (2014) OSP model self-reported questionnaire for organisational
commitment, transformational and transactional leadership, and QWL by considering 27-item
reflecting that researchers used 'test-retest reliability' approach by measuring the consistency
of items measured and evaluated over time again.
Findings and Discussions
To explore the relationship between QWL among the employees of I.T software houses in
Pakistan, the QWL mean score of employees for every single organisation was determined.
In addition, the organisation's QWL was categorised through total grand mean score formed
by all organisations. Thus, through comparison approach, mean score of each software house
in every considered city of Pakistan was compared against grand mean and based on that two
groups were formed, "satisfied group" and "not satisfied group" respectively based on QWL
score. To further explain the comparative approach, QWL mean score was taken as par value
and software houses scoring overall mean more than QWL mean score were categorised as
satisfied group while software houses scoring overall mean lower than QWL mean score
were put into not satisfied group. Additionally, both groups were ranged on (1-to-5) point
scale on two intervals to determine the level of Quality Work-Life.
In each city of Pakistan, the total frequency of respondents' choice is summarised below in
Table 1, reflecting the mean score for each city by classifying them under either group QWL
satisfied or QWL not satisfied.
Case Processing Summary
City * QWL
Cases
Valid Missing Total
N Percent N Percent N Percent
408 100.0% 0 0.0% 408 100.0%
Table1: Total frequency cases and percentages.
Frequency of level of satisfaction in cities of Pakistan
City * QWL in Software houses
Total Satisfied not satisfied
City Faisalabad 12 6 18
Gujranwala 15 2 17
Hyderabad 16 4 20
Islamabad 44 12 56
Karachi 98 36 134

Lahore 69 29 98
Multan 15 2 17
Peshawar 15 3 18
Rawalpindi 11 6 17
Sialkot 11 2 13
Total 306 102 408
Table 2: Frequency of employees in cities indicating level of satisfaction related to QWL.
The overall Quality Work-Life in Software houses in Pakistan
Frequency Percent Valid Percent
Cumulative
Percent
Valid Satisfied 306 75.0 75.0 75.0
not satisfied 102 25.0 25.0 100.0
Total 408 100.0 100.0
Table 3: Percentage frequency of overall software houses level of satisfaction regarding
QWL.
The above analysis showed that 306 employees working in private software houses (75%) are
satisfied with QWL whereas remaining 106 employees (25%) are not satisfied with existing
QWL in this survey. Moreover, in terms of cities of Pakistan, software houses in Karachi
have highest frequency (134), followed by Lahore (98), and Islamabad (56).
Leadership styles in Software houses
Two basic styles of leadership in this study include; transformational and transactional
leadership respectively. The only two styles of leadership was based on preliminary research
showing that transformational and transactional leadership styles are most widely evident in
the software houses of Pakistan. Thus, employees' perspective was explored by asking them
in survey 4 each set of questions related to both styles of leadership in order to attain their
opinion regarding existing style of leadership in their respective organisations. The type of
leadership style was determined through mean scores attained through testing set of
interlinked variables based on 5 point LIKERT scale.
City wise employees' preferred leadership style
Frequency Percent Valid Percent
Cumulative
Percent
Valid Faisalabad 18 4.4 4.4 4.4
Gujranwala 17 4.2 4.2 8.6
Hyderabad 20 4.9 4.9 13.5
Islamabad 56 13.7 13.7 27.2

Karachi 134 32.8 32.8 60.0
Lahore 98 24.0 24.0 84.1
Multan 17 4.2 4.2 88.2
Peshawar 18 4.4 4.4 92.6
Rawalpindi 17 4.2 4.2 96.8
Sialkot 13 3.2 3.2 100.0
Total 408 100.0 100.0
Table 4: Employees preferred leadership style in different cities of Pakistan
Type of Leadership style preferred by employees in Pakistan's private software houses.
Frequency Percent Valid Percent
Cumulative
Percent
Valid Transactional 174 42.6 42.6 42.6
Transformational 234 57.4 57.4 100.0
Total 408 100.0 100.0
Table 5: Preferred leadership style in Pakistan's software houses.
From Table 4 it is evident that in sequential order Karachi, Lahore, and Islamabad have high
frequency. Interestingly, in all three cities transformational leadership is more preferred style
of leadership among workforce. Moreover, the preferred leadership style in Pakistan's
software houses in this study "transformational leadership" is more preferred with 57.4%
whereas "transactional leadership" has been considered by 42.6% (Table 5).
Leadership styles and Type of Organisational Commitment
Descriptive Statistics
Mean Std. Deviation N
Transactional Leader. 2.08 1.180 408
AC 11.4167 2.35288 408
NC 11.6422 2.35736 408
CC 10.8676 2.42049 408
Table 6: Descriptive statistic is reflecting mean value and standard deviation for antecedents
of organisational commitment.
The descriptive statistic showed that Mean value of all three attributes of organisational
commitment (AC, NC, & CC) is approximately close to each other and interestingly all three
attributes standard deviations are close in numeric expression confirming that all items are
consistent on scale.
Correlations

Transactional
Leader. AC NC CC
Transactional Leader. Pearson Correlation 1 .247** -.163** .775**
Sig. (2-tailed) .000 .125 .000
N 408 408 408 408
AC Pearson Correlation .247** 1 .742** .589**
Sig. (2-tailed) .000 .000 .000
N 408 408 408 408
NC Pearson Correlation -.163** .742** 1 .563**
Sig. (2-tailed) .125 .000 .000
N 408 408 408 408
CC Pearson Correlation .775** .589** .563** 1
Sig. (2-tailed) .000 .000 .000
N 408 408 408 408
**. Correlation is significant at the 0.01 level (2-tailed).
Table 7: Correlation between transactional leadership style and types of organisational
commitment
Transactional leadership style has positive correlation with affective commitment as sig value
is lesser than alpha value at 90% confidence level (P=0.000 < 0.01). Thus, null hypothesis is
rejected that employees' affective commitment is not significantly affected by transactional
leadership style. However, the relationship established above is positive but this is weak as
r=.247 is derived value indicating that it is below moderate par value (0.5). Moreover, there is
weak negative relationship between transactional leadership style and normative commitment
of employees in the I.T sectors of Pakistan. Moreover, the correlation is negative as sig value
is greater than alpha value at 90% confidence level (P=0.125 > 0.01). Since, P value is
greater than alpha value therefore we do not reject null hypothesis that normative
commitment of employees are not significantly affected by transactional leadership style.
Interestingly, the statistical test showed that there is strong positive correlation between
transactional leadership style and continuance commitment of employees in I.T sector of
Pakistan as r=0.775 which is moderately strong and positive. The P value is 0.000 which is
lesser than alpha value 0.01 indicating that null hypothesis is rejected (P=0.000 < 0.01). In
other words, the continuance commitment of employees is significantly affected by
transactional leadership.
Thus, it can be concluded from the analysis that, transactional leadership has positive
correlation with affective commitment and continuance commitment whereas it has weak
correlation with normative commitment in this study. Moreover, in this study, normative

commitment is not significantly affected by transactional leadership style whereas both;
affective commitment and normative commitment are significantly affected by transactional
leadership style. Interestingly, despite correlation is established it is evident that only
continuance commitment has strong relationship with transactional leadership style. Affective
commitment has positive but weak while normative commitment has negative weak
relationship with transactional leadership.
Model Summary
Model R
R
Square
Adjusted R
Square
Std. Error
of the
Estimate
Change Statistics
R Square
Change
F
Change df1 df2
Sig. F
Change
1 .607a .368 .363 .942 .368 78.388 3 404 .000
a. Predictors: (Constant), CC, NC, AC
Table 8: Model Summary reflecting R and R² value for variation
ANOVAa
Model Sum of Squares df Mean Square F Sig.
1 Regression 208.674 3 69.558 78.388 .000b
Residual 358.492 404 .887
Total 567.167 407
a. Dependent Variable: Transactional Leader.
b. Predictors: (Constant), CC, NC, AC
Table 9: ANOVA model reflecting F value for acceptability purpose
The model summary above showed that R² is approximately 0.368 indicating that 36.8%
variation in transactional leadership behaviour is due to variation in affective, normative, and
continuance commitment of employees working under them. Furthermore, ANOVA model
reflected that F=78.388 means that explanatory power is 78% thus making it highly
acceptable.
Coefficientsa
Model
Unstandardized
Coefficients
Standardized
Coefficients
T Sig.
95.0% Confidence Interval
for B
B Std. Error Beta
Lower
Bound
Upper
Bound
1 (Constant) .298 .251 1.185 .237 -.196 .792
AC .005 .031 .011 .173 .000 -.056 .067
NC -.121 .030 -.241 -3.978 .125 -.181 -.061

CC .317 .023 .704 13.991 .000 .273 .362
a. Dependent Variable: Transactional Leader.
Table 10: Coefficients of Items.
Three items are considered in coefficient table and in the above table standardized coefficient
Beta Values are undertaken to measure the affect of variables on transactional leadership
style. The regression analysis revealed that affective commitment affects leadership 0.11
positively when there is 1 standard deviation increase in affective commitment. Additionally,
sig value is 0.000 lesser than alpha value (P=0.000 < α=0.01) thus confirming that there is
sufficient evidence against the null hypothesis that transactional leadership is not affected by
affective commitment. Moving further, it is evident that normative commitment influenced
transactional leadership 0.241 negatively due to increase in standard deviation by 1.
Moreover, P=0.125 is greater than α = 0.01 indicating that there is no strong evidence against
null hypothesis stating normative commitment affects transactional leadership. In other
words, we reject null hypothesis that transactional leadership is affected by normative
commitment of employees. Lastly, regression table confirmed that, transactional leadership is
affected by 0.704 positively due to variation in continuance commitment. In addition to that,
the transactional leadership is affected 0.704 when 1 standard deviation increased is evident
in continuance commitment of employees. Furthermore, P=0.000 is less than α = 0.01
therefore there is strong evidence against the null hypothesis that transactional leadership is
not significantly linked with continuance commitment of employees.
Descriptive Statistics
Mean Std. Deviation N
Transformational Leadership 2.137 1.1415 408
AC 11.4167 2.35288 408
NC 11.6422 2.35736 408
CC 10.8676 2.42049 408
Table 12: Descriptive statistic demonstrating antecedents of organisational commitment
linked with transformational leadership
Interestingly, transformational leadership's mean value is higher in comparison to
transactional leadership. Moreover, standard deviation is slightly higher than transactional
leadership. Additionally, the mean and standard deviation for dimensions of organisational
commitment is same.

Correlations
Transformational
Leadership AC NC CC
Transformational Leadership Pearson Correlation 1 .618** .479** .878**
Sig. (2-tailed) .000 .000 .000
N 408 408 408 408
AC Pearson Correlation .618** 1 .742** .589**
Sig. (2-tailed) .000 .000 .000
N 408 408 408 408
NC Pearson Correlation .479** .742** 1 .563**
Sig. (2-tailed) .000 .000 .000
N 408 408 408 408
CC Pearson Correlation .878** .589** .563** 1
Sig. (2-tailed) .000 .000 .000
N 408 408 408 408
**. Correlation is significant at the 0.01 level (2-tailed).
Table 12: Correlation between transformational leadership and organisational commitment
Considering 90% confidence level, the correlation between transformational leadership and
organisational commitment's antecedents is evaluated and results showed that,
transformational leadership has positive relationship with all three attributes of organisational
commitment; affective commitment, normative commitment, and continuance commitment
respectively. Transformational leadership is positively associated with affective commitment
as r=.618 reflecting that there is moderate positive relationship. Moreover, the P value=0.000
lesser than α=0.01 therefore in present study strong evidence is available to reject null
hypothesis that employees' affective commitment is not significantly affected by
transformational leadership. As (P=0.000 < α=0.01) is evident thus this study confirms that
affective commitment of employees is linked with transformational leadership in Pakistan's
I.T sector.
Furthermore, transformational leadership has moderate positive relationship with normative
commitment as confirmed by r=0.489 value driven from statistical test. In addition to that, P
value=0.000 is greater than α=0.01 (P=0.000 < α=0.01) thus we reject null hypothesis. In
other words, there is strong evidence against null hypothesis that normative commitment of
employees is not affected by transformational leadership. Moreover, for linkage between
transformational leadership and continuance commitment at 90% confidence interval the
derived value r=.878 indicating there is strong positive correlation between them.

Furthermore, the P value is lesser than α value (P=0.000 < α=0.01) reflecting that we reject
null hypothesis. In other words, there is strong evidence against null hypothesis stating that
continuance commitment of employees is not significantly affected by transformational
leadership in this study.
From the above test results, it is confirmed that transformational leadership has positive
relationship with all antecedents of organisational commitment; affective commitment,
normative commitment, and continuance commitment. Additionally, there is strong evidence
from statistical test confirming that transformational leadership is significantly associated
with affective, normative, and continuance commitment of employees. Moreover, the results
showed that in comparison to transactional leadership, transformational leadership is more
strongly associated with the organisational commitment of employees.
Model Summary
Model R
R
Square
Adjusted R
Square
Std. Error
of the
Estimate
Change Statistics
R Square
Change
F
Change df1 df2
Sig. F
Change
1 .491a .241 .235 .9982 .241 42.754 3 404 .000
a. Predictors: (Constant), CC, NC, AC
Table 13: Model summary for transformational leadership and organisational commitment
predicting R²
ANOVAa
Model Sum of Squares df Mean Square F Sig.
1 Regression 127.792 3 42.597 82.754 .000b
Residual 402.521 404 .996
Total 530.314 407
a. Dependent Variable: Transformational Leadership
b. Predictors: (Constant), CC, NC, AC
Table 14: ANOVA table reflecting F value for high acceptability
The above two tables reflect the variation and explanatory power related to items in this
study. Since, R² is 0.241 reflecting that 24.1% variation in transformational leadership is due
to change in organisational commitment; affective commitment, normative commitment, and
continuance commitment in this study. Interestingly, transformational leadership has low R²
in comparison to transactional leadership despite having strong positive correlation with
antecedents of organisational commitment. This is a significant development in this study

that though R² (variation) in transformational leadership is low comparing to transactional
leader but the correlation is strong and positive among antecedents of organisational
commitment with transformational leadership. Moreover, ANOVA model reflected F=82.754
indicating that 82.75% is explanatory power therefore the variation of items and correlation is
highly acceptable.
Coefficientsa
Model
Unstandardized
Coefficients
Standardized
Coefficients
t Sig.
95.0% Confidence Interval
for B
B Std. Error Beta
Lower
Bound
Upper
Bound
1 (Constant) .524 .266 1.969 .050 .001 1.048
AC -.008 .033 -.016 -.231 .000 -.072 .057
NC -.060 .032 -.123 -1.854 .000 -.123 .004
CC .243 .024 .557 10.099 .000 .195 .290
a. Dependent Variable: Transformational Leadership
Table 15: Coefficient of items and Beta Value explaining variation in research variables
The above table reflects standardized coefficient Beta indicating the impact of
transformational leadership on affective commitment, normative commitment, and
continuance commitment. Interestingly, regression analysis showed that transformational
leadership is affected 0.16 negatively by 1 standard deviation in affective commitment of
employees. Furthermore, sig value is lower than alpha value (P=0.000 < α=0.01). Hence,
there is strong evidence that against null hypothesis; affective commitment of employees is
not significantly affected by transformational leadership.
Moreover, 0.123 negatively variation is evident in transformational leadership when there is 1
standard deviation increase in the normative commitment of employees. Additionally, sig
value is less than alpha value (P=0.000 < α=0.01) therefore we reject null hypothesis of
normative commitment is not significantly affected by transformational leadership style in
Pakistan's I.T sector. Lastly, standardized coefficient showed that transformational leadership
is affected by continuance commitment of employees by 0.557 positively when there is 1
standard deviation increase in the level of continuance commitment. Since, sig value=0.000 is
lesser than alpha value=0.01 confirming (P=0.000 < α=0.01) therefore we reject null
hypothesis that continuance commitment of employees are not significantly affected by
transformational leadership style.
Quality of Work-Life and style of Leadership:

QWL level of Satisfaction under Leadership styles
Transactional
Leadership Percent
Transformational
Leadership Percent
Valid Satisfied 173 42.4 235 57.6
not satisfied 235 57.6 173 42.4
Total 408 100.0 408 100.0
Table 16: Level of satisfaction for QWL under Leadership style
Earlier, it was evident that level of satisfaction regarding Quality of Work-Life was
established. Now, moving forward under two considered styles of leadership; transactional
and transformational leadership respectively the level of satisfaction is explored. Test showed
that QWL by employees under transformational leadership is high (57.4%) in comparison to
transactional leadership style (42.6%). Thus, this survey found that employees' QWL is more
satisfied under transformational leadership in Pakistan's private software houses.
Attributes of QWL and Satisfaction percentage under Leadership styles
Model
Transactional Leadership Transformational Leadership
Satisfied
Not
Satisfied
Satisfaction
percentage Satisfied
Not
Satisfied
Satisfaction
percentage
Work Environment 44 61 25.4 61 44 25.9
Organization
Culture & Climate 17 37 9.8 37 17 15.7
Relation &
Cooperation 15 41 8.6 41 15 17.4
T&D 21 23 12.1 23 21 9.7
Compensation &
Rewards 31 13 17.9 13 31 5.5
Facilities 11 17 6.3 17 11 7.2
Job Satisfaction 9 28 5.2 28 9 11.9
Job Security 25 15 14.4 15 25 6.8
Table 17: Individual attributes' satisfaction percentage for QWL under Leadership style
173 employees were satisfied under transactional leadership style whereas 235 employees
under transformational leadership style. Based on the findings, through filter programming
each attribute of QWL considered in this study was measured in terms of frequency and
percentage. The above table is constructed to explain highest frequency and percentage of
each attribute reflecting satisfaction percentage under considered leadership style.
Interestingly, under transactional leadership highest frequency is formed by work
environment (QWL Attribute) indicating 25.4%, followed by Compensation and Rewards

(17.9%), Job Security (14.4%0, and T&D (12.1%) whereas all other attributes scored below
10%.
On the other hand, under transformational leadership style highest frequency is again
constituted by Work environment (25.9%), followed by Relation and Cooperation (17.4%),
Organization culture and climate (15.7%) and Job Satisfaction (11.9%). All other variables of
QWL scored below 10%. Interestingly, there is variation in variables as some of attributes
have been evident to be more effective under certain type of leadership. For instance,
organization culture and climate has been preferred by employees working under
transformational leadership whereas compensation and reward is not preferred under
transformational leadership. Moreover, job satisfaction is evident high among employees
under transformational leadership whereas job security is high under transactional leadership
style. However, it can be concluded that overall existing QWL of employees is good under
transformational leadership in contrast to transactional leadership style.
The findings revealed that QWL is strong predictor in creating organisational commitment
among the employees in the private software houses operating in Pakistan. Interestingly, the
study also evident that both transactional leadership as well transformational leadership plays
visible role in developing organisational commitment of employees however there exist
variation in both; QWL and organisational commitment under the considered leadership
styles. Additionally, transformational leadership is more preferred style in contrast to
transactional leadership as it is more positively linked with all three attributes of
organisational commitment; AC, NC, and CC respectively. Transactional leadership style has
positive correlation with AC and CC whereas negative relationship with NC. Moreover,
affective and normative commitment of employees is significantly affected by transactional
leader whereas normative commitment is not influenced by transactional leadership style.
Furthermore, continuance commitment of employees is most strongly influenced under
transactional leadership style. Interestingly, continuance commitment is also strongly evident
under transformational leadership style.
The elements of QWL considered in this study is also are evident to be creating a satisfaction
among the workforce under transformational leaders (57.4%) in contrast to transactional
leaders (42.4%). However, there has been a variation in some of the attributes in terms of
percentages but to large extent employees are more satisfied with the existing QWL under
transformational leadership. Thus, it is confirmed that most preferred and practiced style of
leadership in private sectors is "transformational leadership".

The present study support partially the work of Hackman and Oldham (1980) regarding QWL
creating the pleasant environment for employees however further findings oppose the work of
Hackman and Oldham (1980) that QWL helps in promotion and career growth. Particularly,
considering specific style of leadership it can be state that QWL's support for employees
relies upon the style of leadership. Additionally, under transformational leadership, QWL is
more effective in creating organisational commitment of employees.
This study strongly support the findings of Saraji and Dargahi (2006) stating that study
commitment and satisfaction increases due to QWL however interestingly, this study oppose
the work of Nanjundeswaraswamy and Swamy (2014) in terms of QWL under style of
leadership as this study evident contrasting findings as QWL under transformational
leadership is more effective in comparison to transactional leadership which is vice-versa to
work of Nanjundeswaraswamy and Swamy (2014). Interestingly, the work of Rose et al.,
(2006) and Rethinam and Ismail (2007) is confirmed to some extent as some of the constructs
such as; working condition, job security, compensation and reward, organization culture and
climate but only to small level.
Furthermore, the work of Haque and Yamoah (2014) is confirmed that organisational support
program is vital in creating and enhancing organisational commitment. Interestingly, all three
dimensions of organisational commitment identified in the work of (Allen & Meyer, 1996;
Robin & Culter, 2003; Bartlett & Kang, 2004; Haque & Yamoah, 2014) namely affective
commitment (AC), normative commitment (NC), and continuance commitment (CC) have
been established in this study. However, in relation to style of leadership, this study support
previous work of Haque et al., (2015) that all antecedents of organisational commitment (OC)
are differently linked with transactional and transformational leadership. Moreover, present
study findings also support the notion of Haque et al., (2015) study that transformational
leadership is more effective in comparison to transactional leadership in motivating
employees by shaping positively their organisational commitment. Additionally, the notion
such as "leaders' role in creating organisational culture and climate (Smith, 1998; Prideaux &
Beg, 2007); relation and cooperation (Omolayo, 2007; Barchiesi & La Bella, 2007); job
security (Voonl et al., 2011); and job satisfaction and organisational commitment (Fang et al.,
2009) have been confirmed in this study.
Conclusion
This study concludes that in Pakistan's private software houses both transformational and
transactional leadership style exists however, under transformational leadership style
employees organisational commitment is more evident and positively linked. Interestingly, all

three dimensions of organisational commitment has been confirmed in this study to be
significantly positively associated with transformational leadership whereas normative
commitment is only dimension that is negatively linked with transactional leadership.
Moreover, QWL is more effective for employees when working under transformational
leadership style but under transactional leadership style also the considered elements of QWL
are confirmed to be effective however the impact is fractionally low in contrast to
transformational leadership. Lastly, under transformational leadership there is high employee
job satisfaction leading to strengthen their organisational commitment in contrast to
transactional leadership style where high level of dissatisfaction prevailed.
Despite various measure were taken but there are certain limitations to present study such as
time constraint, research design, sample size, and research approach. Due to time constraint,
each respondent could not be studied in two different intervals of time. Moreover, sample
size was small by only having 408 employees working in this sector due to shortage of time
and unwillingness of private software houses' management. Additionally, only survey
questionnaire was used following deductive approach. The future researchers should consider
the longitudinal panel study to investigate in more depth. Furthermore, researchers should
also consider in-depth interviews with the management as well employees to gain qualitative
perspective related to research problem. Moreover, the sample size should be expanded by
visiting personally software houses to seek more respondents. Additionally, through
professional networking sites, the experts on the subject along with the participants from the
targeted sector should also be interviewed to include their perspective.
References
Allen N. J, & Meyer, J. P. (1996). Affective, Continuance, and Normative Commitment to
the Organization: An Examination of Construct Validity. Journal of Vocational Behaviour,
49 (3): 250-278.
Avolio, B. J., & Bass, B. M. (2006). Multifactor Leadership Questionnaire: Sampler set,
manual, forms, and scoring key (3rd ed.). Menlo Park, CA: Mind Garden, Inc.
Bartlett, K. R., & Kang, D. S. (2004). Training in organizational commitment in response to
industry and organizational change in New Zealand and the United States. Human Resource
Development International, 7 (4): 423-440.

Bartlett, J. E., Kotrlik, J. W., & Higgins, C. C. (2001). Organizational research: Determining
appropriate sample size in survey research. Information Technology, Learning, and
Performance Journal, 19(1), 43-50.
Bass, B. M., & Avolio, B. J. (1990). Developing transformational leadership: 1992 and
beyond. Journal of European industrial training, 14 (5).
Barchiesi, M. A., & La Bella, A. (2007, August). Leadership Styles of World's most Admired
Companies A Holistic Approach to Measuring Leadership Effectiveness. In Management
Science and Engineering, 2007. ICMSE 2007. International Conference on (pp. 1437-1447).
Berson, Y., Avolio, B. J., & Kahai, S. (2003), going deeper into building a grounded theory
approach: from verification to discovery, in Fred Dansereau, Francis J. Yammarino(ed.)
Multi-Level Issues in Organizational Behavior and Strategy (Research in Multi Level Issues,
Volume 2)Emerald Group Publishing Limited, pp.143 – 151.
Charan, J., and Biswas, T. (2013). How to Calculate Sample Size for Different Study Designs
in Medical Research? Indian Journal of Psychological medicine. Vol 35 (2): 121–126.
Cooper, R., & Schindler, P. (1998). Business research methods. 6th ed., Boston: McGraw-
Hill.
Cunningham, J. B., & Eberle, T. (1990). A guide to job enrichment and redesign. Personnel,
67(2), 56-61.
Easterby-Smith, M., Thorpe, R., & Jackson, P. R. (2015). Management and Business
Research. 5th Ed. SAGE Publication.
Fang, C. H., Chang, S. T., & Chen, G. L. (2009, May). Applying Structural Equation Model
to Study of the Relationship Model among leadership style, satisfaction, Organization
commitment and Performance in hospital industry. E-Business and Information System
Security, 2009. EBISS'09. International Conference on (pp. 1-5).
Guillemin, M., & Gillan, L. (2004). Ethics, Reflexivity, and “Ethically Important Moments”
in Research. Qualitative Inquiry, 10 (2), 261-280.
Hian, C. C., & Einstein, W. O. (1990). Quality of Work Life (QWL): What can unions do.
SAM Advanced Management Journal, 55(2), 17-22.

Hackman, J. R., & Oldham, G. R. (1980). Work redesign.
Haque, A. U., Faizan, R., Zehra, N., Baloch, A., Nadda, V., & Riaz, F. (2015). Leading
Leadership Style to Motivate Cultural-Oriented Female Employees in the Developing
Country: I.T Responses from Pakistan. International Journal of Academic Research in
Business and Social Sciences. Vol. 5. Issue. 9. Pg: 280-302.
Haque, A.U., & Yamoah, F. (2014). "Gender Employment Longevity: I.T Staff Response to
Organizational Support in Pakistan," International Journal of Academic Research in Business
and Social Sciences, 4 (12): 324-347.
Hogg, R.V. and Tanis, E.A. (1997). Probability and Statistical Inference, 5th Edition,
Prentice-Hall.
Kothari, C. R. (2004). Research methodology: methods and techniques. New Age
International.
Mack, L. (2010). The Philosophical Underpinnings of Educational Research. Polyglossia, 19,
1-10.
Mackenzie, N., & Knipe, S. (2006). Research dilemmas: Paradigms, methods and
methodology. Issues in Educational Research. 16 (2), 193-205.
McNeese-Smith, D. (1995). Job satisfaction, productivity, and organizational commitment:
The result of leadership. Journal of Nursing Administration, 25(9), 17-26.
Miyazaki, A. D. & Taylor, K. A. (2008). Researcher Interaction Biases and Business Ethics
Research: Respondent Reactions to Researcher Characteristics. Journal of Business Ethics,
81: 779-795.
Nahavandi, A. (2006). The art and science of leadership, Ltd. Pearson Education.
Nanjundeswaraswamy, T. S., and Swamy, D.R. (2015). Leadership styles and quality of work
life in SMEs. Management Science Letters, 4. Pp: 1-14.
Ogbonna, E., & Harris, L. C. (2000). Leadership style, organizational culture and
performance: empirical evidence from UK companies. International Journal of Human
Resource Management, 11(4), 766-788.

Omolayo B (2007). Effect of leadership style on job-related tension and psychological sense
of community in work organizations: A case study of four organizations in Lagos State,
Nigeria. Bangla. e-j. Soc. 4 (2):30-37.
Pakistan Press Foundation (2013). ‘IT sector should be government’s top priority’. Available
at: http://www.pakistanpressfoundation.org/2013/06/it-sector-should-be-governments-top-
priority/.
Podsakoff, P. M., MacKenzie, S. B., Moorman, R. H., & Fetter, R. (1990). Transformational
leader behaviors and their effects on followers' trust in leader, satisfaction, and organizational
citizenship behaviors. The Leadership Quarterly, 1 (2), 107-142.
Prabhakar, G. P. (2008) Projects and their management: A literature review. International
Journal of Business and Management, 3 (8). pp. 3-9. ISSN 1833-3850.
Prideaux, M., & Beg, R. (2007). Uncovering leadership issues in Papua New Guinea.
Rethinam, G. S., & Ismail, M. (2007). Constructs of quality of work life: A perspective of
information and technology professionals. European Journal of Social Sciences, 7(1), 58-70.
Rose, R. C., Beh, L., Uli, J., & Idris, K. (2006). Quality of work life: implications of career
dimensions. Journal of Social Sciences, 2 (2), 61.
Saraji, G. N., & Dargahi, H. (2006). Study of quality of work life (QWL). Iranian journal of
public health, 35 (4), 8-14.
Saunders, M., Lewis, P., and Thornhill, A. (2012). Research Methods for Business Students.
6th ed, Prentice Hall Financial Times, Harlow.
Sekaran, U., & Bougie, R. (2012). Research methods for business: A skill building approach.
(6th ed.). West Sussex, UK: John Wiley & Sons Ltd.
SMEDA (2014). I.T sectors' contribution to Pakistan's GDP. Available at:
http://www.smeda.org/.
Smith, B.D. (1998) Leadership: Psychology, science and understanding. Ca: Addison-
Wesley, Pp: 686-687

Tribune National Newspaper (2015). Pakistan’s IT exports exceed $2 billion, says PSEB
chief. Tribune New. Available at: http://tribune.com.pk/story/995593/fiscal-year-2014-15-
pakistans-it-exports-exceed-2-billion-says-pseb-chief/.
Victor, G. Y. S., & Soutar, G. N. (2005) The Role Of Ethical Behaviours In The Relations
Between Leadership Styles And Job Performance.
Voon, M. L., Lo, M. C., Ngui, K. S., & Ayob, N. B. (2011). The influence of leadership
styles on employees’ job satisfaction in public sector organizations in Malaysia. International
Journal of Business, Management and Social Sciences, 2 (1), 24-32.
Wang, G. Y. X. Z. S. (2008). The impact of transformational leadership style on
organizational performance: the intermediary effects of leader-member exchange.
Management Science.
Wang, D., Xue, H., & Xu, J. (2009, September). The Mechanism of Leadership Styles
Affecting Team Innovation in the PRC. In Management and Service Science, 2009.
MASS'09. International Conference on (pp. 1-4).
Ye, L., Junye, D., & Yan, M. (2011, May). The relationships between leadership styles and
organizational innovation climate: Cases of some high-tech enterprises in Hebei. Business
Management and Electronic Information (BMEI), 2011 International Conference on (Vol. 2,
pp. 316-319).