Embed Size (px)
Citation preview

version
111. Block A, Grazhdansky Prospect, Saint Petersburg, 195265. Russia
(812) 531-13-68. Fax (812) 596-58-01 E-mail: [email protected]
Vabtec CJSC
422869
(product code)
APPROVED
TLAS.411152.002-01 RE-LU
MULTIFUNCTIONAL METERS - ELECTRIC ENERGY QUALITY
CHARACTERISTICS MEASUREMENT DEVICES
BINOM3 SERIES
OPERATION MANUAL
TLAS.411152.002-01 RE

TLAS.411152.002-01 RE
2
Contents
Introduction …………………...……………………………………………………………….…….…… 4
1 DESCRIPTION AND OPERATION OF BINOM3 SERIES METERS ................................................... 7
1.1 Purpose of the Meters ........................................................................................................................... 7
1.2 Technical Characteristics of BINOM3 Series Meters .......................................................................... 11
1.2.1 Characteristics of Electric Power Network parameters and Quality Characteristics Measurements11
1.2.2 Metrological Characteristics of Electric Energy Measurements ...................................................... 26
1.2.3. Technical Parameters ...................................................................................................................... 32
1.2.4 Communication Channels and Interfaces ......................................................................................... 33
1.2.5 Data Processing ................................................................................................................................ 34
1.2.6 Data Protection ................................................................................................................................. 36
1.2.7 Remote control Functions Characteristics ........................................................................................ 36
1.2.8. Electric Power Supply ..................................................................................................................... 39
1.2.9 Power Consumption ......................................................................................................................... 40
1.2.10 Heat and Fire Resistance ................................................................................................................ 40
1.2.11 Environmental Stability .................................................................................................................. 40
1.2.12 Electromagnetic Compatibility....................................................................................................... 41
1.2.13 Reliability ....................................................................................................................................... 43
1.3 BINOM3 Series Meters Arrangement and Scope of Delivery ............................................................. 43
1.4 Meter Structure and Functioning .......................................................................................................... 44
1.4.1 Measurements and Calculation in BINOM3 Series Meters ............................................................. 45
1.4.2 Qjality Indicator Calculations .......................................................................................................... 52
1.4.4 Controling the Type of Information Displayed on the Screen ......................................................... 60
1.4.5 Structure ........................................................................................................................................... 70
1.4.6 Marking and Sealing ........................................................................................................................ 75
1.4.7 Packing ............................................................................................................................................. 76
1.5 Description and Operation of the Meter Components .......................................................................... 76
1.5.1 TP337A Processor Module .............................................................................................................. 76
1.5.2 TU337A Metering Module ............................................................................................................... 76
1.5.3 TS337A Discrete Signals Input/Output Module .............................................................................. 77
1.5.4 MS337A Keypad Module ................................................................................................................ 77
1.5.5 ТХ06А Communication Module...................................................................................................... 81
1.5.6 TE37Rx (TE38Rx) Relay Blocks ..................................................................................................... 81
1.6 Functional Flavor Description .............................................................................................................. 82
1.6.1 Archiving Function........................................................................................................................... 82
1.6.2 Built-In Information Presentation Facilities ..................................................................................... 83
1.6.3 Oscillography Function .................................................................................................................... 83
2. USING ON PURPOSE ............................................................................................................................ 84
2.1 Safety Precautions ................................................................................................................................ 84
2.2 Operation Conditions ............................................................................................................................ 84
2.3. BINOM3 Series Meters Preparation for Use ....................................................................................... 84
2.4 Insulation Check ................................................................................................................................... 85

TLAS.411152.002-01 RE
3
2.4.1 Insulation Resistance Check ............................................................................................................. 85
2.4.2 Insulation Dielectric Breakdown Test .............................................................................................. 85
2.5 BINOM3 Meter Installation ................................................................................................................. 87
2.6 Meter Installation .................................................................................................................................. 88
2.7 Connection of External Circuits ........................................................................................................... 89
2.7.1 Metering Circuits connection ........................................................................................................... 89
2.7.2 RS-485 Interface Circuits Connection ............................................................................................. 92
2.7.3 Impulse Output Connection Instruction ........................................................................................... 93
2.7.4 Power Circuits Connection ............................................................................................................... 94
2.7.5 Remote Signalling Circuits Connection ........................................................................................... 95
2.7.6 Remote Control Circuit Connection ................................................................................................. 96
2.8 Checking the Correctenss of Meter Connection and Functioning ........................................................ 98
2.8.1 Checking Power Voltage Availability .............................................................................................. 98
2.8.2 Switching Metering Circuits on ....................................................................................................... 99
2.8.3 Checking Correctness of the Meter Connection............................................................................... 99
2.9 BINOM3 Meter Configuring ................................................................................................................ 99
2.10 Procedure of the Meter Removal from Operation .............................................................................. 99
3 TECHNICAL MAINTENANCE…. .................................................................................................... ..100
3.1 Scheduled Technical Maintenance ....................................................................................................... 101
3.2 Checking Backup Power Supply from an Internal Battery .................................................................. 101
3.3 Clock Battery Check ............................................................................................................................. 102
4 CURRENT REPAIR .............................................................................................................................. 103
4.1 General Guidelines ............................................................................................................................... 103
4.2 Troubleshooting. ................................................................................................................................... 103
5 CALIBRATION ..................................................................................................................................... 105
6 STORAGE .............................................................................................................................................. 105
7 TRANSPORTATION............................................................................................................................. 106
8 DISPOSITION ........................................................................................................................................ 107
9 REALIZATION ...................................................................................................................................... 107
10 GUARANTEES .................................................................................................................................... 107

TLAS.411152.002-01 RE
4
This Operation Manual (OM) is intended for studying the arrangement and operation principles
of BINOM3 series multifunctional meters - electric energy quality characteristics multifunctional mea-
surement devices; it contains information and rules needed for their correct operation.
Full name: BINOM3 series multifunctional meter - electric energy quality characteristics multi-
functional measurement device.
Brief name: BINOM3 series meter, BINOM3 meter.
BINOM3 series meters are intended for fulfilling the following functions:
- measuring current and voltage per phase;
- calculating symmetric current and voltage components;
- calculating active, reactive and total connected power, inter alia per phase;
- network frequency measurement;
- measuring progressive total active energy as per GOST 31819.22-2012 (class 0.2S) and reac-
tive energy for accuracy class 0.5 (GOST 31819.22-2012 guidelines) both in direct and reverse direction
in total and by two independent accounting intervals, as well as by four tariff in view of non-working
days and holidays (total energy, positive sequence and basic frequency);
- energy losses recording (by measuring current and voltage squares and subsequent calculation
of losses) in both directions by four tariffs and two independent recording intervals;
- measuring, calculating and analyzing electric energy quality characteristics as per GOST R
8.655-2009. GOST 30804.4.30-2013 (class А), GOST 30804.4.7-2013 (class I), GOST R 51317.4.15-
2012 and quality norms as per GOST 32144-2013. GOST 33073-2014:
established voltage deviation value;
negative and positive voltage deviations;
voltage asymmetry ratios by negative sequence;
voltage asymmetry ratios by zero sequence;
frequency and frequency deviation;
voltage depression length;
voltage depression depth;
temporary overvoltage length;
overvoltage ratio;
voltage interruption length;
harmonical components of current, voltage, power, phase shift angles (based on harmonic
subgroups up to the 50th order of magnitude);
interharmonical components of current, voltage, power (based on centered interharmonic sub-
groups up to the 49th order of magnitude);
current and voltage waveform distortion factors;
short-term and long-term flicker indicators.
- oscillographic recorder of normal mode parameters, transient processes and electric energy
quality defect;
- archiving;
- remote indication data collection;
- remote control;

TLAS.411152.002-01 RE
5
- storage, aggregation and transmission of all data via communication channels to higher hierar-
chic levels of automated informative electric power accounting systems and/or energy resources dis-
patching;
- WEB parameterization and WEB access to current and archived events.
BINOM3 series meters as electrical parameters measuring instruments meet the requirements of
GOST 22261-94.
BINOM3 series meters as instruments measuring electrical energy quality characteristics meet
the requirements of GOST 8.655-2009.
BINOM3 meters as remote control devices meet the requirements of
GOST 26.205-88. GOST 26.013-81. GOST R IEC 870-3-93. GOST R IEC 870-4-93.
GOST IEC 60870-4-2011. GOST R IEC 60870-5-104-2004. GOST R IEC 60870-5-101-2006.
The functional capabilities, design principles, hardware and software composition and structure
of BINOM3 series meters meet the regulations prepared by OJSC Rosseti and the Concept of Auto-
mated Informative Electric Power Accounting Systems Design, and their principal technical parameters
to the active Standard Technical Requirements for Electric Energy and Power Control and Metering for
Power Systems Automated Informative Electric Power Accounting Systems.
The operational safety and degree of electric shock hazard protection of BINOM3 series meters
correspond to Class II of equipment as per GOST 12.2.091-2012
The service personnel operating BINOM3 series meters must be familiarized with this Operation
Manual, General Rules of Electrical Installations operation and have the appropriate Electrical Level for
carrying out work with voltage up to 1000 V.
The Operation Manual shall apply to all version of BINOM3 series multifunctional meters mea-
suring electric energy quality characteristics.
BINOM3 series meters were registered in the State Register of Measuring Instruments under
number 60113-15. Type approval certificate No. 58154 dated 23.03.15.
BINOM3 series meters have a registered Declaration of Conformity to the Requirements of Cus-
toms Union Technical Regulations - CU TR 004/2011 "Safety of Low-Voltage Equipment" and CU TR
020/2011 "Electromagnetic Compatibility of Technical Equipment". Declaration of Conformity No. RU
Д-RU.АУ40.В.05945 dated 03.04.15.
BINOM3 series meters were certified by the Certification Body for Instrumentation Product of
the FSUE "D.I. Mendeleev All-Russian Scientific Research Institute of Metrology" and have a Certifi-
cate of Conformity in the GOST R system No. РОСС RU. ME48.Н02789 dated 02.12.14.
BINOM3 series meters were certified in a voluntary certification system - VCS
GAZPROMCERT of PJSC Gazprom. Certificate of conformity No. ГО00.RU.1348.Н00266 dated
12.04.16.
TLAS.411152.002-01 RE
6
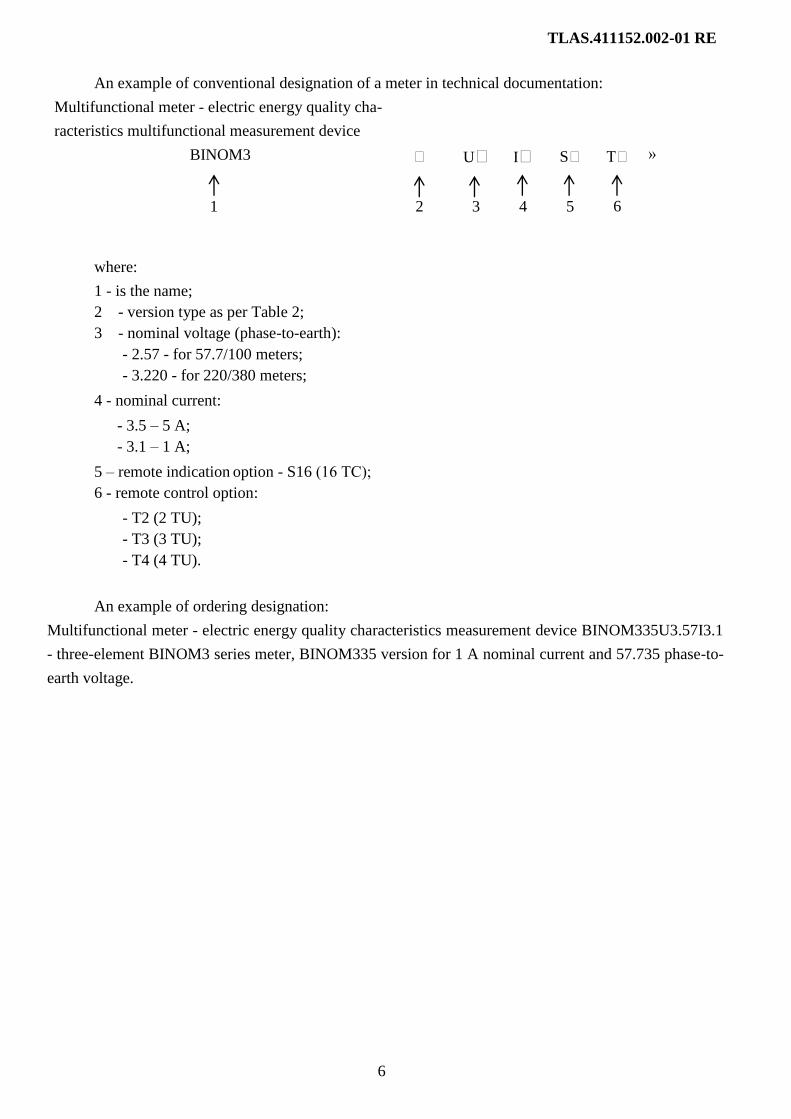
An example of conventional designation of a meter in technical documentation:
Multifunctional meter - electric energy quality cha-
racteristics multifunctional measurement device
BINOM3
U
I
S
Т
»
1 2 3 4 5 6
where:
1 - is the name;
2 - version type as per Table 2;
3 - nominal voltage (phase-to-earth):
- 2.57 - for 57.7/100 meters;
- 3.220 - for 220/380 meters;
4 - nominal current:
- 3.5 – 5 A;
- 3.1 – 1 A;
5 – remote indication option - S16 (16 ТС);
6 - remote control option:
- T2 (2 TU);
- T3 (3 TU);
- T4 (4 TU).
An example of ordering designation:
Multifunctional meter - electric energy quality characteristics measurement device BINOM335U3.57I3.1
- three-element BINOM3 series meter, BINOM335 version for 1 A nominal current and 57.735 phase-to-
earth voltage.

TLAS.411152.002-01 RE
7
1 DESCRIPTION AND OPERATION OF BINOM3 SERIES METERS
1.1 Purpose of the Meters
BINOM3 series meter is a three-phase, transformer one.
BINOM3 series meters are intended for standalone operation and for operation as parts of auto-
mated systems:
- automated informative electric power accounting and technical record-keeping systems,
- electric energy quality monitoring and control systems;
- data collection and transmission systems;
- automatic dispatching, technological monitoring and control systems;
- automated process control systems, etc.
Depending on hardware version, meters ensure connection and data gathering from 5 A and 1 A
current transformers and 57.7 V, 100 V, 220 V, 380 V. Direct voltage connection is allowed.
Meter operation environment:
- ambient air temperature from minus 40° to +60°C;
- relative air humidity up to 95 % at plus 25 °C temperature.
– atmospheric pressure from 70 to 106.7 kPa (from 537 to 795 mm Hg).
Normal meter operation conditions are tabulated in Table 1.
Table 1 – Normal Operation Conditions
Influencing Quantity Normal Value Permissible Deviation
Ambient temperature
20 С 5 С
Power voltage
- AC, frequency
- DC
220 V, 50 Hz;
220 V
1.0 %; 0.3 %
1.0 %
Measured voltage Nominal value 1.0 %
Measured network frequency Nominal frequency
50 Hz 0.3 %
Succession of phases in measured net-
work L1-L2-L3 -
Measured network voltage unsymmetry All phases connected -
Measured network AC voltage and cur-
rent waveform Sinusoidal Distortion factor less than 2%
Constant heterogeneous magnetic in-
duction 0 -

TLAS.411152.002-01 RE
8
Table 1 (Continued)
Influencing Quantity Normal Value Permissible Deviation
Heterogeneous constant magnetic
induction at normal frequency 0
Induction value that creates a
change in error not exceeding
0.1 % but in any case must
not be less than 0.05 mT.
Radio-frequency electromagnetic
fields, from 30 kHz to 2 GHz 0 Less than 1 V/m
Functioning of auxiliary parts Non-functioning of auxiliary
parts -
Conductive interference induced by
radio-frequency fields 0 Less than 1 V
Versions of meters with various nominal input signal values are presented in Table 2.
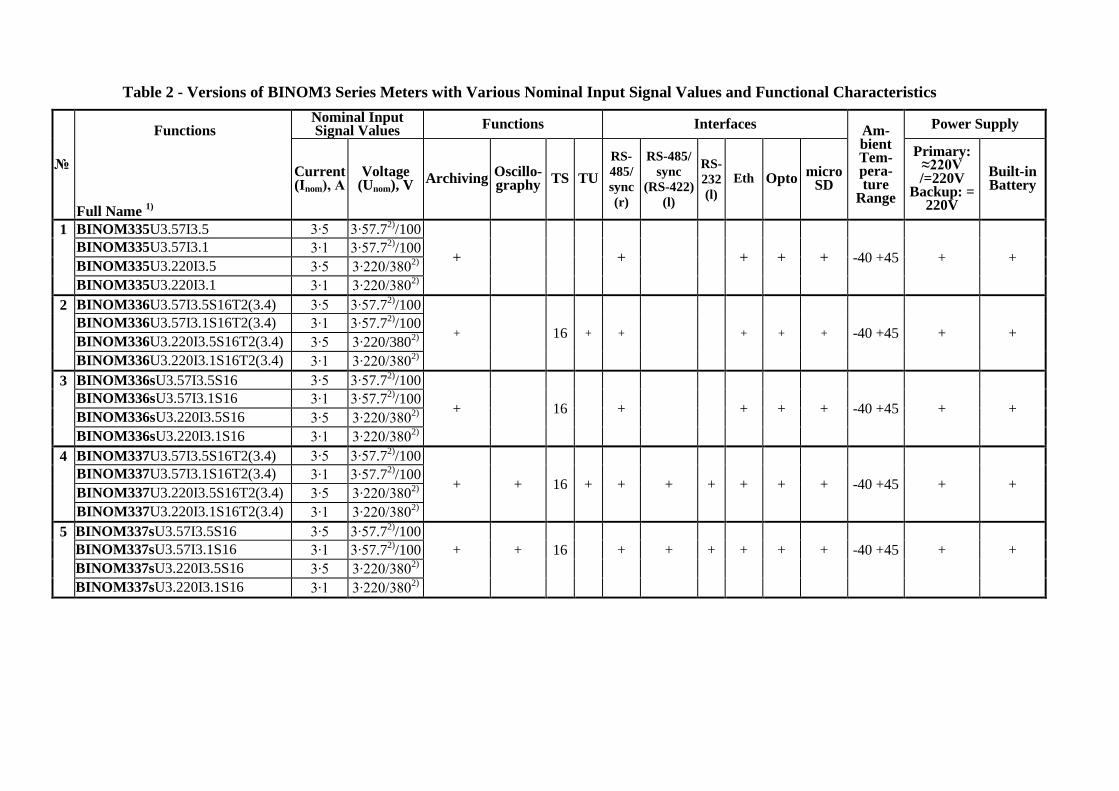
Table 2 - Versions of BINOM3 Series Meters with Various Nominal Input Signal Values and Functional Characteristics
№
Functions
Full Name
1)
Nominal Input Signal Values
Functions Interfaces Am-bient Tem-pera-ture
Range
Power Supply
Current (Inom), А
Voltage (Unom), V
Archiving Oscillo-graphy
TS TU
RS-
485/
sync
(r)
RS-485/
sync
(RS-422)
(l)
RS-
232
(l)
Eth Opto micro
SD
Primary: ≈220V /=220V
Backup: = 220V
Built-in Battery
1 BINOM335U3.57I3.5 3∙5 3∙57.72)
/100
+ + + + + -40 +45 + + BINOM335U3.57I3.1 3∙1 3∙57.7
2)/100
BINOM335U3.220I3.5 3∙5 3∙220/3802)
BINOM335U3.220I3.1 3∙1 3∙220/3802)
2 BINOM336U3.57I3.5S16T2(3.4) 3∙5 3∙57.72)
/100
+ 16 + + + + + -40 +45 + + BINOM336U3.57I3.1S16T2(3.4) 3∙1 3∙57.7
2)/100
BINOM336U3.220I3.5S16T2(3.4) 3∙5 3∙220/3802)
BINOM336U3.220I3.1S16T2(3.4) 3∙1 3∙220/3802)
3 BINOM336sU3.57I3.5S16 3∙5 3∙57.72)
/100
+ 16 + + + + -40 +45 + + BINOM336sU3.57I3.1S16 3∙1 3∙57.7
2)/100
BINOM336sU3.220I3.5S16 3∙5 3∙220/3802)
BINOM336sU3.220I3.1S16 3∙1 3∙220/3802)
4 BINOM337U3.57I3.5S16T2(3.4) 3∙5 3∙57.72)
/100
+ + 16 + + + + + + + -40 +45 + + BINOM337U3.57I3.1S16T2(3.4) 3∙1 3∙57.7
2)/100
BINOM337U3.220I3.5S16T2(3.4) 3∙5 3∙220/3802)
BINOM337U3.220I3.1S16T2(3.4) 3∙1 3∙220/3802)
5 BINOM337sU3.57I3.5S16 3∙5 3∙57.72)
/100
BINOM337sU3.57I3.1S16 3∙1 3∙57.72)
/100 + + 16 + + + + + + -40 +45 + +
BINOM337sU3.220I3.5S16 3∙5 3∙220/3802)
BINOM337sU3.220I3.1S16 3∙1 3∙220/3802)
TLAS.411152.002-01 RE
10
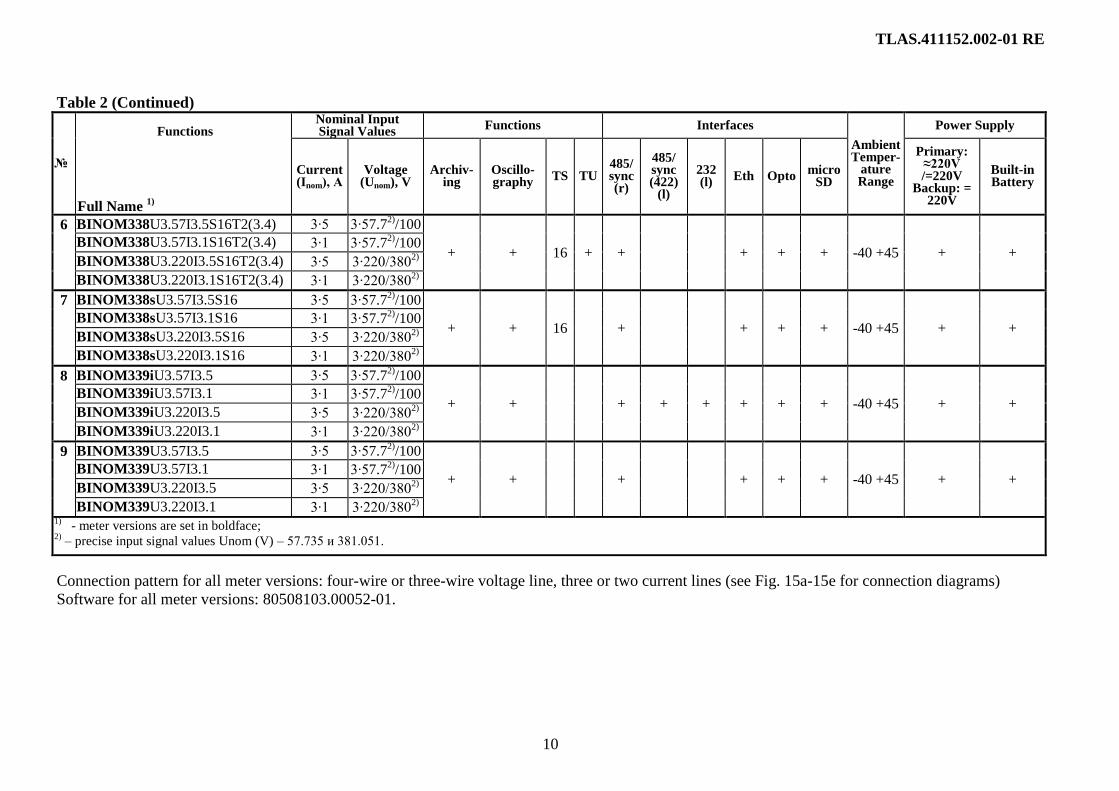
Table 2 (Continued)
№
Functions
Full Name
1)
Nominal Input Signal Values
Functions Interfaces
Ambient Temper-
ature Range
Power Supply
Current (Inom), А
Voltage (Unom), V
Archiv-ing
Oscillo-graphy
TS TU 485/ sync (r)
485/ sync (422)
(l)
232 (l)
Eth Opto micro
SD
Primary: ≈220V /=220V
Backup: = 220V
Built-in Battery
6 BINOM338U3.57I3.5S16T2(3.4) 3∙5 3∙57.72)
/100
+ + 16 + + + + + -40 +45 + + BINOM338U3.57I3.1S16T2(3.4) 3∙1 3∙57.7
2)/100
BINOM338U3.220I3.5S16T2(3.4) 3∙5 3∙220/3802)
BINOM338U3.220I3.1S16T2(3.4) 3∙1 3∙220/3802)
7 BINOM338sU3.57I3.5S16 3∙5 3∙57.72)
/100
+ + 16 + + + + -40 +45 + + BINOM338sU3.57I3.1S16 3∙1 3∙57.7
2)/100
BINOM338sU3.220I3.5S16 3∙5 3∙220/3802)
BINOM338sU3.220I3.1S16 3∙1 3∙220/3802)
8 BINOM339iU3.57I3.5 3∙5 3∙57.72)
/100
+ + + + + + + + -40 +45 + + BINOM339iU3.57I3.1 3∙1 3∙57.7
2)/100
BINOM339iU3.220I3.5 3∙5 3∙220/3802)
BINOM339iU3.220I3.1 3∙1 3∙220/3802)
9 BINOM339U3.57I3.5 3∙5 3∙57.72)
/100
+ + + + + + -40 +45 + + BINOM339U3.57I3.1 3∙1 3∙57.7
2)/100
BINOM339U3.220I3.5 3∙5 3∙220/3802)
BINOM339U3.220I3.1 3∙1 3∙220/3802)
1) - meter versions are set in boldface; 2)
– precise input signal values Unom (V) – 57.735 и 381.051.
Connection pattern for all meter versions: four-wire or three-wire voltage line, three or two current lines (see Fig. 15a-15e for connection diagrams) Software for all meter versions: 80508103.00052-01.

1.2 Technical Characteristics of BINOM3 Series Meters
1.2.1 Characteristics of Electric Power Network parameters and Quality Characteristics
Measurements
Acceptable basic error limits meet the requirements of
GOST 31818.11-2012. GOST 31819.22-2012. GOST 30804.4.30-2013. GOST R 8.655-2009. They are
reflected:
- in Table 3: parameters of electricity metering, current, voltage, power and frequency measure-
ments;
- in Table 4: electric energy quality characteristics related to long-term measurements of voltage
characteristics;
- in Table 4.1: electric energy quality characteristics related to accidental events;
- in Table 5: information about measurement methods and the electric energy quality characteris-
tics statistic analysis parameters set in the instrument configuration settings.
Claimed measurement errors at minimum parameter values are achievable only when informa-
tion is transmitted via exchange interfaces in the "floating decimal point" format.
Averaging parameter during electric mains parameters measurement is equal to 10 electric mains
periods (~ 0.2 s).
The averaged parameter value is equal to square root from the sum of input value squares. Aver-
aging for any parameter presented in Table 3 may be set in the meter configuration settings; additional
averaging parameters may be entered as well.
Harmonic subgroups are used for calculation of current and voltage harmonic components, total
coefficients of harmonic components (Table 3. Table 4).
Interharmonic centered subgroups were used for the calculation of interharmonic current and
voltage component coefficients (Table 3. Table 4).
Accidental event parameters are measured on the basis of root-mean-square voltage measure-
ments updated for every elementary frequency semiperiod (in 50 Hz frequency electrical power supply
systems).
During voltage dips, overvoltage's, voltage interruptions the results of electric energy quality pa-
rameters measurements related to voltage deviation, flicker dose, total coefficient of harmonic voltage
components, n order of magnitude coefficient of harmonic voltage components, voltage asymmetry ratio
in inverted sequence, voltage asymmetry ratio in zero sequence, frequency deviation are marked. Aver-
aged electric energy quality parameters including marked values are also marked. Marked data are not
taken into account when in the process of assessment of electric energy conformity to quality norms.

TLAS.411152.002-01 RE
12
Table 3 - Electric Energy Metering Parameters and Network Parameters
Parameters Designations
Maximum Permissible Basic Error – Abso-
lute; δ – Relative, %; γ – Reduced, %.
Qty
Measurement In-terval
Connection Dia-grams
Electric Energy Metering Parameters 3-
wire 4-
wire
Active ener-gy
Import/export total, W∙h +Wat, -Wat
± 0.2 (δ) 1)
2
-
+ +
Import/export by 4 tariffs, W∙h +Wa1. -Wa1. +Wa2. -Wa2. +Wa3. -Wa3. +Wa4. -Wa4
8 + +
Non-tariff import/export , W∙h +Wa0. -Wa0 2 + +
Import/export Profile 1 (technical) , W∙h +WaP1. -WaP1 2 1.2.3.4.5.6.10.12. 15.20.30.60 min
+ +
Import/export Profile 2 (commercial) , W∙h +WaP2. -WaP2 2 1.2.3.4.5.6.10.12. 15.20.30.60 min
+ +
Reactive Energy
Import/export total, VAr∙h +Wrt, -Wrt
± 0.5 (δ) 1)
2
-
+ +
Import/export by 4 tariffs, WAr∙h +Wr1. -Wr1. +Wr2. -Wr2. +Wr3. -Wr3. +Wr4. -Wr4
8 + +
Non-tariff import/export , VAr∙h +Wr0. -Wr0 2 + +
Import/export Profile 1 (technical) , VAr∙h +WrP1. -WrP1 2 1.2.3.4.5.6.10.12. 15.20.30.60 min
+ +
Import/export Profile 2 (commercial) , VAr∙h +WrP2. -WrP2 2 1.2.3.4.5.6.10.12. 15.20.30.60 min
+ +
Active ener-gy loss
Import/export total, W∙h +Walt, -Walt
± 0.6 (δ)
2
-
+ +
Import/export by 4 tariffs, W∙h +Wal1. -Wal1. +Wal2. -Wal2. +Wal3. -Wal3. +Wal4. -Wal4
8 + +
Non-tariff import/export , W∙h +Wal0. -Wal0 2 + +
Import/export Profile 1 (technical) , W∙h +WalP1. -WalP1 2 1.2.3.4.5.6.10.12. 15.20.30.60 min
+ +
Import/export Profile 2 (commercial) , W∙h +WalP1. -WalP1 2 1.2.3.4.5.6.10.12. 15.20.30.60 min
+ +
Reactive energy loss
Import/export total, VAr∙h +Wrlt, -Wrlt
± 0.6 (δ)
2
-
+ +
Import/export by 4 tariffs, WAr∙h +Wrl1. -Wrl1. +Wrl2. -Wrl2. +Wrl3. -Wrl3. +Wrl4. -Wrl4
8 + +
Non-tariff import/export , VAr∙h +Wrl0. -Wrl0 2 + +
Import/export Profile 1 (technical) , VAr∙h +WrlP1. -WrlP1 2 1.2.3.4.5.6.10.12. 15.20.30.60 min
+ +
Import/export Profile 2 (commercial) , VAr∙h +WrlP2. -WrlP2 2 1.2.3.4.5.6.10.12. 15.20.30.60 min
+ +
Energy me-tering viola-
tion flags
Phase current failure PhIAoff, PhIBoff, PhICoff - 3
-
+ + Phase voltage failure PhUAoff, PhUBoff, PhUCoff - 3 - + Phase power failure PhPAoff, PhPBoff, PhPCoff, PhPoff - 4 - + Current available, voltage failure PhIwoUA, PhIwoUB, PhIwoUC - 3 + + Phases misconnection PhTAMP, PhLRP, PhLBP, PhPHV - 4 + +

TLAS.411152.002-01 RE
13
Table 3 (Continued)
Parameters Designations
Maximum Permissible Basic Error - Absolute;
δ – Relative, %; γ – Reduced, %.
Qty
Measurement In-terval
Connection Dia-grams
Electric Energy Metering Parameters 3-
wire 4-
wire
Basic Fre-quency Ac-tive Energy
Import/export total, W∙h +Wat(1), -Wat(1)
± 0.2 (δ) 1)
2
-
+ +
Import/export by 4 tariffs, W∙h +Wa1(1), -Wa1(1), +Wa2(1), -Wa2(1), +Wa3(1), -Wa3(1), +Wa4(1), -Wa4(1)
8 + +
Non-tariff import/export , W∙h +Wao(1), -Wao(1) 2 + +
Import/export Profile 1 (technical) , W∙h +WaP1(1), -WaP1(1) 2 1.2.3.4.5.6.10.12. 15.20.30.60 min
+ +
Import/export Profile 2 (commercial) , W∙h +WaP1(2), -WaP1(1) 2 1.2.3.4.5.6.10.12. 15.20.30.60 min
+ +
Basic Fre-quency
Reactive Energy
Import/export total, VAr∙h +Wrt(1), -Wrt(1)
± 0.5 (δ) 1)
2
-
+ +
Import/export by 4 tariffs, WAr∙h +Wr1(1), -Wr1(1), +Wr2(1), -Wr2(1), +Wr3(1), -Wr3(1), +Wr4(1), -Wr4(1)
8 + +
Non-tariff import/export , VAr∙h +Wro(1), -Wro(1) 2 + +
Import/export Profile 1 (technical) , VAr∙h +WrP1(1), -WrP1(1) 2 1.2.3.4.5.6.10.12. 15.20.30.60 min
+ +
Import/export Profile 2 (commercial) , VAr∙h +WrP1(2), -WrP1(1) 2 1.2.3.4.5.6.10.12. 15.20.30.60 min
+ +
Direct se-quence ac-tive energy
Import/export total, W∙h +Wat1(1), -Wat1(1)
± 0.2 (δ) 1)
2
-
- +
Import/export by 4 tariffs, W∙h +Wa11(1), -Wa11(1), +Wa21(1), -
Wa21(1), +Wa31(1), -Wa31(1), +Wa41(1), -Wa41(1)
8 - +
Non-tariff import/export , W∙h +Wa01(1), -Wa01(1) 2 - +
Import/export Profile 1 (technical) , W∙h +WaP21(1), -WaP21(1) 2 1.2.3.4.5.6.10.12. 15.20.30.60 min
- +
Import/export Profile 2 (commercial) , W∙h +WaP22(1), -WaP21(2) 2 1.2.3.4.5.6.10.12. 15.20.30.60 min
- +
Direct se-quence reac-tive energy
Import/export total, VAr∙h +Wrt1(1), -Wrt1(1)
± 0.5 (δ) 1)
2
-
- +
Import/export by 4 tariffs, WAr∙h +Wr11(1), -Wr11(1), +Wr21(1), -Wr21(1), +Wr31(1), -Wr31(1), +Wr41(1), -Wr41(1)
8 - +
Non-tariff import/export , VAr∙h +Wr01(1), -Wr01(1) 2 - +
Import/export Profile 1 (technical) , VAr∙h +WrP21(1), -WrP21(1) 2 1.2.3.4.5.6.10.12. 15.20.30.60 min
- +
Import/export Profile 2 (commercial) , VAr∙h +WrP22(1), -WrP21(2) 2 1.2.3.4.5.6.10.12. 15.20.30.60 min
- +

TLAS.411152.002-01 RE
14
Table 3 (Continued)
Parameters Designations
Maximum Permissible Basic
Error
- Absolute;
δ – Relative, %;
γ – Reduced, %.
Qty
Measure-
ment Inter-
val
Connection
Diagrams
Network Parameters as per GOST 31818.11-2012 and GOST R 8.655-2009 3-wire 4-
wire
Frequency Frequency, Hz f ± 0.01 () 1
10 basic
frequency
periods
(~200 ms)
+ +
Voltage pa-
rameters
Root mean square 1)
and average 2)
phase voltage values,
V
UA, UB, UC ,
Uphav 0.1 () 4 - +
Root mean square 1)
and average 2)
interphase voltage
values, V
UAB, UBC, UCA ,
Uiphav 0.1 () 4 + +
Root mean square positive and negative sequence voltage
value 4)
, V U1. U2
0.1 () 2 +
17) +
Zero sequence root mean square value 4)
, V U0 1 - +
Voltage asymmetry ratios by zero sequence,% K0U 0.15 () 1 - +
Voltage asymmetry ratios by negative sequence, % K2U 0.15 () 1 + 17)
+
Root mean square basic frequency phase voltage value, V UA(1), UB(1),
UC(1) 0.1 () 3 - +
Root mean square value of n order of magnitude phase
voltage harmonic component
(n = 2…50), V
UA(n), UB(n),
UC(n) ±0.05 () for U(n) < 1% Unom
±5% (δ) для U(n) ≥1% Unom 147 - +
Coefficient of n order of magnitude phase voltage har-
monic component (n = 2...50), %
KUA(n), KUB(n),
KUC(n) ±0.05() for KU(n)< 1%
±5% (δ) for KU(n) ≥ 1% 147 - +
Total coefficient of phase voltage harmonic components 11)
, % KUA, KUB, KUC
±0.05 () for KU < 1%
±5 % (δ) for KU ≥ 1% 3 - +

TLAS.411152.002-01 RE
15
Table 3 (Continued)
Parameters Designations
Maximum Permissible Basic Error
- Absolute; δ – Relative, %; γ – Reduced, %.
Qty Measure-
ment Inter-val
Connection Diagrams
3-wire 4-wire
Voltage
parameters
Root mean square value of n order of magnitude phase
voltage interharmonic component
(n = 0…49), V
UAisg(n),
UBisg(n),
UCisg(n)
±0.05 () for Uisg(n) < 1% Unom
±5% (δ) for Uisg(n) ≥ 1% Unom 147
10 basic
frequency
periods
(~200 ms)
- +
Coefficient of n order of magnitude phase voltage inter-
harmonic component (n = 0...49), % KUAisg(n), KUBisg(n),
KUCisg(n) ±0.05 () for KUisg(n) < 1%
±5% (δ) for KUisg(n) ≥ 1% 147 - +
Root mean square basic frequency interphase voltage val-
ue, V
UAB(1), UBC(1), UCA(1)
0.1 () 1 + +
Root mean square value of n order of magnitude inter-
phase voltage harmonic component
(n = 2…50), V
UAВ(n), UBС(n),
UCА(n) ±0.05 () for U(n) < 1% Unom iph
±5% (δ) для U(n) ≥1% Unom iph 147 + -
Coefficient of n order of magnitude interphase voltage
harmonic component (n = 2...50), %
KUAB(n), KUBC(n),
KUCA(n) ±0.05 () for KU(n)
< 1%
±5% (δ) for KU(n) ≥ 1% 147 + -
Total coefficient of interphase voltage harmonic compo-
nents, % KUAB, KUBC, KUCA
±0.05 () for KU < 1%
±5 % (δ) for KU ≥ 1% 3 + -
Coefficient of n order of magnitude interphase voltage in-
terharmonic component (n = 0...49), %
UABisg(n),
UBCisg(n),
UCAisg(n)
±0.05 () for Uisg(n) < 1% Unom iph
±5% (δ) for Uisg(n) ≥ 1% Unom iph 147 + -
Coefficient of n order of magnitude interphase voltage in-
terharmonic component (n = 0...49), %
KUABisg(n), KUB-
Cisg(n),
KUCAisg(n)
±0.05 () for KUisg(n) < 1%
±5% (δ) for KUisg(n) ≥ 1% 147 + -
Negative phase voltage deviation, % δUA (-), δUB (-), δUC (-)) 0.1 () 3 - +
Positive phase voltage deviation, % δUA (+), δUB (+), δUC (+) 0.1 () 3 - +
Negative interphase voltage deviation, % δU AB (-), δU BC (-),
δU CA (-) 0.1 () 3 + +
Positive interphase voltage deviation, % δUAB (+), δUBC (+),
δUCA (+) 0.1 () 3 + +
Established voltage deviation value, % δUest 0.2 () 1 + +

TLAS.411152.002-01 RE
16
Table 3 (Continued)
Parameters Designations
Maximum Permissible Basic Error
- Absolute; δ – Relative, %; γ – Reduced, %.
Qty Measure-
ment Inter-val
Connection Diagrams
3-wire 4-wire
Current
Parameters
Root mean square (IА, IВ, IС) and average (Iav) 2)
phase
current values, A IА, IВ, IС , Iav 0.1 () 4
10 basic
frequency
periods
(~200 ms)
+ +
Root mean square positive, negative and zero sequence
current values4)
, A I1. I2. I0 0.1 () 3 + +
Current unbalance factor by zero sequence,% K0I ±0.3()
0.05·Inom ≤ I ≤ 2·Inom 1 + +
Current unbalance factor by negative sequence,% K2I ±0.3()
0.05·Inom ≤ I ≤ 2·Inom 1 + +
Root mean square basic frequency phase current value, A IA(1), IB(1), IC(1) 0.1 () 3 + +
Coefficient of n order of magnitude phase current har-
monic component (n = 2...50), A IA(n), IB(n), IC(n)
±0.15 () for I(n) < 3% Inom
±5% (δ) for I(n) ≥ 3% Inom 147 + +
Coefficient of n order of magnitude phase current har-
monic component (n = 2...50), % KIA(n), KIB(n), KIC(n)
±0.15 () for KI(n) < 3%
±5% (δ) for KI(n) ≥ 3%
147 + +
Total coefficient of interphase current harmonic compo-
nents, % KIA, KIB, KIC
±0.15 () for KI < 3%
±5% (δ) for KI ≥ 3% 3 + +
Root mean square value of n order of magnitude phase
current interharmonic component (n = 0...49), A IAisg (n), IBisg (n), ICisg
(n) ±0.15 () for Iisg(n) < 3% Inom
±5% (δ) for Iisg(n) ≥ 3% Inom 147 + +
Coefficient of n order of magnitude phase current inter-
harmonic component (n = 0...49), %
KIAisg(n), KIBisg(n),
KICisg(n) ±0.15 () for KIisg(n)
< 3%
±5% (δ) for KIisg(n) ≥ 3%
147 + +

TLAS.411152.002-01 RE
17
Table 3 (Continued)
Parameters Designations
Maximum Permissible Basic Error
- Absolute; δ – Relative, %; γ – Reduced, %.
Qty Measure-
ment Inter-val
Connection Diagrams
3-wire 4-wire
Phase
shift angle
parame-
ters
Phase shift angle between basic frequency phase voltages,
º
φUAB(1), φUBC(1),
φUCA(1) 0.2 (∆)
6) 3
10 basic
frequency
periods
(~200 ms)
- +
Phase shift angle between basic frequency phase voltage
and current, º
φUIA(1), φUIB(1),
φUIC(1)
0.5 (∆) 0.1Inom ≤ I ≤ 2Inom
5 (∆) 0.1Inom ≤ I ≤ 0.1Inom
3 - +
Phase shift angle between phase voltage and n order of
magnitude harmonic component current
(n = 2…50), º
φUIA(n), φUIB(n),
φUIC(n)
3 (∆) 0.5Inom ≤ I ≤ 2Inom,
KI(n)≥ 5%, KU(n)≥ 5%
5 (∆) 0.5Inom ≤ I ≤ 2Inom,
1%≤KI(n)<5%, %≤KU(n)<5%
5 (∆) 0.1Inom ≤ I ≤ 0.5Inom,
KI(n)≥ 5%, KU(n)≥ 5%
147 - +
Phase shift angle between positive, zero and negative se-
quence voltage and current, º φU1I1. φU0I0. φU2I2
0.5 (∆)
8)
5 (∆)
9)
3 - +
Phase and average power coefficient7)
cosφA, cosφB,
cosφC 0.01 () 3 - +
Average power coefficient7)
cosφav 0.01 () 1 + +
Phase shift angle between basic frequency phase
currents, ◦
φIAB(1), φIBC(1),
φICA(1) 0.5
(∆)
10) 3 + +
TLAS.411152.002-01 RE
18
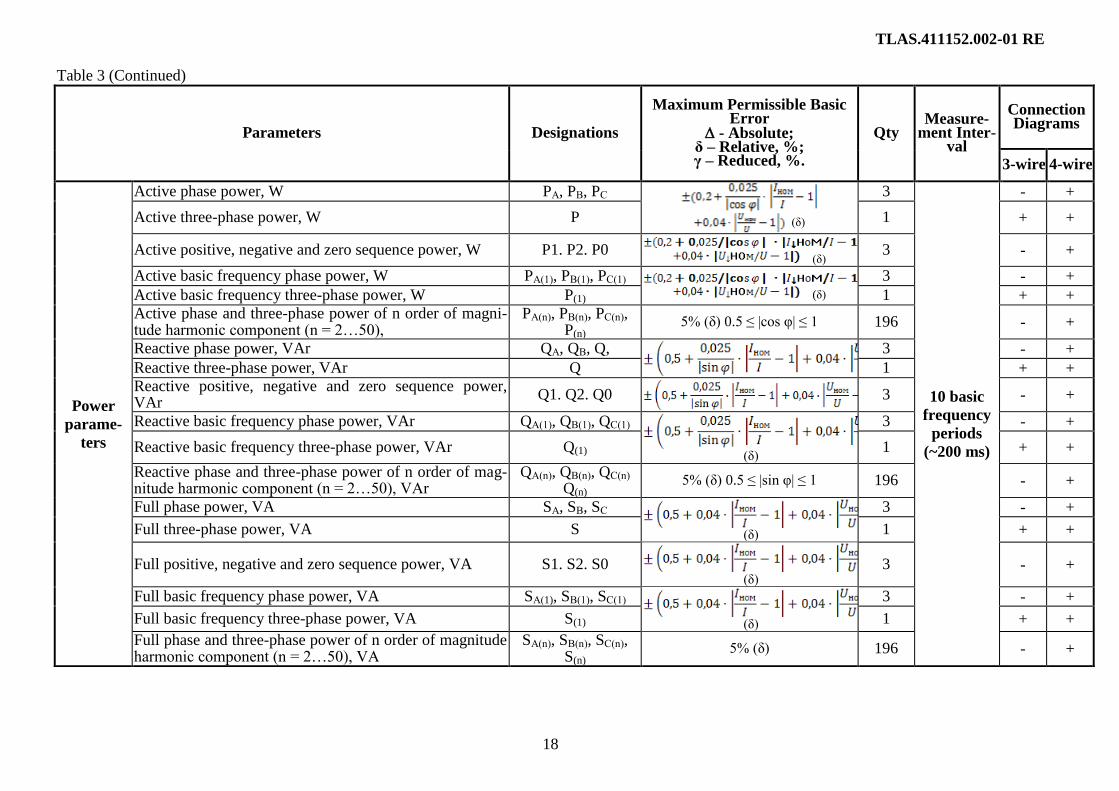
Table 3 (Continued)
Parameters Designations
Maximum Permissible Basic Error
- Absolute; δ – Relative, %; γ – Reduced, %.
Qty Measure-
ment Inter-val
Connection Diagrams
3-wire 4-wire
Power
parame-
ters
Active phase power, W PА, PВ, PС
(δ)
3
10 basic
frequency
periods
(~200 ms)
- +
Active three-phase power, W P 1 + +
Active positive, negative and zero sequence power, W P1. P2. P0
(δ) 3 - +
Active basic frequency phase power, W PА(1), PВ(1), PС(1)
(δ)
3 - +
Active basic frequency three-phase power, W P(1) 1 + + Active phase and three-phase power of n order of magni-tude harmonic component (n = 2…50),
PА(n), PВ(n), PС(n), P(n)
5% (δ) 0.5 ≤ |cos φ| ≤ 1 196 - +
Reactive phase power, VAr QА, QВ, Q,
3 - +
Reactive three-phase power, VAr Q 1 + + Reactive positive, negative and zero sequence power, VAr
Q1. Q2. Q0 3 - +
Reactive basic frequency phase power, VAr QА(1), QВ(1), QС(1)
(δ)
3 - +
Reactive basic frequency three-phase power, VAr Q(1) 1 + +
Reactive phase and three-phase power of n order of mag-nitude harmonic component (n = 2…50), VAr
QА(n), QВ(n), QС(n) Q(n)
5% (δ) 0.5 ≤ |sin φ| ≤ 1 196 - +
Full phase power, VA SА, SВ, SС
(δ)
3 - +
Full three-phase power, VA S 1 + +
Full positive, negative and zero sequence power, VA S1. S2. S0 (δ)
3 - +
Full basic frequency phase power, VA SА(1), SВ(1), SС(1)
(δ)
3 - +
Full basic frequency three-phase power, VA S(1) 1 + +
Full phase and three-phase power of n order of magnitude harmonic component (n = 2…50), VA
SА(n), SВ(n), SС(n), S(n)
5% (δ) 196 - +
TLAS.411152.002-01 RE
19
Table 3 (Continued)
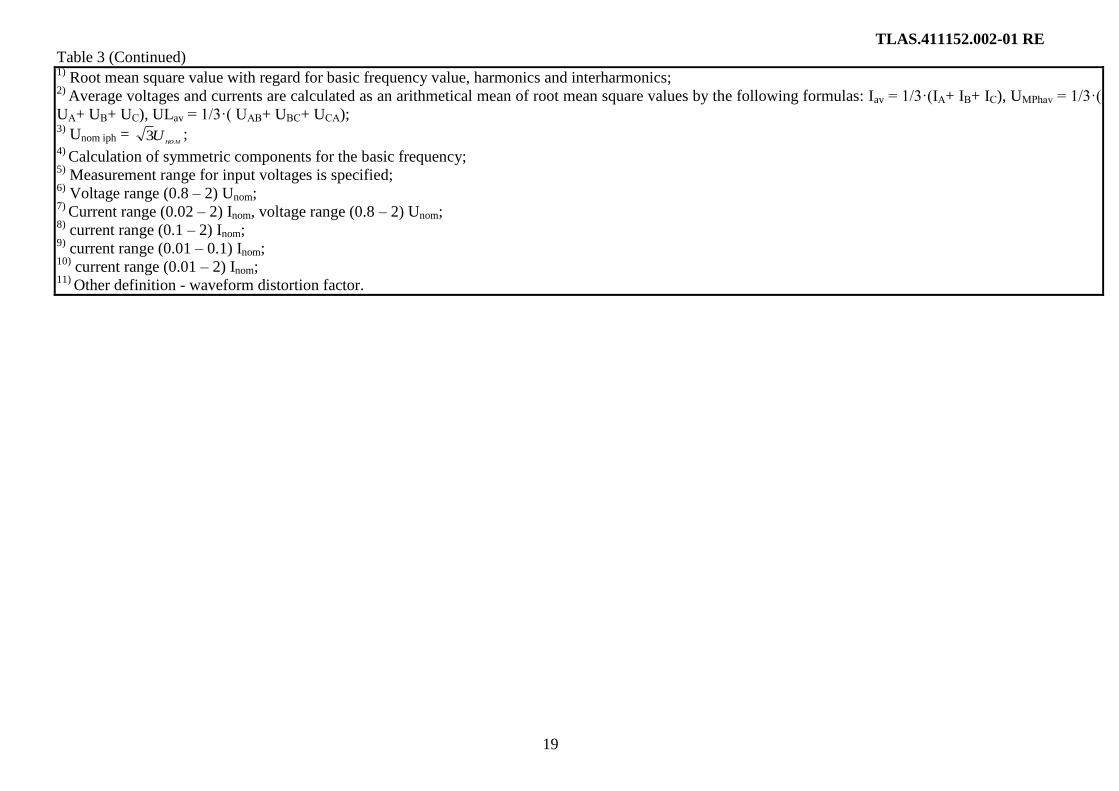
1) Root mean square value with regard for basic frequency value, harmonics and interharmonics;
2) Average voltages and currents are calculated as an arithmetical mean of root mean square values by the following formulas: Iav = 1/3·(IА+ IВ+ IС), UМPhav = 1/3·(
UА+ UВ+ UС), ULav = 1/3·( UАВ+ UВС+ UСА); 3)
Unom iph = номU3 ;
4) Calculation of symmetric components for the basic frequency;
5) Measurement range for input voltages is specified;
6) Voltage range (0.8 – 2) Unom;
7) Current range (0.02 – 2) Inom, voltage range (0.8 – 2) Unom;
8) current range (0.1 – 2) Inom;
9) current range (0.01 – 0.1) Inom;
10) current range (0.01 – 2) Inom;
11) Other definition - waveform distortion factor.
TLAS.411152.002-01 RE
20
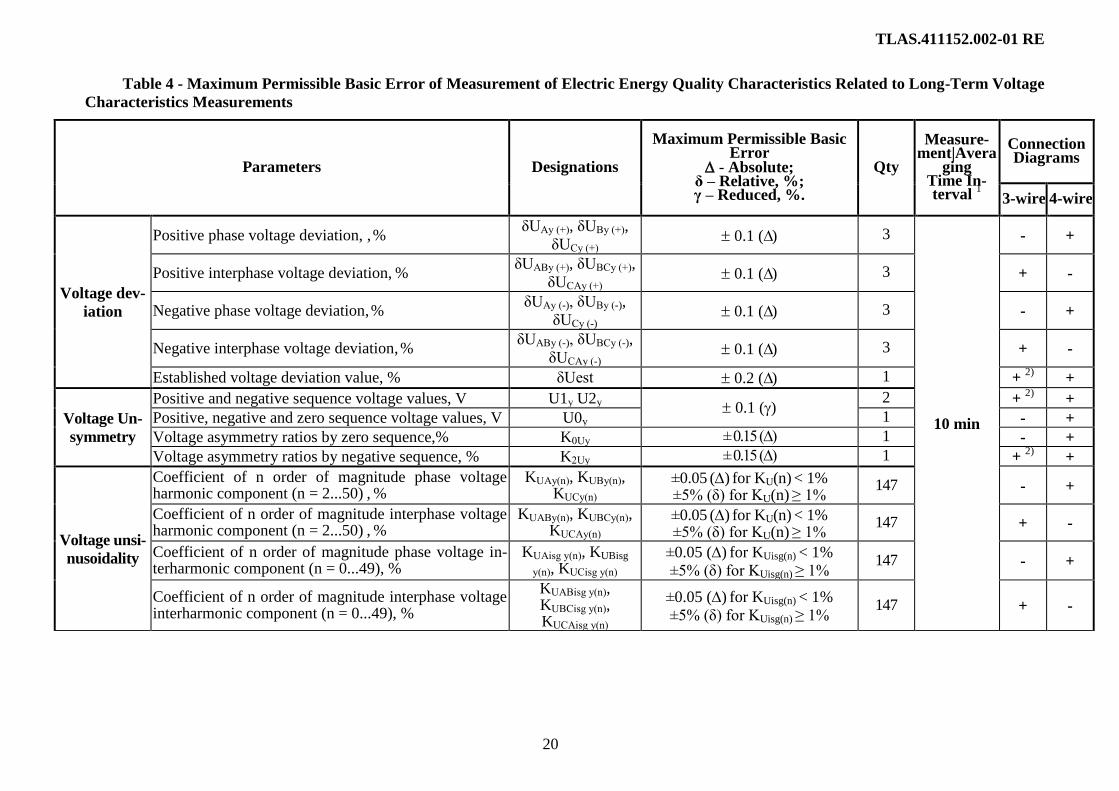
Table 4 - Maximum Permissible Basic Error of Measurement of Electric Energy Quality Characteristics Related to Long-Term Voltage
Characteristics Measurements
Parameters Designations
Maximum Permissible Basic Error
- Absolute; δ – Relative, %; γ – Reduced, %.
Qty
Measure-ment|Avera
ging Time In-terval
1
Connection Diagrams
3-wire 4-wire
Voltage dev-
iation
Positive phase voltage deviation, , % δUAу (+), δUВу (+),
δUСу (+) 0.1 (∆) 3
10 min
- +
Positive interphase voltage deviation, % δUAВу (+), δUВСу (+),
δUСАу (+) 0.1 (∆) 3 + -
Negative phase voltage deviation, % δUAу (-), δUВу (-),
δUСу (-) 0.1 (∆) 3 - +
Negative interphase voltage deviation, % δUAВу (-), δUВСу (-),
δUСАу (-) 0.1 (∆) 3 + -
Established voltage deviation value, % δUest 0.2 (∆) 1 + 2)
+
Voltage Un-
symmetry
Positive and negative sequence voltage values, V U1у U2у 0.1 () 2 +
2) +
Positive, negative and zero sequence voltage values, V U0у 1 - +
Voltage asymmetry ratios by zero sequence,% K0Uу ± 0.15 (∆) 1 - +
Voltage asymmetry ratios by negative sequence, % K2Uу ± 0.15 (∆) 1 + 2)
+
Voltage unsi-
nusoidality
Coefficient of n order of magnitude phase voltage harmonic component (n = 2...50) , %
KUAу(n), KUBу(n), KUCу(n)
±0.05 () for KU(n) < 1%
±5% (δ) for KU(n) ≥ 1%
147 - +
Coefficient of n order of magnitude interphase voltage harmonic component (n = 2...50) , %
KUABу(n), KUBCу(n), KUCAу(n)
±0.05 () for KU(n) < 1%
±5% (δ) for KU(n) ≥ 1%
147 + -
Coefficient of n order of magnitude phase voltage in-terharmonic component (n = 0...49), %
KUAisg у(n), KUBisg
у(n), KUCisg у(n) ±0.05 () for KUisg(n) < 1%
±5% (δ) for KUisg(n) ≥ 1% 147 - +
Coefficient of n order of magnitude interphase voltage interharmonic component (n = 0...49), %
KUABisg у(n), KUBCisg у(n), KUCAisg у(n)
±0.05 () for KUisg(n) < 1%
±5% (δ) for KUisg(n) ≥ 1% 147 + -

TLAS.411152.002-01 RE
21
Table 4 (Continued)
Parameters Designations
Maximum Permissible Basic Error
- Absolute; δ – Relative, %; γ – Reduced, %.
Qty
Measure-ment|Avera
ging Time In-terval
1
Connection Diagrams
3-wire 4-wire
Voltage unsi-
nusoidality
Total coefficient of phase voltage harmonic compo-nent, %
KUAу, KUBу, KUCу ±0.05() for KU < 1% ±5% (δ) for KU ≥ 1%
3
10 min
- +
Total coefficient of interphase voltage harmonic com-ponent, %
KUAВу, KUBСу, KUCАу
3 + -
Flicker 3)
Short-term flicker dose, relative units PSt ±5% (δ) 1 +
2) +
Long-term flicker dose, relative units PLt ±5% (δ) 1 2 hours + 2)
+
Frequency
Frequency, Hz f10 ± 0.01 (∆) 1
10 sec
+ +
Frequency deviation, Hz ∆f10 ± 0.01 (∆) 1 + +
Positive and negative frequency deviation, Hz ∆f10 (+), ∆f10 (-) ± 0.01 (∆) 2 + + 1)
– Time interval length is a settable value, measurement time interval values (for frequency, frequency deviation, short-term flicker dose) and averaging (for
other electric energy quality parameters) are shown as per GOST 32144-2013; 2)
– analysis is performed on the basis of interphase voltages; 3)
– short-term and long-term flicker dose calculation functions are implemented only in the following meter versions: BINOM335. BINOM339.

TLAS.411152.002-01 RE
22
Table 4.1 - Maximum Permissible Basic Error of Measurement of Electric Energy Quality Parameters Related to Accidental Events
Parameters Designations Maximum Permissible Basic
Absolute Error Qty
Connection Diagrams
3- wire
4- wire
Voltage dips
Flags and meter Fdip, F(∆t>60)dip, Ndip - 3 + +
Duration, s ∆tdip T, where T=1/f 1 + +
Depth, % δUdip 0.2 () 1 + 1)
+
Voltage interrup-
tions
Flags and meter Finter, F(∆t>180)inter, Ninter - 3 + +
Duration, s ∆tinter T, where T=1/f 1 + +
Depth, % δUinter 0.2 () 1 + 1)
+
Temporary over-
voltages
Flags and meter Fover, F(∆t>60)over, Nover - 3 + +
Duration, s ∆tover T, where T=1/f 1 + +
Temporary overvoltage coeffi-
cient, relative units Cover 0.002 () 1 +
1) +
1) interphase volgate is adopted as reference voltage.

TLAS.411152.002-01 RE
23
Table 5 – Information about Measurement Methods and the Electric Energy Quality Characteristics Statistic Analysis Parameters Set in BINOM3 Configuration
Settings
Parameters
Designations Averaging Interval
1
Measurement Methods and Quality Norms Standard Sec-
tion Normally Permissi-
ble Value2)
Maximum Permissi-
ble Value3)
Mea-sure-ment
or Ac-cura-
cy Class,
SI
GOST 30804.4.30-2013
GOST 32144-2013
Long-Term Voltage Cnanges in Voltage Characteristic
Frequency deviation
Positive frequency deviation, Hz ∆f10(+)stat 10 s
(measurement interval)
5.1 4.2.1 0.2 Hz 0.4 Hz А
Negative frequency deviation, Hz ∆f10(-)stat 10 s
(measurement interval)
5.1 4.2.1 0.2 Hz 0.4 Hz А
Voltage devi-ation
Positive phase voltage deviations, % δUA(+)stat, δUB(+)stat, δUC(+)stat 10 min 5.2. 5.12 4.2.2 - 10% А
Positive interphase voltage deviations, % δUAB(+)stat, δUBC(+)stat,
δUCA(+)stat 10 min 5.2. 5.12 4.2.2 - 10% А
Negative phase voltage deviations, % δUA(-)stat, δUB(-)stat,
δUC(-)stat 10 min 5.2. 5.12 4.2.2 - 10% А
Negative interphase voltage deviations, % δUAB(-)stat, δUBC(-)stat,
δUCA(-)stat 10 min 5.2. 5.12 4.2.2 - 10% А
Voltage unsi-nusoidality
Total coefficient of phase/interphase voltage harmonic components, % KUAstat, KUBstat, KUCstat 10 min
5.8 (GOST 30804.4.7-
2013 Cl. 3.2) 4.2.4.1
GOST 32144-
2013. Table 5
GOST 32144-
2013. Table 5
А, I
Coefficient of n order of magnitude interphase voltage harmonic component (n = 2…50), %
KUA(n)stat, KUB(n)stat, KUC(n)stat
10 min 5.8
(GOST 30804.4.7-2013 Cl. 3.2)
4.2.4.1
GOST 32144-2013.
Tables 1÷4
GOST 32144-2013.
Tables 1÷4
А, I
Coefficient of n order of magnitude interphase voltage harmonic component (n = 0…49), %
KUAisg(n)stat, KUBisg(n)stat, KUCisg(n)stat
10 min 5.9
(GOST 30804.4.7-2013 App. A)
- - - I
Flicker 4)
Short-term flicker dose, relative units PSt stat 10 min
(measurement interval)
5.3
(GOST R 51317.4.15
Cl. 5.7.2)
4.2.3 - 1.38 А
Long-term flicker dose, relative units PLt stat 2 hours 5.3
(GOST R 51317.4.15
Cl. 5.7.3)
4.2.3 - 1 А
Voltage Un-symmetry
Voltage unsymmetry ratios by negative and ze-ro sequences, %
K2Ustat , K0Ustat 10 min 5.7 4.2.5 2% 4% А
TLAS.411152.002-01 RE
24
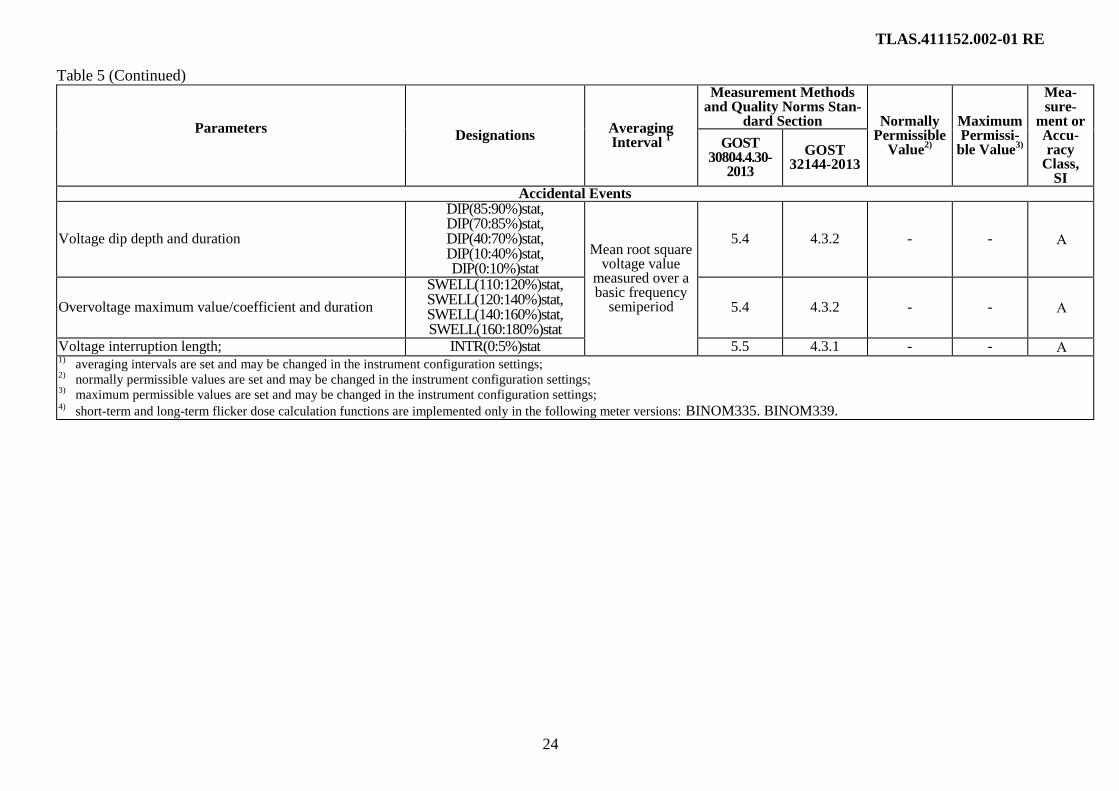
Table 5 (Continued)
Parameters
Designations Averaging Interval
1
Measurement Methods and Quality Norms Stan-
dard Section Normally Permissible
Value2)
Maximum Permissi-
ble Value3)
Mea-sure-
ment or Accu-racy
Class, SI
GOST 30804.4.30-
2013
GOST 32144-2013
Accidental Events
Voltage dip depth and duration
DIP(85:90%)stat, DIP(70:85%)stat, DIP(40:70%)stat, DIP(10:40%)stat, DIP(0:10%)stat
Mean root square voltage value
measured over a basic frequency
semiperiod
5.4 4.3.2 - - А
Overvoltage maximum value/coefficient and duration
SWELL(110:120%)stat, SWELL(120:140%)stat, SWELL(140:160%)stat, SWELL(160:180%)stat
5.4 4.3.2 - - А
Voltage interruption length; INTR(0:5%)stat 5.5 4.3.1 - - А 1) averaging intervals are set and may be changed in the instrument configuration settings; 2) normally permissible values are set and may be changed in the instrument configuration settings; 3) maximum permissible values are set and may be changed in the instrument configuration settings; 4) short-term and long-term flicker dose calculation functions are implemented only in the following meter versions: BINOM335. BINOM339.

1.2.1.1 Active current, voltage, frequency and energy quality parameters values metering lag
does not exceed 100 s after power voltage input.
1.2.1.2 The maximum permissible values of additional error of network parameters measurement
on ambient temperature change from normal to any temperature in the working temperature range do
not exceed º of the basic error cited in Table 3 per each 10 C.
1.2.1.3 The maximum permissible additional error of current, voltage and frequency measure-
ments caused by changes in influencing quantities in relation to normal conditions do not exceed the
limits cited in Table 6.
Table 6 - Maximum Additional Error of Network Parameters Measurement
Influencing Quantity Error Variation Limit, %
Current Voltage Fre-
quency
Network Quality In-
dicators
Mains frequency within the range from 42.5
to 57.5 Hz
º basic
error
º basic error - -
Curve form: basic frequency current harmon-
ics within the range from 85 Hz to 2875 Hz
º basic
error
- - -
Curve form: basic frequency voltage harmon-
ics within the range from 42.5 Hz to 57.5 Hz
º basic
error
- - -
Measured voltage within the range (0.1 – 0.8)
Unom
0.2 - 0.2 -
Heterogeneous magnetic induction 0.5 mT º basic error - - -
Constant heterogeneous magnetic induction º basic error - - -
1.2.1.3 The maximum permissible additional error of power measurements caused by changes in
influencing quantities in relation to normal conditions do not exceed the limits cited in Table 7.
Table 7 - Maximum Additional Error of Power Measurement
Influencing Quantity
Current
Value (Symme-
tric Load)
Coeffi-
cient
Maximum additional measurement
error
Power, % Cosφ (∆) Sph, Sabc
Pph,Pab
c Qph, Qabc
Curve form:
The fifth harmonic current is equal to 40%
of load current. The fifth harmonic voltage
is equal to 10% of basic frequency voltage
0.5 Imax
Unom
cos φ = 1
± 0.4
± 0.4 - 0.005
Heterogeneous magnetic induction 0.5 mT Inom
Unom
cos φ = 1 ± 0.5 ± 0.5 - 0.01
sin φ = 1 ± 1 - ± 1
Constant heterogeneous magnetic induc-
tion MMF value is equal to 1000 A·coils
(GOST 31819.22)
Inom
Unom
cos φ = 1
± 1 ± 1 - 0.01
sin φ = 1 - ±1
TLAS.411152.002-01 RE
26
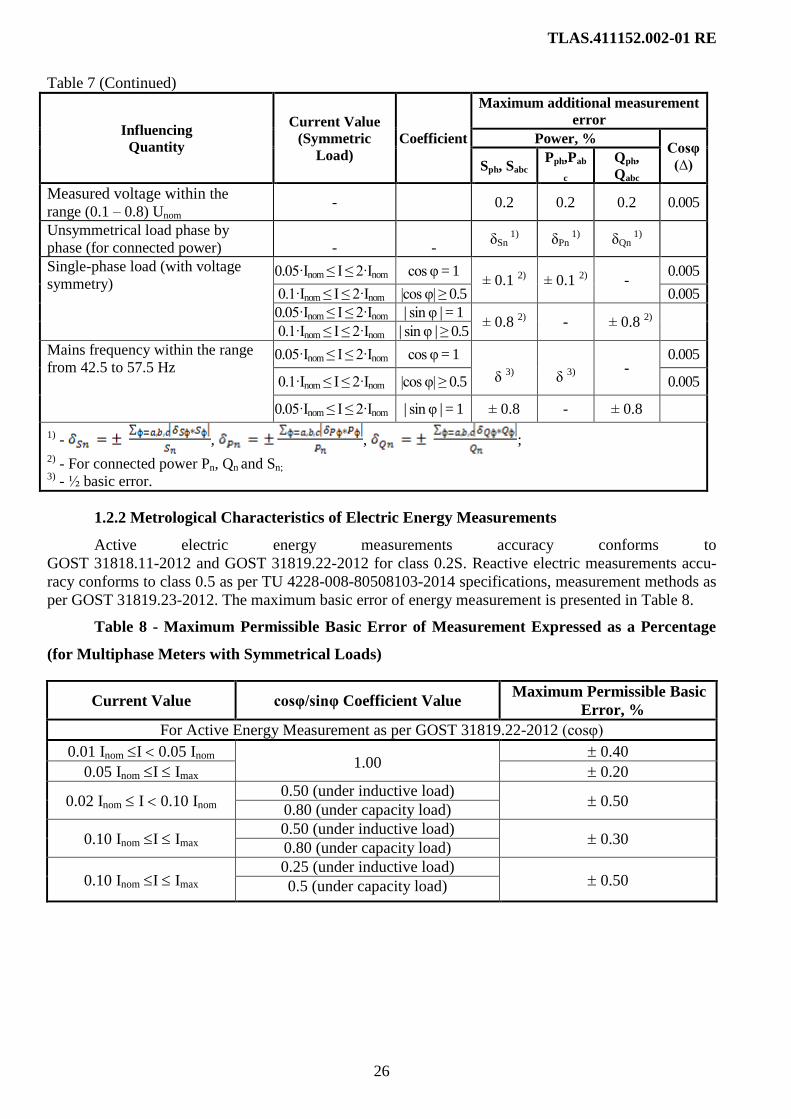
Table 7 (Continued)
Influencing
Quantity
Current Value
(Symmetric
Load)
Coefficient
Maximum additional measurement
error
Power, % Cosφ
(∆) Sph, Sabc
Pph,Pab
c
Qph,
Qabc
Measured voltage within the
range (0.1 – 0.8) Unom -
0.2 0.2 0.2 0.005
Unsymmetrical load phase by
phase (for connected power)
-
- δSn
1) δPn 1) δQn
1)
Single-phase load (with voltage
symmetry) 0.05·Inom ≤ I ≤ 2·Inom cos φ = 1
± 0.1 2) ± 0.1 2) - 0.005
0.1·Inom ≤ I ≤ 2·Inom |cos φ| ≥ 0.5 0.005
0.05·Inom ≤ I ≤ 2·Inom | sin φ | = 1 ± 0.8 2) - ± 0.8 2)
0.1·Inom ≤ I ≤ 2·Inom | sin φ | ≥ 0.5
Mains frequency within the range
from 42.5 to 57.5 Hz 0.05·Inom ≤ I ≤ 2·Inom cos φ = 1
δ 3)
δ 3)
-
0.005
0.1·Inom ≤ I ≤ 2·Inom |cos φ| ≥ 0.5 0.005
0.05·Inom ≤ I ≤ 2·Inom | sin φ | = 1 ± 0.8 - ± 0.8
1) - , , ; 2) - For connected power Pn, Qn and Sn; 3) - ½ basic error.
1.2.2 Metrological Characteristics of Electric Energy Measurements
Active electric energy measurements accuracy conforms to
GOST 31818.11-2012 and GOST 31819.22-2012 for class 0.2S. Reactive electric measurements accu-
racy conforms to class 0.5 as per TU 4228-008-80508103-2014 specifications, measurement methods as
per GOST 31819.23-2012. The maximum basic error of energy measurement is presented in Table 8.
Table 8 - Maximum Permissible Basic Error of Measurement Expressed as a Percentage
(for Multiphase Meters with Symmetrical Loads)
Current Value cosφ/sinφ Coefficient Value Maximum Permissible Basic
Error, %
For Active Energy Measurement as per GOST 31819.22-2012 (cosφ)
0.01 Inom I 0.05 Inom
1.00 0.40
0.05 Inom I Imax 0.20
0.02 Inom I 0.10 Inom 0.50 (under inductive load)
0.50 0.80 (under capacity load)
0.10 Inom I Imax 0.50 (under inductive load)
0.30 0.80 (under capacity load)
0.10 Inom I Imax 0.25 (under inductive load)
0.50 0.5 (under capacity load)

TLAS.411152.002-01 RE
27
Table 8 (Continued)
For Reactive Energy Measurement as per GOST 31819.23-2012 (sinφ)
0.02 Inom I 0.05 Inom 1.00
0.8
0.05 Inom I Imax 0.5
0.01 Inom I 0.05 Inom 0.50 0.8
0.10 Inom I Imax 0.50 0.5
0.10 Inom I Imax 0.25 0.8
1.2.2.1 The maximum permissible basic error of energy measurement under single-phase load
(multiphase voltages applied to voltage circuits being symmetrical) correspond to the values indicated in
Table 9.
The difference between error value under single-phase meter load and under symmetrical multi-
phase load, nominal current Inom:
- for active energy and power factor (cosφ) equal to 1 does not exceed 0.4%.
- for reactive energy and coefficient (cosφ) equal to 1 does not exceed 0.8 %.
Table 9 – The Maximum Error Expressed as a Percentage (for Multiphase Meters with a
Single-Phase Load, Multiphase Voltage Applied to Voltage Circuits Being Symmetrical)
Current Value cosφ/sinφ Coefficient Value Maximum Permissible Basic
Error, %
For Active Energy Measurement as per GOST 31819.22-2012 (cosφ)
0.05 Inom I Imax 1.0 0.30
0.10 Inom I Imax 0.5 (under inductive load) 0.40
For Reactive Energy Measurement as per GOST 31819.23-2012 (sinφ)
0.05 Inom I Inom 1.0 0.8
0.10 Inom I Imax 0.5 (under inductive and capacity
load) 0.8
1.2.1.3 The maximum permissible additional energy measurement error caused by changes in in-
fluencing quantities in relation to normal conditions are presented in Tables 10 and 11.

TLAS.411152.002-01 RE
28
Table 10 - The Maximum Active Energy Error Caused by Influencing Quantities
Influencing Quantity Current Value (Symmetrical
Load)
Power factor, cos φ
Additional Error Limits, %
For Active Energy Measurement as per GOST 31819.22-2012 (cosφ)
Ambient air temperature measure-ment 1)
0.05 Inom I Imax 1 Average
Temperature Coefficient, %K
0.01 0.02 0.1 Inom I Imax
0.5 (under inductive load)
Voltage variation within the limits 10 % 2), 3)
0.5 Inom I Imax 1.0 0.10
0.1 Inom I Imax 0.5 (under inductive
load) 0.20
Frequency variation within the limits 2 %3)
0.05 Inom I Imax 1.0 0.10
0.1 Inom I Imax 0.5
(under inductive load)
0.10
Self-heating Imax 1.0 0.10
0.5 (under inductive load)
0.10
Reverse sequential order of phases 0.10 Inom
1
0.05
Voltage Unsymmetry 4) Inom 0.50
Harmonics in current and voltage circuits 5)
0.50 Imax 0.40
Subharmonics in AC circuit) 0.50 Inom6)
1
0.60 Constant heterogeneous magnetic in-duction 5)
Inom
2.0
Heterogeneous magnetic induction 0.5 mT7)
Inom 0.50
Radio-frequency electromagnetic fields 1.00
Functioning of auxiliary parts 8) 0.01 Inom 0.05

TLAS.411152.002-01 RE
29
Table 10 (Continued)
Influencing Quantity
Current Value
(Symmetrical
Load)
Power factor
cos φ
Additional Error
Limits, %
Conductive interference induced by
radio-frequency fields
Inom
1
1.00 Electrical fast transient burst
Resistance to oscillatory damped in-
terference 1)
- Average temperature coefficient must be determined for the whole working range. The working
temperature range must be divided into subranges amounting to
20 K each. After that, the average temperature coefficient must be determined by performing mea-
surements for those subranges: 10 K above and 10 K below the subrange middle. The temperature must
under no circumstances fall outside the above working range during the test. 2) - For voltage ranges from minus 20 to minus 10% and from plus 10 to plus 15%, additional eror
limits may triple those shown in the table.
With voltage less than 0.8 Unom, energy measurement error may vary within the limits from plus 10 to
minus 100%. 3) - It is advisable to carry out tests under Inom. 4) - Multiphase meters with three measuring elements must measure energy and register readings with-
in the range of limit error variation values presented in the table if the following is interrupted:
- one or two phases in a three-phase, four-wire network;
- one of three phases in a three-phase, three-wire network.
This relates only to phase interruptions and does not relate, e.g., to such cases as transformer fuses
blowing. 5) - Test conditions are presented in Cl.Cl. 8.2.1-8.2.3. GOST 31819.22-2012. 6) - Voltage curve waveform distortion factor must not exceed 1%. 7) - 0.5 mT heterogeneous magnetic induction created by a current whose frequency is equal to the
frequency of the voltage fed to the meter and with the most unfavorable phase and direction must not
bring about additional meter error exceeding the values specified in the table. Magnetic induction may
be created by putting the meter inside of a coil 1 m in diameter on the average with a rectangular cross
section, a small radial thickness as compared to the diameter and having 400 ampere-windings. 8) - The auxiliary part inside the meter casing shall be energized discretely.
It is desirable to mark the auxiliary park connection in order to ensure its correct connection. In case
these connections are implemented with the help of plugs and sockets, they must be protected against
possible incorrect connection of the meter.
However, upon availability of such markings or connections preventing incorrect meter connection ad-
ditional error must not exceed the one specified in the table if the meter is tested with the connections
creating the most adverse conditions.
TLAS.411152.002-01 RE
30
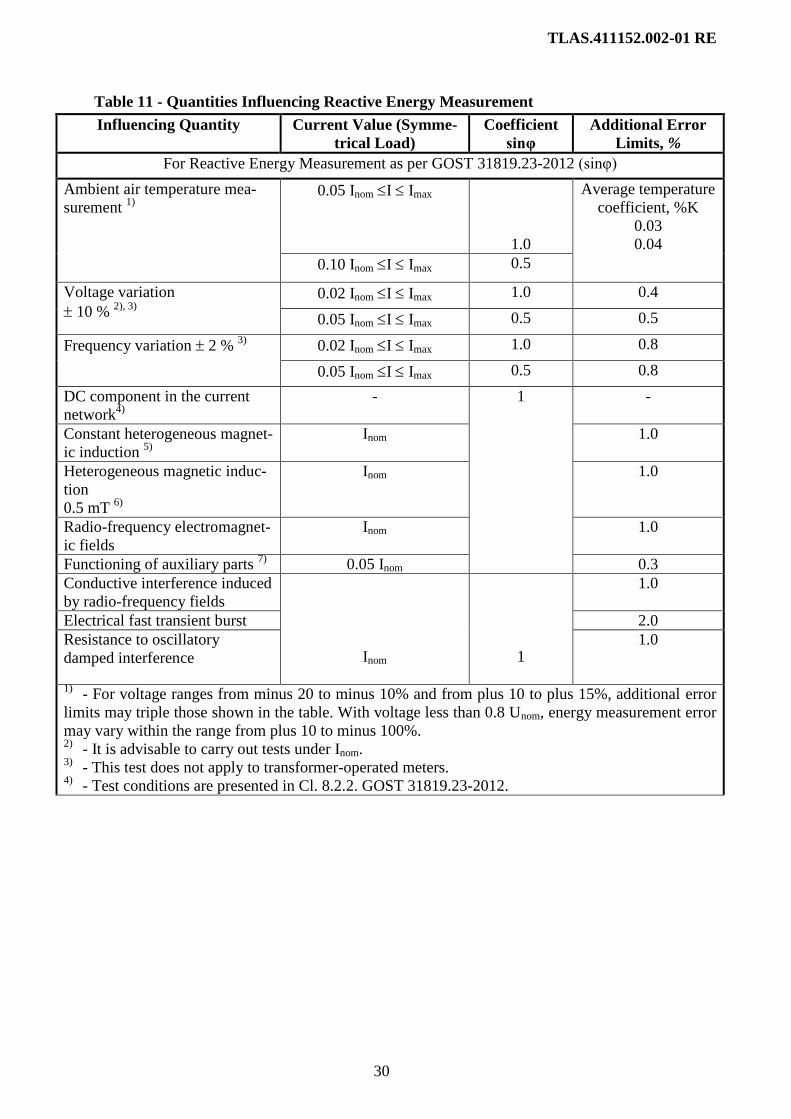
Table 11 - Quantities Influencing Reactive Energy Measurement
Influencing Quantity Current Value (Symme-
trical Load)
Coefficient
sinφ
Additional Error
Limits, %
For Reactive Energy Measurement as per GOST 31819.23-2012 (sinφ)
Ambient air temperature mea-
surement 1)
0.05 Inom I Imax
1.0
Average temperature
coefficient, %K
0.03
0.04
0.10 Inom I Imax 0.5
Voltage variation
10 % 2), 3)
0.02 Inom I Imax 1.0 0.4
0.05 Inom I Imax 0.5 0.5
Frequency variation 2 % 3)
0.02 Inom I Imax 1.0 0.8
0.05 Inom I Imax 0.5 0.8
DC component in the current
network4)
- 1 -
Constant heterogeneous magnet-
ic induction 5)
Inom 1.0
Heterogeneous magnetic induc-
tion
0.5 mT 6)
Inom 1.0
Radio-frequency electromagnet-
ic fields
Inom 1.0
Functioning of auxiliary parts 7)
0.05 Inom 0.3
Conductive interference induced
by radio-frequency fields
Inom
1
1.0
Electrical fast transient burst 2.0
Resistance to oscillatory
damped interference
1.0
1) - For voltage ranges from minus 20 to minus 10% and from plus 10 to plus 15%, additional error
limits may triple those shown in the table. With voltage less than 0.8 Unom, energy measurement error
may vary within the range from plus 10 to minus 100%. 2) - It is advisable to carry out tests under Inom. 3) - This test does not apply to transformer-operated meters. 4) - Test conditions are presented in Cl. 8.2.2. GOST 31819.23-2012.
TLAS.411152.002-01 RE
31
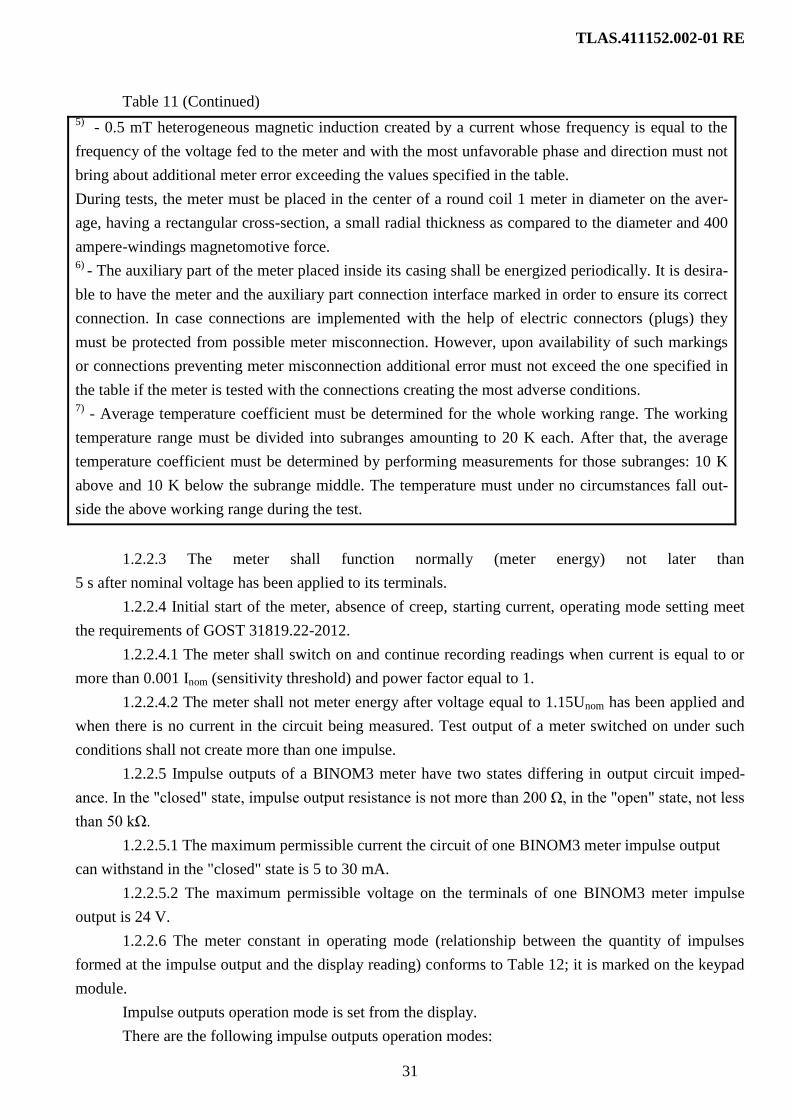
Table 11 (Continued)
5) - 0.5 mT heterogeneous magnetic induction created by a current whose frequency is equal to the
frequency of the voltage fed to the meter and with the most unfavorable phase and direction must not
bring about additional meter error exceeding the values specified in the table.
During tests, the meter must be placed in the center of a round coil 1 meter in diameter on the aver-
age, having a rectangular cross-section, a small radial thickness as compared to the diameter and 400
ampere-windings magnetomotive force. 6) - The auxiliary part of the meter placed inside its casing shall be energized periodically. It is desira-
ble to have the meter and the auxiliary part connection interface marked in order to ensure its correct
connection. In case connections are implemented with the help of electric connectors (plugs) they
must be protected from possible meter misconnection. However, upon availability of such markings
or connections preventing meter misconnection additional error must not exceed the one specified in
the table if the meter is tested with the connections creating the most adverse conditions. 7)
- Average temperature coefficient must be determined for the whole working range. The working
temperature range must be divided into subranges amounting to 20 K each. After that, the average
temperature coefficient must be determined by performing measurements for those subranges: 10 K
above and 10 K below the subrange middle. The temperature must under no circumstances fall out-
side the above working range during the test.
1.2.2.3 The meter shall function normally (meter energy) not later than
5 s after nominal voltage has been applied to its terminals.
1.2.2.4 Initial start of the meter, absence of creep, starting current, operating mode setting meet
the requirements of GOST 31819.22-2012.
1.2.2.4.1 The meter shall switch on and continue recording readings when current is equal to or
more than 0.001 Inom (sensitivity threshold) and power factor equal to 1.
1.2.2.4.2 The meter shall not meter energy after voltage equal to 1.15Unom has been applied and
when there is no current in the circuit being measured. Test output of a meter switched on under such
conditions shall not create more than one impulse.
1.2.2.5 Impulse outputs of a BINOM3 meter have two states differing in output circuit imped-
ance. In the "closed" state, impulse output resistance is not more than 200 Ω, in the "open" state, not less
than 50 kΩ.
1.2.2.5.1 The maximum permissible current the circuit of one BINOM3 meter impulse output
can withstand in the "closed" state is 5 to 30 mA.
1.2.2.5.2 The maximum permissible voltage on the terminals of one BINOM3 meter impulse
output is 24 V.
1.2.2.6 The meter constant in operating mode (relationship between the quantity of impulses
formed at the impulse output and the display reading) conforms to Table 12; it is marked on the keypad
module.
Impulse outputs operation mode is set from the display.
There are the following impulse outputs operation modes:

TLAS.411152.002-01 RE
32
- off;
- test output - impulse frequency is proportional to the measured power;
- active power;
- reactive power;
- active loss power;
- reactive loss power;
- active basic frequency power;
- reactive basic frequency power;
- active positive sequence power;
- reactive negative sequence power;
- test output - impulse frequency is proportional to the measured energy;
- Active energy;
- reactive energy;
- active loss energy;
- reactive loss energy;
- active basic frequency energy;
- reactive basic frequency energy;
- active positive sequence energy;
- reactive negative sequence energy;
- test - 1500 Hz signal is formed.
Table 12 - Impulse Output Parameters in Test Mode
BINOM3 Meter Ver-
sion
Constant,
imp./kWh,
imp./kVArh
Normalized frequency,
Hz/W, Hz/VAr
Frequency at no-
minal power, kHz
U3.57I3.1 36000000 10 1.73205
U3.220I3.1 9000000 2.5 1.650
U3.57I3.5 7200000 2 1.73205
U3.220I3.5 1800000 0.5 1.650
As the meter is switched on, the test output is automatically activated in the active energy mea-
surement mode.
1.2.3. Technical Parameters
1.2.3.1 The meter operating mode setting (preheating) time is not more than 20 min.
1.2.3.2 The meter operates in a continuous mode. The duration of continuous operation is unli-
mited.
1.2.3.3 The meter withstands input metering circuits overload with the parameters specified in
Table 13. BINOM3 series meter performance restoration time after current or voltage overload not ex-
ceeding 2 Inom or, respectively, 2 Unom is not more than 120 s.

TLAS.411152.002-01 RE
33
Table 13 - Overload Resistance
Overload Ratio Number of
Overload
Duration of Each
Overload, s
Interval between
Overloads, s
Current
20 2 0.5 0.5
10 2 1 0.5
2 - long-term -
Voltage 2 - long-term -
Error variation after overload at nominal current, voltage and power factor (sinφ coefficient)
equal to one does not exceed:
- 0.1% for currents and voltage;
- 0.2% active power;
- 0.3% for reactive power;
- 0.05% for active power;
- 0.3 % for reactive power.
1.2.3.4 The meter is resistant to voltage dips and short-term interruptions.
BINOM3 meter performance restoration time after the impact of an aperiodical process having 0.1 time
constant and amplitude equal to the current or voltage nominal value does not exceed 120 s.
1.2.4 Communication Channels and Interfaces
BINOM3 meter has the following data independent interfaces:
- RS-485. RS-485/422 for data transmission from the meter over a physical communication line.
The maximum data transmission speed is 460.8 kbit/s, the maximum distance is 600 m. It is also used
for meter synchronization from standard time signal receivers (DF01. GPS).
- Ethernet 10/100Base-T for data transmission via Ethernet. In the process of remote paramete-
rization, this interface can also be used for connecting to the BINOM3 web server built in the meter. Da-
ta transmission speed 100 Mbit/s. Ethernet interface terminals are electrically insulated from all meter
input/output signals.
Screened Ethernet cable must be used at power plants and substations, the screen earthing point
is to be determined by the design.
- RS-232 for data transmission via a physical communication lines, private voice-frequency
channels or a radio channel with the help of an external modem, as well as via GSM network with the
help of a GSM modem. The maximum data transmission speed is 460.8 kbit/s, the maximum distance is
12 m.
- optical interface for contactless meter connection and data exchange with external data processing
devices with the help of an adapter (TX06A communication module). Data transmission speed - 115200
bit/s.
1.2.4.1 Data Exchange with Devices via RS-485 Interface
Data exchange with devices via RS-485 interface may be carried out as per GOST R IEC 60870-
5-101-2006 protocol, whereupon the BINOM3 meter carries out a SLAVE function. The main function
is data transmission from the meter.
RS-485 interface has a built-in polarization from a +3.3 V internal source via a 20 kΩ resistor.

TLAS.411152.002-01 RE
34
1.2.4.2 The parameters of RS-485 interface circuits must conform to the requirements specified
in Table 14.
Table 14 - RS-485 Interface Circuit Parameters
Name Value Meas.
Unit Min. Type Max.
Differential output signal levels at 200 Ω load 2 − − V
Operational range of differential input signal levels 0.5 − 12 V
Number of receivers connected to the same trunk line − − 20 −
Test voltage of galvanic isolation between channel terminals
and module power supply terminals
(active commercial frequency value)
− 4000 − V
1.2.5 Data Processing
1.2.5.1 Energy Metering Data
The meter stores the following kinds of energy metering data:
- energy increment data for every energy meter for two independent time intervals from 1. 2. 3.
4. 5. 6. 10. 12. 15. 20. 30. 60 series (hereinafter, load profiles). Storage depth of the first profile conven-
tionally called a commercial one is 32.768 snapshot, for the second profile (technical) - 21.845 snap-
shots.
- energy meter readings as off the beginning of a natural day by four tariff and totally: 3.574 days
The meter has sixteen electric energy meters:
- consumed active energy;
- produced active energy;
- reactive energy under inductive load;
- reactive energy under capacitive load;
- consumed active energy loss;
- produced active energy loss;
- reactive energy loss under inductive load;
- reactive energy loss under capacitive load;
- consumed basic frequency active energy;
- produced basic frequency active energy;
- reactive basic frequency energy under inductive load;
- reactive basic frequency energy under capacitive load;
- consumed positive sequence active energy;
- produced positive sequence active energy;
- reactive positive sequence energy under inductive load;
- reactive positive sequence energy under capacitive load.

TLAS.411152.002-01 RE
35
1.2.5.2 Meter Logs
The meter keeps two logs One log records the events provided by the requirements of NP Market
Council (JSC TSA) - "TSA Log", the other log records all events generated by the meter - "Events Log".
A code is assigned to every type of event. The events provided by the requirements of NP Market Coun-
cil have codes meeting the requirements of the NP Market Council.
The event log records the following classes of events:
- power supply subsystem events:
BINOM3 meter restart;
meter cutoff;
- real time subsystem events:
time correction;
synchronization;
real time clock fault;
- data protection subsystem events:
unauthorized access attempt (incorrect password entry, covers tampering);
parameterization data change;
- energy metering events and excess of user-set range of the following parameters:
first sequence current (the average for 10 network periods - ~ 0.2 s);
first sequence voltages (the average for 10 network periods);
active power (sums of phase power modules) (the average for 10 network periods);
excesses of active energy consumption during the commercial metering interval;
electric energy metering interruption;
overload of any input;
voltage loss;
- change in electric energy quality parameters:
voltage deviation value and date/time;
voltage dip duration, depth and date/time;
overvoltage duration and date/time;
voltage asymmetry ratio by negative sequence;
voltage asymmetry ratio by zero sequence;
frequency deviation
Logs data are stored in the BINOM3 meter non-volatile memory. The volume of the "Events
Log" is 65535 entries, the volume of the "TSA Log" is 16384 entries.
The logs may be read with the help of BINOM3 Web server.
TLAS.411152.002-01 RE
36
Frame formats for logs data transmission via communication channels, event formats and codes,
event distribution in logs are described in the document "BINOM3 Series Multifunctional Electric Ener-
gy Quality Meters". Interaction Protocols. TLAS.411152.002 D1».
1.2.6 Data Protection
1.2.6.1 Data Security
The following data security measures are provided in the BINOM3 meter:
- mechanical sealing of the terminal cover;
- electronic cover tampering sensors operating when the meter is on;
- software protection with the help of digital passwords making it possible to distribute rights be-
tween several access levels (including separate time correction, interfaces setting, parameters change);
- reading permit;
- writing/configuration change permit.
Data reading password allows to read data via a Web interface.
Data change password allows to change the meter configuration and the automated informative
electric power accounting system settings.
The following measures are provided for data protection against unauthorized access via digital
data exchange interfaces:
- mechanical closing of connectors with a sealable terminal cover;
- built-in Web server software access level settable during user parameterization;
Passwords changes, incorrect password access attempts are recorded in event logs.
1.2.6.2 Data Protection Against Change
The following measures are provided in the BINOM3 series meter for data protection against
change:
it is impossible (there are no commands) to change measured parameters and energy me-
tering parameters, including those of the main increment total meters;
blocking the meter current time in case of synchronization period violation (frequent syn-
chronizations are rejected) and in case of excess of established time correction value with recording of
the event in the event logs. During a single synchronization cycle, time is corrected during parameteriza-
tion;
meter operation is blocked when the clock operates incorrectly or in case of current time
loss, whereupon clock fault is recorded in event logs;
the event of authorized meter parameterization change is recorded in log events, includ-
ing energy metering parameters;
it is impossible to make changes to the log events.
1.2.7 Remote Control Functions Characteristics
BINOM3 meters as remote control devices meet the requirements of
GOST 26.205-88. GOST 26.013-81. GOST R IEC 870-3-93. GOST IEC 60870-4-2011. GOST R IEC
60870-5-104-2004. GOST R IEC 60870-5-101-2006.

TLAS.411152.002-01 RE
37
According to GOST R IEC 870-4-93 classification, a BINOM3 meter complies with the following
classes:
- reliability: R3;
- data transmission validity: I2 and I3 for control commands acquisition;
- readiness: A3;
- repairability: RT1 (Тр ≤ 2 h) (by replacing the meter or the TE3xRx relay block);
- timing resolution: SP4 (≤ 1 ms);
- remote signaling priority resolution: TR4 (≤ 1 ms).
In case there is no data exchange via communication channels, the most recent events are saved in
the event queue.
1.2.7.1 Remote Signaling (RS) Acquisition Parameters
Rs inputs are discrete inputs for connection of two-position contact and contactless position sen-
sors: dry contact sensors, electronic keys, Hall sensors, electronic relays, etc. The characteristics of
BINOM3 meter discrete inputs are presented in Table 15.
Table 15 - Discrete Input Characteristics
Parameter Min. Type Max. Meas.
Unit
Low level signal 1)
− 1.2 0 + 10.4 V
High level signal 1)
+ 11.5 24 + 30 V
Open sensor terminals voltage 23 24 25 V
Closed sensor resistance 0 – 150 Ω
Open sensor resistance 50 – ∞ kΩ
Closed sensor current
(current class 1 as per GOST R IEC 870-3-93)
1
2
5
mA
Sensors scanning period – – 100 µs
Interference and overload protection class as per GOST R IEC
870-3
– 2 –
1) - The table presents input signal level values set by the manufacturer.
An isolated +24 V power source is provided in the BINOM3 meter for powering passive RS me-
ters. Its parameters are presented in Table 16.
Table 16 - Built-in RS Sensors Power Source Characteristics
Characteristic Name Value Class
Nominal DC voltage Unom, V:
- minimum;
- maximum
24
23.5
24.5
DCx as per GOST R 51179-98
E-, E
+, EF classes with a 1 Ω
shunting resistor as per GOST R
51179 Output current, mA
- minimum;
- maximum
0
80
Voltage ripple factor (from the nominal voltage), %
5
VR3 class GOST R 51179-98
Instability, % 1

TLAS.411152.002-01 RE
38
1.2.7.2 Remote control Parameters Characteristics
Remote control outputs are passive binary output signals (in GOST R IEC 870-3-93 terms) in-
tended for control circuits connection and discrete adjustment of objects. Remote control output are ar-
ranged binominally and implemented as a separate TE37Rx or TE38Rx relay block.
Each remote control channel contains three relays:
- ON activation command (connection of switching device drives enabling circuits),
- OFF trip command (connection of switching device drives disabling circuits and automatic rec-
loser actuation blocking),
- choice of channel - main cross group.
The block also includes an additional relay intended for protection of relay contacts in the
process of controlling switching devices with a large inductive load (EIS): electromagnetic in a TE38Rx
relay block, solid-state in a TE37Rx block. The contacts of all relays are normally open.
Functionally the BINOM3 meter subassembly implementing remote control functions has the
following parameters:
- diagnostics including a check of relay coil resistance;
- software bugs and breakdowns protection and protection from various types of power
source breakdowns.
Self-diagnostics is carried out cyclically every 10 s (a settable parameter) and in the process of
the "Remote control Preparation" command fulfilment.
Only one remote control channel at a time may be in an activated state.
Electrical and time remote control parameters with regard for characteristics of relay block re-
mote control outputs are presented in Table 17.
Table 17 – Requirements for Discrete Output Characteristics
Characteristic Min. Type Max. Meas.
Unit
Switched AC voltage 0.5 – 250 V
Switched AC current 0.05 – 5 А
Switched DC voltage 0.5 – 250 V
Switched DC current
- at 24 V voltage
- at 220 V voltage
- at 250 V voltage
0.05
0.05
0.05
-
8
0.1/ 5 1)
3 1)
А
Relay closing time 0.25
2)
0.53)
1 10 s
Interference and overload protection class as per GOST R
IEC 870-3-93
– 2 –
1) – When a solid-state relay is used in the relay block (ТЕ37Rx).
2) – for a solid-state relay.
3) – for an electromagnetic relay.

TLAS.411152.002-01 RE
39
1.2.8. Electric Power Supply
All versions of BINOM3 meters are powered from the following sources:
- from AC mains;
- from DC control current mains;
- from an external backup DC power source intended for power supply in case of the main power
source failure;
- from an internal backup power supply intended, among other things, for a clean task termina-
tion and the meter shutdown in case of the main power source failure.
1.2.8.1 Parameters of Main and Backup Electric Power Supply from DC Control Current Mains
The parameters of main and backup power supply from a DC power source are presented in Ta-
ble 18.
Table 18 - Parameters of Electric Power Supply from DC Control Current Mains
Name Value Meas.
Unit Note
Nominal voltage 220 V
Expanded working voltage range from 125 to
350
V DCx class, GOST R 51179
Voltage ripple factor (from the nominal
voltage) 5 % VR3 class, GOST R 51179
Earth for DC power source Any class GOST R 51179
Steady-state average meter consumption current (Iav=) from DC mains at 220 V voltage - 0.04 A
(reference).
1.2.8.2 Parameters of Electric Power Supply from AC Mains
The parameters of electric power supply from AC mains are presented in Table 19.
Table 19 - Parameters of Electric Power Supply from AC Mains
Name Value Meas.
Unit Note
Nominal voltage 220 V
Expanded working voltage range 90 to 265 V ACx class, GOST R 51179
Nominal frequency 50 Hz
Expanded working frequency
range
47 to 63 Hz
Unsinusoidality, maximum 10 % H2 class, GOST R 51179
ATTENTION!
SIMULTANEOUS CONNECTION TO DC AND AC MAINS IS NOT SUPPORTED.
POWER MAINS (≈/= 220 V) MUST HAVE AN EARTH WIRE.
Recommendations on the matters of power circuits connection are presented in Cl. 2.7.4.
1.2.8.3 Parameters of Internal Backup Power Supply
Internal power source must ensure:
- at least 30 min continuous operation time;

TLAS.411152.002-01 RE
40
- at least 24 h loading time;
- the number of load/unload cycles with retention of declared continuous operation time is not
more than 500 (ensured by battery characteristics).
1.2.9 Power Consumption
Power consumed by the meter:
- over AC power supply circuits - not more than 9 W (20 VA), peak load not more than 12 W.
- over Dc power supply circuits - not more than 9 W, peak load not more than 12 W.
The power consumed by the meter over each input circuit at nominal current and voltage values
is presented in Table 20.
Table 20 - Power Consumed by the Meter via Input Circuit
Input Circuit Nominal value Consumed In-
put Circuit Power
Deviation (Reference)
Nature of Load (for Reference)
Current 5 A 0.05 VA not more Inductive,
less than 10 µH
Current 1 A 0.01 VA not more Inductive,
less than 100 µH Voltage 57.7 V 0.02 W
± 5 % Active Voltage 220 V 0.1 W
1.2.10 Heat and Fire Resistance
BINOM3 series meters are resistant against heating and fire in compliance with the requirements
of GOST 31818.11-2012. The clamping plate, flap lid, clamps, body and keypad ensure fire propagation
safety and comply to GOST 12.1.004-91, GOST 27483-87. GOST 27924-88.
1.2.11 Environmental Stability
The meters have 3K5 class of ambient air temperature and humidity resistance in operation as
per GOST 31818.11-2012 with range expansion towards low temperatures (established operational tem-
peratures range from minus 40 to plus 45 С, relative humidity up to 95% at plus 35 С temperature).
Table 21 - 3K5 Climatic Impact Class Characteristic
Relative Humidity Relative Humidity Val-
ue, %
Average annual
30-days, distributed naturally throughout a year
Rarely (occasionally) taking place at other days
Less than 75
95
85
Mechanic impacts on the parameters not specified in GOST 31818.11-2012 comply to group 4.
GOST 22261-94. group М7. GOST 30631-99.
The meters are resistant to atmospheric pressure from 70 to 106.7 kPa (from 537 to 800 mm Hg).
BINOM3 meters have IP51 ingress protection as per GOST 14254-96.

TLAS.411152.002-01 RE
41
1.2.12 Electromagnetic Compatibility
As regards electromagnetic compatibility, BINOM3 series meters meet the requirements of
GOST 31818.11-2012. GOST Р 51317.6.5-2006 and STO 56947007-29.240.044. Federal Grid Compa-
ny JSC.
BINOM3 meters interference emission meets the requirements of
GOST 31818.11-2012 and GOST 30805.22-2013 for A class equipment.
Under GOST 5 51317.6.5. test strictness grade is established for the technical facilities intended
for use at power plants and high voltage substations (Н).
GOST R 51317.6.5 requirements for field-type connection (f) signal ports were applied to
RS-485. SYNC and Ethernet ports.
Requirements for field type connection (f) signal ports were applied to RS-232 and RS-485/422
interface ports subject to the use of a screened cable with a earthed screen or, should using a cable be
impossible, the use of ЕМ337 external protection block (TLAS.426475.001).
The full list of requirements is presented in Table 22.
Table 22 - BINOM3 Series Meters Electromagnetic Compatibility Requirements
№
Type of Tests Test Parameters
De-
gree
of
Strict
ness
Regulatory
Document
1 Evanescent oscillatory magnetic
field resistance 100 A/m 5 GOST R 50652
Enclosure port
2 Commercial frequency magnetic
field resistance
long-term: 100 A/m
short-term: 1000 A/m
5
5 GOST R 50648
3 Radiated radio-frequency electro-
magnetic fields resistance.
test field intensity:
10 V/m with energized circuits,
30 V/m with energized circuits,
3
4
GOST
30804.4.3
4 Impulse magnetic field resistance. 1000 A/m 5 GOST R 50649
5 Static electric discharge resistance.
contact discharge +8 kV,
air discharge +15 kV 4
GOST
30804.4.3
Signal Ports (RS-485. Ethernet, RS-485/422. RS-232. SYNC, TS, TU2), Measuring Ports)
6 Resistance to oscillatory damped
interference
Field (RS-485. SYNC, Ethernet1)
,ТС,ТУ2)
)
single-time 2 kV [P-Z], 1 kV [P-P]
cyclic 1 kV [P-Z], 0.5 kV [P-P]
RS-485/422 1)
, RS-232 1)
single-time 2 kV, cyclic 1 kV
metering circuits from TT and TN
single-time 4 kV [P-Z], 2 kV [P-P]
cyclic 2.5 kV [P-Z], 1 kV [P-P]
3
2
3.2
4
3
GOST R
51317.4.12

TLAS.411152.002-01 RE
42
Table 22 (Continued)
№ Type of Tests Test Parameters
Degree of
Strictness
Regulatory Doc-
ument
7 High-energy microsecond im-
pulse interference resistance
Field (RS-485. SYNC, RS, RC 2)
)
2 kV [P-Z],
1 kV [P-P]
metering circuits from TT and TN
4 kV [P-Z],
4 kV [P-P]
3
2
4
4
GOST R 51317.4.5
Ethernet 1)
, RS-485/422 1)
, RS-232 1)
2 kV
3
8 Nanosecond impulse interfe-
rence resistance
RS-485. SYNC, Ethernet, TS, TU 2
RS-485/422 1)
, RS-232 1)
4 kV
metering circuits from TT and TN
4 kV
4
4
GOST 30804.4.4
9 Conductive interference resis-
tance within 150 kHz to 80
MHz frequency band
10 V 3 GOST R 51317.4.6
DC Power Supply Ports
10 Resistance to
- voltage dips
- voltage interruptions
30 % (1 s); 60 % (0.1 s)
100 % (0.5 s)
GOST R 51317.6.5
11 DC voltage ripple resistance ripple not exceeding 10%. 3
GOST R 51317.4.17.
GOST R 51317.6.5 12 Conductive interference resis-
tance within 0 to 150 kHz fre-quency band
30 V (long-term); 100 V (1 s)
4 GOST R
51317.4.16. GOST R 51317.6.5
13 High-energy microsecond im-pulse interference resistance
2 kV [P-Z] 1 kV [P-P]
3 2
GOST R 51317.4.5
14 Nanosecond impulse interfe-rence resistance
4 kV 4 GOST 30804.4.4
15 Conductive interference resis-tance within 150 kHz to 80 MHz frequency band
10 V 3 GOST R 51317.4.6 GOST R 51317.6.5
16 Resistance to oscillatory damped interference
single-time 2 kV [P-P], 4 kV [P-Z] cyclic 2.5 kV [P-Z], 1 kV [P-P]
4 3
GOST R 51317.4.12 GOST R 51317.6.5
AC Power Supply Ports 17 Voltage dips resistance 3 class electromagnetic situation
0% Uт (0.5 period), 0% Uт (1 period),
40% Uт (10 periods), 70% Uт (25 periods), 80% Uт (250 periods)
-
GOST 30804.4.11
18 Voltage interruptions resis-tance
3 class electromagnetic situation 0% Uт (250 periods)
-
19 Dynamic power voltage varia-tions resistance
3 class electromagnetic situation 70% Uт test voltage level;
voltage drop - sharp; reduced voltage exposure time - 1 pe-
riod; voltage increase time - 25 periods
3
20 Resistance to harmonics and
interharmonic in AC mains
voltage
3 class electromagnetic situation
up to 12 %
+ 20 %
- GOST 30804.4.13
21 Voltage interruptions resis-
tance 3
GOST R
51317.4.14

TLAS.411152.002-01 RE
43
22 AC mains power supply frequency
change resistance ± 15% nominal frequency 4
GOST R
51317.4.28
23 Conductive interference resistance
within 150 kHz to 80 MHz fre-
quency band
10 V 3 GOST R 51317.4.6
24 Oscillatory damped interference re-sistance
single-time 4 kV [P-Z], 2 kV [P-P]
cyclic 2.5 kV [P-Z], 1 kV [P-P]
4 3
GOST R 51317.4.12
25 Nanosecond impulse interference
resistance 4 kV 4 GOST 30804.4.4
26 High-energy microsecond impulse
interference resistance
4 kV [P-Z]
4 kV [P-P]
4
3 GOST R 51317.4.5
Interference Emission
27 Equipment radio interference. In-
terference emission. As per GOST for А class
equipment
GOST 30805.22
GOST R 51318.11 1)
– when using a screened cable or an external protection block. 2)
– understood as ТU1 º ТUx output of ТЕ3хRx relay block (depending on the version). ATTENTION! THIS PRODUCT BELONGS TO A CLASS EQUIPMENT. WHEN USED IN HOUSEHOLD SETTING, THIS EQUIPMENT MAY INTERFERE WITH FUNCTIONING OF OTHER TECHNICAL FACILITIES AS A RESULT OF INDUSTRIAL RADIO INTERFERENCE CREATED BY IT. IN THIS CASE, USER MAY BE REQUIRED TO TAKE ADEQUATE MEASURES.
1.2.13 Reliability
The meter mean time between failures (Т0) under normal conditions is at least 150.000 h.
Average service time (Тav.ser.t) is thirty years.
The meter mean time to repair (Тr) performed by replacement from SPTA, including configur-
ing, does not exceed 2 h.
1.3 BINOM3 Series Meters Arrangement and Scope of Delivery
BINOM3 series meters arrangement corresponds to TLAS.411152.002 set of design documenta-
tion. The meter includes:
- TP337A processor module TLAS.426469.014;
- TU337A measuring module TLAS.426444.027 in the respective version;
- RS/RC TS337A TLAS.426444.029 for meters with RS and/or RC functions;
- MS337A TLAS.426458.025 keypad module;
- software for all meter versions: 80508103.00052-01.
The meter scope of delivery is presented in Table 23.

TLAS.411152.002-01 RE
44
Table 23 - Scope of Delivery
Name Document Designation Quantity
BINOM3 series multifunctional meter - electric energy
quality characteristics multifunctional measurement
device.
TU 4228-008-80508103-2014 1 pc.
Box TLAS.735321.005 1 pc.
Screws ВМ5x20.36.019 GOST 1491-80 3 pc.
microSD card 1 pc.
TE3хRх relay block TLAS.426458.026 1 pc.
Documentation
Datasheet TLAS.411152.002-01 PS 1 pc.
Operation Manual1)
TLAS.411152.002-01 RE 1 pc.
Verification procedure2)
TLAS.411152.002 PM 1 pc.
BINOM3 Web server. Operator's manual 80508103.00053-01 34 01 1 pc. 1)
- Depending on the number of RCs and type of relays for meter versions with the remote control
option. 2)
– When a batch of meters is delivered, 1 copy of Operation Manual per 10 meters is included in
the scope of delivery. 3)
– Sent upon request of organizations carrying out meters verification.
The BINOM3 series meters scope of delivery may include additional accessories supplied on
separate orders: TX06A communication module, a cabinet, a microclimate system, a charge battery
with a fastening, charge battery microclimate system, RS-232/RS-485 transducer, a measuring termin-
al strip.
1.4 Meter Structure and Functioning
The structural diagram of a BINOM3 series meter as exemplified by a BINOM337 meter (in-
cluding connector pins assignment) is presented in Figure 1.
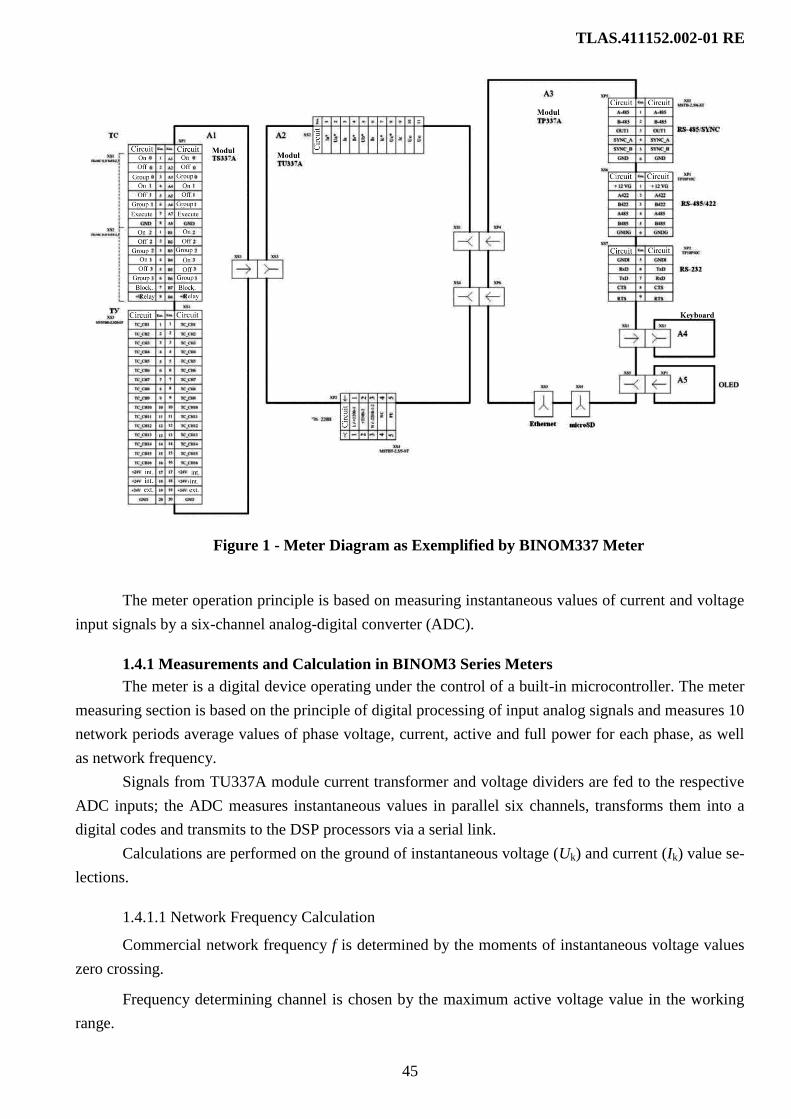
TLAS.411152.002-01 RE
45
Figure 1 - Meter Diagram as Exemplified by BINOM337 Meter
The meter operation principle is based on measuring instantaneous values of current and voltage
input signals by a six-channel analog-digital converter (ADC).
1.4.1 Measurements and Calculation in BINOM3 Series Meters
The meter is a digital device operating under the control of a built-in microcontroller. The meter
measuring section is based on the principle of digital processing of input analog signals and measures 10
network periods average values of phase voltage, current, active and full power for each phase, as well
as network frequency.
Signals from TU337A module current transformer and voltage dividers are fed to the respective
ADC inputs; the ADC measures instantaneous values in parallel six channels, transforms them into a
digital codes and transmits to the DSP processors via a serial link.
Calculations are performed on the ground of instantaneous voltage (Uk) and current (Ik) value se-
lections.
1.4.1.1 Network Frequency Calculation
Commercial network frequency f is determined by the moments of instantaneous voltage values
zero crossing.
Frequency determining channel is chosen by the maximum active voltage value in the working
range.

TLAS.411152.002-01 RE
46
1.4.1.2 Calculations of Active Current and Voltage Values
Root mean square values of currents and phase voltages are calculated by the following formu-
las:
, (1)
, (2)
. (3)
, (4)
(5)
(6)
where index n indicates a harmonic number, k, an interharmonic number.
Root mean square values of basic frequency currents and phase voltages are calculated by the
following formulas:
, , (7, 8, 9)
, (10, 11, 12)
Root mean square values of linear (interphase) voltages are calculated by the following formulas:
, (13)
, (14)
, (15)
where
, , (16, 17, 18)

TLAS.411152.002-01 RE
47
Root mean square values of linear (interphase) basic frequency voltages are calculated by the
following formulas:
, , (19, 20, 21)
1.4.1.3 Calculations of Root Mean Square Current and Voltage Values
Calculations are performed by a BINOM334i meters microcontroller by formulas 22 - 24.
(22)
, (23)
(24)
where IA,IB,IC; UA,UB,UC; UAB,UBC,UCA are root mean square values of currents, phase and linear (inter-
phase) voltages calculated by formulas (1-3), (4-6), (13-15) respectively.
1.4.1.4 Calculation of Currents and Voltages Symmetric Components
First harmonic vectors of phase currents and voltages discreet
Fourier transformation (DFT) are calculated. Active values of current and voltage symmetric compo-
nents are calculated by the formulas:
, (25)
, (26)
, (27)
(28)
, (29)
, (30)
where i is an imaginary unit.
1.4.1.5 Phase Shift Angles Calculation
Phase shift angle between basic frequency phase voltages is calculated with the help of discrete
Fourier transformation first harmonic vectors:
, (31)
, (32)
. (33)
Phase shift angle between basic frequency phase currents is calculated with the help of discrete
Fourier transformation first harmonic vectors:
, (34)
, (35)

TLAS.411152.002-01 RE
48
. (36)
Phase shift angle of the nth phase current harmonic component and the nth phase voltage har-
monic component is calculated with the help of discrete Fourier transformation nth harmonic vectors:
, (37)
, (38)
. (39)
Phase shift angle between symmetric components of voltage and current of same name is calcu-
lated with the help of symmetric component vectors:
, (40)
, (41)
. (42)
1.4.1.6 Power and Energy Calculations
Single-phase active PX(n) and reactive QX(n) harmonics powers are calculated:
, (43)
(44)
where is difference between n-harmonic component current and voltage phases.
Single-phase active P and reactive Q powers are, respectively, equal to:
, (45)
. (46)
Full single-phase SX power and single-phase power factor PFX are calculated by the following
formulas:
, (47)
, (48)
where n is harmonic number (1-50);
X – hereinafter corresponds to phases A, B, C.
Three-phase power S is calculated by the formula:
, (49)
, (50)
, (51)
where PA, PB, PC, QA, QB, QC и SA, SB, SC are calculated by formulas (45 -47).

TLAS.411152.002-01 RE
49
Three-phase power factor is calculated by the following formula:
. (52)
Threshold power Sthr at which the meter starts metering energy is not more than
Sthr ≤ 25∙10-4
∙0.2∙Snom, where Snom = 3∙Inom∙Unom (kV∙A).
Positive, negative and zero sequence active P1. P2. P0. reactive Q1. Q2. Q0 and full powers S1.
S2. S0 are calculated by the following formulas
, (53)
, (54)
, (55)
, (56)
, (57)
, (58)
, (59)
, (60)
. (61)
Active energy and reactive energy are calculated by active and reactive power values determined
for 10 network periods (~0.2 s). In the process of energy measurements, quadrant number is determined
by power signs. The diagram of active and reactive energy distribution by quadrants is presented in Fig-
ure 2. (the diagram corresponds to GOST 31819.23-2012).
Figure 2 - Diagram of Active and Reactive Energy Distribution by Quadrants
TLAS.411152.002-01 RE
50
1.4.1.7 Loss Metering
BINOM334i meters can meter line and transformer electric energy losses (load losses and semi-
constant losses). There are two losses metering methods.
The algorithm of active losses calculation (+ Wla, − Wla) is presented in Figure 3. The algorithm
of totaling and determining direction in the process of losses metering is presented in Figure 4. Reactive
losses (+ Wlr, − Wlr) are calculated in a similar manner.
When currents (power) are below the meter sensitivity threshold, total power (Pn) measured by
the meter will be equal to zero and the transformer no-load losses will be classified as positive metering
direction.
Losses metering coefficient values are preliminarily calculated according to transformer and line
equivalent circuits and with the utilization of transformer nameplate data and line parameters (specific
resistance, length, laying conditions).
The sum of any phase active loss factors must be within the range from 0.1% to 25%.
The sum of any phase reactive loss factors must be within the range from 0.1% to 25% in abso-
lute magnitude.
In case complete metering of losses (active and reactive line and transformer losses metering) is
not carried out, the respective coefficients must be equal to zero.
E.g., it is necessary to meter only line losses - all transformer loss factors must be equal to zero.
Losses metering activation and the data needed for losses metering are entered into the meter in
the respective page of the BINOM334i Web server built in the meter.
Loss factors shall be established separately for each phase, their values shall be entered in per-
centage form.
The following factors must be set for metering load losses (proportional to current square):
KPline - active line losses metering
KQline - reactive line losses metering
KPtransformer - active transformer copper losses metering;
KQtransformer - reactive transformer copper losses metering;
The following factors must be set for metering semi-constant losses (transformer iron losses pro-
portional to square of voltage):
KPUtransformer - active transformer iron losses metering;
KQUtransformer - reactive transformer iron losses metering;

TLAS.411152.002-01 RE
51
Figure 3 - Active Energy Losses. Phase Losses Calculation Algorithm
The following designations are used in the active energy phase losses calculation algorithm:
I – active (root mean square) phase current value;
Inom. – meter nominal current value (1 A or 5 A);
U - active (root mean square) value of:
- phase voltage (four-wire connection diagram);
- interphase voltage (three-wire connection diagram);
Unom. – meter nominal voltage value:
- 57.735 V or 220 В (four-wire connection diagram);
- 100 V (√3∙57.735 В) or 381.051 В (√3∙220 V) (three-wire connection diagram)
KPI - load loss factor, KPI = KPline + KPtransformer;
KPU - semi-constant loss factor, KPU = KPUtransformer.
Figure 4 - Algorithm of Totaling and Determining Direction in the Process of Loss Metering

TLAS.411152.002-01 RE
52
The following designation are used in the algorithm of totaling and determining direction in the
process of loss metering:
f(t) phase loss functions;
sign (Ptotal) - total metered power sign; + 1. − 1;
+ Wl, − Wl - loss energy values for two directions.
1.4.2 Quality Indicator Calculations
Electric energy quality calculations and assessment of electric energy quality indicators confor-
mity to standard values are carried out according to the guidelines of
GOST 30804.4.30-2013. RD 153034.0-15.501-00. GOST 30804.4.7-2013. GOST Р 51317.4.15-2012.
GOST 32144-2013. GOST 33073-2014.
1.4.2.1 Measurement Results Processing during Energy Quality Indicators Calculation
Energy quality indicators measurement is carried out on the basis of current and voltage instan-
taneous values selection and root mean square values calculation. 10 base currency period were adopted
as the base time interval in the process of energy quality indicators measurement, except accidental
event parameters. For detection and assessment of accidental events, root mean square voltage values
are calculated over a basic frequency semiperiod.
For obtaining electric energy quality indicator values during long time intervals, measurement
results obtained during basic time intervals are averaged (united). An averaged value is equal to square
root of the arithmetic mean of input value squares. Electric energy quality indicators averaging intervals
were set in the meter standard configuration settings as per Table 5. Averaging intervals may be
changed by the user.
Statistical processing of electric energy quality indicators measurement results is carried out dur-
ing the monitoring period equal to one (1) week as per GOST 32144-2013; this period may be changed
by the user in the meter configuration settings. For statistical processing, all values of each electric ener-
gy quality indicator measured during the monitoring period are arranged by in ascending order on the
number axis (from the smallest to the largest) and statistical characteristics are determined and com-
pared with standard values:
- the largest value (the limit below which 100% of measured values are located),
- the upper value (the limit below which 95 % of measured values are located),
- relative time of normally permissible values range excess Т1.
- relative time of measurement results' maximum permissible values range excess Т2.
Т1 and Т2 are calculated by the following formulas:
(62, 63)
where M1 is the number of measurement results exceeding the range of normally permissible
M2 is the number of measurement results exceeding the range of permissible limit values,
M∑ is the total number of measurement results obtained during the monitoring period.

TLAS.411152.002-01 RE
53
Table 24 - Structure of Electric Energy Quality Indicator Characteristics
Type of stat.
chrematistics
Input Parameters for Statistical Processing
δU(–)у δU(+)у уnUK )(
UуK UуK2
UуK0 stP
ltP 10)(f
10)(f
The largest
value
δU(–) δU(+) %)100)((nUK
%)100(UK
%)100(2UK
%)100(0UK
stP
ltP %)100)((f
%)100)((f
The upper
value
- - %)95)((nUK
%)95(UK %)95(2UK
%)95(0UK - - %)95)((f
%)95)((f
1Т - - 1Т
1Т 1Т
1Т - - 1Т
1Т
2Т 2Т
2Т 2Т
2Т 2Т
2Т 2Т
2Т 2Т
2Т
In the process of electric energy quality indicators, data (measurement results and averaged elec-
tric energy quality indicators over the time intervals during which voltage interruptions or dips and
overvoltages occurred) are marked (designated). Marking is used in order to avoid recording the same
event more than once for different indicators (i.e., recording a voltage dip as a voltage dip and a fre-
quency deviation at the same time). Measurement results obtained over marked basic time intervals (10
periods) are excluded from calculations in all subsequent time intervals. While calculating T1 и T2,
marked values were excluded from parameters M1. M2 и М∑.
The results of electric energy tests are recorded in a Electric Energy Test Report executed on the
form recommended by GOST 33073-2014.
4.1.2.2 Frequency Deviation Calculation
Frequency deviation 10f is calculated over a 10 s measurement interval by the formula:
, (64)
where fnom is the nominal frequency value equal to 50 Hz.
f10 is frequency value over a 10 s interval:
, (65)
where fi is the frequency value measured over the ith basic time interval by zero crossing mo-
ments of instantaneous basic frequency voltage values;
i is the sequence number of the basic time interval within the averaging interval;
N is the number of basic time intervals in the averaging interval.
Negative frequency deviation over a 10 s interval:
(66)
is defined using the following rule:
if
if

TLAS.411152.002-01 RE
54
Positive frequency deviation over a 10 s interval:
(67)
is defined using the following rule:
if
if
4.1.2.3 Positive and Negative Voltage Deviation Calculation
Positive and negative voltage deviations are calculated on the basis of root mean square voltage
values measured over basic time intervals during an averaging interval set in the meter configuration
settings.
Negative voltage deviation over an averaging interval δU(–)у:
, (68)
where δU(–)у is negative deviation of phase δUA(–)у, δUB(–)у, δUC(–)у and line voltage δUAB(–)у,
δUBC(–)у, δUCA(–)у over an averaging interval;
is voltage equal to standard nominal or approved value (set in the meter configuration settings);
is defined using the following rule:
if (69)
if (70)
is root mean square value of the respective voltage measured over the ith basic time interval
(UAi, UBi, UCi, UABi, UBCi, UCAi) according to (); root mean square voltage value includes harmonics and
interharmonics;
N is the number of basic time intervals in the averaging interval.
Positive voltage deviation over an averaging interval δU(+)у:
(71)
where δU(+)у is negative deviation of phase δUA(+)у, δUB(+)у, δUC(+)у and line voltage δUAB(+)у,
δUBC(+)у, δUCA(+)у over an averaging interval;
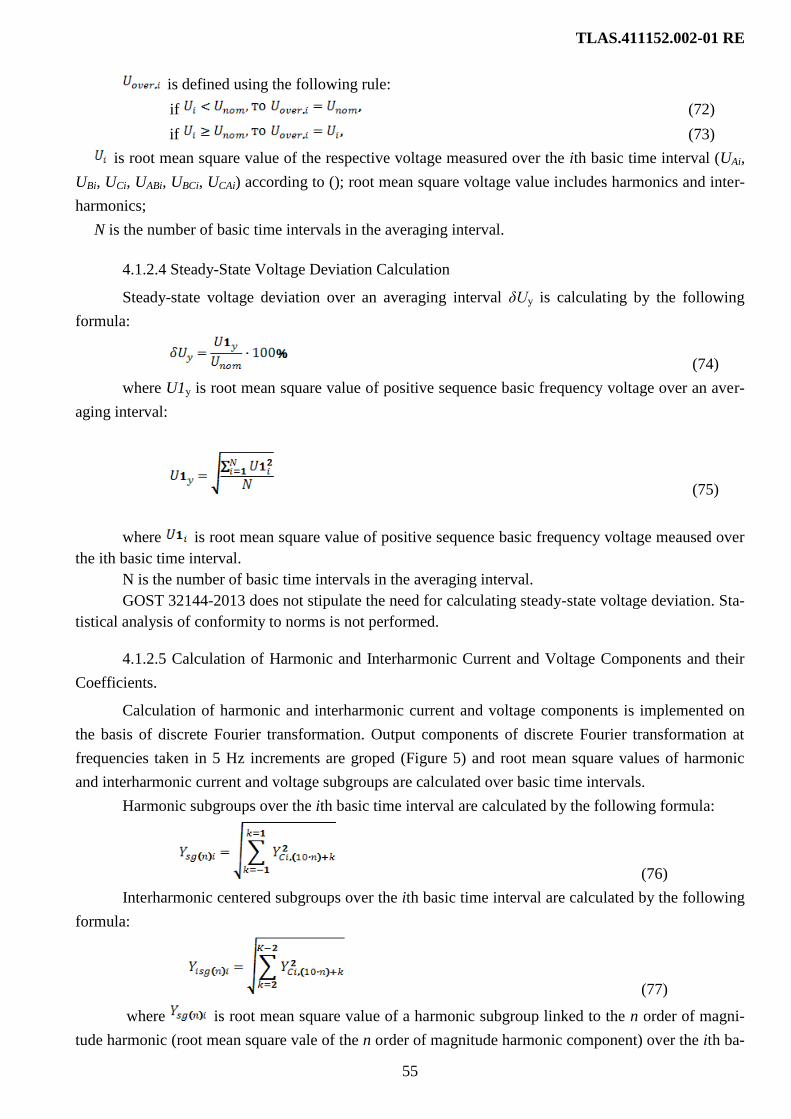
TLAS.411152.002-01 RE
55
is defined using the following rule:
if (72)
if (73)
is root mean square value of the respective voltage measured over the ith basic time interval (UAi,
UBi, UCi, UABi, UBCi, UCAi) according to (); root mean square voltage value includes harmonics and inter-
harmonics;
N is the number of basic time intervals in the averaging interval.
4.1.2.4 Steady-State Voltage Deviation Calculation
Steady-state voltage deviation over an averaging interval δUу is calculating by the following
formula:
(74)
where U1у is root mean square value of positive sequence basic frequency voltage over an aver-
aging interval:
(75)
where is root mean square value of positive sequence basic frequency voltage meaused over
the ith basic time interval.
N is the number of basic time intervals in the averaging interval.
GOST 32144-2013 does not stipulate the need for calculating steady-state voltage deviation. Sta-
tistical analysis of conformity to norms is not performed.
4.1.2.5 Calculation of Harmonic and Interharmonic Current and Voltage Components and their
Coefficients.
Calculation of harmonic and interharmonic current and voltage components is implemented on
the basis of discrete Fourier transformation. Output components of discrete Fourier transformation at
frequencies taken in 5 Hz increments are groped (Figure 5) and root mean square values of harmonic
and interharmonic current and voltage subgroups are calculated over basic time intervals.
Harmonic subgroups over the ith basic time interval are calculated by the following formula:
(76)
Interharmonic centered subgroups over the ith basic time interval are calculated by the following
formula:
(77)
where is root mean square value of a harmonic subgroup linked to the n order of magni-
tude harmonic (root mean square vale of the n order of magnitude harmonic component) over the ith ba-
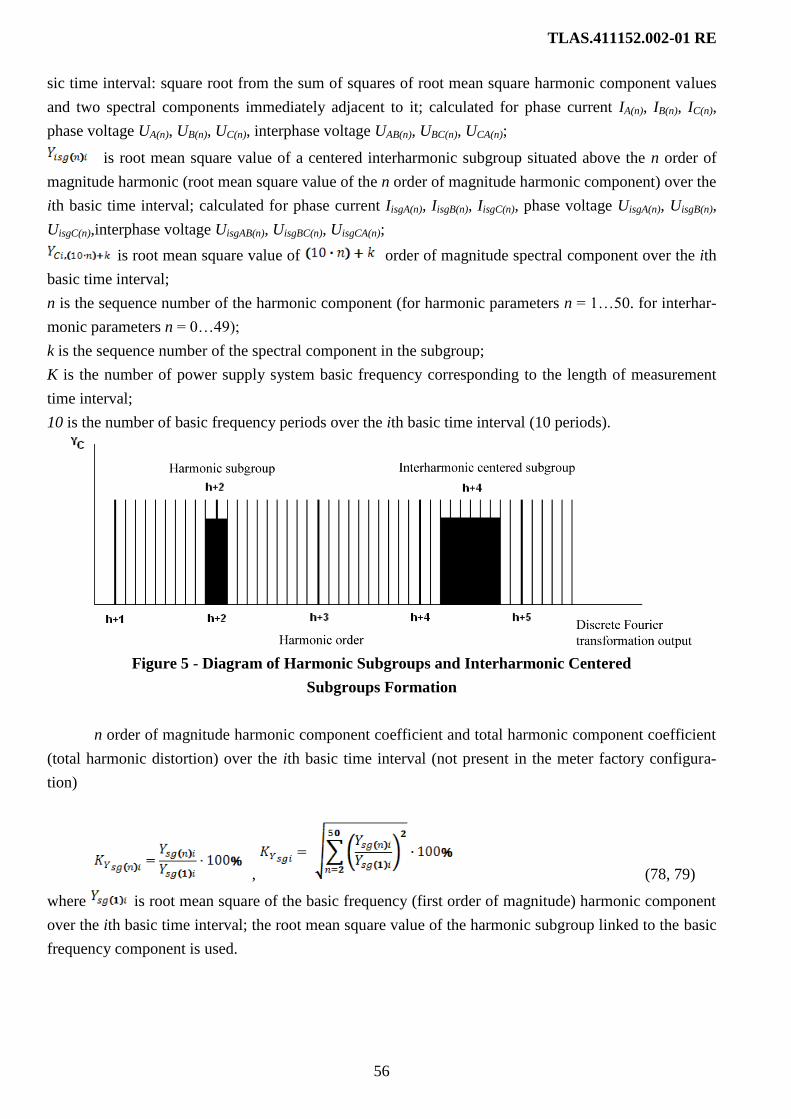
TLAS.411152.002-01 RE
56
sic time interval: square root from the sum of squares of root mean square harmonic component values
and two spectral components immediately adjacent to it; calculated for phase current IA(n), IB(n), IC(n),
phase voltage UA(n), UB(n), UC(n), interphase voltage UAB(n), UBC(n), UCA(n);
is root mean square value of a centered interharmonic subgroup situated above the n order of
magnitude harmonic (root mean square value of the n order of magnitude harmonic component) over the
ith basic time interval; calculated for phase current IisgA(n), IisgB(n), IisgC(n), phase voltage UisgA(n), UisgB(n),
UisgC(n),interphase voltage UisgAB(n), UisgBC(n), UisgCA(n);
is root mean square value of order of magnitude spectral component over the ith
basic time interval;
n is the sequence number of the harmonic component (for harmonic parameters n = 1…50. for interhar-
monic parameters n = 0…49);
k is the sequence number of the spectral component in the subgroup;
K is the number of power supply system basic frequency corresponding to the length of measurement
time interval;
10 is the number of basic frequency periods over the ith basic time interval (10 periods).
Figure 5 - Diagram of Harmonic Subgroups and Interharmonic Centered
Subgroups Formation
n order of magnitude harmonic component coefficient and total harmonic component coefficient
(total harmonic distortion) over the ith basic time interval (not present in the meter factory configura-
tion)
, (78, 79)
where is root mean square of the basic frequency (first order of magnitude) harmonic component
over the ith basic time interval; the root mean square value of the harmonic subgroup linked to the basic
frequency component is used.

TLAS.411152.002-01 RE
57
n order of magnitude harmonic component coefficient and total harmonic component coefficient
(total harmonic distortion) over the averaging interval:
, (80, 81)
where N is the number of basic time intervals in the averaging interval.
n order of magnitude interharmonic component coefficient over the ith basic time interval (not
present in the meter factory configuration):
(82)
n order of magnitude interharmonic component coefficient over the averaging interval:
(83)
N is the number of basic time intervals in the averaging interval.
The calculation of harmonic and interharmonic current and voltage components parameters in stan-
dard meter configuration settings is implemented in the scope of Table 22.
Table 25 - Parameters of Current and Voltage Harmonic and Interharmonic Components
Parameter
IA
)(nAI )(nisgAI уnIAK )( уnIisgAK )( IAK IAуK
IB
)(nBI )(nisgBI уnIBK )( уnIBisgK )( IBK IBуK
IC
)(nCI )(nisgCI уnICK )( уnIisgCK )( ICK ICуK
UA
)(nAU )(nisgAU уnUAK )( уnUisgAK )( UAK UAуK
UB
)(nBU )(nisgBU уnUBK )( уnUisgBK )( UBK UBуK
UC
)(nCU )(nisgCU уnUCK )( уnUisgCK )( UCK UCуK
UAB
)(nABU )(nisgABU уnUABK )( уnUisgABK )( UABK UABуK
UBC
)(nBCU )(nisgBCU уnUBCK )( уnUisgBCK )( UBCK UBCуK
UCA
)(nCAU )(nisgCAU уnUCAK )( уnUisgCAK )( UCAK UCAуK
4.1.2.6 Short-Term and Long-Term Flicker Dose Calculation
Short-term flicker indicator Pst is calculated according to the GOST R 51317.4.15-2012 over a
10 min. time interval
Long-term flicker indicator Plt is calculated by the following formula:
(84)
where Psti is short-term flicker indicator over the ith measurement interval (10 min).
N is the number of subsequent short-term flicker indicator measurement intervals (N=12 over a 2 h av-
eraging interval).

TLAS.411152.002-01 RE
58
1.4.2.7 Voltage Dips and Interruptions
Root mean square voltage value over a basic frequency semiperiod Urms is measured for all meter
phases.
The starting moment of a dip ts dip is recorded by Urms reduction below 0.9∙Unom level. The final
moment of a dip tf dip is recorded by Urms restoration to 0.9∙Unom + 2%Unom. The dip length and depth
δUdip is calculated:
, (85)
, (86)
where Urms min is the minimum root mean square value Urms measured over the interval limited by ts dip
and tf dip.
Dips detected since the meter activation moment are counted. Voltage dips are recorded in the
event log.
In case Urms voltage reduction duration is less than 60 s, the voltage is considered as a steady-
state one. When voltage is restored to its normally permissible value, an additional event is formed in
the log, recording restoration time without changing the dip number.
In a similar manner, when Urms drops below 0.05∙Unom, a voltage interruption is recorded.
1.4.2.8 Overvoltages
Urms values are used for determining the duration of overvoltages. The starting moment of an
overvoltage ts ov is recorded by Urms excess of 1.1∙Unom level. The final moment of an overvoltage tf ov is
recorded by Urms drop to 1.1∙Unom - 2%Unom.
. (87)
An overvoltage is recorded in the event log. Detected overvoltages are counted since the moment
of the meter activation.
In case Urms voltage rise duration is more than 60 s, the voltage is considered as a steady-state
one. When voltage is restored to its normally permissible value, an additional event is formed in the log,
recording restoration time without changing the overvoltage number.
Overvoltage coefficient Кov is calculated by the formula:
, (88)
where Urms max is the maximum root mean square value Urms measured over the interval limited by ts ov
and tf ov.
1.4.3 Data Transmission over Communication Channels
The meter supports data exchange over the following communication channels:
Ethernet;
RS-485 interface;
RS-485 interface;
RS-232 interface;
Optical communication interface.

TLAS.411152.002-01 RE
59
When data are transmitted over Ethernet and РРР, TCP/IP protocol with a transport level inter-
face is used as a transport protocol (between the user and TCP) as per GOST R IEC 60870-5-104-2004.
Data transmission over the radio channel is effected with the help of an external modem con-
nected to the meter via RS-232 interface.
When data are transmitted over RS-485 and RS-232 interfaces, protocol is used as per
GOST R IEC 60870-5-101-2006.
Energy metering data transmission frame formats are described in the documents "BINOM3
Multifunctional Electric Energy Quality Meters". Interaction Protocols. TLAS.411152.002 D1». Some
energy metering data (current values) included into the database may be transmitted over communica-
tion channels in the same manner as the measured grid parameters as described in the document
"BINOM3 Multifunctional Electric Energy Quality Meters". Interaction Protocols.
TLAS.411152.002 D1».
Log data transmission frame formats are described in the document "BINOM3 Multifunctional
Electric Energy Quality Meters". Interaction Protocols. TLAS.411152.002 D1».
In order to make it possible for the meter to interact with data collection devices operating as per GOST
R IEC 60870-5-101-2006 and GOST R IEC 60870-5-104-2004. the document "BINOM3 Multifunc-
tional Electric Energy Quality Meters". Interaction Protocols. TLAS.411152.002 D1" presents teleme-
chanic system compatibility protocols.
Data exchange between the meters and a computer via an optical communication interface is en-
sured by a ТХ06А communication module (TLAS.426419.005) serving as an optical port - USB adap-
ter. From the computer side, ТХ06А is equipped with a USB connector. When it is connected, a virtual
COM port is created in the system and it becomes possible to scan, program and configure meters. The
ТХ06А module casing has a built-in magnet that fastens it to the meter and orients it unequivocally in
relation to the transceiving LEDs. Structurally, the optical port conforms to
GOST IEC 61107-2011. Data exchange speed via optical interface is up to 115200 bod, computer USB
port power supply - not more than 30 mA, cable length not more than 1.8 m.
1.4.3.1 BINOM3 Series Meters Database
Parameter values included into the meter database (DB) and specified in output channels in the
process of parameterization may be transmitted over communication channels in standard formats (re-
quests). The base contains current changes, as well as service data about the state of modules, meter
subassemblies, its operation modes and the quality of information exchange via communication chan-
nels. The meter database description can be found in the document "BINOM3 Multifunctional Electric
Energy Quality Meters". Interaction Protocols. TLAS.411152.002 D1».
Parameter values presentation and scaling in the process of their transmission via communication
channel and initial parameterization are described in the document "BINOM3 Multifunctional Electric
Energy Quality Meters". Interaction Protocols. TLAS.411152.002 D1». Additional information about
forming the list of parameters sent via BINOM3 meter interfaces are set forth in the Chapter "BINOM3
Series Meters Web Server Operator Manual".

TLAS.411152.002-01 RE
60
1.4.3.2 Time Count and BINOM3 Meter Synchronization
The maximum basic absolute error of BINOM3 meter internal clock rate without synchroniza-
tion under primary or backup power supply (the meter is on) does not exceed ± 0.5 s per day. The max-
imum absolute error of the internal clock rate without synchronization and without power supply does
not exceed 1.5 s per day. The duration of the clock operation depends on the built-in clock power
source.
BINOM3 meter is synchronized:
- from ТМ3com control center telemechanic devices over data exchange channels in compliance
with exchange protocols as per GOST R IEC 60870-5-101 or GOST R IEC 60870-5-104 supplemented
by exact synchronization user frame. Subject to the transmission of supplementary exact synchroniza-
tion user frame and using the impulse synchronization signal, the permissible absolute time error signal
upon receipt of the timing mark does not exceed 5 µs;
- from GLONASS/GPS global positioning systems signal receivers over data exchange channels
in compliance with NMEA 0183 exchange protocol and a separate PPS impulse synchronization signal.
Subject to receipt of the timing mark, the permissible absolute time setting error does not exceed 5 µs;
- from automated informative electric power metering systems and/or electric power resources
dispatching systems (telemechanic devices) over data exchange channel in compliance with exchange
protocols as per GOST R IEC 60870-5-101 or GOST R IEC 60870-5-104. Subject to receipt of the tim-
ing mark, the permissible absolute time setting error does not exceed 5 µs.
1.4.4 Controlling the Type of Information Displayed on the Screen
The parameter that is to be displayed on the screen is chosen from a menu with the help of key-
pad buttons. The menu has a tree-like structure. Its appearance is shown in Figure 7. The external ap-
pearance of the keypad is shown in Figure 6.
Figure 5 - External Appearance of the Keypad

TLAS.411152.002-01 RE
61
1.4.4.1 Meter Liquid Crystal Display Operation Mode
The meter liquid crystal display (hereinafter, the LCD) operates in the following data display
modes:
Startup screen mode;
Background displaying mode;
Menu displaying mode;
Parameters displaying mode.
1.4.4.1.1 After power supply voltage is applied to the meter, the meter LCD displays a startup
screen including the meter software name, the software designer name and the loaded software version
number. Upon expiry of ~ 60 s, the meter switches to a background display mode.
1.4.4.1.2 Background Displaying Mode
The meter changes to this mode after power supply is switched on upon expiry of startup screen
displaying. The meter switches back to this mode from the menu displaying mode after pushing
the ← button. In the background displaying mode, the LCD cyclically displays a set of parame-
ters set at the respective page of the Web server built in the meter.
Navigation in Background Displaying Mode.
► - contrast enhancement,
► - contrast decay,
▲,▼ – switch over to the menu displaying mode.
1.4.4.1.3 Menu displaying mode;
The meter switches to this mode from the background displaying mode after pushing the ▲,▼
button or from the parameters displaying mode after pushing the button ←.
Menu Items List:
Current Phase A Parameters
Current Phase B Parameters
Current Phase C Parameters
Current Connection Parameters
Quality Indicators
А/В/С Phases Harmonic Components
Meter Readings
Discrete Inputs *
Remote Control *
Load Commercial Profile
Load Technical Profile
Energy since Reset
Monthly Energy
Daily Energy

TLAS.411152.002-01 RE
62
Impulse Output
Power Supply System State
Meter Off
System Parameters
Temporal Characteristics Monitoring
* - for versions with RS and RC options.
Navigations in Menu Displaying Mode.
▼ – proceed to the next menu item,
▲ – proceed to the previous menu item,
Enter – switch to the selected menu item parameters displaying mode.
1.4.4.1.4 Parameters displaying mode.
The meter switches to the selected parameters group displaying mode from the menu displaying
mode after pushing the Enter button.
Standard navigation in this mode, unless specified otherwise:
▼ – proceed to displaying the next parameter
▲ – proceed to displaying the previous parameter
Esc – exit to the menu displaying mode.
1.4.4.1.4.1 Displaying Current А/В/С Phase Parameters
The following set of parameters is displayed on the LCD:
Active phase power
Reactive phase power
Full phase power
Phase power factor
Phase current
Phase voltage
Interphase voltage
Basic frequency interphase voltage
Angle between basic frequency phase voltages
Angle between basic frequency phase currents
Active basic frequency power;
Reactive basic frequency power;
Full basic frequency power;
Navigation (supplementary to standard):
► – proceed to displaying the same next phase parameter
► – proceed to displaying the same previous phase parameter

TLAS.411152.002-01 RE
63
1.4.4.1.4.2 Displaying Current А/В/С Phase Connection Parameters
The following set of parameters is displayed on the LCD:
Active connection power
Reactive connection power
Full connection power
Connection power factor
Frequency
Average phase current
Average phase voltage
Average interphase voltage
Positive sequence voltage
Negative sequence voltage
Zero sequence voltage
Positive sequence current
Negative sequence current
Zero sequence current
Current unbalance factor by negative sequence
Current unbalance factor by zero sequence
Phase shift angle between positive sequence voltage and current
Phase shift angle between negative sequence voltage and current
Phase shift angle between zero sequence voltage and current
Basic frequency positive sequence active power
Basic frequency negative sequence active power
Basic frequency zero sequence active power
Basic frequency positive sequence reactive power
Basic frequency negative sequence reactive power
Basic frequency zero sequence reactive power
Basic frequency positive sequence full power
Basic frequency negative sequence full power
Basic frequency zero sequence full power
1.4.4.1.4.3 Quality Indicators Displaying
The following set of parameters is displayed on the LCD:
Frequency
Frequency deviation
Positive sequence voltage
Steady-state voltage deviation
Root mean square negative sequence voltage value
Voltage unbalance factor by negative sequence
Root mean square zero sequence voltage value

TLAS.411152.002-01 RE
64
Voltage unbalance factor by zero sequence
Total coefficient of A phase voltage harmonic component
Total coefficient of B phase voltage harmonic component
Total coefficient of C phase voltage harmonic component
Total coefficient of A phase current harmonic component
Total coefficient of B phase current harmonic component
Total coefficient of C phase current harmonic component
Voltage dips meter
Voltage depression length
Voltage depression depth
Voltage interruptions meter
Voltage interruption length
Voltage interruption depth
Temporary overvoltages meter
Temporary overvoltage length
Temporary overvoltage factor
1.4.4.1.4.4 Displaying Current and Voltage Harmonic components
When switched to the harmonic components displaying mode, the meter displays the parameter
groups menu section. Navigation in this section:
▼, ▲– phase selection (А/В/С)
►, ◄ – parameter group selection:
А(В,С) voltage harmonics
А(В,С) voltage interharmonic
А(В,С) voltage harmonic factors
А(В,С) voltage interharmonic factors
А(В,С) current harmonics
А(В,С) current interharmonic
А(В,С) current harmonic factors
А(В,С) current interharmonic factors
Enter – proceed to the selected parameter group displaying section
In the selected parameter group displaying section, the LCD displays the values of parameters
from this group from the 1st harmonic to the 50th, from the 0th interharmonic to the 49th. Navi-
gation in this section:
▼, ▲– harmonic selection
►, ◄ - proceed to displaying the same phase parameter from another group
Enter – proceed to the parameter group selection menu

TLAS.411152.002-01 RE
65
1.4.4.1.4.5 Meter Readings Display
The energy recorded by the meter is displayed on the LCD in total and by tariffs:
Consumed active energy
Restored active energy
Inductive reactive energy
Capacitive reactive energy
Consumed active energy loss ;
Restored active energy loss
Inductive reactive energy loss
Capacitive reactive energy loss
Consumed basic frequency active energy;
Restored basic frequency active energy;
Inductive basic frequency reactive energy
Capacitive basic frequency reactive energy
Consumed positive sequence active energy;
Restored positive sequence active energy;
Inductive positive sequence reactive energy
Capacitive sequence reactive energy
Navigation in this section:
▼, ▲– energy meter selection
►, ◄ - tariff selection: total, tariff 1. tariff 2. tariff 3. tariff 4. non-tariff
1.4.4.1.4.6 Commercial/Technical Load Profile Displaying
Navigation in this mode:
► – proceed to the next electric energy metering channel
► – proceed to the previous electric energy metering channel
▼ – proceed to the next profile point in time
▼ – proceed to the previous profile point in time
1.4.4.1.4.7 Energy Archive Data Displaying
When switched into the archive data displaying mode, the meter enters the data type selection
section. Navigation in this section:
▼, ▲ – data type selection: since reset, for a month, for a day
►, ◄ - tariff selection: total, tariff 1. tariff 2. tariff 3. tariff 4. non-tariff
Enter – proceed to the data displaying section
Navigation in the data displaying section:
► – proceed to the next electric energy metering channel
► – proceed to the previous electric energy metering channel

TLAS.411152.002-01 RE
66
▼ – proceed to the next profile point in time: for data for a month - to the next month, for data
for a day and since reset - to the next day
▼ – proceed to the previous profile point in time: for data for a month - to the previous month,
for data for a day and since reset - to the previous day
Enter – proceed to the data displaying section
1.4.4.1.4.8 Discrete Input Values Displaying
Navigation in this section:
►, ◄ – RS group selection: RS1÷RS8. RS9÷RS16
1.4.4.1.4.9 Remote Control
Navigation in this section:
▼, ▲ – RC selection: RC1÷RC4
▼, ▲ – RC command selection: "Off", "On"
Enter – remote control command launch
1.4.4.1.4.10 Impulse Input Control
The meter impulse input can operate in one of the following modes:
Wa – the number of impulses is proportional to active energy
Wr – the number of impulses is proportional to reactive energy
Wa(loss) – number of impulses is proportional to active energy loss
Wr(loss) – number of impulses is proportional to reactive energy loss
Wa bas. fr. - the number of impulses is proportional to basic frequency active energy
Wr bas. fr. - the number of impulses is proportional to basic frequency reactive energy
Wa pos. seq. - the number of impulses is proportional to positive sequence active energy
Wa neg. seq. - the number of impulses is proportional to negative sequence active energy
P - impulse repetition rate is proportional to active power
Q - impulse repetition rate is proportional to reactive power
P (loss) – timpulse repetition rate is proportional to active power loss
Q (loss) – impulse repetition rate is proportional to reactive power loss
P bas. fr.- impulse repetition rate is proportional to active basic frequency power
Q bas. fr.- impulse repetition rate is proportional to reactive basic frequency power
P pos. seq.- impulse repetition rate is proportional to active positive sequence power
P pos. seq.- impulse repetition rate is proportional to reactive positive sequence power
1500 Hz - test mode, a 1500 Hz signal is formed
Off
Navigation in this mode:
▼, ▲ – mode selection
Enter - mode selection confirmation

TLAS.411152.002-01 RE
67
1.4.4.1.4.11 System Parameters Displaying
The following parameters are displayed:
Software version, CRC (software checksum);
Number of restarts
Current date and time
Temperature
Network

TLAS.411152.002-01 RE
68
1.4.4.1.4.12 Temporal Characteristics Monitoring
Used during the meter RSI in order to implement the guideline for determining current time me-
tering errors and to receive the timing mark.
Data Displaying Examples:
Х.ХХХХХ
(h: min.: s: )
Displaying
Current Parameters,
Harmonic
Components
Parameter name
Parameter
Measurement Units
ХХХХХХ.ХХХ
Meter Readings
Parameter
Measurement
Units
Parameter Name
+Wa -Wa
+Wr -Wr
kW
kVArh
K DD.MM.YY hh:mm
: Х.ХХХХХ
Load Profile
Load Profile
Type:
К – commercial
T - technical
Date / Time
Parameter
Name
Parameter
Measurement Units

TLAS.411152.002-01 RE
69
Current phase A
parameters
MENU
Current phase B
parametersB
Current phase С
parameters
Current connection
parameters
Active power (РА)
Reactive power (QА)
Full power (SА)
Power factor (cosφA)
Phase current (IА)
Phase voltage (UА)
Interphase voltage (UАВ)
Active power (РВ)
Reactive power(QВ)
Full power (SВ)
Power factor (cosφB)
Phase current (IВ)
Phase voltage (UВ)
Interphase voltage (UВС)
Active power (РС)
Reactive power (QС)
Full power (SС)
Power factor (cosφC)
Phase current (IС)
Phase voltage (UС)
Interphase voltage (UСА)
Active power (Р)
Reactive power (Q)
Full power (S)
Power factor (cosφср)
Average phase current (Iср)
Average phase voltage (UФcp)
Frequency (f)
Average interphase voltage (UМФcp)
Positive sequence voltage (U1)
Negative sequence voltage (U2)
Zero sequence voltage (U0)
Positive sequence current (I1)
Negative sequence current (I2)
Zero sequence current (I0)
A/B/C phase harmonic
components
Voltage harmonics
Voltage interharmonics
Voltage harmonic coeff.
Voltage interharmonic coeff.
Current harmonics
Current interharmonics
Current harmonic coeff.
Current interharmonic coeff.
Meter readings
Consumed active energy (+Wa)
Recovered active energy (-Wa)
Inductive reactive energy (+Wr)
Capacitive reactive energy (-Wr)
Коммерческий
профиль нагрузки
Technical load profile
System parameters
Impulse output
total
Per
month
Per day
tariff 1
tariff 2
tariff 3
tariff 4
non-tariff
Software version, CRC
Number of restarts
Date, time
Consumed active loss energy(+Waп)
Recovered active loss energy (-Waп)
Inductive reactive loss energy (+Wrп)
Capacitive reactive loss energy (-Wrп)
Temperature
Quality indicatorsFrequency (f10)
Frequency deviation (∆f10)
Positive sequence voltage (U1у)
Steady-state voltage deviation (δUу)
Negative sequence voltage (U2у)
Voltage unbalance factor by positive sequence (K2Uу)
Voltage zero sequence (U0у)
Коэффициент несимметрии напряжения по нулевой
последовательности (K0Uу)
A phase voltage harmonic component total coefficient
(KUA(n))
B phase voltage harmonic component total coefficient
(KUB(n))
C phase voltage harmonic component total coefficient
(KUC(n))
A phase current harmonic component total coefficient
(KIA(n))B phase current harmonic
component total coefficient (KIB(n))
C phase current harmonic component total coefficient
(KIC(n))
Dip meter (Nпров)
Dip depth (δUпров)
Overvoltage factor (Кпер)
Voltage interruption meter (Nпрер)
Off
Active energy (Wa)
Reactive energy (Wr)
Consumed active energy (+Wa)
Recovered active energyя (-Wa)
Inductive reactive energy (+Wr)
Capacitive reactive energy (-Wr)
Consumed active loss energy (+Waп)
Recovered active loss energy (-Waп)
Inductive reactive loss energy (+Wrп)
Capacitive reactive loss energy (-Wrп)
Active loss energy (Wa потери)
Reactive loss energy (Wr потери)
Active power (P)
Reactive power (Q)
Active loss power (P потери)Reactive power (Q потери)
1500 Гц
Dip length (∆tпров)
Overvoltage meter (Nпер)
Overvoltage length (∆tпер)
Voltage interruption length (∆tпрер)
Voltage duration depth (δUпрер)
UА(В,С)(1) … UА(В,С)(50)
UА(В,С)isg(0) … UА(В,С)isg(49)
KUА(В,С)(1) … KUА(В,С)(50)
KUА(В,С)isg(0) … KUА(В,С)isg(49)
IА(В,С)(1) … IА(В,С)(50)
IА(В,С)isg(0) … IА(В,С)isg(49)
KIА(В,С)(1) … KIА(В,С)(50)
KIА(В,С)isg(0) … KIА(В,С)isg(49)
total
tariff 1
tariff 2
tariff 3
tariff 4
non-tariff
Consumed active energy (+Wa)
Recovered active energy (-Wa)
Inductive reactive energy (+Wr)
Capacitive reactive energy (-Wr)
Consumed active loss energy (+Waп)
Recovered active loss energy (-Waп)
Inductive reactive loss energy (+Wrп)
Capacitive reactive loss energy (-Wrп)
Basic frequency interphase voltage
(UСА(1))
Angle between basic frequency phase current
(φUСА(1))
Angle between basic frequency phase current
(φIСА(1))
Basic frequency active power
(PС(1))
Basic frequency reactive power
(QС(1))
Basic frequency full power (SС(1))
Basic frequency interphase voltage
(UВС(1))
Angle between basic frequency phase current
(φUВС(1))
Angle between basic frequency phase current
(φIВС(1))
Basic frequency active power (PВ(1))
Basic frequency reactive power
(QВ(1))
Basic frequency full power (SВ(1))
Basic frequency interphase voltage
(UАВ(1))
Angle between basic frequency phase current
(φUАВ(1))
Angle between basic frequency phase current
(φIАВ(1))
Basic frequency active power
(PА(1))
Basic frequency reactive power
(QА(1))
Basic frequency full power (SА(1))
Negative sequence current unblance factor
(K2I)
Zero sequence current unblance factor (K0I)
Phase shift angle between positive sequence voltage and current (φU1I1(1) )
Phase shift angle between zero sequence voltage and current (φU0I0(1) )
Phase shift angle between negative sequence voltage and current (φU2I2(1) )
Basic frequency positive sequence active power (P1(1) )
Basic frequency negative sequence active power (P2(1) )
Basic frequency zero sequence active power (P0(1) )
Basic frequency positive sequence reactive power (Q1(1) )
Basic frequency negative sequence reactive power (Q2(1) )
Basic frequency zero sequence reactive power (Q0(1) )
Basic frequency positive sequence full power (P1(1) )
Basic frequency negative sequence full power (P2(1) )
Basic frequency zero sequence full power (P0(1) )
Consumed basic frequency active energy (+Wa(1))
Recovered basic frequency active energy (-Wa(1))
Consumed basic frequency reactive energy (+Wr(1))
Recovered basic frequency reactive energy (-Wr(1))
Consumed positive sequence active energy (+Wa1(1))
Recovered positive sequence active energy
(-Wa1(1))
Inductive positive sequence reactive energy (+Wr1(1))
Capacitive positive sequence reactive energy (-Wr1(1))
Consumed basic frequency active energy (+Wa(1))
Consumed basic frequency reactive energy (+Wr(1))
Recovered basic frequency active energy (-Wa(1))
Recovered basic frequency reactive energy (-Wr(1))
Consumed positive sequence active energy (+Wa1(1))
Recovered positive sequence active energy (-Wa1(1))
Inductive positive sequence reactive energy (+Wr1(1))
Capacitive positive sequence reactive energy (-Wr1(1))
Network
Basic frequency active energy (Wa осн.част.)
Basic frequency reactive energy (Wr осн.част.)
Positive sequence active energy (Wa прям.посл.)
Positive sequence reactive energy (Wr прям.посл.)
Basic frequency active power (Р осн.част.)
Basic frequency reactive power (Q осн.част.)
Positive sequence active power (Р прям.посл.)
Positive sequence reactive power (Q прям.посл.)
Temporal characteristics
monitoring
Timing accuracy assessment
Clock accuracy assessment
Discrete inputs
Remote control
Figure 7 - LCD Data Displaying Menu

TLAS.411152.002-01 RE
70
1.4.5 Structure
The meter has a completed structure meeting the requirements of
GOST 31818.11-2012 and the manufacturer's drawings. Its internal structure is built on a modular prin-
ciple. The modules are placed in a plastic casing made of high-impact polycarbonate and ensuring a
convenient and safe operation under impact of external factors. The meter casing consists of a base, a
shell (panel) and three covers. The casing has IP51 protection rating as per GOST 14254-96. The casing,
compression terminal (board) and the terminal cover meet the requirements of GOST 31818.11-2012.
The external appearance of the meter is presented in Figures 8. 9.1 and 9.2.
The first cover is hinged, transparent, swinging, with a latch. Its opening provides access to the
controls, LED indicators, LCD display, the optical port and the marking.
The second (bottom) cover (the terminal cover) is removable; it is fastened to the base by two
screws. There is the compression terminal for metering circuits connection and interface terminals (RS-
485/SYNC, RS-232. RS-485/422. Ethernet) located under it. Located on the internal side of the terminal
cover (Figure 9.2) is the plate explaining the contact marking of the compression terminal, power con-
nector and the connectors used for connecting external devices.
The third cover (the remote signal cover) is also removable; it is fastened to the base by two
screws. Located under it are connectors for remote signaling (RS) and remote control (RC) circuits con-
nection (TE37Rx (TE38Rx) external relay block) (Figure 9.1).
The terminal cover may be sealed by the operator and the inspection authority. It is impossible to
get access to the compression terminal without breaking the seal. When the meter is on, upon terminal
covers removal the event time and type are recorded in the electronic logs.
Terminal covers prevent access to the meter fastening screw, making it impossible to remove the
meter without breaking the seals. The meter fastening screws also may be sealed.
The shell (panel) is fastened to the base with four screws that are sealed by the manufacturer's
QC and the verification officer. These seals cannot be broken when the meter is fastened properly to a
panel.
The meter casing has 3 holes for fastening it to a metal panel with ВМ5 screws. Two of those
holes are located under the removable cover, making it impossible to remove the meter without breaking
the seals.
The external appearance of the meter from the fastening panel side is shown in Figure 10.
The meter design provides for its installation in cabinet front panel openings.
Fastening screws and mating connectors are delivered with the meter.
Metering circuits are connected with the help of compression devices installed on the clamp plate
(terminal strip). Terminals have 20 mm deep holes 5.0 mm in diameter that ensure connection of single-
conductor or multiconductor (terminated) wires 1.5 to 5.0 mm2 cross-section that are fastened with two
M4 screws. Distance between terminals in the terminal strip is 10.5 ± 0.2 mm, the number of terminals
is eleven.
The earth terminal (PE) separate from the terminal strip is located in a Socket MSTBТ – 2.5/5-
ST-5.0 type connector near the terminal strip. It ensures connection of a wire with a section up to 2.5
mm2.
hole depth 8.3 mm, the wire is fastened with a single M3 screw.

TLAS.411152.002-01 RE
71
The dimensions of the opening for circuit output covered by the terminal cover is 95mm*27 mm.
The dimensions of the opening for circuit output covered by the top cover is
105mm*20 mm.
The maximum meter weight is 2 kg.
Figure 8 - External Appearance of the Meter

TLAS.411152.002-01 RE
72
Figure 9.1 - Meter Terminals. Top View.
- XS1 remote signaling input terminals;
– XS1 (RC1. RC2) relay block connector connecting terminal;
– XS2 (RC3. RC4) relay block connector connecting terminal;
- tampering sensor (electronic seal);
- place for the verification officer's seal imprint.
1
2
3
1
4
2
3
4
5
5

TLAS.411152.002-01 RE
73
Figure 9.2 - Meter Terminals. Bottom View.
– XS7 RS-232 interface connector;
– Xt7 RS-485/422 interface connector;
- ХР5 RS-485/SYNC connector - RS-485 interface, impulse output, impulse input;
- place for application of the manufacturer's QC protective hologram;
– MicroSD socket;
– XS3 Ethernet connector;
– XP2 220 V connector - primary and backup power supply, earth (PE) terminal;
- XS2 compression plate (terminal strip) - metering circuits connection
- tampering sensor (electronic seal);
5
1
1
2
2 3 4 5 6
7
3
6
7
8
8
4
9
9

TLAS.411152.002-01 RE
74
Figure 10 - Meter Dimensions and View from the Fastening Side

TLAS.411152.002-01 RE
75
1.4.6 Marking and Sealing
The meter casing marking has been implemented in compliance with GOST 31818.11-2012.
GOST IEC 62053-52-2012. It includes the following information:
- the manufacturer's trade mark and/or name (put on the number plate at the bottom of the panel);
- name;
- nominal secondary current of a transformer to which the meter can be connected, 5 A (1 A);
- nominal voltage: 57.7/100 V, 220/380 V, 100 V, 380 V;
- mains frequency 50 Hz;
- the number of phases and the number of wires of the circuit for which the m4 is intended pre-
sented as a graphic icon (as per GOST IEC 62053-52-2012);
- accuracy class including standard designation (as per GOST 8.401-80);
- insulation test voltage (as per GOST 23217-78);
- sign for meters in class II insulating casing;
- conventional designation of the measured energy;
- GOST 31818.11-2012 standard designation
- images of the SI type Approval Sign and Conformity Sign;
- serial number and year of manufacture.
The terminal strip bears the dangerous voltage sign , the terminal numbers and the meter pow-
er connectors marking.
An information plate is glued to the inside of the terminal cover, bearing the marking of the meter
terminals covered by the cover and the metering circuits connection diagrams.
As per PR 50.2.007-2001. the verification mark is imprinted on the right-hand screw connecting
the meter base and shell, the manufacturer's QC hologram is pasted on the panel to terminal strip con-
nection; it blocks access to the SD card.
As the meter is put in operation, an Electric Inspection Service representative seals one of the ter-
minal cover screw. It is permitted to seal the terminal covers, for which special holes are provided.
The meter packaging is marked as per GOST 14192-96. Its marking contains handling signs, the
principal, supplementary and information inscriptions.
Handling signs contain the following load handling instructions:
- "Fragile. Handle with Care";
- "Keep Dry",
- "Top".
The principal inscriptions contain:
- the consignee's name;
- the destination point name;
- the number of cargo items in the batch and the item running number in the batch.
Supplementary inscriptions contain:
- the consignor's name;
- the departure point name;

TLAS.411152.002-01 RE
76
- inscriptions made by shipping organizations.
Information inscriptions contain:
- cargo item gross and net weight in kilograms;
- cargo item dimensions in centimeters
1.4.7 Packing
The meter and the items delivered with it are packed as per the requirements of GOST 23170-78
and TLAS.411152.002 SB.
The accompanying documents delivered with the meter are put into a polyethylene film cover
welded in a way ensuring tightness of welds and put into the box with the meter. The box is put into a
case.
The case is marked with the case number and the total number of cases in the delivered batch. A
packing slip is filled for the package case; it is put into the case.
The case is sealed as per GOST 18680-73 and marked as per GOST 14192-96.
1.5 Description and Operation of the Meter Components
The meter is a set of modules placed into a common shell (casing). The meter structural diagram
is presented in Figure 1.
The principal element of the meter is TP337A processor module that receives transformed sig-
nals from TU337A metering module, measures actual current, voltage, active and reactive power, fre-
quency, quality control and electric power metering values.
1.5.1 TP337A Processor Module
TP337A module TLAS.426469.014 is intended for operation as a part of the meter, namely the
central processor module and actual current and voltage values discretizer. TP337A module also ensures
data exchange with top level devices.
Functionally, the module consists of the following principal parts:
- CPU;
- a signal processor;
- a HOST controller;
- memory;
- real time clock;
- interfaces.
1.5.2 TU337A Metering Module
TU335A analog input module TLAS.426444.027 is intended for discretizing actual current and
voltage values.

TLAS.411152.002-01 RE
77
TU337A includes the following parts:
- metering current transformers;
- precision voltage dividers;
- an analog to digital converter (ADC);
- a reference voltage source;
- a power source.
Current and voltage metering circuits are connected to the TU337A module inputs. The module
matches input currents and voltages with the ADC inputs with the help of isolating metering transfor-
mers and norming circuits.
Special materials and hardware components used in the TU337A module parts have stable cha-
racteristics and low intrinsic loss. They ensure high precision of signals conversion with required error
over an expanded operating range.
Depending on the meter version, TU337A has TU337A, TU337A1. TU337A2 and TU337A3
versions that differ in input circuit element ratings.
1.5.3 TS337A Discrete Signals Input/output Module
TS337A RS and RC module TLAS.426444.029 is included in meters having remote signaling
and remote control functions. It is intended for converting 16 discrete input signals into a digital code
and transmitting it to the processor module, as well as converting digital code into output discrete sig-
nals (up to 4 depending on the connected relay block).
1.5.4 MS337A Keypad Module
MS337A keypad module TLAS.426458.025 is intended for displaying modes, state, parameter
values and controlling the meter.
MS337A module is made of polyester film; it has a multilayer structure.
The top layer or the visible part of the module with alphanumeric designations, transparent win-
dows and pushbuttons is the decorative face plate (instrument panel). The image of keys and special
symbols is printed on the inner side of the face film; this protects it from abrasion. The outer side is cov-
ered with antireflective coating.
Twenty-five buttons of the keypad module have a special shape ensuring tactile effect.
The keypad elementary diagram (wiring) is implemented on the second layer of the MS337A
module by conductive ink printing. A conductive ribbon cable is connected to this layer; with its help
the MS337A keypad module is connected to the TP337A processor module.
When keypad buttons are pressed the necessary wiring lines are closed with the help of conduc-
tive pads located under the buttons on the inner side of the face panel.
A layer of glue is applied to the MS337A module reverse side in order to fasten it to the meter
casing.
The external appearance of the BINOM3 series meter face panel is shown in Figure 11.

TLAS.411152.002-01 RE
78
Figure 11 - BINOM3 Series Meter Face Panel
1 – OLED indicator; 4 – power indicator;
2 – control buttons; 5 – meter operation indicators (Table 26);
3 – metering indicators; 6 – optical port;
1.5.4.1 Built-In Single Indication
The meter is provided with single indication on the face panel:
1) Metering indicators:
WA indicator:
o blinks green at the frequency proportional to the active connected power modulus but not
less than 0.05 Hz. At nominal power, blinking frequency is equal to 0.5 Hz;
o blinks red at the frequency proportional to the active connected power modulus when the
maximum allowable power value is exceeded;
o shines yellow at zero active connected power;
QD (quality deterioration) indicator:
o blinks red at 2 Hz frequency for 5 seconds when an overvoltage is detected;

TLAS.411152.002-01 RE
79
o blinks yellow at 2 Hz frequency for 5 seconds when a voltage dip is detected;
o shines red when positive sequence voltage exceeds the maximum permissible limit;
o blinks red at 4 Hz frequency when zero sequence unbalance factor exceeds the maximum
permissible limit;
o blinks red at 8 Hz frequency when negative sequence unbalance factor exceeds the max-
imum permissible limit;
o shines yellow when positive sequence voltage exceeds the warning limit;
o blinks yellow at 4 Hz frequency when zero sequence unbalance factor exceeds the warn-
ing limit;
o blinks yellow at 8 Hz frequency when negative sequence unbalance factor exceeds the
warning limit;
ALARM indicator:
o blinks red at 2 Hz frequency when active phase powers have different signs or when at
least one phase has zero active power value;
o shines yellow at negative phase sequence;
o shines red when phase voltages are connected incorrectly.
2) Power indicators:
o Green +3.3V indicator - shining indicates presence of 3.3 V voltages at TP337A electron-
ic module.
3) The purposes and colors of the meter operation indicators are presented in Table 26.
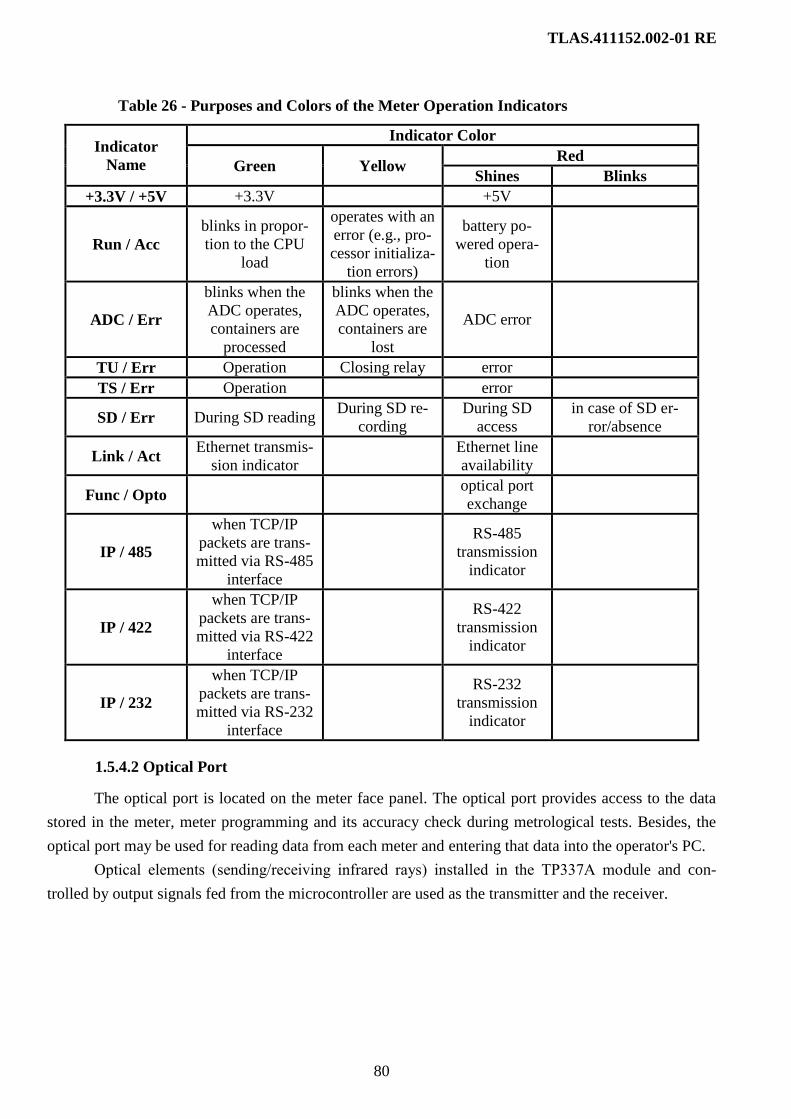
TLAS.411152.002-01 RE
80
Table 26 - Purposes and Colors of the Meter Operation Indicators
Indicator
Name
Indicator Color
Green Yellow Red
Shines Blinks
+3.3V / +5V +3.3V +5V
Run / Acc
blinks in propor-
tion to the CPU
load
operates with an
error (e.g., pro-
cessor initializa-
tion errors)
battery po-
wered opera-
tion
ADC / Err
blinks when the
ADC operates,
containers are
processed
blinks when the
ADC operates,
containers are
lost
ADC error
TU / Err Operation Closing relay error
TS / Err Operation error
SD / Err During SD reading During SD re-
cording
During SD
access
in case of SD er-
ror/absence
Link / Act Ethernet transmis-
sion indicator
Ethernet line
availability
Func / Opto optical port
exchange
IP / 485
when TCP/IP
packets are trans-
mitted via RS-485
interface
RS-485
transmission
indicator
IP / 422
when TCP/IP
packets are trans-
mitted via RS-422
interface
RS-422
transmission
indicator
IP / 232
when TCP/IP
packets are trans-
mitted via RS-232
interface
RS-232
transmission
indicator
1.5.4.2 Optical Port
The optical port is located on the meter face panel. The optical port provides access to the data
stored in the meter, meter programming and its accuracy check during metrological tests. Besides, the
optical port may be used for reading data from each meter and entering that data into the operator's PC.
Optical elements (sending/receiving infrared rays) installed in the ТР337А module and con-
trolled by output signals fed from the microcontroller are used as the transmitter and the receiver.

TLAS.411152.002-01 RE
81
1.5.5 ТХ06А Communication Module
Data exchange between the meters and a computer via an optical communication interface is en-
sured by a ТХ06А communication module (TLAS.426419.005) serving as an optical port - USB adap-
ter. From the computer side, ТХ06А is equipped with a USB connector. When it is connected, a virtual
COM port is created in the system and it becomes possible to scan, program and configure meters. The
ТХ06А module casing has a built-in magnet that fastens it to the meter and orients it unequivocally in
relation to the transceiving LEDs. Structurally, the optical port conforms to
GOST IEC 61107-2011. Data exchange speed via optical interface is up to 115200 bod, computer USB
port power supply - not more than 30 mA, cable length not more than 1.8 m.
1.5.6 TE37Rx (TE38Rx) Relay Blocks
TE37Rx (TE38Rx) relay blocks TLAS.426458.026 are intended for ensuring high-voltage isola-
tion and matching the controlled device impedance with the BINOM3 meter electronic circuits. The
structural diagram of a single TE37Rx (TE38Rx) element (relay channel) is presented in Figures 19 -
21.
Technical Characteristics of TE37Rx (TE38Rx) relay blocks are presented in Table 27.
Table 27 - Technical Characteristics of Relay Blocks
Name
Technical Characteristics
Number
of RC
Channels
Number of
Electromagnetic
Relays
Number of
Solid-State
Relays
Number of
LEDs
Nominal
Relay Op-
eration Vol-
tage
Relay Coil
Resistance
TE37R2 2 6 1 7
12 V. 170 Ω
± 10 %
TE37R3 3 9 1 10
TE37R4 4 12 1 13
TE38R2 2 7 - 7
TE38R3 3 10 - 10
TE38R4 4 13 - 13
TE37Rx (TE38Rx) relay blocks are connected with the XP1 connector of the BINOM3 meter.
Cable connector type from the BINOM3 meter side - FK-MC 0.5/8-ST. Cable length - 1000 mm. A sep-
arate PE contact is provided for earthing.
TE37Rx (TE38Rx) relay blocks are installed on a DIN rack (Figure 12).
Dimensions of the relay blocks: 62*124*67 mm (h*w*d*) (Figure 13).
Relay block weight does not exceed 0.7 kg.
In the process of the meter operation, the resistance of TE37Rx (TE38Rx) relay block coils is pe-
riodically checked.

TLAS.411152.002-01 RE
82
Figure 12 - External Appearance of a Relay Block as Exemplified by TE37R4
Figure 13 - Relay Block Dimensions
1.6 Functional Flavor Description
1.6.1 Archiving Function
BINOM3 series meters ensure storage of measurement results over time intervals and electric
energy quality statistical characteristics as per GOST R 32144-2013. as well as a freely programmable
set of parameters (current measurements, diagnostic information).
Data are archived on a built-in microSD card or an external storage, as well as by transmitting
data to the ТМ3com control point telemechanic device over communication channels with subsequent
data archiving from the ТМ3com control point telemechanic device to an external storage.
The meter ensures security of the collected energy metering data, the electric energy quality
analysis results and the configuring data upon complete deenergization for account of non-volatile
memory storage. Data storage time without power supply: at least 10 years.

TLAS.411152.002-01 RE
83
1.6.2 Built-In Information Presentation Facilities
BINOM3 series meters have a built-in WEB server allowing to view the measurements and cal-
culations results in the form of diagrams, tables, graphs. WEB server is called from a computer with an
installed browser (e.g., Google Chrome), the meter automatically formats and displays the requested
WEB pages into which real time data are integrated.
The Web server can form document, such as Power Consumption Reports and Electric Energy
Test Report drawn up according to recommendations of GOST 33073-2014. The documents are formed
directly on the browser page; they are downloadable in the form of Excel compatible *.xml files.
1.6.3 Oscillography Function
Depending on their version (Table 2), BINOM3 series meters carry out the oscillography func-
tion, i.e. they register instantaneous current and voltage values in the form of oscillograms (in view of
RD 34.35.310-97), the registration of root mean square and averaged values of analog parameters and
discrete signals in the form of graphs.
Data are registered on a MicroSD memory card. Registration modes are settable. The registration
start moment is defined by a settable set of external signals (analog and discrete) and internal meter pa-
rameters.
Instantaneous current and voltage values are oscillographed at 32 kHz frequency (31.25 µs) with
assignment of a time mark in the h:min:s.ms'µs format.
Prehistory oscillography (data recording before the oscillograph start condition operation) is pro-
vided. Prehistory length is adjustable within the interval from 0 to 25 s and set in the meter configura-
tion settings. The total length of a single oscillogram is up to 120 s. The number of subsequently record-
ed oscillograms following one another with overlap of the end of the previous oscillogram and the pre-
history of the previous one is 4 oscillograms. The number of stored oscillogram is specified during pa-
rameterization (by default, 30).
Oscillograms and graphs are viewed on the meter built-in Web server. A registration record
analysis, processing and decoding includes recording registration date and time (astronomical time) for
all recorded parameters, parameter values at any moment of time, scaling of any parameter along the
axis of ordinates and the whole oscillogram along the time axis.
It is possible to download oscillogram files through the built-in WEB server or over communica-
tion channels in the GOST R IEC 60870-5-101/104 in COMTRADE or MS Excel format.

TLAS.411152.002-01 RE
84
2 USING ON PURPOSE
2.1 Safety Precautions
Electric shock hazard protection method of BINOM3 series meters conforms to GOST 22261-
94. GOST 12.2.091-2012. class II equipment, contamination level I, installation (overvoltage) category
III.
As you make the meter ready for operation, as well as during its operation, it is necessary to ab-
ide by the active Regulations for Operation of Consumer Electrical Installations and Safety Rules for
Operation of Consumer Electrical Installations /
Only persons who were briefed in safety rules and have at least electrical safety qualification
level III for electrical installations up to 1000 V are allowed to perform the meter installation work.
The meter must be earthed; for that purpose, it is equipped with PE earthing terminal in its power
supply connector.
All interface connections and circuits that may be affected by a lightning must be lightning pro-
tected.
2.2 Operation Conditions
BINOM3 series meters are designed for continuous operations under the conditions
meeting GOST 31818.11-2012 at temperatures within the range from minus 40 to
plus 45 C. The rest of operation conditions characteristics are presented in 1.2.11.
2.3 BINOM3 Series Meters Preparation for Use
2.3.1 Depreservation
After transportation and storage at subzero temperatures, the meter must be kept under normal
conditions for 3 h. before depreservation.
Open the package. Check the contents of delivery, the availability of a certificate and operation
documentation.
Perform external inspection.
During external inspection, establish whether the meter meets the following requirements:
- markings must be distinct and easily readable;
- the casing must not have any mechanical damage;
- the clamps must have all screws and the screws thread must be serviceable;
- presence of a verification mark imprint on the irremovable part of the casing and/or in the
meter certificate.

TLAS.411152.002-01 RE
85
2.4 Insulation Check
2.4.1 Insulation Resistance Check
Insulation resistance and dielectric strength must be checked before the first meter activation and
each time it is put into operation, as well as necessary.
Insulation resistance is checked with the help of a megohmmeter with 500 V measuring voltage.
Its measuring leads must be connected between:
1) The power connector PE contact and each of the circuits enumerated below:
o mains power supply (XР2:1. 3);
o impulse output (XP5:3);
o impulse input (XP5:4.5);
o RS-485 (XP5:1. 2);
o RS-485/422 (XS6);
o RS-232 (XS7);
o Ethernet (XS3);
o TE37Rx (TE38Rx) relay module terminals (ТU1:1. 2. 3. 4. 5. 6), (ТU2:1. 2. 3. 4. 5.
6), (ТU3:1. 2. 3. 4. 5. 6), (ТU4:1. 2. 3. 4. 5. 6);
o remote signals contacts XS1.
2) Measuring circuit contact pairs (between Iа and Ib, between Ib and Ic, between Ic and Ia, be-
tween Iа, Ib, Ic connected together and compression plate terminals 10 and 11.
Measurements shall be performed after a steady-state reading is achieved but not earlier than af-
ter 5 s. Insulation resistance must be at least:
- 20 MΩ under normal conditions (Table 1);
- 5 MΩ under 45 °C temperature and 80% relative humidity;
- 2 MΩ under 30 °C temperature and 95 % relative humidity;
2.4.2 Insulation Dielectric Breakdown Test
2.4.2.1 Insulation Dielectric Breakdown Test by Commercial Frequency Voltage
Insulation dielectric breakdown test voltage during manufacture of meters intended for various
insulated circuits shall meet the values specified in Table 28.

TLAS.411152.002-01 RE
86
Table 28 - Insulation Dielectric Strength Parameters
Insulated Circuit Test Voltage,
1 min, kV (RMS)
Between all power supply circuits (primary and backup), current and
voltage input metering circuits connected together and the PE terminal
(ХР2:5)
4.0
Between impulse (test) output (ХР5:3) and input (ХР5:4.5) circuits
and PE terminal (ХР2:5)
4.0
Between communication channel adapter input and output circuits RS-
485 (XP5:1.2), RS-232 (XS7), RS-485/422 (XS6) and PE terminal
(ХР2:5)
4.0
Between input and output Ethernet communication channel circuits
(XS3) and PE terminal (ХР2:5)
2.0
Between remote signaling circuits (ХР1) and PE terminal (ХР2:5) 3.0
Between ТУ1-ТУ4 relay block outputs, «Исп»1)
, «Блк» input and the
relay block РЕ terminal
«Исп» relay block output2)
and РЕ relay block terminal
4.0
2.5 1)
– when an electromagnetic relay is used in the ТЕ38Rx block. 2)
– when a solid-state relay is used in the ТЕ38Rx block.
Test shall be performed on a disconnected BINOM3 meter with the help of a breakdown tester
(e.g, GPI-735-A type).
When testing circuit insulation dielectric strength as related to the casing, one terminal of the
breakdown tester shall be connected to all metering circuit short-circuited together and the other, to met-
al foil tightly pressed to the BINOM3 meter surface and connected to the PE power supply connector
terminal so that the distance between it and the tested circuit terminals would be at least 20 mm.
Test voltage shall be increased from 0.1 to 3.0 kV 50 Hz for (5-10) s steplessly or in increments
not exceeding 200 V. Insulation shall be exposed to test voltage for one minute; after that, voltage shall
be decreased to zero steplessly or in increments.
There must be no insulation breakdown or surface flashover during the test. The occurrence of a
corona discharge or noise shall not be considered as symptoms of unsatisfactory test results.
Test result shall be considered as positive in case no insulation breakdown or flashover occurred.
2.4.2.2 Impulse Voltage Test of Insulation Dielectric Strength
Insulation shall withstand 6 kV impulse voltage as per GOST 31818.11-2012 requirements for
line-to-earth voltage equal to 300 V between:
- each current circuit and all other meter circuits connected with PE power supply connector
terminal;
- all voltage circuits including common terminal (10.11 of the compression plate) and all other
meter circuits connected with PE power supply connector terminal.
During the test, free meter outputs including interface ones, must be connected with the PE ter-
minal.

TLAS.411152.002-01 RE
87
2.5 BINOM3 Meter Installation
BINOM3 meter must be installed in heated premises.
The following requirements must be met upon BINOM3 meter installations on site:
1) the installation place must be chosen in view of the input and output circuit connecting cables
minimum length;
2) the temperatures of ambient air and the surface on which the meter is installed must not ex-
ceed the specified performance limits.
3) the location of BINOM3 meter must ensure quick access to its controls, functional devices
and installation elements;
4) it is not advisable to place the BINOM3 meter in direct sunlight coverage are because this re-
duces indicators light contrast and the meter is additionally heated;
5) BINOM3 meter should be installed only in explosion safe rooms at least 10 m distance from
highly flammable substances and at least 1 m distance from combustible materials. Meters must be in-
stalled on walls or surfaces not subject to vibration, recommended height from the floor 1.4 t0 1.7 m.
The meters are not sensitive to angles of deflection from the vertical.
All BINOM3 meter external circuits shall be connected in compliance with the requirements of
«Rules for the Operation of Electrical Installations» Clauses 1.5.1.7 and 3.4 by single-core insulated
copper or aluminum wires having 0.5 to 4 mm2 section depending on the kind of circuit.
It is allowed to use terminated multicore cables having the same section area. Metering circuits
terminal length must be from 15 to 20 mm.
The following requirements must be met during installation of input and output circuits:
1) Metering circuits must be wired in compliance with « Rules for the Operation of Electrical In-
stallations» Clauses 1.5.19 and 3.4.4 by at least 2.5 mm2 section copper wires or 4 mm2 section alumi-
num wires. The internal meter circuits connected to the neutral line (common metering wire) between
compression plate terminals 10 and 11 (Figure 1. SX2) are designed for maximum current 10 A, one
minute (damage threshold).
2) Mains power supply circuits must be wired by 1.0 to 2.5 mm2 copper wires.
3) The mains power supply circuit must be equipped with an automatic circuit breaker designed
for (10 – 15) Iav operation current (where Iav is the average current consumed by the meter from the
mains).
4) For avoidance of the meter breakdown, connection to DC or AC voltage exceeding the speci-
fied one is not allowed.
5) Long-term exposure of the meter insulated circuits to DC and AC voltage exceeding 24 V is
not allowed.
6) Screws must be tightened with the following torque:
M2.5 – 0.4-0.5 Nm;
M3 – 0.5-0.6 Nm;
M4 – 1.2-1.5 Nm;
ATTENTION!

TLAS.411152.002-01 RE
88
IT IS NOT ALLOWED TO PERFORM INSTALLATION OF ACTIVATED BINOM3
METER TO LIVE CONNECTED CIRCUITS UNDER DANGEROUS VOLTAGE!
2.6 Meter Installation
The meter shall be installed directly on a smooth surface (a wall, a panel, etc.).
Installation shall be performed in accordance with the following procedure:
1) remove covers from the meter (Figures 8 and);
2) depending on the chosen fastening method, mark out the installation place in compliance with
Figure 14.
Figure 14 - Marking Out the Meter Installation Place
3) install a screw into the top hole (Figure 14);
4) install the meter on the screw and fasten it by screws through slots in the bottom part of its
casing and the bottom holes (Figure 14);
5) connect external circuits and power circuits to the meter connectors;
6) install the covers on their designated places;
7) apply power to the meter;
8) check the correctness of the meter circuits connection;
9) seal the meter covers (as necessary).

TLAS.411152.002-01 RE
89
2.7 Connection of External Circuits
2.7.1 Metering Circuits connection
The meters connection diagram is presented in Figures 15a - 15i.
A
N
C
B
BINOM3
1 2 3 4 5 6 7 8 9 10 11
Figure 15a - BINOM3 Meter Connection Diagram
to a Three-Phase, Four-Wire Network
via Voltage Measuring Transformers and Three Current Transformers.
1 2 3 4 5 6 7 8 9 10 11
A
N
C
B
BINOM3
Figure 15b - BINOM3 Meter Connection Diagram
to a Three-Phase, Four-Wire Network
(Direct Connection to Voltage Circuits
and via Three Current Measuring Transformers)

TLAS.411152.002-01 RE
90
A
C
B
BINOM3
1 2 3 4 5 6 7 8 9 10 11
Figure 15c - BINOM3 Meter Connection Diagram
to a Three-Phase, Three-Wire Network
via Voltage Measuring Transformers and Three Current Transformers.
A
C
B
BINOM3
1 2 3 4 5 6 7 8 9 10 11
Figure 15d - BINOM3 Meter Connection Diagram
to a Three-Phase, Three-Wire Network via Voltage Measuring Transformers Connected in
a Delta and Three Current Transformers

TLAS.411152.002-01 RE
91
A
C
B
BINOM3
1 2 3 4 5 6 7 8 9 10 11
Figure 15e - BINOM3 Meter Connection Diagram
to a Three-Phase, Three-Wire Network
(Direct Connection to Voltage Circuits
and via Three Current Measuring Transformers)
1 2 3 4 5 6 7 8 9 10 11
A
C
B
BINOM3
Figure 15f - BINOM3 Meter Connection Diagram
to a Three-Phase, Three-Wire Network
via Voltage Measuring Transformers and Two Current Transformers.
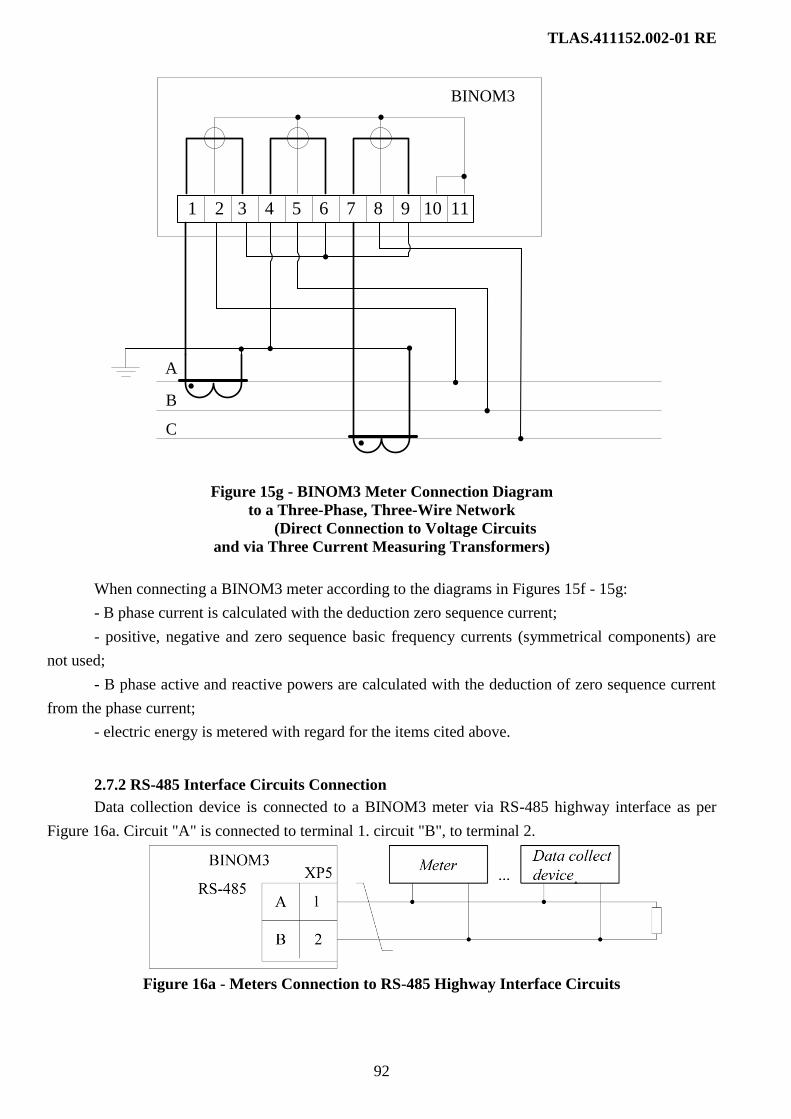
TLAS.411152.002-01 RE
92
1 2 3 4 5 6 7 8 9 10 11
A
C
B
BINOM3
Figure 15g - BINOM3 Meter Connection Diagram
to a Three-Phase, Three-Wire Network
(Direct Connection to Voltage Circuits
and via Three Current Measuring Transformers)
When connecting a BINOM3 meter according to the diagrams in Figures 15f - 15g:
- B phase current is calculated with the deduction zero sequence current;
- positive, negative and zero sequence basic frequency currents (symmetrical components) are
not used;
- B phase active and reactive powers are calculated with the deduction of zero sequence current
from the phase current;
- electric energy is metered with regard for the items cited above.
2.7.2 RS-485 Interface Circuits Connection
Data collection device is connected to a BINOM3 meter via RS-485 highway interface as per
Figure 16a. Circuit "A" is connected to terminal 1. circuit "B", to terminal 2.
Figure 16a - Meters Connection to RS-485 Highway Interface Circuits

TLAS.411152.002-01 RE
93
In case the meter has a RS-485/422 interface, a data collection device may be connected to the
BINOM3 meter as shown in Figure 16b.
Figure 16b - Meters Connection to RS-485/422 Interface
The maximum number of meters connected to a single interface is 20. The communication line
must be implemented as a twisted pair with 120 Ω characteristic impedance. Maximum line length -
600 m. 120 Ω termination resistors must be installed on the line ends. Maximum data transmission
speed: 460.8 kbit/sec.
The RS-485 (XS5) mating connector is delivered with the BINOM3 meter.
2.7.3 Impulse Output Connection Instruction
The test output output stage is implemented by an optrons with an open-collector output transis-
tor. To ensure its functioning, apply 4 to 24 V power voltage according to the diagrams presented in
Figure 17.
6
3
R+U
-U
XP5
6
3
R+U
-U
XP5
Figure 17 - Test Outputs Connection Diagrams
The ohmage of R resistance in the test output load circuit is determined by formula (89).
I
BUR
)0,1( , Ω (89)
where U is test output power voltage, V,
I is test output circuits current rate, A.
Nominal test output power voltage (10 2)V, the maximum permissible one: 24V.
Nominal current rate is equal to (10 1)mA, the maximum permissible one, not more than 30m.
The test output has protection circuits protecting against:
- incorrect power connection;
- overvoltage (more than 60 V).

TLAS.411152.002-01 RE
94
2.7.4 Power Circuits Connection
Primary mains power supply circuits (both AC and DC) are connected to the BINOM3 meter
with a single-core or multicore wire having 1.0 to 2.5 mm2
cross section (with regard for a possibly in-
stalled terminal) to XP2 220 V connector (cable, mating connector). One of the mains wires shall be
connected to the "L" contact (XP2:1), the other, to the "N" contact (XP2:3). In case DC voltage is con-
nected, connection polarity is irrelevant.
Backup mains power circuits are connected with a 1.0 to 2.5 mm2 single-core or multicore wire
to the XP2 220V connector. One of the mains wires shall be connected to the "+220В-2" contact
(XP2:2), the other, to the "N/-220В" contact (XP2:3).
The earthing circuit is connected to terminal 5 "PE" of XP "220 V" connector as per Clauses
1.7.121-1.7.135. «Rules for the Operation of Electrical Installations», Edition 7.
Mains power supply lines and their installation must meet the requirements of Section 6 GOST
12.2.091-2012.
A BINOM3 meter belongs to permanently connected multiphase equipment for which under
Section 6. GOST 12.2.091-2012 a switch or an automatic circuit breaker not being a part of the meter
must be used as a part of the meter.
2.7.4.1 Coordination with Automatic Circuit Breakers, Fuses and Protective Tripping De-
vices
The BINOM3 meter mains power network is protected with built-in slow-acting fuses having
nominal operation current 5 A. After built-in fuses operation, the meter is to be repaired.
An external automatic circuit breaker and/or fuses must ensure the meter power circuit tripping
at short circuit current ratings not exceeding 5 A. To ensure selective operation of the automatic circuit
breaker, use the data presented in Table 29.
Table 29 - Power Mains Consumed Starting Current Values
Time after Start, t Consumed Current, A
≈ 220 V = 220 V
50 µs≤ t 20 20
50 µs ≤ t <1.5 ms 10 5
1.5 ≤ t <30 ms 3 2
30 ≤ t <500 ms 0.5 0.3 (impulse)
500 µs ≤ t <2 s 0.15 (impulse) 0.03
2с ≤ t 0.06 0.03
The nominal operating current value of an automatic circuit breaker with a C type protective cha-
racteristic made as per GOST R 50345-99 is 2 A per one BINOM3 meter.
Additional requirements for the circuit breakers are presented in Section 6.
GOST 12.2.091-2012.
When using protective tripping devices, take into account possible 0.5 mA current leak to the PE
terminal of the "220 V" power supply connector.

TLAS.411152.002-01 RE
95
2.7.5 Remote Signaling Circuits Connection
Remote signaling (RS) sensor circuits are connected to the respective terminals of the "ТС" con-
nector (Figure 1). The "ТС" has 20 input terminals: "ТС1" – "ТС16", two internal power source termin-
als "+24V внутр.", one internal power source terminal
"+24V внеш." and "GND".
Remote signaling circuits connection diagram is presented in Figure 18. The following connec-
tions are presented in Figure 18:
- terminal 1 - a "dry contact" type sensor;
- terminal 2 - a "dry contact" type sensor with an external power source;
- terminal 3 - RS 24 V, 2 mA. When using semiconductor and other polarized RS sensor instead
of "dry contact" sensors, take into account their polarity when connecting them to the RS channel ter-
minals.
Figure 18 - RS Circuits Connection
Note: TS337A board (terminal 19) is powered either from an internal power source by installing
a jumper between contacts 17 and 19 or 18 and 19 or from an external source (Figure 18b).
Figure 18b - RS Circuits Connection Using
an External Power Source

TLAS.411152.002-01 RE
96
The connector terminals used allow connection of single-core and terminated multicore wires
having 0.2 mm2 to 2.5 mm
2. total cross-section.
When connecting a two-component remote signaling system, the position of circuit switching
devices ("two-bit RS") must be put in an "Off" - "On" sequence within a single pair of RS inputs (odd -
even, e.g., 1-2. as per Table 30).
Table 30 - Two-Bit RS Circuits Connection
Switched Object State Off On
Odd RS (low) Closed Open
Even RS (high) Open Closed
2.7.6 Remote Control Circuit Connection
Remote control (RC) circuits are connected to the respective terminals of TE3xRx relay block
connectors. The closing contacts of ON and OFF channels have a single common-wire circuit termi-
nated to two terminals and the contact intended for blocking automatic reclosing are insulated from
them and other device circuits. The enabling circuits of contactors, magnetic starters and other switching
equipment drives are connected to the ON terminals, the disabling circuits, to the OFF terminals, and
automatic reclosing blocking circuits, to the ARB terminals. The cross sections of the wires used for
connecting controlled devices must correspond to the control current ratings. The connector terminals
used allow connection of single-core and terminated multicore wires having 0.2 mm2 to 2.5 mm
2. total
cross-section.
Protective earth circuit is connected to a separate relay block PE terminal (on the block reverse
side) by an at lest 2.5 mm2 section wire.
Figure 19 shows an RC circuits connection diagram with a separate automatic reclosing blocking
circuit, Figure 20 - an RC connection diagram with an integrated automatic reclosing blocking circuit,
Figure 21 - an RC connecting diagram with independent RC enabling and disabling circuits.
Figure 19 – RC Circuits Connection with an Independent Automatic Reclosing Blocking Con-
tact

TLAS.411152.002-01 RE
97
Figure 20 – RC Circuits Connection with an Integrated Automatic Reclosing Blocking Contact
Figure 21 - RC Circuits Connection with Independent Enabling
and Disabling Contacts
RC circuits connection diagram for DC circuits switching is presented in Figure 22. In case the
power handled by TE38Rx block relays is insufficient, it is recommended to use a TE37Rx block with a
repeater relay (REP relay in Figure 22) with contact groups designed for the required load.
The additional REP relay being a part of TE3xRx block is enabled T1 ms later and disabled T2
ms earlier than ON, OFF, ARB relays. (T1 and T2 values are set in the process of parameterization).
The time diagram of a TE3xRx block relays is presented in Figure 23.
The time of ON, OFF, ARB relays contacts closing is set within the range from 0.5 s to 10 s.

TLAS.411152.002-01 RE
98
Figure 22 - RC Circuits Connection Diagram for DC Circuits Switching as Exemplified by
TE37R2 Block
Figure 23 - Relay Operation Time Diagram
2.8 Checking the Correctness of Meter Connection and Functioning
2.8.1 Checking Power Voltage Availability
Switch on the mains voltage. As power voltage as applied, "+5V" and "+3.3V" indicators are lit
on the meter face panel. The shining of the above indicators and the blinking of the "RUN/ERR" mean
that the meter is ready for operation.
A startup screen specifying the meter software name, version number and checksum is lit on the
meter display with a ~ 5 s delay. In about 2 s it is replaced by current time indicators (and cyclic dis-
playing of parameters if such an operation mode has been set). Check the meter running time readings
for conformity to the actual time. The appearance of the startup screen on the meter display is presented
in Example 1.
Example 1:
Add. relay "REP"
t
TRC s.
T2 T1
On (Off, ARB)
0.1-10 s.

TLAS.411152.002-01 RE
99
2.8.2 Switching Metering Circuits on
Switch on metering circuits. Check the meter serviceability by switching indication modes by
buttons located on the meter front panel as specified in Subclause 1.1.4.6.
Make sure that currents, voltages and metered energy values are displayed on the indicator.
2.8.3 Checking Correctness of the Meter Connection
For checking correctness of the meter connection, it is necessary to apply the respective currents
and voltages to the respective circuits.
When the meter is correctly connected and active power values exceed the threshold ones,
"АВАР" ("FAULT") indicator must not be lit.
In case signs of active phase powers do not correspond to the expected sign, change the direction
of the respective phase current.
Configure the meter as described in Cl. 2.9. if necessary.
Install the compression connector protective cover, fix it with two screws and seal it.
Make an entry to the meter datasheet recording the dates of its installation and putting into op-
eration.
2.8.3.1 Filling in Information on the Meter Plate
For convenience of operation, the meter plate (keypad) is equipped with a plate for noting the ac-
tual operation conditions data: transformation ratios КТ =, КН =, КТ x КН = .
2.9 BINOM3 Meter Configuring
BINOM3 meters are configured with the help of the BINOM3 Web server built in the meter that
allows users to enter and edit the BINOM3 meter parameters and read data.
The factory configuration is presented in the document "BINOM3 Multifunctional Electric Ener-
gy Quality Meters". Interaction Protocols. TLAS.411152.002 D1».
2.10 Procedure of the Meter Removal from Operation
When removing the meter from the operation, perform the following actions:
- before disconnecting the meter, make sure that all necessary data stored in the meter memory
have been read with the help of the control computer software;
- deenergize the power, metering and communication circuits;
- if you use a meter with a backup power supply option, switch off the meter by a command from
the keypad;
- remove terminals and remote signals covers;
- disconnect the meter from power, metering and communication circuits;
- remove three fastening screws (Figures 8. 9) and remove the meter;
- put the meter in the packing box;
- make an entry to the meter datasheet recording the dates of the meter removal and putting out of
operation.

TLAS.411152.002-01 RE
100
3 TECHNICAL MAINTENANCE
The meters must undergo technical maintenance as per GOST 18322-78. Established mainten-
ance procedure includes scheduled status checks, as well as unscheduled check in order to find out con-
sequences of facility accidents. Technical maintenance is performed by the operator organization.
The scope, procedure and frequency of scheduled checks must conform to the active power
equipment operation instructions adopted at the operator organization. In the process of scheduled
checks, the meter status is inspected, its surface is cleaned from dust and dirt.
Unscheduled maintenance is performed in case of faults. It includes determining and correction
of occurred faults by the personal authorized to perform such works.
The relay block connected to the meter does not require operator actions during operation. In
case it is necessary to perform the relay block technical maintenance, disconnect interface and power
circuits from it and make sure there is no static electricity.
Recommended meter maintenance frequency and checkup methods are presented in Table 31.
Table 31 - Recommended Meter Checkup Frequency and Methods
Work Name Checkup
Method
Checkup
Frequency
during
Operation
during
Storage
Checking availability of seals Visually Scheduled 1 year
Removing dust from the meter casing and
face panel
3.1.1 Scheduled 1 year
Performance, functionality check 3.1.3 Scheduled -
Clock rate check
Visually, by
display read-
ings Scheduled -
Checking the condition of connectors, con-
nection reliability of the meter metering,
power and interface circuits 3.1.2 Scheduled -
Checking the condition of fastenings Scheduled -
Backup power supply check 3.2 1 year 1 year
Clock battery serviceability check 3.3 1 year 1 year
Meter verification Reference
meter.
Verification
procedure
Verification inter-
val -
After finishing maintenance, make an entry in the meter datasheet.

TLAS.411152.002-01 RE
101
3.1 Scheduled Technical Maintenance
3.1.1 Dust is removed from the meter surface by clean and soft wiping rags.
3.1.2 For checking the reliability of power and interface meter circuits, it is necessary to:
remove seals from covers, remove fastening screws and covers;
remove dust from the compression plate (terminal strip) power, signal and interface connec-
tors with the help of a brush;
tighten the screws fastening metering, power, signal and interface circuit wires;
reinstall the covers, fasten them with screws and seal.
Frequency of scheduled technical maintenance during operation - 3 years.
ATTENTION!
BEFORE STARTING WORK, DEENERGIZE THE METER AND RELAY BLOCK
CONTACTS!
3.1.3 Functional check is performing at the meter operation site: power circuits are loaded with
real loads - the meter must meter electric energy, the indicator must display actual current, voltage,
power values. The date and time display on the meter LCD must correspond to the current value in view
of the clock error, possibly without regard for daylight saving time and time belt.
3.2 Checking Backup Power Supply from an Internal Battery
The purpose of checking backup power supply is also training and recharging the internal battery
during the meter warehouse storage.
Backup power supply is checked as follows:
1) Switch the meter on. Check whether the battery charger is on.
2) If the charger is on, wait till the battery is fully charged.
3) After the charger trip, switch off the meter primary power supply and record time.
4) Record the time of automatic meter trip (for the built-in battery, from 30 min. to 1 hour) and
switch on the meter primary power supply. Wait till the battery is fully charged (for a built-in battery
~24 h, at ambient temperature less than 30 °С).
5) Backup power supply is considered as serviceable if the meter and charger autonomous opera-
tion time corresponds to the time specified in the documentation.

TLAS.411152.002-01 RE
102
3.3 Clock Battery Check
3.3.1 Checking Clock Battery Serviceability During Operation
For checking the clock battery serviceability, switch on the meter unless it was already on.
The date and time displayed on the meter LCD must correspond to the current value in view of
the clock error.
If the date, time and clock deviation change do not correspond to the required value, the meter
must be removed and sent to the manufacturer plant for repairs. Make an entry to the meter datasheet re-
cording the dates of the meter removal and putting out of operation.
3.3.2 Checking Clock Battery Serviceability During Storage
To ensure meter serviceability during storage, the procedure of clock battery recharging must be
performed at least annually. For that purpose, switch the meter on for a period of time not exceeding 1
hour. After that, make sure that the date and time displayed on the meter LCD correspond to the current
value.

TLAS.411152.002-01 RE
103
4 CURRENT REPAIR
4.1 General Guidelines
The meter cannot be repaired by the operator organization. Routine repairs are performed by the
manufacturer or legal and natural persons licensed to perform repair of the meter.
After repair, the meter is to be verified.
4.2 Troubleshooting
Possible meter faults and the methods of their correction are presented in Table 32. Information
in Event Logs allows to determine the meter fault and its possible cause. Should it be impossible to cor-
rect the above faults as described, it is necessary to apply to the repair service or to the manufacturer.
Table 32 - Troubleshooting
Fault Cause Method of Correction
"+3.3V" and "+5V" indicators
are not lit.
No power voltage Connect power voltage to the meter
Faulty meter power source Dismantle the meter and send it to
the manufacturer for repair
No image on display, the dis-
play is lit
The indicator contrast has
not been adjusted
Adjust contrast
Faulty TP337A module Dismantle the meter and send it to
the manufacturer for repair
Faulty interface
RS-485
A wire has been discon-
nected from the connector
Check connection circuit
No contact in the connec-
tor
Check communication cable
Noncompliance of the re-
ceipt/transmission parame-
ters to the required values
Check meter parameterization
Faulty TP337A module Dismantle the meter and send it to
the manufacturer for repair

TLAS.411152.002-01 RE
104
Table 32 (Continued)
Fault Cause Method of Correction
Incorrect date/time indication
on the meter
Real-time clock unit bat-
tery empty
If the meter was not operated less
than a year:
- charge the clock unit battery by
leaving the meter on for 24 hours;
- check the clock operation after
loading the battery
Faulty real-time clock unit Dismantle the meter and send it to
the manufacturer for repair
ALARM indicator is lit
No voltage and/or current
in one of the phase cables.
Significant unsymmetry of
connected phases opera-
tion.
No active energy metering
Check conformity of the meter read-
ings and status registers to the con-
nection operation mode (as per Cl.
2.8.3 hereof)
Incorrect meter connec-
tion
Check the meter connection (as per
2.8.3 hereof)
Faulty meter input circuit Dismantle the meter and send it to
the manufacturer for repair

TLAS.411152.002-01 RE
105
5 CALIBRATION
5.1 The meter is subject to State metrological control and supervision.
5.2 The meter shall be verified only by the State Metrological Service or accredited metrological
services of legal persons.
5.3. Calibration shall be performed in compliance with the document "BINOM3 Multifunctional
Electric Energy Quality Meters". Calibration procedure TLAS.411152.002 PM.
Interval between verifications – 12 years.
Note: for meters exported out of the Russian Federation interval between calibrations shall con-
form to the importer country's regulatory documents.
6 STORAGE
Limiting storage conditions at ambient air temperature from minus 50 to plus 50°C and relative
air humidity not exceeding 95% at temperature plus 30°C in compliance with group 3 as per GOST
15150-69.
Warranty shelf life: 60 months since the moment of the meter manufacture
Shelf life is valid subject to the user's compliance with the requirements of existing operation
documentation.
The content of dust, acid and alkali fumes, aggressive gases and other corrosive impurities at the
places where BINOM3 meters are stored must not exceed corrosive agents content for type 1 atmos-
phere as per GOST 15150-69.

TLAS.411152.002-01 RE
106
7 TRANSPORTATION
The meters may be transported in covered railroad waggons, by motor transport with protection
against rain and snow, by water transport and in pressurized heated airplane compartment. Transporta-
tion must be performed in compliance with the rules of carriage valid for each type of transport.
In respect of climatic and mechanical impact under limiting transportation conditions, the meters
meet the requirements of group 4. GOST 22261-94:
- temperature: from minus 50 °C to plus 55 °C;
- relative air humidity: 95 % at 35° C temperature;
– atmospheric pressure: from 70 to 106.7 kPa (from 537 to 795 mm Hg).
- transport jolting - 80-120 jolts per minute with maximum acceleration 30 m/s 2 and 1 h impact
duration.
Shipping type - small consignments, less-than-truckload.
Packed meters in vehicles must be fixed in order to ensure a stable position, exclude shifting and
jolts. During load handling work and transportation, the requirements of consumer package marks must
be complied with.
After transporting the meters under subzero temperatures, they must be unpacked only after sto-
rage for at least 12 h under (20 ± 5) °С temperature.

TLAS.411152.002-01 RE
107
8 DISPOSITION
The meter modules are to be disposed of according to the rules adopted at the operator organiza-
tion.
9 REALIZATION
BINOM3 meters, including relay blocks, are realized under delivery contracts.
10 GUARANTEES
10.1 The Manufacturer guarantees conformity of the BINOM3 meter that passed the Manufac-
turer's QC tests and sealed by the verification seal to the requirements of TU 4228-008-80508103-2014
specifications for 30 years subject to compliance to operation, storage and transportation conditions.
This guarantee does not apply to any hardware and software that were not manufactured by the
Manufactured even if they were packed and sold together with the Manufacturer's products.
10.2 Guaranteed shelf life: 6 months since the moment of the BINOM3 meter manufacture.
Upon expiry of the guaranteed shelf life, the guaranteed operation period starts irrespective of whether
the BINOM3 meter has been put into operation or not.
10.3 Guaranteed service life: 36 months since the date of putting the BINOM3 meter into opera-
tion but not more than 42 months since the date of the BINOM3 meter manufacture.
10.4 During the guarantee period, the Manufacturer undertakes to rectify the BINOM3 meter
defects by repairing it provided the defect occurred through the Manufacturer's fault.
10.5 The guarantee period does not apply to:
- batteries;
- connection cables, data storage devices (memory cards);
- package and documentation delivered with the product;
- embedded software and the need for software reinstallation and setting, unless such a need is
caused by a BINOM3 meter fault that arose through the Manufacturer's fault.
10.6 The manufacturer is not liable for its guarantee obligations for the BINOM3 meter dam-
ages that were detected during the guarantee period if such defects arose in the following cases:
- BINOM3 meter damage that occurred because of noncompliance to the transportation rules
and storage conditions;
- breaking the Manufacturer's seals; the BINOM3 meter bears traces of tampering or attempts
of self-made repairs or traces of serial numbers and seals alterations;
- unauthorized changes to the BINOM3 meter design have been detected;
- cosmetic damage of the BINOM3 meter, including but not limited to scratches, dents and
broken parts;
- if the BINOM3 meter was operated not for its designated purposes or under conditions for
which it was not intended;

TLAS.411152.002-01 RE
108
- BINOM3 meter damage have been detected that were caused by incorrect connection to a
power source or connection to power sources that do not meet technical requirements;
- if it was detected that the BINOM3 meter was broken down because of operation rules viola-
tions or lack of BINOM3 meter technical maintenance;
- if the BINOM3 meter broke down because of incorrect actions during software update per-
formed by persons not being the Manufacturer's authorized representatives;
- if the BINOM3 meter broke down because of force majeure circumstances (such as a fire,
flood, earthquake, etc.);
- if the BINOM3 meter broke down because of mechanical, thermal, chemical and other types
of impacts if their parameters exceed their maximum operational characteristics;
- in case the BINOM3 meter was repaired by unauthorized persons.
10.7 Embedded Software
The BINOM3 meter embedded software is provided "as is" at the moment of the BINOM3 meter
delivery.
The Manufacturer may provide access to the embedded software updates and configuration files
at its own option and/or at the Customer's request and for the Customer's account. In any case, embed-
ded software update must be performed by the persons being the Manufacturer's authorized representa-
tives.
No one except the Manufacturer is entitled to copy and provide to other persons the opportunity
to copy, decompile, reverse engineer, attempt to decode the software structure, to alter the embedded
software or create derivative works on its basis.
10.8 BINOM3 meters are accepted for repairs (including guarantee service) only subject to
availability of the meter datasheet and a filled-in Certificate of Equipment Handover for Repair (the
above document is publicly accessible on the Manufacturer's website www.binom3.ru).
10.9 BINOM3 meter Repair Deadline:
is 30 workdays for guarantee service;
may amount up to 45 workdays for non-guarantee cases and up to 60 workdays in case of in-
termittent or periodical defects.
10.10 The guarantee period is prolonged for the period of guarantee period.
If the guarantee period expires earlier than a month after the meter repair, an additional guarantee
is established for it for 30 days' time since the moment of repair expiry.
10.11 The guarantee for replaced accessories expires together with the guarantee for the
BINOM3 meter.
10.12 The Manufacturer disclaims responsibility for possible damage directly or indirectly in-
flicted by the BINOM3 meter to persons, domestic animals and property in case it occurred as a result of
non-compliance with operation rules and conditions, deliberate or reckless acts of third persons.
10.13 The Manufacturer does not bear responsibility for the consumer' expenses for periodical
checkup and possible expenses for extraordinary checkup connected with the energy service companies'
requirements for verification frequency being less than 12 months on newly installed three-phase meters
(Rules for the Operation of Electrical Installations, v. 6. 1.5.13).

TLAS.411152.002-01 RE
109
The guarantee repair is performed at the Manufacturer (CJSC Vabtec) by the address:
111. Block A, Grazhdansky Prospect, Saint Petersburg, 195265. Russia
Telephone: (812) 531-13-68. fax: (812) 596-58-01.
E-mail: [email protected]