Embed Size (px)
Citation preview

Multidimensional Rhythm Disturbances as a Precursor ofSustained Ventricular TachyarrhythmiasVladimir Shusterman, Benhur Aysin, Kelley P. Anderson, Anna Beigel
Abstract—Cardiac cycle dynamics reflect underlying physiological changes that could predict imminent arrhythmias butare obscured by high complexity, nonstationarity, and large interindividual differences. To overcome these problems,we developed an adaptive technique, referred to as the modified Karhunen-Loeve transform (MKLT), that identifies anindividual characteristic (“core”) pattern of cardiac cycles and then tracks the changes in the pattern by projecting thesignal onto characteristic eigenvectors. We hypothesized that disturbances in the core pattern, indicating progressivedestabilization of cardiac rhythm, would predict the onset of spontaneous sustained ventricular tachyarrhythmias(VTAs) better than previously reported methods. We analyzed serial ambulatory ECGs recorded in 57 patients at thetime of VTA and non-VTA 24-hour periods. The disturbances in the pattern were found in 82% of the recordings beforethe onset of impending VTA, and their dimensionality, defined as the number of unstable orthogonal projections,increased gradually several hours before the onset. MKLT provided greater sensitivity and specificity (70% and 93%)compared with the best traditional method (68% and 67%, respectively). We present a theoretical analysis of MKLT anddescribe the effects of ectopy and slow changes in cardiac cycles on the disturbances in the pattern. We conclude thatMKLT provides greater predictive accuracy than previously reported methods. The improvement is due to the use ofindividual patterns as a reference for tracking the changes. Because this approach is independent of the group referencevalues or the underlying clinical context, it should have substantial potential for predicting other forms of arrhythmicevents in other populations.(Circ Res. 2001;88:705-712.)
Key Words: ventricular arrhythmiasn cardiac cycle dynamicsn orthogonal decomposition
A lthough substantial progress has been made in theunderstanding of arrhythmia mechanisms and identifi-
cation of individuals at risk, short-term prediction of thetiming of onset of sustained ventricular tachyarrhythmias(VTAs) has lagged, delaying development of preventivetreatments.1 Because autonomic activity is thought to be animportant trigger of VTA and because cardiac cycle lengths(CCLs) are modulated by autonomic tone, it has beenassumed that the analysis of the changes in CCL could predictthe timing as well as the triggers of VTA.2 This has beenconfirmed by studies that demonstrated heart rate increasebefore the VTA onset in many patients.2–5 However, thechange in heart rate before the onset of VTA is usually smalland indistinguishable from random daily variations.2,6 De-scriptors of heart rate variability proved useful in general riskassessment but failed to predict the timing of VTA.5,7
Probable reasons for the failure include the high complexityof the interacting physiological influences and violation ofthe statistical assumptions that underlie traditional tech-niques.8 In addition, the attempts to summarize highly non-stationary and individually variable CCL dynamics in a fewindices effectively resulted in non-uniform data compression
and frequent oversight of individual changes that precede theonset of VTA.9
To overcome these problems, we sought a new approach that(1) automatically learns individual characteristic or “core” pat-terns of CCL (CPCCL); (2) accommodates the diversity ofindividual CPCCL, including the presence of ectopy and changesin neurohormonal activity; and (3) tracks the changes in CPCCL
regardless of their linear or nonlinear properties. We used apattern-recognition approach based on the modified Karhunen-Loeve transform (MKLT) to develop a method that, in eachindividual, identifies CPCCL; we then tested the hypothesis thatdisturbances in CPCCL indicate destabilization of cardiac rhythmthat precedes the onset of spontaneous, sustained VTA. Toelucidate the origins of the disturbances, we examined the effectsof ectopy and compared MKLT with other techniques using theidentical data set.
Materials and MethodsPatient CharacteristicsClinical and Holter ECG data were collected prospectively in auniform fashion in the course of a NIH-sponsored clinical trial;protocols, methods, definitions, and patient characteristics have been
Original received May 30, 2000; resubmission received December 13, 2000; revised resubmission received February 14, 2001; accepted February 14,2001.
From the University of Pittsburgh (V.S., B.A.), Pa; Marshfield Clinic (K.P.A.), Marshfield, Wis; and Biosonix, Ltd (A.B.), Hod-Hasharon, Israel.Correspondence to Vladimir Shusterman, University of Pittsburgh, 200 Lothrop St, Room B535, Pittsburgh, PA 15213. E-mail
[email protected]© 2001 American Heart Association, Inc.
Circulation Researchis available at http://www.circresaha.org
705
by guest on July 10, 2018http://circres.ahajournals.org/
Dow
nloaded from
by guest on July 10, 2018http://circres.ahajournals.org/
Dow
nloaded from
by guest on July 10, 2018http://circres.ahajournals.org/
Dow
nloaded from
by guest on July 10, 2018http://circres.ahajournals.org/
Dow
nloaded from
by guest on July 10, 2018http://circres.ahajournals.org/
Dow
nloaded from
by guest on July 10, 2018http://circres.ahajournals.org/
Dow
nloaded from
by guest on July 10, 2018http://circres.ahajournals.org/
Dow
nloaded from
by guest on July 10, 2018http://circres.ahajournals.org/
Dow
nloaded from
by guest on July 10, 2018http://circres.ahajournals.org/
Dow
nloaded from
by guest on July 10, 2018http://circres.ahajournals.org/
Dow
nloaded from
by guest on July 10, 2018http://circres.ahajournals.org/
Dow
nloaded from
by guest on July 10, 2018http://circres.ahajournals.org/
Dow
nloaded from
by guest on July 10, 2018http://circres.ahajournals.org/
Dow
nloaded from
by guest on July 10, 2018http://circres.ahajournals.org/
Dow
nloaded from
by guest on July 10, 2018http://circres.ahajournals.org/
Dow
nloaded from
by guest on July 10, 2018http://circres.ahajournals.org/
Dow
nloaded from
by guest on July 10, 2018http://circres.ahajournals.org/
Dow
nloaded from
by guest on July 10, 2018http://circres.ahajournals.org/
Dow
nloaded from
by guest on July 10, 2018http://circres.ahajournals.org/
Dow
nloaded from
by guest on July 10, 2018http://circres.ahajournals.org/
Dow
nloaded from
by guest on July 10, 2018http://circres.ahajournals.org/
Dow
nloaded from
by guest on July 10, 2018http://circres.ahajournals.org/
Dow
nloaded from
by guest on July 10, 2018http://circres.ahajournals.org/
Dow
nloaded from
by guest on July 10, 2018http://circres.ahajournals.org/
Dow
nloaded from

described in detail.2,9 In brief, ambulatory 24-hour ECGs from 57patients (87% male, age 64610 years, 83% ischemic heart disease,and left ventricular ejection fraction of 0.3660.15) with spontaneoussustained VTA (duration:$30 seconds; rate:$100 bpm) and with aminimum of 2 hours of ECG data preceding the onset of VTA wereexamined. In addition, 86 serial 24-hour ECG recordings withoutVTA events were obtained from the same patients and included intoanalysis. All patients had a history of cardiac arrest, documentedventricular fibrillation, sustained ventricular tachycardia, or syncope.Enrolled patients had to have at least 10 premature ventricularcomplexes per hour and VTA induced at electrophysiological study.None of the patients were receiving antiarrhythmic drugs at the timeof the recordings. Patients with recent myocardial infarction,long-QT syndrome, hypertrophic cardiomyopathy, or arrhythmiasdue to transient or reversible disorders were excluded.
Data ProcessingECG data were digitized at 400 Hz, and the QRS complexes wereclassified using custom software and verified by a cardiologist.2 Theeffects of ectopy were estimated by analyzing an unfiltered series (allnatural cycles included) and a filtered series that excluded ectopicbeats and the 2 sinus beats that preceded and followed each ectopicbeat. The effects of pauses, escape beats, and short-long-shortsequences were eliminated by excluding intervals that differed by.75 ms from the moving average of 5 cycles. Gaps in the time seriesresulting from noise or ectopic beats were interpolated with linearsplines.10 The filtered series of RR intervals were regularly spacedand sampled at 2 Hz using a boxcar low-pass filter.11
Time Domain AnalysisThe mean and SD, square root of the mean of the squared differencesbetween adjacent cardiac cycles (r-MSSD), and percentage ofdifferences between adjacent cycles that are.50 ms (pNN50) wereestimated.
Frequency Domain AnalysisPower was integrated in the following frequency ranges: total power(TP), 0.01 to 0.4 Hz; high-frequency power (HFP), 0.15 to 0.4 Hz;low-frequency power (LFP), 0.04 to 0.15 Hz; and very-low-frequency power (VLFP), 0.01 to 0.04 Hz. The ratio of low- tohigh-frequency power (LFP/HFP) was also calculated.
Nonlinear IndicesApproximate entropy (ApEn), a measure of regularity, was estimatedas described by Pincus and Keefe.12 Briefly, ApEn measures thelikelihood that the maximum distance between the scalar compo-nents of vectors inm dimensional space will remain similar inm11dimensions. Low values of ApEn signify that them and m11dimensional patterns are similar. We used the same values ofdimension and distance (2 and 20% of SD, respectively) as in theprevious studies of the series of cardiac cycles.13,14
To calculate thea-1 anda-2 scaling exponents, first we computedthe root-mean-square fluctuations of integrated and detrended timeseries.15 Then the relationship between the root-mean-square fluctu-ations and the segment length was obtained as a slope on adouble-log graph for the segments that were shorter than 11 beats(a-1) and those that were longer than 11 beats (a-2).
Pattern Recognition AnalysisIn this algorithm, the series of cardiac cycles is separated into5-minute segments referred to as the unit vectors.16 Each unit vectorhas 600 points and can be represented as a vector with 600components in a Hilbert space. The high dimensionality of thisvector results in unwieldy complexity and obscures the detection ofunderlying pattern. The Karhunen-Loeve transform (or the principalcomponent analysis), which was modified by the investigators forthis application, allows simplifying the pattern and exposing its mostsignificant features. The reduction of dimensionality of the unitvector is achieved by projecting it onto linearly independent basisvectors or eigenvectors, which represent the most characteristic
features of the signal. To obtain the eigenvectors, first, a unitautocovariance matrix,U, is calculated for each unit vector (matricesappear in boldface type throughout this article). In this matrix, thestrongest relationships between the data samples are magnified,whereas the weakest ones that are usually related to noise arereduced. Averaging the matricesU for all unit vectors yields anaverage autocovariance matrix,C, that represents the most charac-teristic components of the entire signal. Then, the characteristiceigenvectors are obtained by diagonalizing the matrixC. To reducethe dimensionality of the original data with a minimal informationloss, we select the eigenvectors that correspond to the biggesteigenvalues.17 The quality of this reduction is controlled by theresidual error of the signal reconstruction from its low-dimensionalprojection. MKLT coefficients are obtained by projecting the origi-nal series onto the corresponding eigenvectors; the time series ofeach MKLT coefficient represents temporal changes in the proj-ection of the signal onto the corresponding eigenvector. Finally,because the time course of the changes does not correspond to theconstant 5-minute length of the unit vectors, the window lengths areadjusted to separate the segments with different properties (seeonline data supplement available at http://www.circresaha.org forfurther description).
Analysis of the Core Pattern of Cardiac CyclesThe first 6 eigenvectors of the matrixC, which contain most of theinformation about the signal, were extracted, and their MLKTcoefficients,ck, were obtained as described above. The time series ofck were used to estimate the SD of the series of each coefficient (sk).A 3sk threshold was established so that the probability of a randomoccurrence of the CCLs exceeding 3sk would be,0.0013 assuminga normal distribution. At the next step, the adaptive segmentationwas applied toc1 through c6, and the number of coefficientsexceeding the threshold (3sk) was calculated in each window (seeonline data supplement available at http://www.circresaha.org). Foreach subject, the thresholds were determined using the training setand then applied to the recordings from the same subject in the testsets. Combined excursions of severalck values beyond the thresholdreflect simultaneous instabilities in the orthogonal projections of thesignal, which in turn signify complex and pronounced changes in thepattern of cardiac cycles.
The CPCCL is said to be at a steady state when all 6 MKLTcoefficients are within the limits of 3sk. An excursion of 1 or moreMKLT coefficients beyond the 3sk threshold indicates disturbancesof CPCCL. The dimensionality (Dm) of the disturbances is defined asthe number of MKLT coefficients that simultaneously exceed thecorresponding 3sk thresholds. Thus,Dm shows the number oforthogonal projections in which the behavior of the series becomesunstable.
The relationships between the variables were analyzed using anonlinear Spearman correlation to eliminate the effects of the scalingdifferences between the studied variables.
ResultsSteady-State Pattern of Cardiac CyclesThe process of distinguishing the steady-state CPCCL and itsdisturbances is illustrated on a representative series of cardiaccycles beginning 16 hours before the onset of a spontaneous,sustained VTA in Figure 1. No clear pattern can be found inthe plot of cardiac cycles (Figure 1A). However, the 6 MKLTcoefficients plotted over the same time frame (Figures 1Bthrough 1G) expose the transition from the steady-statepattern to the CPCCL disturbances.
The shape and the magnitude of the autocovariance matrixC (see Materials and Methods) provide insight into thechanges in CPCCL. Matrix representations of the steady-stateCPCCL have smooth shape and low amplitudes of variations,indicating a regular but weakly correlated and nonperiodic
706 Circulation Research April 13, 2001
by guest on July 10, 2018http://circres.ahajournals.org/
Dow
nloaded from

structure of the series (Figure 2, top and middle). An increasein the magnitude of the matrix elements and the number ofspurious correlation spikes during the CPCCL disturbancesshows that multiple nonstationarities and irregular sequencesdevelop toward the onset of VTA (Figure 2, bottom).
The most significant basis vectors that represent CPCCL andtheir frequency content are shown in Figure 3. Because theslow changes predominate, the spectral energy of all eigen-vectors is concentrated in the low frequency range. Using ourprevious experiments, we chose the first 6 eigenvectors,which contain 88% of the information and represent CPCCL
with a 12% residual error. The time series of the correspond-ing MKLT coefficients track the most significant changes inthe structure of the signal over time, and multidimensional
(Dm.3) disturbances in CPCCL were detected in most patientsbefore the initiation of spontaneous VTA (Figure 4). Of note,different combinations of MKLT coefficients exhibited dis-turbances equally often before the onset time. Therefore, thedimensionality of the disturbancesDm, rather than the spe-cific combinations of MKLT coefficients, indicated an unsta-ble trajectory of the cardiac rhythm that led to the initiation ofarrhythmia.
Influence of Heart Rate and Ectopy on the Patternof Cardiac CyclesAverage heart rate represents an envelope or slowly changingcomponent of the cardiac cycle series. In most subjects, the
Figure 1. Cardiac cycle dynamics during 16 hours before onsetof a sustained VTA. A, Red dots indicate original, unfiltered car-diac cycle series; blue dots, series filtered to eliminate ectopicbeats, pauses, and outliers, as described in Materials and Meth-ods. B through G, MKLT coefficients c1 through c6 (arbitraryunits). Data are separated into 2 windows, W1 and W2, asdescribed in the online data supplement available at http://www.circresaha.org. In the first window, the core pattern of cardiaccycles is at steady state, which is indicated by low variations inMKLT coefficients. None of the coefficients exceeds the 3sthresholds. In W2, there is a 5-fold increase in variations of c1
through c6 compared with W1, and 5 of 6 coefficients (c2
through c6) in both filtered and unfiltered series exceed the 3sthresholds, indicating simultaneous instabilities in the 5 orthogo-nal projections of the signal. VTA starts at the end of W2 after 7hours of multidimensional (Dm55) disturbances in the core pat-tern of cardiac cycles (see text for discussion).
Figure 2. Matrix representation of the steady-state pattern ofcardiac cycles and its disturbances. Top, Average autocovari-ance matrix, C, for the entire 16-hour recording in Figure 1A.Amplitudes of variations are relatively small because averagingreduces the range of variability of matrix elements. This matrixrepresents a steady-state pattern of a stationary, nonperiodic,and weakly correlated structure of the signal. Note that for peri-odic and highly correlated signals, the matrix shape would showa clear periodic pattern. Middle, Matrix for the initial 5-hourperiod only. Compared with the entire recording (top), thismatrix has similar amplitudes and shapes of variations along thez-axis. Both matrices have a smooth shape, and the amplitudeof the nondiagonal elements is low. The similarity indicates thatthe series was at a steady state during the initial 5-hour period.Bottom, Matrix for the final 5-hour period that ended with theonset of VTA. The amplitude is 3 times higher than in the auto-covariance matrix for the initial period. In addition, there arelarge and randomly distributed spikes of spurious correlationsbetween cardiac cycles that reflect development of multiplenonstationarities and irregular sequences toward the onset ofarrhythmia.
Shusterman et al Multidimensional Rhythm Disturbances 707
by guest on July 10, 2018http://circres.ahajournals.org/
Dow
nloaded from

slow, minutes-to-hours variations of heart rate are predomi-nant, and this envelope contains most of the informationabout the series.9 Therefore, the time series of the first MKLTcoefficientc1 tracks the slow changes in the heart rate (Figure1B). However, the fact that the changes occur simultaneouslyin several MKLT coefficients shows that, in addition to theslow changes in heart rate, CPCCL and its disturbances arelinked to other independent dynamic processes.
To investigate the effects of ectopy on the series of MKLTcoefficients, the analysis was repeated after filtering outventricular and supraventricular ectopy and outliers as de-scribed in Materials and Methods (Figure 1A). Becauseectopic activity introduces ultrashort interbeat irregularitiesinto the series of cardiac cycles, the processing effectivelyeliminated or reduced the high-frequency beat-to-beat oscil-
lations. Although ectopy and short-term irregularities influ-ence CPCCL, the filtering did not affect the detection of CPCCL
disturbances that preceded the onset of VTA. This resultshows that the impact of slow changes in the cardiac cycleson CPCCL is more important than the influence of ectopy andultrashort interbeat irregularities. Note that measurements ofthe heart rate envelope (first MKLT coefficient) cannotadequately describe the complexity of these slow changes; atleast 6 MKLT components are required for tracking the CPCCL
disturbances.Because the eigenvectors are orthogonal, we examined the
dynamics of the series with and without ectopy using3-dimensional trajectories of the variances of the first 3MKLT coefficients (Figure 5). The variations of the trajec-tories in the plane of the 2 most significant MKLT coeffi-cients are similar, indicating that the disturbances in CPCCL arenot eliminated by filtering of ectopy. However, the serieswithout ectopy has lower amplitude of variation for the thirdMKLT coefficient, showing that ectopy and ultrashort irreg-ularities mostly affect the higher-order MKLT coefficients.
Multidimensional Disturbances in the Patternof Cardiac Cycles and the Initiation ofVentricular TachycardiaThe training data set comprised tapes from 30 patients with asingle VTA during the 24 hours. Using the disturbances thathad Dm54 to 6, the initiation of VTA was predicted with70% sensitivity and 93% specificity during the 6.864.4 hoursbefore the onset (Table 1). The number of MKLT coefficientsexceeding the threshold increased progressively over severalhours before the event, indicating gradual increase in thedimensionality (complexity) of the disturbances and progres-sive destabilization of cardiac rhythm (Figure 4).
The robustness of the method was validated in the 2demanding test sets. The generality test set consisted of 27ambulatory recordings from a different group of patients whohad several VTAs during the 24-hour period. The longestVTA was chosen as the index event. Multiple disturbancesthat preceded the onset of each VTA enhanced the variance ofMKLT coefficients and interfered with the analysis of theindex event. This provided a naturally “noisy” environmentfor testing the robustness of MKLT on the most complicatedperturbations of cardiac cycles. Predictably, the accuracy ofthe method decreased, but the expected decline of sensitivityand specificity was relatively modest (Table 1). The speci-
Figure 4. Progressive increase in the dimensionality of theCPCCL disturbances toward the onset time of VTA. Number ofMKLT coefficients exceeding 3s thresholds increased beforeinitiation of VTA, indicating accumulation of multidimensionalinstabilities in the series of cardiac cycles (P50.03).
Figure 3. Time domain (left column) and spectral (right column)representation of the first 6 eigenvectors that were obtainedfrom the autocovariance matrix shown in Figure 2A. The eigen-vectors fi were ordered according to the corresponding eigen-values of which the absolute values represent the amount ofinformation in the corresponding eigenvectors. After this reor-dering, f1 represents the slowly changing envelope of theseries, because the largest variations occur in the very-low-frequency range of the spectrum. Spectral peaks of f2 to f6
gradually shift to the higher frequencies. This reflects the multi-component structure of the signal in which the higher-frequencyelements have lower amplitudes of variations. Eigenvectors arenonstationary and nonperiodic, reflecting nonstationarity of theseries. If the series contained only 1 or 2 periodic components,it could be represented by 1 or 2 eigenvectors. In contrast,reconstruction of the series under consideration with 6 eigen-vectors still gives a 12% error, which indicates the presence ofmultiple nonperiodic components.
708 Circulation Research April 13, 2001
by guest on July 10, 2018http://circres.ahajournals.org/
Dow
nloaded from

ficity test set included 86 serial 24-hour VTA-free ECGsfrom the same patients who had VTAs in the training set. Inthis test set, a steady-state CPCCL was identified and thedisturbances leading to the initiation of VTA were excluded,with a specificity of 73%. When the arrhythmia-free tape wasrecorded within 3 months from the time of the trainingrecording, the specificity increased to 80% (n540), whichsuggests that CPCCL remains unchanged for 3 months and thenchanges slowly over a longer period. Inclusion of ectopy intothe analysis increased the sensitivity of the method but didnot change the specificity as compared with the series ofCCLs without ectopic beats and outliers (Table 1).
Relationship Between the Changes in the Patternof Cardiac Cycles and Traditional Linear andNonlinear IndicesThe sensitivity and specificity of MKLT in predicting theonset time of VTA (Table 1) were higher than those of
traditional linear and nonlinear methods (Table 2). Series ofthe time domain, spectral, and nonlinear indices werestrongly correlated with the dynamics of cardiac cycles(P,1024). The most prominent changes in all studied indicesresulted from signal nonstationarities that elicit profound andcomplex perturbations in the basic structure of the series(Figure 6). However, the traditional indices could not distin-guish among the changes in a singular property, in a multi-tude of properties, and in the entire structure of the series. Thesensitivity of each index depended on a type of perturbation.Therefore, no single index could expose the complexity or themagnitude of multidimensional changes; some perturbationswould be missed or underestimated with a single-index ap-proach. In contrast, MKLT provides an accurate quantitativedescription of the magnitude and complexity (ie, dimensionality)of the changes, and therefore, it is more effective in detecting thetransients that precede the onset of VTA (Table 2).
DiscussionMain Results and Comparison WithPrevious StudiesMultidimensional disturbances in the individual pattern ofcardiac cycles provided more sensitive and specific predic-tion of the onset time of VTA than traditional linear andnonlinear methods (Tables 1 and 2). Although changes inheart rate, traditional time domain, spectral, and nonlinearestimators, including ApEn and scaling exponents, have beenreported before the onset of VTA, their predictive value wasnot assessed.2–5,18
Data about the accuracy of prediction of the onset time arescarce. Skinner et al19 reported that changes in the correlationdimension, a nonlinear measure of signal complexity, identi-fied 11 Holter ECGs with ventricular fibrillation (sensitivity,91%; specificity, 85%). Mani et al20 found that changes in thespectral power in the 0.8 to 0.9–Hz frequency range predictedthe onset of VTA with 76% sensitivity and 76% specificity in78 patients using 1024 CCLs. Because the training set and thetest set were not separated in these studies, the generality ofthe results (ie, applicability to other groups) could not beconfirmed.21 Furthermore, the specificity of the findings is
Figure 5. Dynamics of the series shown in Figure 1A in the3-dimensional space of the first 3 eigenvectors. Shown are tra-jectories of 60-minute variances of corresponding MKLT coeffi-cients with (red line) and without (blue line) ectopy. At the begin-ning of the recording, both trajectories are close to the origin,indicating a steady state (shaded area). Eight hours later, thetrajectories become unstable and make complex movements inall 3 directions. The 2 trajectories have similar amplitudes ofvariations in the c1,c2 plane, which represents most of the infor-mation about the signal. However, the filtered series has loweramplitude along the c3 axis, showing that filtering the ectopyreduces variations of ci for i.2.
TABLE 1. Dimensionality of the Disturbances in the Pattern of Cardiac Cycles and the Effectsof Ectopy on the Prediction of the Onset of Sustained VTAs
Training Set Generality Test Set
Dm
With Ectopy Without Ectopy With Ectopy Without Ectopy
SN SP SN SP SN SP SN SP
6 3 100 z z z z z z z z z z z z z z z z z z
$5 50 100 27 90 30 83 40 83
$4 70 93 37 80 57 83 50 80
$3 70 80 43 77 70 80 67 77
$2 80 70 57 77 77 63 73 73
$1 83 67 67 70 80 60 73 63
SN indicates percentage sensitivity of prediction of the VTA onset; SP, percentage specificity of the prediction; withectopy, series that include ectopic beats; and without ectopy, series that have ectopic beats and outliers removed asdescribed in Materials and Methods.
Shusterman et al Multidimensional Rhythm Disturbances 709
by guest on July 10, 2018http://circres.ahajournals.org/
Dow
nloaded from

unclear because the analysis did not include serial recordingsfrom the same patients during the VTA-free periods.
Because comparative analysis of the methods applied todifferent groups is limited, we used an identical data set tocompare the performance of MKLT with that of the tradi-tional techniques (Table 2). The methods were initiallyapplied to a training set, and then the sensitivity and speci-ficity were tested on the other 2 test sets. The generality testset included 24-hour ECGs from a different group of patientswho had multiple spontaneous VTAs. In contrast to theprevious studies, the prediction was considered correct if andonly if the onset occurred within the same time window, ofwhich the length was determined by the algorithm (see onlinedata supplement available at http://www.circresaha.org fordetails). The specificity test set included serial 24-hourVTA-free ECGs from the same patients who had VTAs in thetraining set. This set allowed us to assess specificity andtemporal stability of MKLT. In all sets, the predictiveaccuracy of MKLT was similar, which confirms generalityand reliability of the results (Table 1).21 The predictiveaccuracy did not change if the recordings were obtainedwithin 3 months, which shows that CPCCL remains stableduring this period.
In agreement with previous studies, inclusion of ectopicbeats into analysis improved the accuracy of the prediction.20
This shows that an increase in the number of ectopic beatsand ultrashort irregularity plays an important role in the CPCCL
disturbances in some patients. Still, the disturbances of thesame dimensionality could be detected before VTAs in morethan half of those patients who had them before filtering. Thissuggests that in most patients, the CPCCL and its disturbances
are determined not by ectopy or ultrashort irregularities butby the more complex, longer-term relationships between thecardiac cycles. This observation is consistent with the pre-dominant spectral energy concentration in the very-low-frequency range, which has an important prognostic value.22
Our results, as well as other recent reports, provide newinsights into the role of the very-low-frequency oscillationsand their nonstationary behavior.23
Modified Karhunen-Loeve TransformAlthough the traditional methods detected some changes, thesearch for specific precursors of VTA was impeded by violationof the statistical assumptions that underlie the traditional tech-niques. The traditional methods assume (1) that the signal isstationary and (2) that the changes occur in a single, a priori–defined property, whereas all other properties remain un-changed. However, the series of CCL before the onset of VTAare highly nonstationary, have enormous structural individualvariability, and have a large number of unstable properties thatcannot be adequately described by single-valued techniques.8
MKLT can be considered as a generalization of thetraditional methods that are limited by the assumptions of thestationarity of the signals and by the single-feature searchingcapabilities. Indeed, the Fourier transform can be consideredas a special case of MKLT in which the basis functions arecomplex exponentials.17 If the series is periodic and station-ary, the Fourier transform can project the signal onto a finiteset of periodic basis functions and thus expose the corre-sponding frequency elements. However, stationarity and ex-act periodicity are not characteristics of the signals thatprecede VTA. The time domain indices, including SD,r-MSSD, and pNN50, also capture certain a priori–definedproperties of the signal that may or may not represent thechanges that occur before the onset of VTA.24 The nonlineardescriptors, ApEn and scaling exponents, also attempt to
Figure 6. Changes in CCLs and their SDs, r-MSSD, pNN50,LFP, ApEn, a-1, and a-2 for the original (unfiltered) series in Fig-ure 1A. Series were normalized to eliminate scale differencesand then distributed along the y-axis by adding a multiple of asmall constant e. LFP is shown because it exhibited the mostpronounced change among the other spectral indices beforeonset of VTA.2 All series are highly correlated and exhibit pro-nounced changes in the second, nonstationary part of the re-cording because of the profound and complex perturbations inthe structure of the original series of cardiac cycles. However,the traditional indices do not distinguish between the change ina singular property, a multitude of properties, and the entirestructure of the series. Therefore, no single index can quantifythe entire complexity or magnitude of the changes. Note that inthis example, the sensitivity to the nonstationarity of the nonlin-ear indices, ApEn, a-1, and a-2, is less than that of the linearindices, r-MSSD, pNN50, SD, and LFP. Because responsive-ness of any single index to different types of changes varies,some perturbations may be underestimated or missed if a singleindex is used.
TABLE 2. Traditional Linear and Nonlinear Techniques toPredict the Onset of VTAs: Results Are Shown for theBest-Performing Parameters (3s Thresholds and 8-HourWindows) and for the Series That Include All Ectopic Beats
Training Set Generality Test Set
SN SP SN SP
HR 29 83 20 77
TP 48 67 44 46
VLFP 61 61 60 46
LFP 61 61 52 46
HFP 65 67 56 46
LFP/HFP 68 67 52 31
SD 35 72 32 62
pNN50 52 67 36 54
r-MSSD 19 72 12 62
ApEn 26 61 28 46
a-1 13 67 16 62
a-2 23 50 16 62
SN indicates percentage sensitivity of the prediction of the VTA onset; SP,percentage specificity of the prediction; and HR, heart rate.
710 Circulation Research April 13, 2001
by guest on July 10, 2018http://circres.ahajournals.org/
Dow
nloaded from

summarize the complexity of the series using a singlemeasure that is selectively sensitive to certain types ofchanges. ApEn, for example, does not respond to the changesin amplitude but reacts to the changes in variance andtherefore can be used only on the series of which thevariances are relatively stable.12 As Figure 6 clearly shows,changes in ApEn and scaling exponents before the onset ofVTA reflect changes in the variance rather than specificchanges in the complexity of the signal. In addition, interpre-tation of changes in ApEn is obscured by its sensitivity toectopy, whereas MKLT analysis, as our results demonstrate,is relatively unaffected by ectopy.25
Semantic analysis, which has been proposed for character-izing short sequences of cardiac cycles, can also be consid-ered as a special case of MKLT in which a small number offeatures are explicitly modeled using a limited set of param-eters.26 The method is appropriate for simple patterns; how-ever, complex and individually variable disturbances wouldrequire an enormous number of descriptors. In contrast,MKLT has an advantage of learning complex, highly variableindividual patterns without the limitation of explicitmodeling.
Using a method similar to MKLT, Ivanov et al8 showedthat a set of wavelet coefficients provides a better generalassessment of the cardiac cycle complexity than single-valued techniques. Motivated by the complexity of cardiaccycle dynamics and the inability of any single index torepresent multidimensional changes, we used a set of MKLTcoefficients to track the dynamics of the series. However, themethod of Ivanov et al8 gives a general assessment of signalcomplexity, whereas MKLT was applied here to detect andquantify the complexity (dimensionality) of the short-termchanges. In contrast to the constant, empirically definedwavelet function and analytic scales in the method of Ivanovet al,8 the MKLT basis vectors are directly derived from eachindividual series and represent a “fingerprint” or characteris-tic steady-state pattern. This adaptive property of MKLTmakes it uniquely sensitive to the changes in the seriesregardless of interindividual differences.
The traditional Karhunen-Loeve transform (KLT) has longbeen used for analysis of electrocardiographic waveforms andtheir spatial and temporal distribution.27,28 There are, how-ever, important differences between the traditional applica-tions of KLT and MKLT analysis. First, the traditional KLTrequires the investigated pattern, eg, the QRS complex, to bedeterministic and already identified. In contrast, MKLT is“blind” to the shape and location of the characteristic patternand does not require any prerequisite classification of theseries of cardiac cycles. Second, in the traditional KLT, theresulting “typical” pattern resembles individual waveforms,and their relationship can be examined by visual inspection orcorrelation analysis. In MKLT, the characteristic pattern iscomplex and nondeterministic; this requires examination ofthe variances of MKLT coefficients. Third, the time windowsin the traditional KLT analysis are constant and a prioridefined, whereas in MKLT, the time windows are automati-cally adjusted to separate the segments with differentproperties.
Future ResearchThe idea that the dynamics of cardiac cycles may revealhidden instabilities that precede the onset of arrhythmias isnot new.29 Still, most events are unheralded, which has led tothe perception that the initiation of malignant arrhythmias isthe immediate consequence of a random event such as acritically timed premature beat. Unexplained is why thepremature depolarizations that appear to initiate VTA havenot been shown to have the features that clearly distinguishthem from the thousands of premature beats that occur dailyin patients with heart disease but do not initiate arrhythmias.1
In contrast, we detected disturbances in CPCCL severalhours before the onset of VTA. The gradual increase in thedimensionality of the disturbances (Figure 4) could reflectchanges in the milieu that transform an otherwise benignpremature depolarization to a malignant trigger and mayexplain why spontaneous arrhythmias usually occur withoutthe signs of intense stimulation (multiple tightly coupledextrastimuli, acute ischemia, or high concentrations of ar-rhythmogenic drugs) that is required for artificial initiation ofarrhythmias.1 The slow development and continuance of aproarrhythmic vulnerable state could also explain why sus-tained arrhythmias often occur in clusters.30 On the otherhand, low-dimensional disturbances do not necessarilyprogress but may resolve, followed by resumption of a steadystate. Certain modes of stimulation are shown to preventarrhythmias, suggesting that restoration of the steady-stateCPCCL reverses the progression of electrophysiologicalchanges and prevents arrhythmia.31
Disturbances in CPCCL have also been reported before theonset of paroxysmal atrial fibrillation.32 Description of thetime course and dimensionality of the disturbances thatprecede the onset of different arrhythmias might lead to thedevelopment of clinically useful predictive algorithms.
In summary, hours before the onset of sustained VTAs,there is evidence for progressive changes in the core patternof cardiac cycles. Better understanding of these events couldlead to methods of predicting and preventing arrhythmias andsudden cardiac death.
AcknowledgmentsThis study was supported by Scientist Development Grant 0030248Nfrom the American Heart Association, by NIH Specialized Center ofResearch Grant P50 HL52338, and by a grant from GuidantCorporation of St. Paul, Minn.
References1. Myerburg RJ, Kessler KM, Castellanos A. Sudden cardiac death:
structure, function, and time-dependence of risk.Circulation. 1992;85(suppl I):I2–I10.
2. Shusterman V, Aysin B, Gottipaty V, Weiss R, Brode S, Schwartzman D,Anderson KP, ESVEM Investigators. Autonomic nervous system activityand the spontaneous initiation of ventricular tachycardia.J Am CollCardiol. 1998;32:1891–1899.
3. Pruvot E, Thonet G, Vesin JM, van-Melle G, Seidl K, Schmidinger H,Brachmann J, Jung W, Hoffmann E, Tavernier R, Block M, Podczeck A,Fromer M. Heart rate dynamics at the onset of ventriculartachyarrhythmias as retrieved from implantable cardioverter-defibrillatorsin patients with coronary artery disease.Circulation. 2000;101:2398–2404.
4. Leclercq JF, Maison-Blanche P, Cauchemez B, Coumel P. Respectiverole of sympathetic tone and of cardiac pauses in the genesis of 62 cases
Shusterman et al Multidimensional Rhythm Disturbances 711
by guest on July 10, 2018http://circres.ahajournals.org/
Dow
nloaded from

of ventricular fibrillation recorded during Holter monitoring.Eur Heart J.1988;9:1276–1283.
5. Huikuri HV, Valkama JO, Airaksinen KEJ, Seppänen T, Kessler KM,Takkunen JT, Myerburgh RJ. Frequency domain measures of heart ratevariability before the onset of nonsustained and sustained ventriculartachycardia in patients with coronary artery disease.Circulation. 1993;87:1220–1228.
6. Shusterman V, Aysin B, Beigel A, Brode S, Fahrig S, Gottipaty V,Schwartzman D, Weiss R, Anderson KP for the ESVEM Investigators.Do slow variations in heart rate predict spontaneous initiation of ventric-ular tachycardia?Pacing Clin Electrophysiol. 1998;21:948. Abstract.
7. Vybiral T, Glaeser DH, Goldberger AL, Rigney DR, Hess KR, Mietus J,Skinner JE, Francis M, Pratt CM. Conventional heart rate variabilityanalysis of ambulatory electrocardiographic recordings fails to predictimminent ventricular fibrillation.J Am Coll Cardiol. 1993;22:557–565.
8. Ivanov PC, Amaral LAN, Goldberger AL, Havlin S, Rosenblum MG,Struzik ZR, Stanley HE. Multifractality in human heartbeat dynamics.Nature. 1999;399:461–465.
9. Shusterman V, Aysin B, Weiss R, Brode S, Gottipaty V, Schwartzman D,Anderson KP. Dynamics of the low frequency RR-interval oscillationspreceding spontaneous ventricular tachycardia.Am Heart J. 2000;139:126–133.
10. Albrecht P, Cohen RJ. Estimation o heart rate power spectrum bands fromreal-world data: dealing with ectopic beats and noisy data.ComputCardiol. 1988;15:311–314.
11. Berger RD, Akselrod S, Gordon D, Cohen RJ. An efficient algorithm forspectral analysis of heart rate variability.IEEE Trans Biomed Eng. 1986;33:900–904.
12. Pincus SM, Keefe DL. Quantification of hormone pulsatility via anapproximate entropy algorithm.Am J Physiol. 1992;262:E741–E754.
13. Pincus SM, Goldberger AL. Physiological time-series analysis: what doesregularity quantify?Am J Physiol. 1994;266:H1643–H1656.
14. Mäkikallio TH, Ristimäe T, Airaksinen KEJ, Peng CK, Goldberger AL,Huikuri HV. Heart rate dynamics in patients with stable angina pectorisand utility of fractal and complexity measures.Am J Cardiol. 1998;81:27–31.
15. Huikuri HV, Mäkikallio TH, Peng CK, Goldberger AL, Hintze U, MøllerM. Fractal properties of R-R interval dynamics and mortality in patientswith depressed left ventricular function after an acute myocardialinfarction.Circulation. 2000;101:47–53.
16. Shusterman V, Aysin B, Gravé I, Chaparro LF, Anderson KP; Universityof Pittsburgh, Pittsburgh, Pa. System for prediction of life-threateningcardiac arrhythmias. US Patent 5,967,995 (http://www.uspto.gov/patft/index.html), 1999.
17. Tou JT, Gonzales RC.Pattern Recognition Principles. London, UK:Addison-Wesley; 1974.
18. Osaka M, Saitoh H, Sasabe N, Atarashi H, Katoh T, Hayakawa H, CohenRJ. Changes in autonomic activity preceding onset of nonsustained ven-tricular tachycardia.Ann Noninvasive Electrocardiol. 1996;1:3–11.
19. Skinner JE, Pratt CM, Vybiral T. A reduction in the correlation dimensionof heartbeat intervals precedes imminent ventricular fibrillation in humansubjects.Am Heart J. 1993;125:731–743.
20. Mani V, Wu X, Wood MA, Ellenbogen KA, Hsia PW. Variation ofspectral power immediately prior to spontaneous onset of ventriculartachycardia/ventricular fibrillation in implantable cardioverter defi-brillator patients.J Cardiovasc Electrophysiol. 1999;10:1586–1596.
21. Eftestøl T, Sunde K, Aase SO, Husøy JH, Steen PA. Predicting outcomeof defibrillation by spectral characterization and nonparametric classifi-cation of ventricular fibrillation in patients with out-of-hospital cardiacarrest.Circulation. 2000;102:1523–1529.
22. Lombardi F, Mortara A. Heart rate variability and cardiac failure.Heart.1998;80:213–214.
23. Pilgram B, Kaplan DT. Nonstationarity and 1/f noise characteristics inheart rate.Am J Physiol. 1999;276:R1–R9.
24. Shusterman V, Aysin B, Chaparro L, Gravé I, Brode S, Gottipaty V,Weiss R, Anderson KP, and the ESVEM Investigators. On-line predictionof ventricular tachyarrhythmias using short-term RR-interval pertur-bations: comparative analysis of different signal processing techniques.Pacing Clin Electrophysiol. 1999;22:837. Abstract.
25. Vikman S, Mäkikallio TH, Yli-Mäyry, Pikkujämsä S, Koivisto AM,Reinikainen P, Airaksinen KEJ, Huikuri HV. Altered complexity andcorrelation properties of R-R interval dynamics before spontaneous onsetof paroxysmal atrial fibrillation.Circulation. 1999;100:2079–2084.
26. Roach D, Malik P, Koshman ML, Sheldon R. Origins of heart ratevariability: inducibility and prevalence of a discrete, tachycardic event.Circulation. 1999;99:3279–3285.
27. Lux RL, Smith CR, Wyatt RF, Abildskov JA. Limited lead selection forestimation of body surface potential maps in electrocardiography.IEEETrans Biomed Eng. 1978;25:270–276.
28. Laguna P, Moody GB. Garcia J, Goldberger AL, Mark RG. Analysis ofthe ST-T complex of the electrocardiogram using the Karhunen-Loevetransform: adaptive monitoring and alternans detection.Med Biol EngComput. 1999;37:175–189.
29. Goldberger AL, Findley LJ, Blackburn MR, Mandell AJ. Nonlineardynamics in heart failure: implications of long-wavelength cardiopulmo-nary oscillations.Am Heart J. 1984;107:612–615.
30. Credner SC, Klingenheben T, Mauss O, Sticherling C, Hohnloser SH.Electrical storm in patients with transvenous implantable cardioverter-defibrillators.J Am Coll Cardiol. 1998;32:1909–1915.
31. Viskin S, Fish R, Roth A, Copperman Y. Prevention of torsade de pointesin the congenital long QT syndrome: use of a pause prevention pacingalgorithm.Heart. 1998;79:417–419.
32. Shusterman V, Aysin B, Weiss R, Gottipaty V, Anderson KP,Schwartzman DS. Changes in the pattern of cardiac cycle dynamicspredict initiation of paroxysmal atrial fibrillation.Pacing Clin Electro-physiol. 2000;23:668. Abstract.
712 Circulation Research April 13, 2001
by guest on July 10, 2018http://circres.ahajournals.org/
Dow
nloaded from

Vladimir Shusterman, Benhur Aysin, Kelley P. Anderson and Anna BeigelTachyarrhythmias
Multidimensional Rhythm Disturbances as a Precursor of Sustained Ventricular
Print ISSN: 0009-7330. Online ISSN: 1524-4571 Copyright © 2001 American Heart Association, Inc. All rights reserved.is published by the American Heart Association, 7272 Greenville Avenue, Dallas, TX 75231Circulation Research
doi: 10.1161/hh0701.0887702001;88:705-712; originally published online March 30, 2001;Circ Res.
http://circres.ahajournals.org/content/88/7/705World Wide Web at:
The online version of this article, along with updated information and services, is located on the
http://circres.ahajournals.org/content/suppl/2001/04/03/hh0701.088770.DC1Data Supplement (unedited) at:
http://circres.ahajournals.org//subscriptions/
is online at: Circulation Research Information about subscribing to Subscriptions:
http://www.lww.com/reprints Information about reprints can be found online at: Reprints:
document. Permissions and Rights Question and Answer about this process is available in the
located, click Request Permissions in the middle column of the Web page under Services. Further informationEditorial Office. Once the online version of the published article for which permission is being requested is
can be obtained via RightsLink, a service of the Copyright Clearance Center, not theCirculation Researchin Requests for permissions to reproduce figures, tables, or portions of articles originally publishedPermissions:
by guest on July 10, 2018http://circres.ahajournals.org/
Dow
nloaded from

MS #2183 / R1, Online Data Supplement
1
Online Data Supplement
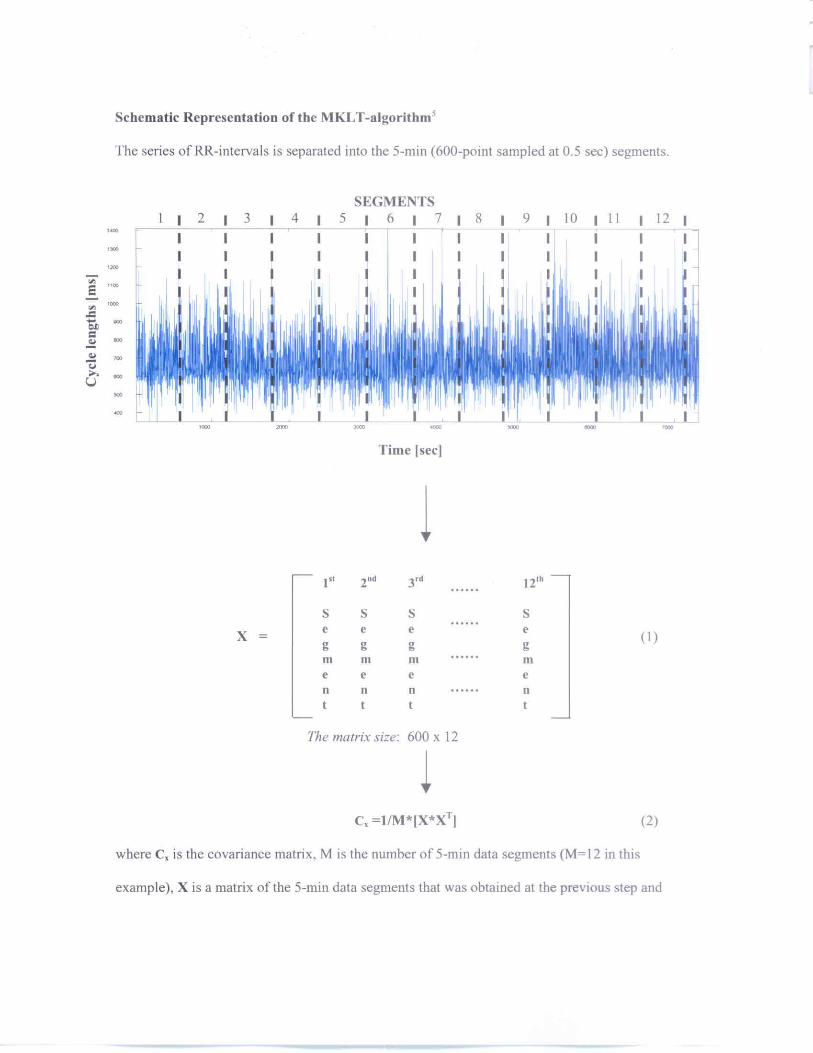
The series is initially sampled at unequally spaced time points that correspond to the
times of occurrence of the R-peaks. Then the series is re-sampled at the equally spaced, 500-ms
intervals. The reason for the re-sampling is to convert the series from the function of the interval
number into a function of time for the subsequent Fourier analysis and the spectral frequency
representation in Hertz. Although the spectral analysis could be performed using the original
time series, as a function of the interval number, this would provide only “relative” frequencies in
cycles / beat which cannot be converted into Hertz. The frequency representation in Hertz is
important because the spectral power integrated over the specific frequency ranges indicates
physiological activity of the sympathetic and parasympathetic nervous system.1 In particular, the
power in the 0.15 – 0.4 Hz range represents parasympathetic activity, whereas the power in the
0.04 – 0.15 Hz range represents both sympathetic and parasympathetic effects.2,3
We used a linear interpolation, because it does not affect the low frequency components,
which contain most of the energy of the series and may only cause a small reduction of the high-
frequency elements.4 As Figure 1 shows, the interpolated series has slightly reduced amplitudes
of the high-frequency spikes, but the envelope (i.e. the low frequency components) is unchanged.
Figure 2 is a magnified plot of the cardiac cycle length series shown in Figure 1 of the
manuscript. Each panel in Figure 2 from the Online Data Supplement is an hour-long segment of
the interbeat intervals. The corresponding ECG waveforms are shown in Figures 3-10.5


MS #2183 / R1, Online Data Supplement
4
Thus, the first six MKLT-coefficients are obtained for each 5-min segment and then the time
series is constructed for each MKLT-coefficient by concatenating the corresponding coefficients
for all consecutive data segments.
Formally, MKLT can be described as follows.
Step I. Initially, we assumed that the core pattern of cardiac cycles has M unit-length
vectors xi, i M= 1 2, ,..., , and the length of each vector is equal to N points, to generate a
covariance matrix Cx from the outer products of vectors xi:
Ti
M
iiMxxCx ∑
=
≅1
1 , (4)
where i=1,2,…M.
Step II. From the covariance matrix, one can obtain eigenvectors ψk, i=1,2,…N and
corresponding eigenvalues λk , i=1,2,…N. The eigenvalues are arranged in decreasing order so
that λ λ λ1 2≥ ≥ ≥.... N . Then, the MKLT coefficients ci are obtained by multiplying a matrix
of the eigenvectors ψi by vector xi.
Signal partition. To achieve an efficient compression of the 24-hour series of cardiac
cycles, the series of the first MKLT coefficient, which contains most of the information about the
signal, was used for segmentation.
The partition of the signal was initially done using constant-length windows, 1iw , which
were obtained by dividing the series into equally spaced segments. These segments are referred to
as the first level (L=1) windows. At the next step, the sum of entropies (λ) in the first two
adjacent windows, λ( 11w )+λ( 1
2w ) was compared with the entropy, λ( 21w ) in the second level
(L=1+1) window, 21w , which was obtained by combining windows 1
1w and 12w , i.e.
λ( 21w )=λ( 1
1w + 21w ). If the latter entropy was smaller than the sum λ( 1
1w )+λ( 12w ), then the two

MS #2183 / R1, Online Data Supplement
5
windows, 11w and 2
1w , were combined to form a wider window, 21w . After that, the sum of
entropies in the combined window λ( 21w ) and the next window, λ( 1
3w ), was compared with the
entropy in the combined window λ( 21w + 1
3w ) and, again, the windows were combined if the latter
entropy was smaller than the sum λ( 21w ) +λ( 1
3w ) and so on.
The entropy of the series of MKLT coefficients, Ljc , can be computed as
2
,2
0 2
,log)(
Li
Lkiil
k Li
LkiL
ic
c
c
ccH ∑
=−= , (5)
where 2
0,
2∑=
=il
k
Lki
Li cc , li is the number of MKLT coefficients in a given window, L is
the level of partition, and i denotes different windows at that level.6,7 A straightforward
computation shows that minimization of entropy, H, can be achieved by minimizing the
following functional
2
,1
2, log)( L
kiil
k
Lki
Li ccc ∑
=−=λ , (6)
When the signal is stationary, entropy is relatively independent from the window length
and the sum of entropies in shorter windows is bigger than the entropy in the combined, wider
window. So, the windows are combined during stationary segments. However, when the signal is
nonstationary, the variance and, therefore, the entropy in the wider window become bigger than
the sum of entropies in the smaller windows. In this case, the windows are not combined which
results in the shorter window lengths. This process leads to an optimal partition of the signal into
windows whose lengths depend on the signal properties such that longer windows correspond to
the stationary segments whereas shorter windows correspond to nonstationary segments.

MS #2183 / R1, Online Data Supplement
6
The following two examples illustrate the segmentation procedure. The first example
shows a simulated periodic signal that was obtained using the equation
)*3.0sin()*6.0sin()( ππ +=tx (7)
for the first 70 points. To simulate nonstationarity of the signal, the last 30 points were obtained
by multiplying the right hand side of the equation (4) by 3 (Figure 11, Panel A). First, we
calculated the functional, λ, in the adjacent first-level windows, 11w and 1
2w according to equation
(6). In both examples, the length of the windows at the first level was 22 points.
λ( 11w )=-.0602e3, λ( 1
2w )=-.0685e3.
Then, λ in the combined ( 11w + 1
2w ) window was compared with λ( 11w + 1
2w ). The sensitivity of
this technique to the changes in signal properties can be modified by multiplying λ( 11w + 1
2w ) by a
constant k . Using our preliminary results, we found that k=.985 gave the best segmentation
sensitivity for the series of cardiac cycles. Since kλ( 11w + 1
2w )=-.1400e3 is less than
λ( 11w )+λ( 1
2w )=-.0602e3-.0685e3=-.1287e3, the two windows were combined into a second-level
window 21w = ( 1
1w + 12w ). Next, the sum λ( 2
1w ) +λ( 13w ) was compared with kλ( 2
1w + 13w ). Since
kλ( 21w + 1
3w )= -.2553e3 is less than λ( 21w ) +λ( 1
3w )=-.1421e3-.0702e3=-.2102e3, the two windows
are combined into a third-level window 31w =( 2
1w + 13w ). At the next step, the sum λ( 3
1w ) +λ( 14w )
was compared with kλ( 31w + 1
4w ). This time, kλ( 31w + 1
4w )=-.9718e3 is bigger than
λ( 31w )+λ( 1
4w )=-.2592e3-.9322e3 =-1.1914e3. Therefore, the two windows remain separated. Note
an almost four-fold increase in kλ( 31w + 1
4w ) compared to the previous combinations of windows
which reflects a change in the structure of the series. The rest of the computations for this series is
shown in Table 1. The second example (Figure 11, Panel B) shows the series of the first MKLT

MS #2183 / R1, Online Data Supplement
7
coefficient obtained from a 500-min series of cardiac cycles. The computation of adaptive
windows for this series is shown in Table 2.
Although we used Shannon’s entropy to partition the series, other criteria including
Kullback information and Kalman filter could be applied.8,9 These computationally demanding
techniques are capable of separating the segments with distinct spectral characteristics.
Combining the entropies of several MKLT coefficients also could provide a better segmentation.
However, the fundamental properties of MKLT are not affected by the specifics of the
segmentation procedure and variations in the partion of the series would not affect the main
results.

MS #2183 / R1, Online Data Supplement
8
Table 1. Computation of adaptive windows for the series in Figure 11, Panel A (*e3).
1st window 2nd window Combined window Decision
1w λ1 2w λ2 λ1 + λ2 1w + 2w kλ(1+2)
11w -.0602 1
2w -.0685 -.1287 11w + 1
2w -.1400 Combine
21w -.1421 1
3w -.0702 -.2123 21w + 1
3w -.2553 Combine
31w -.2592 1
4w -.9322 -1.1914 31w + 1
4w -.9718 Separate
14w -.9322 1
5w -.4043 -1.3365 14w + 1
5w -1.3521 Combine
Table 2. Computation of adaptive windows for the series in Figure 11, Panel B (*e9).
1st window 2nd window Combined window Decision
1w λ1 2w λ2 λ1 + λ2 1w + 2w kλ(1+2)
11w -.5668 1
2w -1.2479 -1.8147 11w + 1
2w -1.8418 Combine
21w -1.8698 1
3w -2.1245 -3.9943 21w + 1
3w -4.0500 Combine
31w -4.1117 1
4w -1.5913 -5.7030 31w + 1
4w -5.6941 Separate
41w -1.5913 1
5w -1.8308 -3.4221 41w + 1
5w -3.4414 Combine

MS #2183 / R1, Online Data Supplement
9
Figure legends
Figure 1. Comparison of the original and interpolated series of interbeat intervals. The top panel
shows the 16-hour series of the interbeat intervals in blue and the interpolated series in red. The
arrows indicate the times of the two, short segments that are shown in the lower panels at higher
magnification. The interpolation slightly reduces the amplitudes of the high-frequency spikes but
preserves the envelope (i.e. the low frequency components) that contain most of the energy of the
signal.
Figure 2. Magnified plot of the cardiac cycle length series shown in Figure 1 of the manuscript.
Each panel is an hour-long segment of the interbeat intervals.
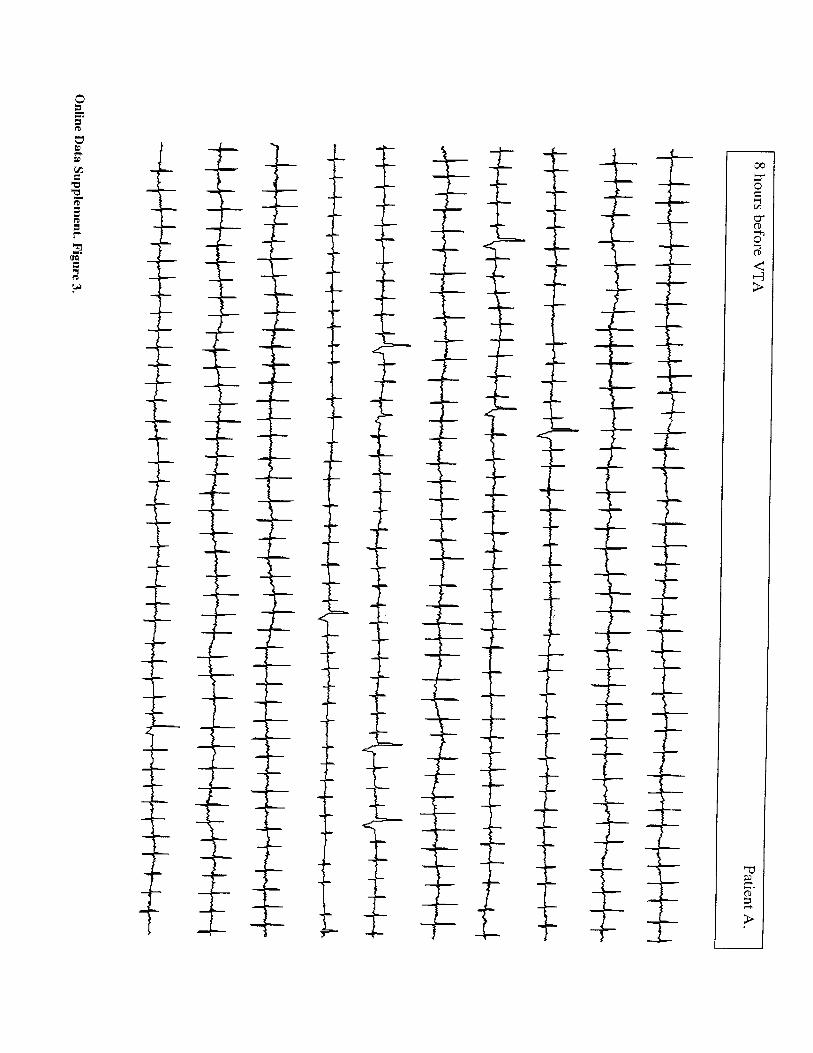
Figures 3-10. The 5-min ECGs obtained from the same patient whose cardiac cycle length series
is shown in Figure 2. The ECGs in each two consecutive figures are separated by 55 min-
intervals. Thus, the eight figures cover an eight-hour period before the onset of sustained
ventricular tachyarrhythmia.
Figure 11. Segmentation of a simulated signal (Panel A) and a time series of the first MKLT-
coefficient from the 500-min sequence of cardiac cycles.

MS #2183 / R1, Online Data Supplement
10
REFERENCES
1. Task Force of the European Society of Cardiology and the North American Society of Pacing
and Electrophysiology. Heart rate variability. Standards of measurement, physiological
interpretation, and clinical use. Circulation. 1996;93:1043-1065.
2. Akselrod S, Gordon D, Ubel FA, Shannon DC, Barger AC, Cohen RJ. Power spectrum
analysis of heat rate fluctuation: A quantitative probe of beat-to-beat cardiovascular control.
Science. 1981;213: 220-222.
3. Huikuri HV, Valkama JO, Airaksinen J, Seppänen T, Kessler KM, Takkunen JT, Myerburg RJ:
Frequency domain measures of heart rate variability before the onset of nonsustained and
sustained ventricular tachycardia in patients with coronary artery disease. Circulation.
1993;87:1220-1228.
4. Albrecht P, Cohen RJ. Estimation of heart rate power spectrum bands from real-world data:
dealing with ectopic beats and noisy data. Comput Cardiol. 1988;15:311-314.
5. The algorithms, custom software and the database of the 24-hour series of RR-intervals has
been made available at www.pitt.edu/~shuste. The plots of RR-intervals and the ECG
waveforms that were recorded from several patients prior to the onset of ventricular
tachyarrhythmias are also available at the same web-site.
6. Wesfried E, Wickerhauser MV. Adaptive Local Trigonometric Transforms and Speech
processing, IEEE Trans. on Sig. Proc. 1993;41,3596-3600.
7. Coifman RR, Wickerhauser V. Entropy-based algorithms for best basis selection, IEEE
Transactions on Information Theory. 1992;38:713-718.
8. Ishii N, Iwata A, Suzumura N. Segmentation of non-stationary time series. Int J System Sci.
1979;10:883-894.

MS #2183 / R1, Online Data Supplement
11
9. Ishii N, Iwata A, Suzumura N. Detection of abrupt change and trend in the time series. Int J
System Sci. 1980;11:557-566.