Embed Size (px)
Citation preview

O R I G I N A L A R T I C L E
Multicenter Study of thePrevalence of DiabetesMellitus and Impaired GlucoseTolerance in the Urban BrazilianPopulation Aged 30-69 YrDOMINGOS A . MALERBI, MD, PHDLAERCIO J. FRANCO, MD, PHD
THE BRAZILIAN COOPERATIVE GROUP ON THE STUDY OF DIABETES PREVALENCE
OBJECTIVE — To assess the prevalence of diabetes and IGT in the urban adultBrazilian population.
RESEARCH DESION AND METHODS— We used a two-stage, multicenter,cross-sectional survey in a random sample of 21,847 individuals aged 30-69 yr fromnine large cities. Subjects were first screened by FCG. All positive screenees(FCG > 5.6 mM/L) and every sixth consecutive negative screenee were administereda 75 g OGTT and classified as diabetic, IGT, or normal (nondiabetic) according toWHO recommendations. OGTT findings from the negative screenees were extrapo-lated to all negative screenees after adjustments for potential biases.
RESULTS — The overall rates were 7.6 and 7.8% for diabetes and IGT, respectively.Men (7.5%) and women (7.6%) had similar rates of diabetes. Similar rates resultedwith whites (7.8%) and nonwhites (7.3%). Diabetes prevalence increased from 2.7%in the 30-39-yr age-group to 17.4% in the 60-69-yr age-group. Diabetes was moreprevalent among less educated people, but this difference disappeared after adjustingfor age. Family history of diabetes was associated with a twofold increase in diabetesprevalence (12.5 vs. 5.8%); the same increase occurred with obesity (11.6 vs. 5.2%).Undiagnosed diabetes accounted for 46% of the total prevalence. Among previouslydiagnosed cases, 22.3% were not under treatment, 7.9% were on insulin, 40.7% wereon oral agents, and 29.1% were on dietary treatment only. Self-reported diabetesprevalence was 0.1, 3.2, and 11.6% in the age groups <30, 30-69, and >70 yr,respectively.
CONCLUSIONS — The prevalence of diabetes in Brazil is comparable with that ofmore developed countries, where it is considered a major health problem.
FROM THE LABORATORY OF HUMAN NUTRITION AND METABOLIC DISEASES (LIM-25), DIVISION OF ENDOCRINOLOGY,
UNIVERSITY OF SAO PAULO MEDICAL SCHOOL AND THE DEPARTMENT OF PREVENTIVE MEDICINE, ESCOLA PAULISTA
DE MEDICINA, SAO PAULO, BRAZIL.
ADDRESS CORRESPONDENCE AND REPRINT REQUESTS TO DOMINGOS A. MALERBI, MD, PHD, SERVICO DE ENDOCRINO-
LOGIA, HOSPITAL DAS CLINICAS-FMUSP, CAKA POSTAL 8091, CEP 01000, SAO PAULO-SP, BRAZIL.
RECEIVED FOR PUBLICATION 19 FEBRUARY 1992 AND ACCEPTED IN REVISED FORM 2 JULY 1992.
I G T , IMPAIRED GLUCOSE TOLERANCE; F C G , FASTING CAPILLARY GLUCOSE; O G T T , ORAL GLUCOSE TOLERANCE
TEST; WHO, WORLD HEALTH ORGANIZATION; BMI, BODY MASS INDEX; TYPE II DIABETES, NON-INSULIN-DEPENDENT
DIABETES MELLITUS; TYPE I DIABETES, INSULIN-DEPENDENT DIABETES MELLITUS.
Brazil is a tropical country with anarea of 8.5 million km2 (almost halfof South America) and a popula-
tion estimated in 1987 at —140 million.The country has undergone profoundand very rapid economic and politicalchanges in the last decades, which in-duced equally profound demographicand epidemiological changes. Internalmigration was massive, the proportion ofthe population living in urban areas hav-ing increased from 33 to 66% between1960 and 1980. Infant mortality ratesdropped by >40% between 1965 and1985, and death rates due to infectiousand parasitic diseases declined by —70%between 1960 and 1980.
Although these old health prob-lems have receded, new ones have arisen.The proportion of mortality attributableto noncommunicable diseases rose from33% in 1960 to >50% in 1986. Cur-rently, noncommunicable diseases ac-count for >33% of hospital admissionsnot associated with pregnancy and are anincreasingly dominant cause of demandfor health services (1). Because these dis-eases generally are more costly to treat,this shift will create a substantial increasein the cost of medical care.
Diabetes mellitus, as an underly-ing cause of death, is among the 10 ma-jor causes of mortality in Brazil. In SaoPaulo, the largest city in the country,diabetes as an underlying or associatedcause of death for individuals aged15-74 yr accounted for 10.8% of thetotal deaths during the period 1974-1975 (2). Data about the prevalence ofdiabetes in Brazilians are scarce and verylimited. Published rates range from 2.7to 2.9% of the population, but thesewere derived either from nonrepresenta-tive samples (3,4) or from self-reports(5). However, in recent years, there hasbeen a growing concern that diabetes isbecoming more common, particularly inthe more urbanized and industrializedsegments of the population (6).
Given the changing age structureand health patterns of the population,
DiABLits CARE, VOLUME 15, NUMBER 11 , NOVEMBER 1992 1509
Dow
nloaded from http://diabetesjournals.org/care/article-pdf/15/11/1509/441135/15-11-1509.pdf by guest on 27 February 2022

Diabetes in Brazil
. Balam 1.171.000
%/ ^ BRAZIL < K X - -V <_141,302,000
\ j \ , Brasilia. DF^ N J \ 1.663,000y
TROPIC OF I / X, Jj, >^~^«
-\. Fortalaza 1,660,000
yj.Passoa 416,000rR#cl(» 1,348,000Salvador 1,893,000io da Janalro 6,866,000
CAPRICORN JSao Paulo 10,654,000Porto Alagra 1.333.000
Figure 1—Geographical distribution of the
participating centers and their estimated popu-
lation for 1987.
what public health priority should begiven now and in the coming years todiabetes? To address this question, andto fill the lack of information about pop-ulation-based data on the prevalence andassociated variables of diabetes, the Bra-zilian Multicenter Study on the Preva-lence of Diabetes was conducted. Thestudy was performed in a representativesample of the population of nine Brazil-ian cities during 1986 to 1988. It is thefirst population-based survey in Brazilthat used WHO criteria for the diagnosisof diabetes, thus allowing internationalcomparisons.
RESEARCH DESIGN ANDMETHODS — This study was a cross-sectional home survey conducted fromNovember 1986 to July 1988 in a ran-dom sample of 21,847 individuals aged30-69 yr in nine Brazilian cities. Figure1 depicts the geographical distribution ofthe nine cities. Based on self-classifica-tion of skin color, the racial distributionof the Brazilian population in the 1980census (7) was 54.2% whites, 44.8%blacks, 0.6% Asians, and 0.2% SouthAmerican Indians.
Census tracts in each city wereselected based on their representative-ness toward the entire city populationwith regard to sex, age, and socioeco-nomic status. The 1980 Brazilian census(7) provided the basic demographic data
to characterize the population and to as-sess representativeness of the eligiblesamples. Within each census tract,households were randomly selected.
Residents in the households wereinformed about the survey through a let-ter from the local coordinators and werevisited by an interviewer a few daysthereafter. All household residents aged30-69 yr, excluding those pregnant,were invited to participate in the surveyand were scheduled for the screeningprocedures. To minimize the possibilityof a recruitment bias for family clusteringof diabetes or its risk factors, the samplesize was increased by selecting ~1500households in each city. Within the sam-pling conditions of this study, the num-ber of eligible subjects living in thesehouseholds was twice that necessary fora standard error of 1% (8).
During the first visit, informationalso was obtained about the presence ofdiabetes among people in the household.Subjects were asked to fast overnight be-fore the screening procedures. A fewdays later, the household was visited bythe study team. A questionnaire was ad-ministered to characterize subjects withregard to sex, color, age, place of birth,educational level, occupation, healthconditions, and personal or family his-tory of diabetes. The fasting conditionwas verified by interview, and FCG wasmeasured by glucose-oxidase strips readin a reflectance meter (Dextrostix/Glu-cometer system, Miles Laboratories, Inc.,Elkhart, IN).
Subjects with previously diag-nosed diabetes using insulin, or with ahistory of glycemia >11.1 mM, or withFCG > 11.1 mM at screening and sub-jects without a history of diabetes whohad FCG > 11.1 mM at screening wereconsidered to have diabetes. Nondiabeticsubjects with an FCG of 5.6-11.0 mM,those with a history of diabetes not con-firmed by the above criteria, and everysixth consecutive negative screenee (FCG<5.6 mM) were scheduled for an OGTT.A 75-g cola-flavored glucose solution(Dexpak, Miles Laboratories) was admin-
istered after an overnight fast, and capil-lary glucose was measured 2 h later, ac-cording to WHO recommendations.OGTTs were classified as diabetic (2-hglucose > 11.1 mM), IGT (2-h glucose7.8-11.0 mM), or nondiabetic (2-h glu-cose <7.8 mM). Subjects with diabetesand those who participated in the OGTTwere weighed, measured, and adminis-tered a questionnaire concerning theireducation, occupation, family income,place of former residence, health condi-tions (present and past), obstetrical pro-file, current medication, alcohol and cig-arette consumption, physical activity,and dietary habits.
The health professional teamsworking in each of the nine cities weretrained by a central coordinating com-mittee and were continuously supervisedby a local coordinating physician duringthe field work. Quality control proce-dures regarding capillary blood glucosemeasurements were performed duringthe study. They consisted of a randomcomparison between strip results and si-multaneous glucose-oxidase readingstaken at standard laboratories; regressionanalysis yielded a correlation coefficientof 0.99 (n = 92; range 3.5-17.0 mM). Inaddition, the examiner's performancewith reflectance meters was tested withstandard glucose solutions, ranging fromlow (4.4-6.7 mM) to high (10.0-15.0mM) glucose concentrations on a regularweekly basis throughout the field workin the nine cities. Each phlebotomist wasrequired to have at least 24 consecutivereadings, with the aforementioned stan-dard solutions, falling within the 95%confidence limit of a skilled operator'sset of readings.
The total sample of 21,847 indi-viduals was divided into groups accord-ing to sex, age, skin color, level of edu-cation, presence of family history ofdiabetes, and presence of obesity to as-sess their influence on diabetes preva-lence. Skin color was judged by the in-terviewer, and subjects were divided intowhite and nonwhite groups. Educationallevel was divided into less than junior
1510 DIABETES CASE, VOLUME 15, NUMBER 11, NOVEMBER 1992
Dow
nloaded from http://diabetesjournals.org/care/article-pdf/15/11/1509/441135/15-11-1509.pdf by guest on 27 February 2022
Malerbi and Associates
Table 1—Participation rates and percentage distribution of eligible, screened, and OGTT samples
SCREENED SAMPLE
ELIGIBLE TOTAL POSITIVE NEGATIVE
OGTT SAMPLE
POSITIVE
SCREENEES
NEGATIVE
SCREENEES*
PARTICIPANTS
% (vs. SELECTED)
AGE (YR)
30-3940-4950-596 0 - 6 9
SEX
MALE
FEMALE
SKIN COLOR
WHITE
NONWHITE
EDUCATION
BELOW JUNIOR HIGH SCHOOL
JUNIOR HIGH SCHOOL OR HIGHER
DIABETES IN FAMILY
YES
No
76
38.726.620.614.0
42.857.2
21,84788.5
38.926.420.514.2
41.0t59.0T
2,294
22.123.930.024.0
35.364.7
67.432.6
57.442.6
38.961.1
19,553
40.826.719.513.0
41.758.3
63.636.4
48.151.9
25.174.9
2,20196.0
21.823.730.324.2
35.164.9
67.532.5
58.141.9
39.260.8
2,71293.6
38.526.920.813.8
27.5*72.5*
61.6§38.4§
56.5*43.5*
28.0*72.0*
Previously diagnosed diabetic patients (832 confirmed and 190 unconfirmed at screening) and subjects without a history of diabetes with FCG >11.1 mM atscreening (n = 94) are included as screen-positives in both samples. —, unavailable data.*A 1 in 6.7 sample (n = 2,898) of negative screenees was selected for the OGTT.tP < 0.01 (screened vs. eligibles).*P < 0.01. §P = 0.04 (OGTT vs. screened [negative screenees]).
high school and junior high school orhigher. Obesity was defined as a BMI(weight/height2) of >25 for women and>27 for men, according to the NationalDiabetes Data Group criteria (9). Thesample of participants screened for FCGwas compared with the eligible individ-uals living in the selected households forrepresentativeness by age and sex.Screen-positive and -negative groups inthe OGTT sample were compared withthose in the screened sample for repre-sentativeness by age, sex, color, schoollevel, and presence of family history ofdiabetes. In extrapolating prevalencerates from the OGTT sample to thescreened sample, the cross-stratificationtechnique (10) was used to correct forpotential biases generated by underrep-resentation of specific strata because ofnonparticipation in the OGTT phase (as
defined in the analyses of representative-ness). Age adjustment of prevalence rateswas performed by the direct method, thestandard being the 1980 Brazilian popu-lation (7). x2 Tests were used for analy-sis of representativeness between sam-ples and for comparisons of prevalencerates. Cochran partition tests (11) wereused for defining contrasts among mul-tiple comparisons when the x2 was sig-nificant. The level of significance was setat 0.05. Data storage and retrieval wereperformed with DBASE III PLUS soft-ware (Ashton-Tate). Data analysis wasconducted through SPSS-X statisticalsoftware (Chicago, IL).
RESULTS— Analyses of representa-tiveness and the participation rates ateach stage of the survey are shown inTable 1. Among 16,104 households sam-
pled in the nine cities, 3,090 (19.2%)had no eligible residents and 1,360(8.5%) were lost to the survey because ofrefusal to participate (384 or 2.4%) orbecause the house was vacant at the timeof the interview (976 or 6.1%). Of24,676 eligible individuals, 21,847(88.5%) participated in the screeningphase and were the basis for estimates ofdiabetes and IGT prevalence. The meannumber of individuals participating ineach city was 2,427 (range 1,856-3,002). Nonwhites comprised 36% ofparticipants, with 33.2% being blacks,0.5% Asians, and 2.3% unclassified.There was no statistical difference in agedistribution between the participants inthe screening phase and the eligible in-dividuals. However, the proportion ofmen participating in the screening phase(41.0%) was slightly lower than that
DIABETES CARE, VOLUME 15, NUMBER 11, NOVEMBER 1992 1511
Dow
nloaded from http://diabetesjournals.org/care/article-pdf/15/11/1509/441135/15-11-1509.pdf by guest on 27 February 2022

Diabetes in Brazil
found among the eligible individuals(42.8%) (P < 0.01). Among thescreened sample, 832 persons had previ-ously diagnosed diabetes and either wereusing insulin, had a history of glycemia£11.1 mM, or had FCG > 11.1 mM atscreening and thus were considered tohave diabetes. An additional 94 personswithout a history of diabetes had FCG> 11.1 mM at screening and were con-sidered to have undiagnosed diabetes.The diabetic individuals were includedin the OGTT sample as screen-positives,but they were not administered the glu-cose tolerance test. In addition 190 indi-viduals formerly known to have diabetesdid not meet this criterion for diagnosisin the screening phase; 81 were withouttreatment, 68 were on dietary treatmentonly, and 41 were taking oral hypogly-cemic drugs. These individuals wereconsidered screen-positives and wereadministered the OGTT (those takingoral drugs were asked to stop medicationfor 2 - 3 days before the test); 54 haddiabetes and were included in the previ-ously diagnosed group, 51 had IGT, and85 had normal glucose tolerance (previ-ous abnormality of glucose tolerance[9]).
The OGTT sample comprised2,201 screen-positive individuals (96.0%of the 2,294 selected were individuals withFCG 5.6-11.0 mM; those diagnosed asdiabetic patients in the screening phase;and those previously diagnosed as diabeticpatients, but not confirmed in the screen-ing phase) and 2,712 screen-negative indi-viduals (93.6% of the 2,898 selected wereindividuals with FCG <5.6 mM)—the netproportion of selection among the lattergroup having been 1 in 6.7. Among thescreen-positives, 1,189 persons were con-sidered to have diabetes and 297 personswere classified as having IGT, according toWHO criteria. Among the screen-nega-tives, 53 and 206 individuals were classi-fied with diabetes and IGT, respectively.Extrapolation of these figures to thescreened sample yielded 1,655 peoplewith diabetes (1,242 among the screen-positives and 413 among the screen-
negatives) and 1,704 with IGT (310among the screen-positives and 1,394among the screen-negatives). The positivescreenees in the OGTT sample did notdiffer by age distribution, sex, color, edu-cational level, or family history of diabetesfrom the positive screenees of the screenedsample. The negative screenees participat-ing in the OGTT phase had the same agedistribution as the negative screenees ofthe screened sample, but there were statis-tically significant (P < 0.05) underrepre-sentation of men (27.5 vs. 41.7% in thescreened sample) and whites (61.6 vs.63.6% in the screened sample), and over-representation of less-educated individuals(56.5 vs. 48.1% in the screened sample)and of individuals with a family history ofdiabetes (28.0 vs. 25.1% in the screenedsample). These differences and the lowerproportion of men in the screened samplecompared with the eligible individualswere considered when prevalence datawere extrapolated from the OGTT sampleto the screened sample, as described inMETHODS.
The overall age-adjusted rates fordiabetes and IGT were 7.4 and 7.7%,respectively (Table 2), with some re-gional differences. Both diabetes and IGTwere more prevalent in the south andsoutheast (more industrialized) regionsof the country. The highest rate of dia-betes was found in Sao Paulo (9.7%,P < 0.01) and that of IGT in Porto Ale-gre (12.2%, P < 0.01). The lowest rateswere seen in Brasilia (midwest region);5.2 and 4.5% for diabetes and IGT, re-spectively (P < 0.01).
Age strongly influenced diabetesprevalence, with the rate in the 60-69-yr-old group (17.4%) being 6.4 timeshigher than that seen among people aged30-39 yr (2.7%) (P < 0.01). An agetrend also occurred for IGT prevalence,although not as marked as for diabetes:the rates increased from 5.9% in the 3 0 -39-yr-old group to 11.2% in the 6 0 -69-yr-old group (P < 0.01).
No difference was found for age-standardized diabetes prevalence be-tween men (7.4%) and women (7.4%);
however, women had a higher rate ofIGT than men (8.4 vs. 6.7%, P < 0.01).Rates for diabetes did not differ in whites(7.5%) and nonwhites (7.1%); the samewas observed for IGT (7.8 and 7.6% inwhites and nonwhites, respectively).People with a lower Qess than juniorhigh school) level of education hadhigher crude rates of both diabetes(8.5%) and IGT (8.3%) than those withhigher educational levels (6.7% for dia-betes and 7.3% for IGT), but these dif-ferences were absent after adjusting forage: 7.1 vs. 7.8% for diabetes and 7.8 vs.7.8% for IGT among the less and thebetter educated, respectively. The pres-ence of a family history of diabetes andobesity was associated, respectively, witha 2.2- and 1.9-fold increase in age-adjusted diabetes prevalence and a 1.4-and 1.8-fold increase in age-adjustedIGT prevalence (P < 0.01).
Newly diagnosed diabetes (3.4%)accounted for 46% of the total age-adjusted diabetes prevalence. The per-centage distribution of new cases rangedfrom 31% in Rio de Janeiro to 65% inFortaleza. The prevalence of newly diag-nosed diabetes was slightly higher thanthat of previously known diabetes in the30-39-yr-old group (1.5 and 1.2%, re-spectively). As age increased, there was ashift in the distribution between new anddiagnosed cases, with the rate for previ-ously diagnosed diabetes being higher(9.9%) than that for new cases (7.5%) inthe 60 -69 -y r -o ld group. Amongwomen, there was a higher proportion ofpreviously diagnosed diabetes: 4.5%compared with 2.9% for new cases (age-adjusted); the inverse was observedamong men, whose age-standardizedrates were 3.1 and 4.3% for previouslyknown and unknown diabetes, respec-tively. The age-adjusted prevalence ofnewly diagnosed diabetes was the samein whites (3.5 or 47% of total) and non-whites (3.3 or 46% of total). However,the percentage of diagnosed diabetes wasslightly higher among people with lowerlevels of education (4.0 or 56% of total)than in those with higher educational
1512 DlABFTES CARF, VOLUME 1 5 , Nl'MBFR 1 1 , NOVFMBFR 199? ,
Dow
nloaded from http://diabetesjournals.org/care/article-pdf/15/11/1509/441135/15-11-1509.pdf by guest on 27 February 2022

Malerbi and Associates
Table 2—Prevalence of diabetes mellitus and IGT in the urban Brazilian population aged 30-69 yr
OVERALL
REGION
NORTH
BELEM
NORTHEAST
FORTALEZA
JOAO PESSOA
RECIFE
SALVADOR
MIDWEST
BRASILIA
SOUTHEAST
RIO DE JANEIRO
SAO PAULO
SOUTH
PORTO ALEGRE
AGE (YR)
30-3940-4950-5960-69
SEX
MALE
FEMALE
SKIN COLOR
WHITE
NONWHITE
EDUCATION
BELOW JUNIOR HIGH SCHOOL
JUNIOR HIGH SCHOOL OR HIGHER
DIABETES IN FAMILY
YES
NoOBESITY?
YES
No
CRUDE
DIABETES MELLITUS (%)
PREVIOUS DIABETES NEW DIABETES TOTAL
4.1
3.5
2.2
4.43.85.3
3.1
5.74.7
4.6
1.22.87.19.9
3.14.7
4.23.8
4.73.4
7.32.9
6.02.9
3.5
3.8
4.2
4.02.92.9
2.0
2.25.0
4.2
1.52.75.67.5
4.42.9
3.63.4
3.83.3
5.22.9
5.52.4
7.6
7.3
6.4
8.46.78.2
5.1
7.99.7
8.8
2.7td
5.5tc
12.7tb
17.4ta
7.57.6
7.87.2
8.56.7
12.55.8
11.55.3
AGE-ADJUSTED*
PREVIOUS DIABETES
4.0
3.3
2.3
3.83.54.8
3.3
5.24.7
4.8
3.14.5
4.03.8
4.03.8
7.32.8
5.33.0
NEW DIABETES
3.4
3.9
4.2
4.12.93.1
1.9
2.35.0
4.1
4.32.9
3.53.3
3.14.0
5.22.8
5.02.5
TOTAL
7.4
7.2tc
6.5td
7.9tc
6.4td
7.9tc
5.2te
7.5tc
9.7ta
8.9tb
7.47.4
7.57.1
7.17.8
12.5ta
5.6Tb
10.3ta
5.5tb
CRUDE
7.8
9.5
5.8
7.25.44.8
4.5
9.211.2
12.2
5.9td
7.2tc
9.8tb
11.2ta
6.78.5
7.97.6
8.37.3
9.97.0
11.15.8
IGT (%)
AGE-ADJUSTED*
7.7
9.5tb
5.8td
7.2tc
5.4td
4.8td
4.5td
9.2tb
11.2ta
12.2ta
————
6.7tb
8.4ta
7.87.6
7.87.8
10.0ta
6.9Tb
10.8ta
5.9tb
*Standard = Brazilian population according to the 1980 census.tP < 0.01 (a>b> c> d> e).fMales, BMI £ 27 kg/m2; females, BMI 2: 25 kg/m2.
levels (3.8 or 49% of total). The presenceof diabetes in the family was associatedwith a higher prevalence of previouslydiagnosed diabetes: the age-adjustedrates were 7.3% (58% of total preva-lence) in the group with and 2.8% (50%
of total) in those without a family historyof diabetes. Among the obese, newly di-agnosed cases accounted for 48% of thetotal age-standardized diabetes preva-lence, whereas in the nonobese this per-centage was 45%.
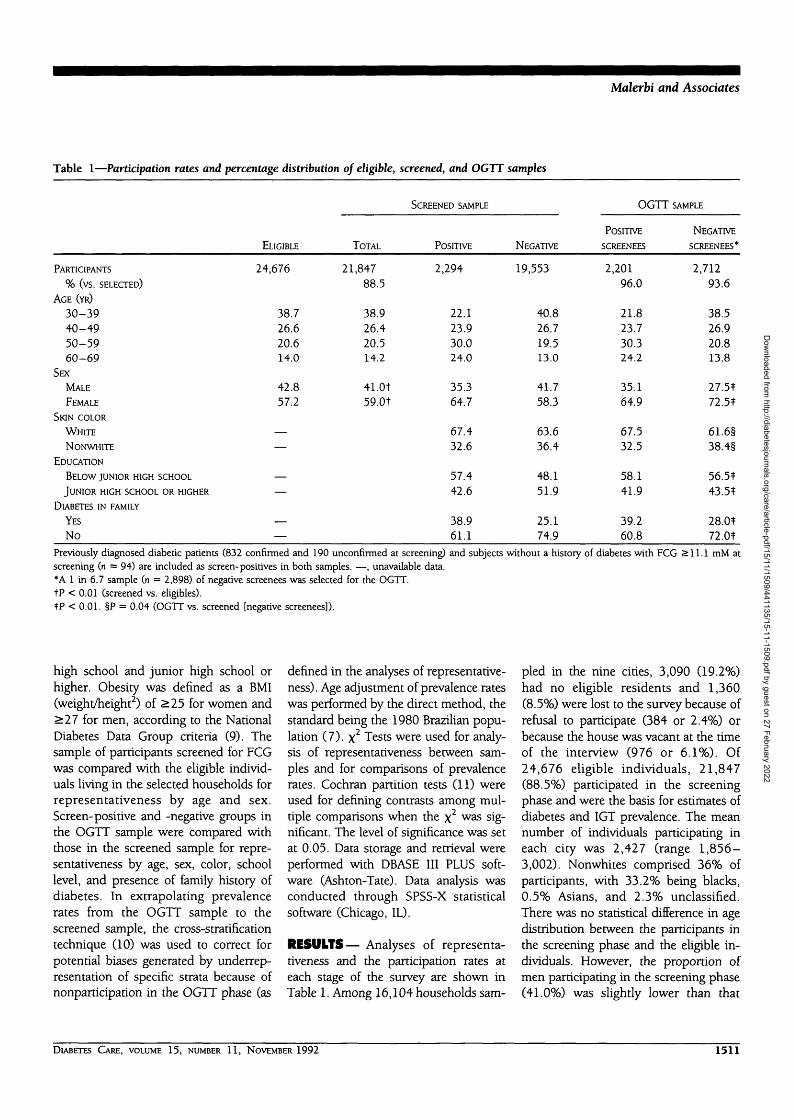
Figure 2 depicts the percentagedistribution of current therapy amongpreviously diagnosed diabetic patients inthe nine cities. Most of the patients(40.7%) were on oral hypoglycemicagents, whereas only IS. were on m-
DIABETES CARE, VOLUME 15, NUMBER 11, NOVEMBER 1992 1513
Dow
nloaded from http://diabetesjournals.org/care/article-pdf/15/11/1509/441135/15-11-1509.pdf by guest on 27 February 2022
Diabetes in Brazil
Diet Only29.1%
None22.3%
Insulin7.9%
Oral Agents40.7%
Figure 2—Percentage distribution of type oftreatment among 894 previously diagnosed dia-betic patients for whom this information wasavailable.
sulin therapy. A significant proportion ofpatients (22.3%) was not being treatedby the time of the survey, and 29.1%were on dietary treatment only.
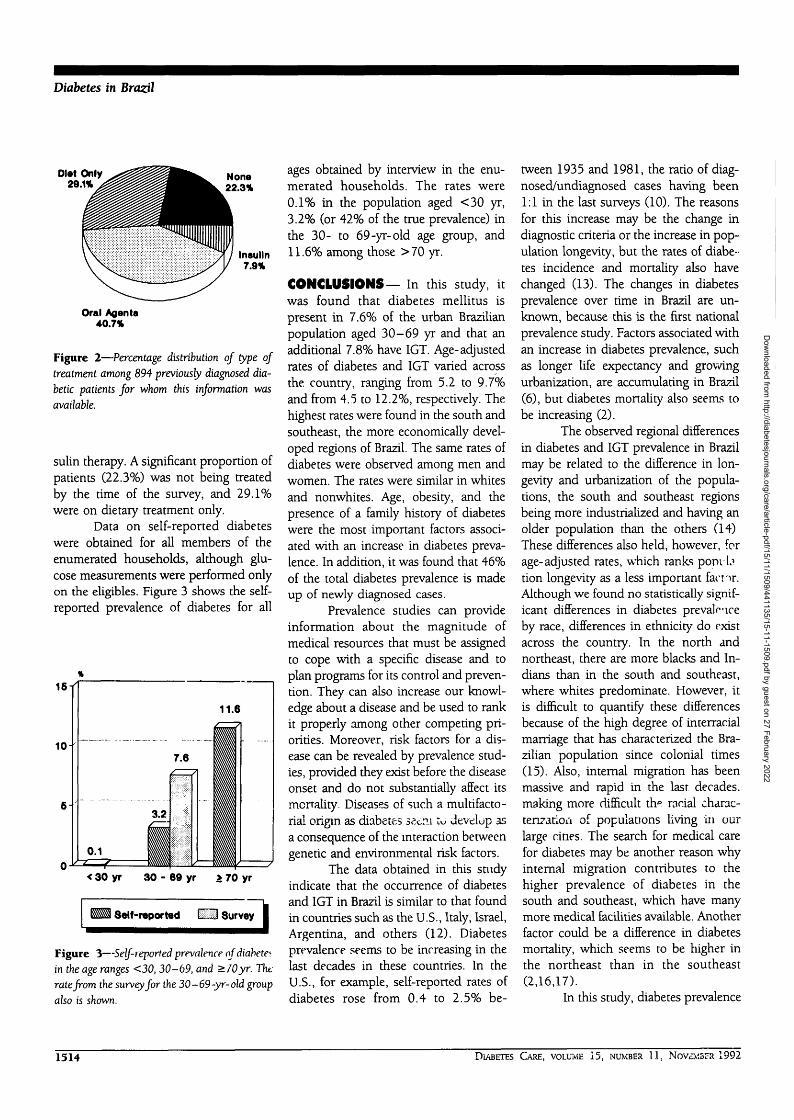
Data on self-reported diabeteswere obtained for all members of theenumerated households, although glu-cose measurements were performed onlyon the eligibles. Figure 3 shows the self-reported prevalence of diabetes for all
< 30 yr 30 - 69 yr & 70 yr
Self-reported H H Survey I
Figure 3—Self-reported prevalence of diabetesin the age ranges <30, 30-69, and >70yr. Thtrate from the survey for the 30-69-yr-old groupalso is shown.
ages obtained by interview in the enu-merated households. The rates were0.1% in the population aged <30 yr,3.2% (or 42% of the true prevalence) inthe 30- to 69-yr-old age group, and11.6% among those >70 yr.
CONCLUSIONS— In this study, itwas found that diabetes mellitus ispresent in 7.6% of the urban Brazilianpopulation aged 30-69 yr and that anadditional 7.8% have IGT. Age-adjustedrates of diabetes and IGT varied acrossthe country, ranging from 5.2 to 9.7%and from 4.5 to 12.2%, respectively. Thehighest rates were found in the south andsoutheast, the more economically devel-oped regions of Brazil. The same rates ofdiabetes were observed among men andwomen. The rates were similar in whitesand nonwhites. Age, obesity, and thepresence of a family history of diabeteswere the most important factors associ-ated with an increase in diabetes preva-lence. In addition, it was found that 46%of the total diabetes prevalence is madeup of newly diagnosed cases.
Prevalence studies can provideinformation about the magnitude ofmedical resources that must be assignedto cope with a specific disease and toplan programs for its control and preven-tion. They can also increase our knowl-edge about a disease and be used to rankit properly among other competing pri-orities. Moreover, risk factors for a dis-ease can be revealed by prevalence stud-ies, provided they exist before the diseaseonset and do not substantially affect itsmcrrality. Diseases of such a multifacto-rial origin as diabetes ss«:ni tu develop asa consequence of the interaction betweengenetic and environmental risk factors.
The data obtained in this studyindicate that the occurrence of diabetesand IGT in Brazil is similar to that foundin countries such as the U.S., Italy, Israel,Argentina, and others (12). Diabetesprevalence seems to be increasing in thelast decades in these countries. In theU.S., for example, self-reported rates ofdiabetes rose from 0.4 to 2.5% be-
tween 1935 and 1981, the ratio of diag-nosed/undiagnosed cases having been1:1 in the last surveys (10). The reasonsfor this increase may be the change indiagnostic criteria or the increase in pop-ulation longevity, but the rates of diabe-tes incidence and mortality also havechanged (13). The changes in diabetesprevalence over time in Brazil are un-known, because this is the first nationalprevalence study. Factors associated withan increase in diabetes prevalence, suchas longer life expectancy and growingurbanization, are accumulating in Brazil(6), but diabetes mortality also seems tobe increasing (2).
The observed regional differencesin diabetes and IGT prevalence in Brazilmay be related to the difference in lon-gevity and urbanization of the popula-tions, the south and southeast regionsbeing more industrialized and having anolder population than the others (14)These differences also held, however, forage-adjusted rates, which ranks popvLition longevity as a less important famr.Although we found no statistically signif-icant differences in diabetes prevalenceby race, differences in ethnicity do existacross the country. In the north andnortheast, there are more blacks and In-dians than in the south and southeast,where whites predominate. However, itis difficult to quantify these differencesbecause of the high degree of interracialmarriage that has characterized the Bra-zilian population since colonial times(15). Also, internal migration has beenmassive and rapid in the last decades,making more difficult th* racial charac-terization of populations living in ourlarge cities, The search for medical carefor diabetes may be another reason whyinternal migration contributes to thehigher prevalence of diabetes in thesouth and southeast, which have manymore medical facilities available. Anotherfactor could be a difference in diabetesmortality, which seems to be higher inthe northeast than in the southeast(2,16,17).
In this study, diabetes prevalence
1514 DIABETES CARE, VOLUME 15, NUMBER 11 , NOVEMBER 1992
Dow
nloaded from http://diabetesjournals.org/care/article-pdf/15/11/1509/441135/15-11-1509.pdf by guest on 27 February 2022

Malerbi and Associates
rates were found to be >6 times higherin the 7th decade of life than in the 4th.Either the presence of obesity or diabetesin the family were associated with ratesnearly twofold those seen in their ab-sence. These, observations are in agree-ment with the concept that age, heredity,and obesity are the universal risk factorsfor type II diabetes (18).
Based on the survey data, almosttnl.f (46%) of diabetic subjects aged30- 69 yr in Brazil are undiagnosed, thepercentage of newly diagnosed diabeteshaving ranged from 31 to 65% in thenine cities. These figures can be com-pared with those of Harris et al. (10),who found that undiagnosed diabetesconstitutes 48.5% of all cases in the U.S.Moreover, if the self-reported prevalenceof diabetes in people aged > 70 yr is also—50% the total, we can speculate thatthe rate of diabetes may be as high as?,5% in this oldest age range. Conversely,the self-reported diabetes rate we foundin people <30 yr (0.1%) must be closeto the total rate, because in this age rangemost patients have type I diabetes, (19),in which case the disease is hardly everunrecognized.
Twenty-two percent of the diag-nosed cases were not being treated at thetime of the survey. This finding calls forefforts to improve health education andstresses the need for a long-term com-mitment to populational screening fordiabetes On the other hand, the percent-age of diabetic subjects being treatedwith insulin (7.9%) can be consideredlow, compared with published figures(70,? 1) This may stem from undue prej-u-ir.e against insulin therapy by patientsand/or practitioners, but it also may beattributable to a low incidence of type Idiabetes. A high mortality rate amongtype I. patients might also explain this.The need for studies on diabetes mortal-ity in the Brazilian population, particu-larly in the <30-yr age-group, cannot beoveremphasized.
Brazil has an estimated popula-tion for 1990 of 150 million, with 66.5%<30 yr of age, 31% aged 30-69 yr, and
2.5% >70 yr (7). If we extrapolate ourresults to the general population, accord-ing to these figures, the total number ofdiabetic subjects in the country can beestimated to be 4.5 million. Of these, 2million individuals are unaware of theirdisease, and one-half million patientswith known diabetes are not beingtreated with accepted diabetes therapies.We can conclude that diabetes mellitusprobably is the most important endo-crine-metabolic disease in Brazil andthat its impact on public health is com-parable with that in more developed na-tions, where it is considered a majorhealth problem.
Acknowledgments—This study was sup-ported by the Brazilian Ministry of Health, theNational Council for Scientific and Techno-logical Development, the Pan-AmericanHealth Organization, (CNPq) and the SaoPaulo Foundation for Research Support(FAPESP).
We thank Dr. Michael Stem for his assis-tance in planning the work and analyzing thedata; Dr. Marco Antonio Vivolo for his helpwith the data management system; Drs. Ser-gio Pereira de Almeida Toledo and MaureenHarris for their expert critical revision of themanuscript; and Brian Weymouth for the lan-guage revision.
This work was presented in abstract format the 14th annual meeting of the Interna-tional Diabetes Federation, Washington, DC,1991.
APPENDIX—THE BRAZILIANCOOPERATIVE GROUP ON THESTUDY OF DIABETESPREVALENCE—
Steering committeeLaercioJ. Franco, Adolpho Milech, Do-mingos Malerbi, Maria Ines Schmidt, Lu-ciano Almeida, Augusto Pimazoni Netto,Reginaldo H. Albuquerque, Corina D. C.Braga.
Participating centersLaercio Franco, Katsumi Osiro (SaoPaulo); Ines Lessa, Judith D. C. Pousada
(Salvador); Maria Ines Schmidt, MariaInes Azambuja (Porto Alegre); AdolphoMilech, Jose Egidio P. Oliveira (Rio deJaneiro); Laurenice P. Lima, Jose B. Pen-iche (Brasilia); Luciano Almeida, Fran-cisco Bandeira (Recife); WaldeniceOhana, Bruno Urbinati, Nizomar Car-neiro (Belem); Adriana C. Forti, MariaFerreira Guimaraes (Fortaleza); JoaoModesto Filho, Ilka M. L. Araujo Qo a o
Pessoa).
References
1. Briscoe J: Brazil: The New Challenge ofAdult Health. A World Bank CountryStudy. Washington, DC, The Interna-tional Bank for Reconstruction and De-velopment/The World Bank, 1990
2. Laurenti R, Fonseca LAM, Costa MLJr:Mortalidade por diabetes mellitus nomunicipio de Sao Paulo (Brasil). RevSaude Publ Sao Paulo 16:77-91, 1982
3. Wilson D: Contribuigdo para o Conheci-mento da Epidemiologia do Diabetes Melli-tus. Aspectos da sua Prevalencia na Cidadedejarinu, Estado de Sao Paulo. Sao Paulo,Univ. Sao Paulo Public Health School,1964
4. Wilson D: Estudos sobre as provas detolerancia a glicose potencializadas emreclusos da penitenciaria do Estado deSao Paulo. I. Prevalencia do diabetesmellitus. Arq Fac Hig Saude Publ SaoPaulo 20:129-37, 1966
5. Achutti A, Medeiros A MB: Hipertensaoarterial no Rio Grande do Sul. Bol Saude12:6-54, 1985
6. Ministerio da Saude do Brasil: Controledas Doengas ndo Transmissiveis no Brasil.Brasilia, Centro de Documentacao doMinisterio da Saude, 1986
7. Fundagao Instituto Brasileiro deGeografia e Estatistica: Anuario Estatisticodo Brasil. Rio de Janeiro, Brazil, 1985
8. Lapin LL: Statistics—meaning andmethod. New York, Harcourt Brace Jo-vanovich, 1975, p. 74-87
9. National Diabetes Data Group: Classifi-cation and diagnosis of diabetes mellitusand other categories of glucose intoler-ance. Diabetes 28:1039-57, 1979
10. Harris MI, Hadden WC, Knowler WC,
DIABHTES CARE, VOLUME 15, NUMBER 11 , NOVEMBER 1992 1515
Dow
nloaded from http://diabetesjournals.org/care/article-pdf/15/11/1509/441135/15-11-1509.pdf by guest on 27 February 2022

Diabetes in Brazil
Bennett PH: Prevalence of diabetes andimpaired glucose tolerance and plasmaglucose levels in U.S. population aged20-74 years. Diabetes 36:523-34, 1987
11. Cochran WG: Some methods forstrengthening the common x2 test. Bio-metrics 10:417-51, 1954
12. King H, Zimmet P: Trends in the preva-lence and incidence of diabetes: non-insulin-dependent diabetes mellitus.World Health Stat Q 41:190-96, 1988
13. Harris MI: Prevalence of non-insulin-dependent diabetes and impaired glu-cose tolerance. In Diabetes in America.Bethesda, MD, U.S. Department ofHealth and Human Services, National In-stitutes of Health, 1985, p. W l - 3 1
14. Becker RA, Lima JTF, Costa MLJr, Eds.:lnvestigagdo Sobre Perfis de Saude: Brasil,
1984. Brasilia, Centro de Documentagaodo Ministerio da Saude, 1989
15. Prado C Jr: Formagdo do Brasil Contem-poraneo. Sao Paulo, Editora Brasiliense,1987
16. Lessa I, Oliveira ZC, Boa Sorte A, CabralMS: Diabetes mellitus como causa basicae como causa associada de morte emSalvador, Brasil. Arq Bras Med 60:467-72, 1986
17. Melo MS: Mortalidade por Diabetes Melli-tus no Municipio do Recife, no Periodo1961-1987. Recife, Centro de Ciencias daSaude da Univ. Federal de Pernambuco,1990
18. Everhart J, Knowler WC, Bennett PH:Incidence and risk factors for non-insulin-dependent diabetes. In Diabetesin America. Bethesda, MD, U.S. Depart-
ment of Health and Human Services, Na-tional Institutes of Health, 1985, p. IV/1-35
19. Krolewsky AS, Martin B, Warram JH:Epidemiological features of the naturalhistory of diabetes as clues for etiologicstudies. In World Book of Diabetes in Prac-tice. Krall LP, Ed. Amsterdam, Elsevier,1988, p. 59-64
20. Martin DB, Quint AR: Therapy for dia-betes. In Diabetes in America. Bethesda,MD, U.S. Department of Health and Hu-man Services, National Institutes ofHealth, 1985, p. XXIV/1-30
21. Foss MC, Paccola GM, Souza NV, IazigiN: Estudo analitico de uma arhostra pop-ulacional de diabeticos tipo II da regiaode Ribeirao Preto (SP). Rev Ass Med Bras35:179-83, 1989
1516 DIABETES CARE, VOLUME 15, NUMBER 11, NOVEMBER 1992
Dow
nloaded from http://diabetesjournals.org/care/article-pdf/15/11/1509/441135/15-11-1509.pdf by guest on 27 February 2022