Embed Size (px)
Citation preview
Mt Carlton May 2014
Arlene Rofe – General Manager
Disclaimer This presentation has been prepared by Evolution Mining Limited (“Evolution Mining”) and consists of
slides for a presentation concerning the company. By reviewing/attending this presentation, you acknowledge and agree the following.
This presentation includes forward-looking statements. Forward-looking statements inherently involve subjective judgement and analysis and are subject to a number of risks, uncertainties, contingencies and other factors, many of which are outside the control of, and may be unknown to, Evolution Mining. As such, actual results or performance may vary materially from those expressed or implied by forward-looking statements. The types of factors that could cause such variation in actual results or performance include (without limitation) commodity prices, operational problems and general economic conditions. Given these factors, undue reliance should not be placed on forward-looking statements, which speak only as at the date of this presentation. Subject to any continuing obligations under applicable law or any relevant stock exchange listing rules, Evolution Mining does not undertake any obligation to publicly update or revise any forward-looking statements contained in this presentation, including (without limitation) where Evolution Mining’s expectations change in relation to such statements and where there is a change in events, conditions or circumstances providing the basis for any such statement.
No representation or warranty, express or implied, is made as to the accuracy, completeness, reliability, fairness or correctness of the information contained in this presentation. To the maximum extent permitted by law, Evolution Mining and its related bodies corporate and affiliates, and each of their respective directors, officers, employees, agents and representatives, disclaim any liability or responsibility for loss or damage arising from or in connection with the use of the information contained in this presentation.
2

3
Location
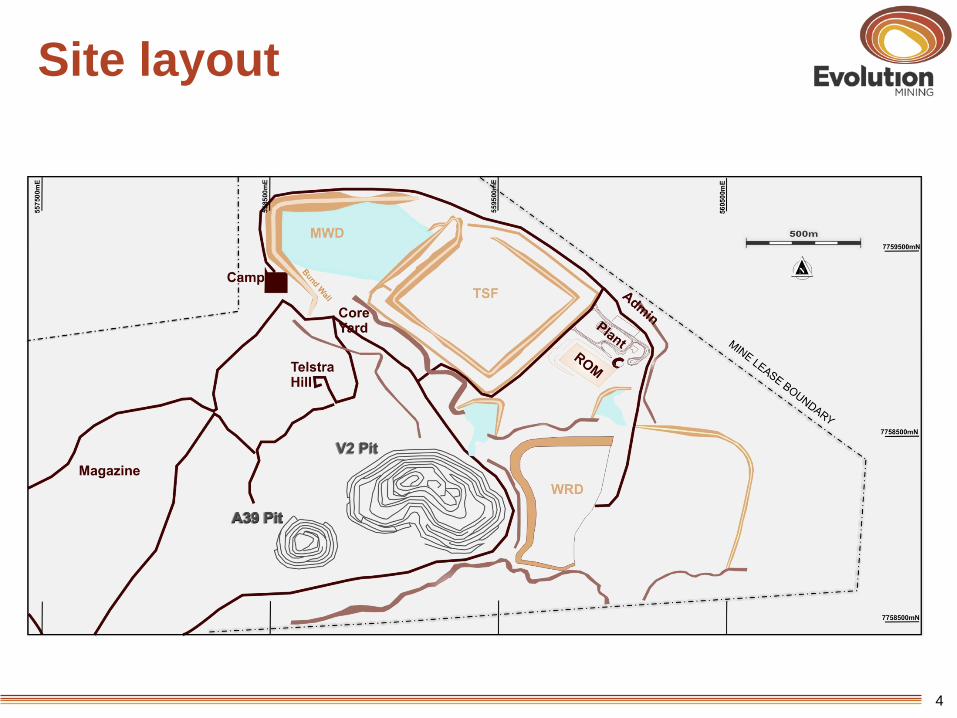
Site layout
4
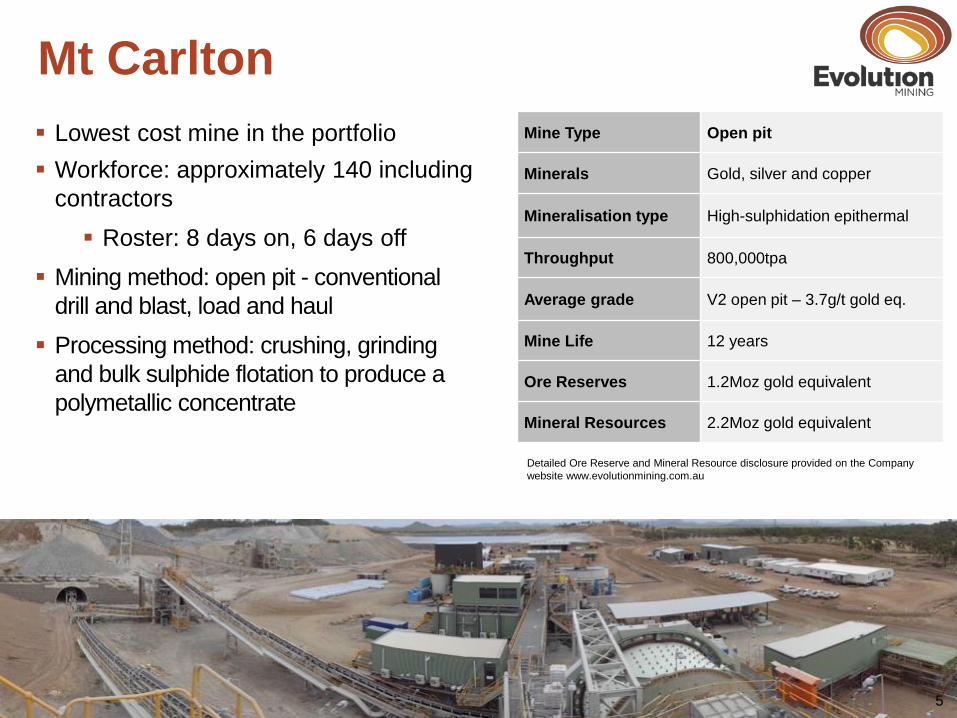
Mt Carlton
Mt Rawdon Open Pit: Stage 2 Cutback Sept 2012
Mine Type Open pit
Minerals Gold, silver and copper
Mineralisation type High-sulphidation epithermal
Throughput 800,000tpa
Average grade V2 open pit – 3.7g/t gold eq.
Mine Life 12 years
Ore Reserves 1.2Moz gold equivalent
Mineral Resources 2.2Moz gold equivalent
Detailed Ore Reserve and Mineral Resource disclosure provided on the Company website www.evolutionmining.com.au
Lowest cost mine in the portfolio Workforce: approximately 140 including
contractors Roster: 8 days on, 6 days off
Mining method: open pit - conventional drill and blast, load and haul
Processing method: crushing, grinding and bulk sulphide flotation to produce a polymetallic concentrate
5

Safety, Environment & Community

7
• TRIFR reduced by 30% • Feedback and consultation with workforce • Behavioural safety key focus – Beyond Zero Program • Culture of reporting hazards, near-misses, incidents
Safety
• Responsible environmental management and performance
• Tails dam raise to be completed for wet season • Maintenance of heritage sites • Burdekin river pipeline flora and fauna survey
Environment
• Four Birriah traineeships – positive feedback • Good relationship with landholders • Community Consultative Committee • Capital Program – Whitsunday Shire Council
(Tondara Road) in discussion
Community
Safety, environment & community
Mining
Mining Current Fleet: 1 x 1200 excavator 4 x CAT 777 trucks 1 x 980 loader 1 x 14M grader 1 x 773 water cart 2 x dozers 1x 30t rock breaker Completion of A39 Pit mining scheduled in Q4 FY14
Optimising mine scheduling
V2 pit
9
6
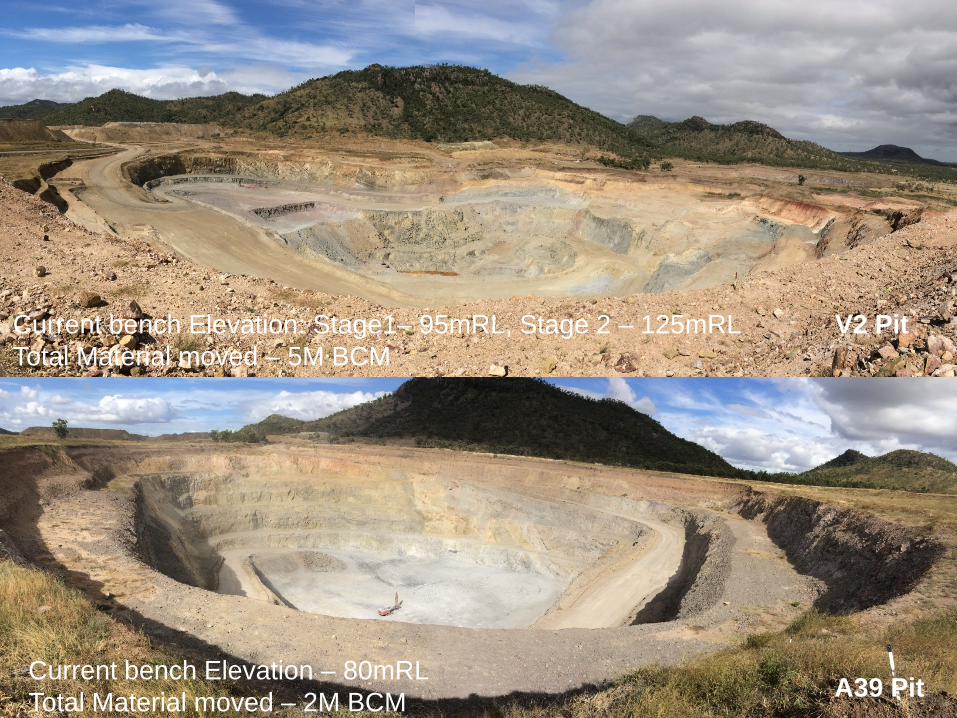
V2 Pit
A39 Pit Current bench Elevation – 80mRL Total Material moved – 2M BCM
Current bench Elevation: Stage1– 95mRL, Stage 2 – 125mRL Total Material moved – 5M BCM

Total material movement significantly reduced in H2 FY14
Life of mine strip ratio: V2 = 2.7:1, A39 = 3.3:1
A39 pit scheduled for completion of mining in Q4 FY14. Evaluation in progress to assess further exploitation of the remaining resource
Edna May open pit at 31 December 2013: Stage 1 (base of pit) and Stage 2 (surface)
A39 ore Mark-Up 85mRL – B-flitch
Mining
11
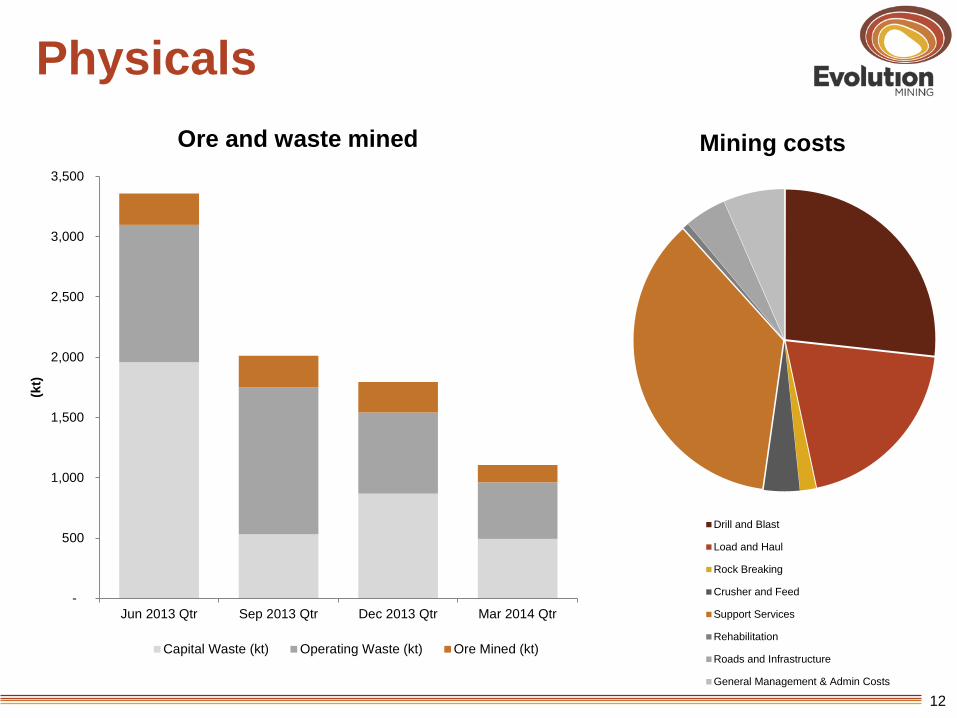
Drill and Blast
Load and Haul
Rock Breaking
Crusher and Feed
Support Services
Rehabilitation
Roads and Infrastructure
General Management & Admin Costs
Physicals
12
-
500
1,000
1,500
2,000
2,500
3,000
3,500
Jun 2013 Qtr Sep 2013 Qtr Dec 2013 Qtr Mar 2014 Qtr
(kt)
Ore and waste mined
Capital Waste (kt) Operating Waste (kt) Ore Mined (kt)
Mining costs

Processing

Process flowsheet
14

Physicals FY14 YTD July 2013 to March 2014 Units A39 V2 Total/Average
Mining Capital waste kt 0 1,894 1,894 Operating waste kt 141 2,219 2,359 Ore mined kt 211 341 553 Mined Grade - gold g/t - 5.1 5.1 Mined Grade - silver g/t 373 48 172 Processing Ore processed kt 174 318 492 Grade processed - gold g/t - 5.6 5.62 Grade processed - silver g/t 426 60 190 Grade processed - gold and gold equiv.1 g/t 6.9 5.6 6.1 Gold recovery % - 87 87 Silver recovery % 85 - 85 Production Concentrate produced t 16,246 25,255 41,501 Gold2 oz - 42,245 42,245 Silver2 oz 1,568,704 278,983 1,847,687 Copper2 t 77 861 937 Gold and gold equivalent1,2 oz 25,515 42,245 67,759
1. Gold and gold equivalent is Mt Carlton A39 silver as gold equivalent 2. Production is equivalent to payable metal
15

Plant performance
Edna May Crushing Circuit
70
75
80
85
90
95
0
10
20
30
40
50
60
70
80
90
100
Jul Aug Sep Oct Nov Dec Jan Feb Mar
Rec
over
y (%
)
Thro
ughp
ut (t
/h)
Plant Performance
A39 - Ag, % V2 - Au, % Avg t/h
Plant throughput 800kt per annum Plant availability 91.3%
16
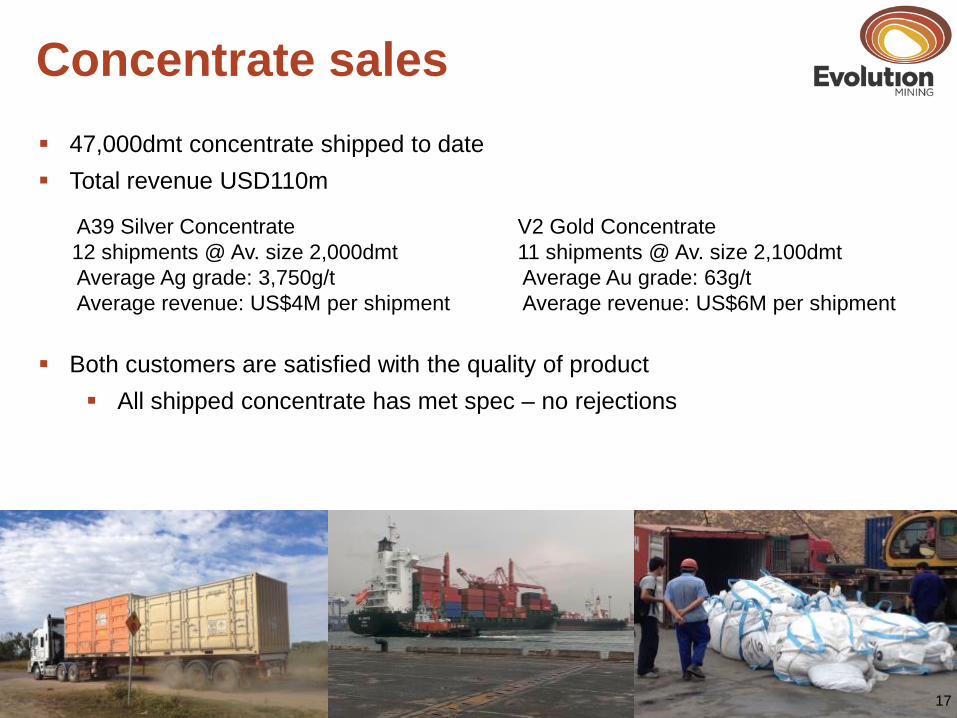
Concentrate sales 47,000dmt concentrate shipped to date Total revenue USD110m
Both customers are satisfied with the quality of product
All shipped concentrate has met spec – no rejections
A39 Silver Concentrate 12 shipments @ Av. size 2,000dmt Average Ag grade: 3,750g/t Average revenue: US$4M per shipment
V2 Gold Concentrate 11 shipments @ Av. size 2,100dmt Average Au grade: 63g/t Average revenue: US$6M per shipment
17

More favourable contracts negotiated
Power, fuel, lime, explosives, equipment
Review of rates being charged on all hired equipment on site
Reduced grinding media consumption
Contractor management and selection
Material selection to reduce maintenance and costs
Camp costs reduced
Grade control cost could be reduced by >35% if sample length is increased to 1.5m (from 1m).
Review fleet and mining organisational structure
18
Cost saving initiatives

FY14 YTD production of 67,749oz AuEq already within FY14 guidance (65,000 – 75,000oz AuEq)
FY14 YTD cash cost of A$603/oz well below guidance of A$700 – $750 per ounce
Production and cash cost
11,692oz 18,904oz 22,747oz 26,109oz
A$578
A$795
A$454
0
200
400
600
800
0
20,000
40,000
60,000
80,000
Jun Qtr2013
Sep Qtr2013
Dec Qtr2013
Mar Qtr2014
Cos
t A$/
oz
Prod
uctio
n Au
eq
(oz)
Production gold equiv. oz C1 Cash Cost
A39 A39 V2 V2
19

Geology
Exploration – Strategy and Plan
Transformational discovery – maximise opportunity Capability of the orebody drives the business
4D and Seismic – opportunity to increase geological knowledge Think like scientists to increase prospectivity
Lithogeochemistry and ASD defined levels to explore and prioritise exploration
Project pipeline – depth and quality Rank, prioritise , monetise, drop
People – capability and commitment Realise full potential - work to values
21
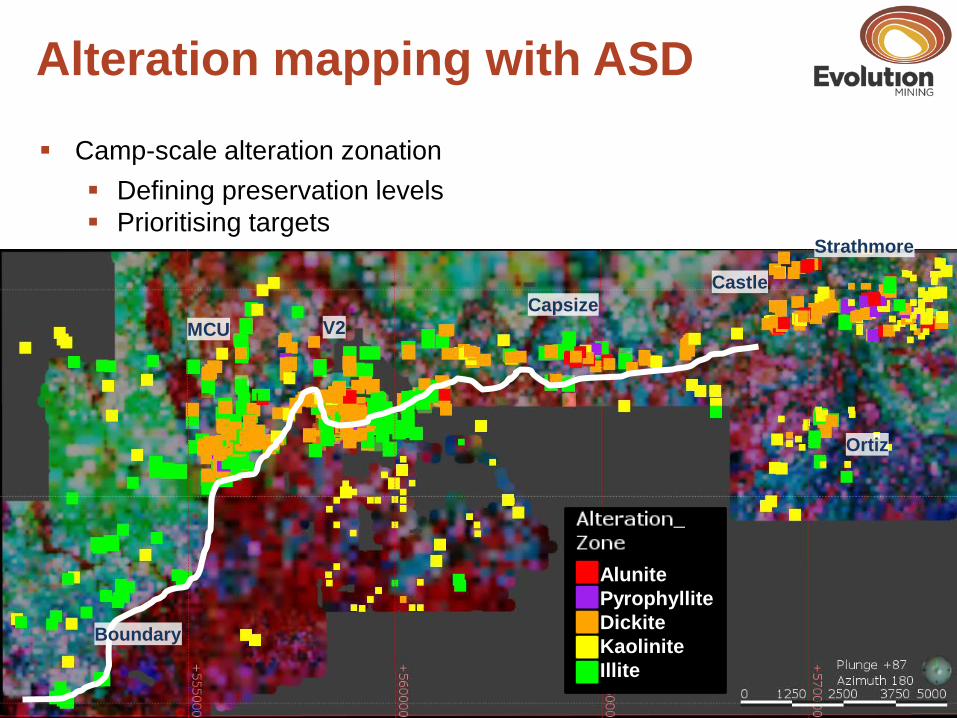
Alteration mapping with ASD
Camp-scale alteration zonation Defining preservation levels Prioritising targets
Alunite Pyrophyllite Dickite Kaolinite Illite
MCU V2 Capsize
Strathmore
Ortiz
Boundary
Castle

Geochemistry
MCU V2 Capsize
Strathmore
Ortiz
Boundary
Castle
Alteration and geochemical mapping reflect the styles and ability to target high sulphidation deposits
New targets identified
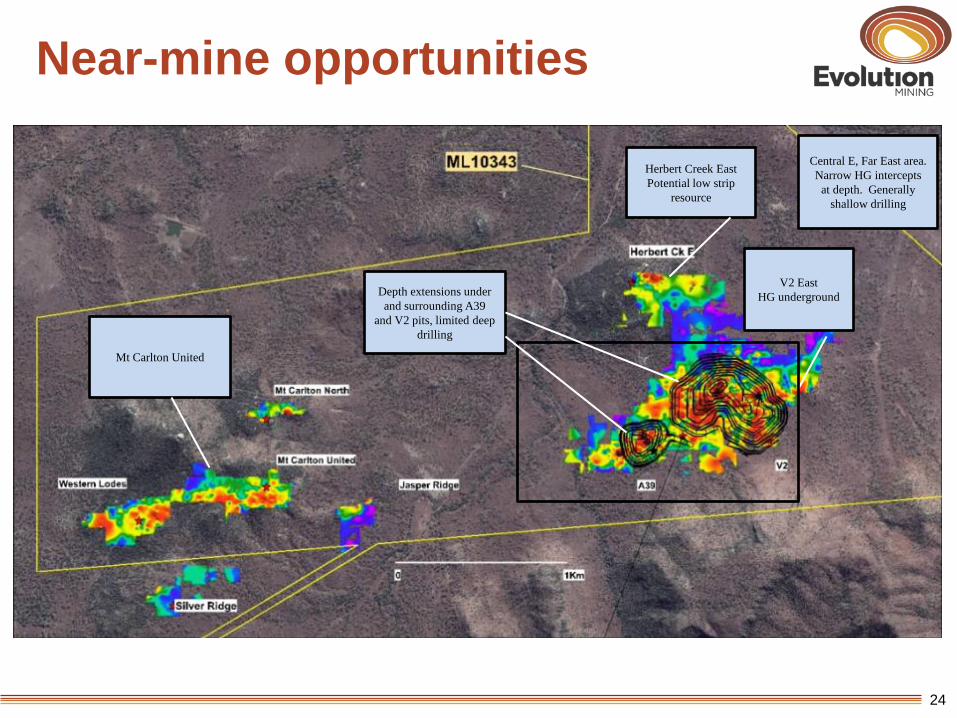
Near-mine opportunities
V2 East HG underground
Herbert Creek East Potential low strip
resource
Mt Carlton United
Depth extensions under and surrounding A39
and V2 pits, limited deep drilling
Central E, Far East area. Narrow HG intercepts
at depth. Generally shallow drilling
24

Greenfields opportunities
25

Discovery project pipeline
Curve shows incremental value creation
26
Appendix

Resources
Tonnes (Mt)
Grade Au (g/t)
Cont. Metal
Au (koz)
Tonnes (Mt)
Grade Au (g/t)
Cont. Metal
Au (koz)
Tonnes (Mt)
Grade Au (g/t)
Cont. Metal
Au (koz)
Tonnes (Mt)
Grade Au (g/t)
Cont. Metal
Au (koz)
A39 - - - - - - - - - - - - V2 9.02 2.0 586 14.7 1.5 695 1.41 1.5 68 25.2 1.7 1,350Stockpile 0.25 0.1 1 - - - - - - 0.25 0.1 1Total Mt Carlton 9.28 2.0 587 14.7 1.5 695 1.41 1.5 68 25.4 1.7 1,350
Tonnes (Mt)
Grade Ag (g/t)
Cont. Metal
Ag (koz)
Tonnes (Mt)
Grade Ag (g/t)
Cont. Metal
Ag (koz)
Tonnes (Mt)
Grade Ag (g/t)
Cont. Metal
Ag (koz)
Tonnes (Mt)
Grade Ag (g/t)
Cont. Metal
Ag (koz)A39 2.38 192 14,631 0.23 80 594 0.10 85 262 2.70 178 15,487V2 9.02 21 6,159 14.7 18 8,410 1.41 12 534 25.2 19 15,103Stockpile 0.25 80 647 - - - - - - 0.25 80 647Total Mt Carlton 11.7 57 21,437 14.9 19 9,004 1.51 16 796 28.1 35 31,237
Tonnes (Mt)
Grade Cu (%)
Cont. Metal Cu (kt)
Tonnes (Mt)
Grade Cu (%)
Cont. Metal Cu (kt)
Tonnes (Mt)
Grade Cu (%)
Cont. Metal Cu (kt)
Tonnes (Mt)
Grade Cu (%)
Cont. Metal Cu (kt)
A39 2.38 0.13 3.1 0.23 0.01 0.0 0.10 0.00 0.0 2.70 0.12 3.1V2 9.02 0.27 24.5 14.7 0.22 32.1 1.41 0.22 3.0 25.2 0.24 59.7Stockpile 0.25 0.11 0.3 - - - - - - 0.25 0.11 0.3Total Mt Carlton 11.7 0.24 27.9 14.9 0.21 32.1 1.51 0.20 3.0 28.1 0.22 63.1
Tonnes (Mt)
Grade AuEq (g/t)
Cont. Metal
AuEq (koz)
Tonnes (Mt)
Grade AuEq (g/t)
Cont. Metal
AuEq (koz)
Tonnes (Mt)
Grade AuEq (g/t)
Cont. Metal
AuEq (koz)
Tonnes (Mt)
Grade AuEq (g/t)
Cont. Metal
AuEq (koz)
A39 2.38 4.0 307 0.23 1.6 12 0.10 1.7 5 2.70 3.7 325V2 9.02 2.8 798 14.7 2.1 988 1.41 2.0 90 25.2 2.3 1,876Stockpile 0.25 1.7 14 - - - - - - 0.25 1.7 14Total Mt Carlton 11.7 3.0 1,119 14.9 2.1 1,000 1.51 2.0 95 28.1 2.5 2,214
Gold - Mt Carlton Mineral Resources - December 2012
Mineral Resource
Measured Indicated Inferred Total Resource
Silver - Mt Carlton Mineral Resources - December 2012
Mineral ResourceMeasured Indicated Inferred Total Resource
Copper - Mt Carlton Mineral Resources - December 2012
Mineral Resource
Measured Indicated Inferred Total Resource
Gold Equivalent - Mt Carlton Mineral Resources - December 2012
Mineral Resource
Measured Indicated Inferred Total Resource
Notes: Data is reported to significant figures and differences may occur due to rounding Mineral Resources are inclusive of Ore Reserves Mt Carlton V2 deposit Mineral Resources have been reported above a cut-off grade of 0.35 g/t gold and A39 deposit reported above 42g/t silver Mt Carlton V2 deposit was estimated using E-Type Multiple Indicator Kriging into blocks with dimensions 25 metres east by 25 metres north by 5 metres elevation Mt Carlton A39 deposit was estimated using a combination of Ordinary Kriging, for more broadly spaced Resource Definition drilling, and Sequential Gaussian Simulation for close spaced grade control drilled areas of the deposit into blocks with dimensions 10 metres by 10 metres by 2.5 metres elevation Competent Person: John Winterbottom a member of Australian Institute of Geoscientists The gold equivalence calculation represents total metal value for each metal summed and expressed in equivalent gold grade and ounces. The prices used in the calculation being A$1350/oz Au, A$28.00/oz Ag and A$2.00/lb Cu. Metallurgical recovery to concentrate of 90.0% for gold, 92.0% for silver at V2 and 88.0% silver at A39 and 92.0% for copper as indicated by metallurgical testwork 1 Troy Ounce = 31.1034768 grams Au Eq for Silver = ((Price Ag per Oz x Ag Recovery)/(Price Au per Oz x Au Recovery)) x Ag Grade Au Eq for Copper = ((Price Cu per lb x 2204.623) x (Cu Recovery)) / (Price Au per Oz x Au Recovery / 31.1034768) x (Cu Grade / 100)
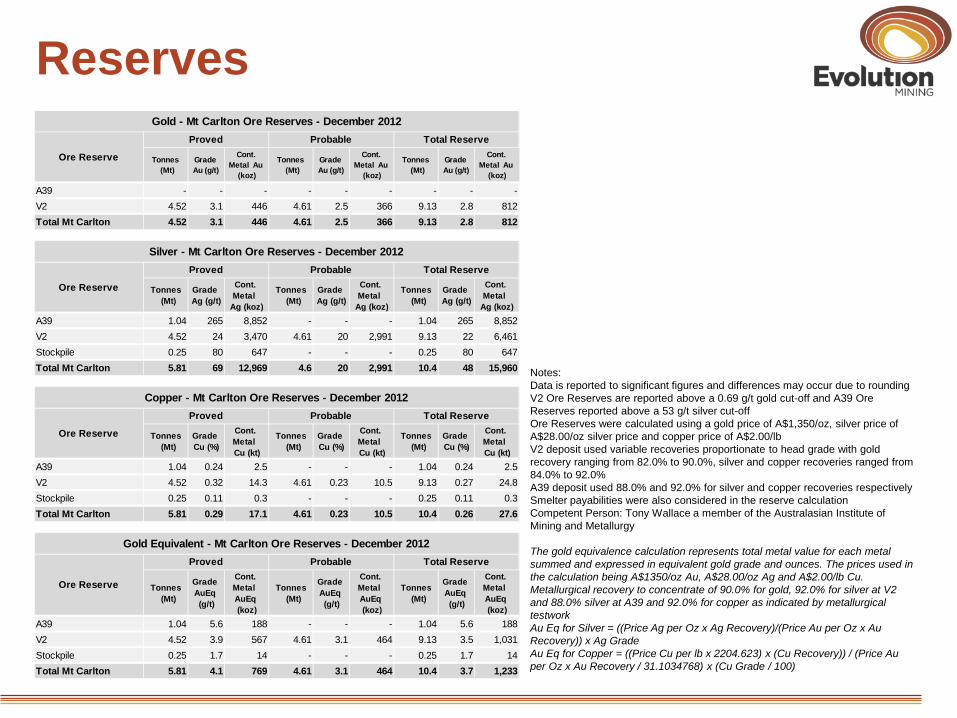
Reserves
Tonnes (Mt)
Grade Au (g/t)
Cont. Metal Au
(koz)
Tonnes (Mt)
Grade Au (g/t)
Cont. Metal Au
(koz)
Tonnes (Mt)
Grade Au (g/t)
Cont. Metal Au
(koz)
A39 - - - - - - - - - V2 4.52 3.1 446 4.61 2.5 366 9.13 2.8 812Total Mt Carlton 4.52 3.1 446 4.61 2.5 366 9.13 2.8 812
Tonnes (Mt)
Grade Ag (g/t)
Cont. Metal
Ag (koz)
Tonnes (Mt)
Grade Ag (g/t)
Cont. Metal
Ag (koz)
Tonnes (Mt)
Grade Ag (g/t)
Cont. Metal
Ag (koz)A39 1.04 265 8,852 - - - 1.04 265 8,852V2 4.52 24 3,470 4.61 20 2,991 9.13 22 6,461Stockpile 0.25 80 647 - - - 0.25 80 647Total Mt Carlton 5.81 69 12,969 4.6 20 2,991 10.4 48 15,960
Tonnes (Mt)
Grade Cu (%)
Cont. Metal Cu (kt)
Tonnes (Mt)
Grade Cu (%)
Cont. Metal Cu (kt)
Tonnes (Mt)
Grade Cu (%)
Cont. Metal Cu (kt)
A39 1.04 0.24 2.5 - - - 1.04 0.24 2.5V2 4.52 0.32 14.3 4.61 0.23 10.5 9.13 0.27 24.8Stockpile 0.25 0.11 0.3 - - - 0.25 0.11 0.3Total Mt Carlton 5.81 0.29 17.1 4.61 0.23 10.5 10.4 0.26 27.6
Tonnes (Mt)
Grade AuEq (g/t)
Cont. Metal AuEq (koz)
Tonnes (Mt)
Grade AuEq (g/t)
Cont. Metal AuEq (koz)
Tonnes (Mt)
Grade AuEq (g/t)
Cont. Metal AuEq (koz)
A39 1.04 5.6 188 - - - 1.04 5.6 188V2 4.52 3.9 567 4.61 3.1 464 9.13 3.5 1,031Stockpile 0.25 1.7 14 - - - 0.25 1.7 14Total Mt Carlton 5.81 4.1 769 4.61 3.1 464 10.4 3.7 1,233
Gold - Mt Carlton Ore Reserves - December 2012
Ore Reserve
Proved Probable Total Reserve
Ore Reserve
Proved Probable Total Reserve
Silver - Mt Carlton Ore Reserves - December 2012
Ore Reserve
Proved Probable Total Reserve
Copper - Mt Carlton Ore Reserves - December 2012
Ore Reserve
Proved Probable Total Reserve
Gold Equivalent - Mt Carlton Ore Reserves - December 2012
Notes: Data is reported to significant figures and differences may occur due to rounding V2 Ore Reserves are reported above a 0.69 g/t gold cut-off and A39 Ore Reserves reported above a 53 g/t silver cut-off Ore Reserves were calculated using a gold price of A$1,350/oz, silver price of A$28.00/oz silver price and copper price of A$2.00/lb V2 deposit used variable recoveries proportionate to head grade with gold recovery ranging from 82.0% to 90.0%, silver and copper recoveries ranged from 84.0% to 92.0% A39 deposit used 88.0% and 92.0% for silver and copper recoveries respectively Smelter payabilities were also considered in the reserve calculation Competent Person: Tony Wallace a member of the Australasian Institute of Mining and Metallurgy The gold equivalence calculation represents total metal value for each metal summed and expressed in equivalent gold grade and ounces. The prices used in the calculation being A$1350/oz Au, A$28.00/oz Ag and A$2.00/lb Cu. Metallurgical recovery to concentrate of 90.0% for gold, 92.0% for silver at V2 and 88.0% silver at A39 and 92.0% for copper as indicated by metallurgical testwork Au Eq for Silver = ((Price Ag per Oz x Ag Recovery)/(Price Au per Oz x Au Recovery)) x Ag Grade Au Eq for Copper = ((Price Cu per lb x 2204.623) x (Cu Recovery)) / (Price Au per Oz x Au Recovery / 31.1034768) x (Cu Grade / 100)

Competent person statement The information in this presentation that relates to exploration results, Mineral Resources or Ore Reserves listed in the table below is based on work compiled by the person whose name appears in the same row, who is employed on a full-time basis by the employer named in that row and is a member of the institute named in that row. Each person named in the table below has sufficient experience which is relevant to the style of mineralisation and type of deposit under consideration and to the activity which he or she has undertaken to qualify as a Competent Person as defined in the 2004 Edition of the “Australasian Code for Reporting of Exploration Results, Mineral Resources and Ore Reserves” (the JORC Code, 2004). Each person named in the table consents to the inclusion in this report of the matters based on their information in the form and context in which it appears.
Activity Name of
Competent Person
Employer Institute
Mt Carlton Mineral Resources John Winterbottom Formerly Evolution Mining Australian Institute of Geoscientists
Mt Carlton Ore Reserves Tony Wallace Evolution Mining Australasian Institute of Mining and Metallurgy

Evolution Mining ASX Code: EVN
www.evolutionmining.com.au
![[vc 1037 - listing.archiviolocation.com · [vc 1037] ARCHIVIOLOCATION.COM [vc 1037] ARCHIVIOLOCATION.COM [vc 1037] ARCHIVIOLOCATION.COM [vc 1037] ARCHIVIOLOCATION.COM. archivio location](https://img.dokumen.tips/doc/110x75/5fcd99d1df347e1ae154645c/vc-1037-vc-1037-archiviolocationcom-vc-1037-archiviolocationcom-vc-1037.jpg)