Embed Size (px)
Citation preview

Morbidity and Mortality Weekly Report
Weekly January 23, 2004 / Vol. 53 / No. 2
depardepardepardepardepartment of health and human sertment of health and human sertment of health and human sertment of health and human sertment of health and human servicesvicesvicesvicesvicesCenters for Disease Control and PreventionCenters for Disease Control and PreventionCenters for Disease Control and PreventionCenters for Disease Control and PreventionCenters for Disease Control and Prevention
Strength Training Among Adults Aged >65 Years — United States, 2001
Strength training (also referred to as resistance training)enables adults to improve their overall health and fitness byincreasing muscular strength, endurance, and bone densityand by improving their insulin sensitivity and glucosemetabolism (1). For older adults (i.e., persons aged >65 years),strength-training exercises are recommended to decrease therisk for falls and fractures (2) and to promote independentliving (Figure) (3). The American College of Sports Medicinerecommends that adults include strength training as part of acomprehensive physical activity program (1). A national healthobjective for 2010 is to increase to 30% the proportion ofadults who perform, >2 days per week, physical activities thatenhance and maintain muscular strength and endurance(objective 22-4) (4). To determine the percentage and charac-teristics of older adults who perform strength training consis-tent with this objective, CDC analyzed data from the 2001National Health Interview Survey (NHIS). This report sum-marizes the results of that analysis, which indicated thatapproximately 12% of persons aged 65–74 years and 10% ofpersons aged >75 years met the strength-training objective.These findings underscore the need for programs that encour-age older adults to incorporate strength training into theirlives along with regular physical activity.
NHIS consists of face-to-face interviews that collect infor-mation on health, health care, health behaviors, and relatedfactors. The 2001 survey used a stratified, multistage prob-ability sample representative of the U.S. civilian,noninstitutionalized population. The overall response rateamong selected adults was 73.8% (5). Data were collectedfrom 6,152 respondents aged >65 years, and SUDAAN wasused to account for the complex sampling design and sam-pling weights. A total of 615 respondents were excludedbecause of missing data on height and weight, health status,physical activity levels, and demographic characteristics; the
INSIDE
28 Measles Mortality Reduction — West Africa, 1996–200230 Measles Outbreak Associated with an Imported Case in
an Infant — Alabama, 200233 Human Death Associated with Bat Rabies — California,
200335 Update: Influenza Activity — United States, January 11–
17, 200437 Notice to Readers
FIGURE. Sample strength-training exercise for older adults
Source: National Institute on Aging.* Strengthens thigh and hip muscles and can be performed with ankle
weights: 1) Stand straight to the side or behind a chair or table, holding onfor balance. 2) Slowly bend one knee toward chest, without bending waistor hips. 3) Hold position for 1 second. 4) Slowly lower leg all the waydown; pause. 5) Repeat with other leg. 6) Alternate legs, performing 8–15repetitions with each leg. 7) Rest; perform a second set of 8–15 alternatingrepetitions.
Hip flexion*

26 MMWR January 23, 2004
SUGGESTED CITATIONCenters for Disease Control and Prevention. [Article Title].MMWR 2004;53:[inclusive page numbers].
The MMWR series of publications is published by theEpidemiology Program Office, Centers for Disease Controland Prevention (CDC), U.S. Department of Health andHuman Services, Atlanta, GA 30333.
Centers for Disease Control and Prevention
Julie L. Gerberding, M.D., M.P.H.Director
Dixie E. Snider, M.D., M.P.H.(Acting) Deputy Director for Public Health Science
Susan Y. Chu, Ph.D., M.S.P.H.(Acting) Associate Director for Science
Epidemiology Program Office
Stephen B. Thacker, M.D., M.Sc.Director
Office of Scientific and Health Communications
John W. Ward, M.D.Director
Editor, MMWR Series
Suzanne M. Hewitt, M.P.A.Managing Editor, MMWR Series
Jeffrey D. Sokolow, M.A.(Acting) Lead Technical Writer/Editor
Jude C. RutledgeTeresa F. Rutledge
Douglas W. WeatherwaxWriters/Editors
Lynda G. CupellMalbea A. LaPete
Visual Information Specialists
Kim L. Bright, M.B.A.Quang M. Doan, M.B.A.
Erica R. ShaverInformation Technology Specialists
Division of Public Health Surveillanceand Informatics
Notifiable Disease Morbidity and 122 Cities Mortality DataRobert F. Fagan
Deborah A. AdamsJudith Allen
Felicia J. ConnorLateka Dammond
Rosaline DharaDonna Edwards
Patsy A. HallPearl C. Sharp
final sample size was 5,537. Respondents were asked, “Howoften do you do physical activities specifically designed tostrengthen your muscles, such as lifting weights or doingcalisthenics?” Respondents were categorized as meeting thenational strength-training objective if they engaged in strengthtraining >2 days per week (4). Multivariate logistic regressionanalysis was used to test for associations between meeting thestrength-training objective and specific characteristics of theolder adults. Models accounted for sex, age, race/ethnicity,education, marital status, body mass index (BMI), and self-reported health status.
Respondents also were asked about their participation inleisure-time physical activities (e.g., exercise, sports, and physi-cally active hobbies) and how often they engaged for >10 min-utes in 1) vigorous activities that caused heavy sweating orlarge increases in breathing or heart rate and 2) light or mod-erate activities that caused only light sweating or slight ormoderate increases in breathing or heart rate. On the basis ofthe frequency and duration of their reported activities, respon-dents were categorized consistent with the national healthobjective for physical activity (objective 22-2) (4) as “active”(i.e., engaging in moderate-intensity physical activity for >30minutes, >5 days per week, or in vigorous-intensity physicalactivity for >20 minutes, >3 days per week), “insufficientlyactive” (i.e., active at less than recommended levels), or“inactive” (i.e., engaging in no physical activity).
Approximately 11% of respondents aged >65 years reportedthat they engaged in strength training >2 days per week(Table 1). Women were less likely than men (odds ratio [OR]= 0.74; 95% confidence interval [CI] = 0.61–0.90) to meetthe objective. The likelihood of meeting the objective declinedwith advancing age and increased with level of education.Respondents who were obese (i.e., BMI >30 kg/m2) were lesslikely (OR = 0.59; 95% CI = 0.45–0.77) than those of healthyweight to meet the objective. Those reporting fair or poorhealth were less likely (OR = 0.37; 95% CI = 0.26–0.51) tomeet the objective than those in excellent health.
Among older adults categorized as physically active, 24.7%engaged in strength training (Table 2). Persons categorized asinactive (OR = 0.13; 95% CI = 0.10–0.16) and persons cat-egorized as insufficiently active (OR = 0.50; 95% CI = 0.40–0.62) were less likely to engage in strength training than personsin the physically active group. An estimated 5.6% of respon-dents met the national objectives for both physical activity andstrength training.Reported by: J Kruger, PhD, DR Brown, PhD, DA Galuska, PhD,D Buchner, MD, Div of Nutrition and Physical Activity, National Centerfor Chronic Disease Prevention and Health Promotion, CDC.

Vol. 53 / No. 2 MMWR 27
TABLE 1. Percentage of persons aged >65 years who reportedmeeting the 2010 national health objective for strength training*, byselected characteristics — National Health Interview Survey, UnitedStates, 2001
% meetingCharacteristic No.† objective OR§ (95% CI¶)
SexMen 2,098 13.3 1.0 ––Women 3,439 9.5 0.74 (0.61–0.90)
Age group (yrs)65–74 2,938 12.1 1.0 ––
>75 2,599 9.9 0.85 (0.68–1.06)Race/Ethnicity
White, non-Hispanic 4,294 11.7 1.0 ––Black, non-Hispanic 608 7.1 0.80 (0.52–1.23)Hispanic 520 5.9 0.60 (0.38–0.96)Other** 115 17.7†† 1.54 (0.78–3.05)
Education<High school 1,865 6.6 1.0 ––High school 1,766 8.6 1.12 (0.82–1.53)Some college 1,075 14.5 1.93 (1.44–2.58)College graduate 831 20.5 2.49 (1.79–3.47)
Marital statusCurrently married 2,289 12.0 1.0 ––Widowed/separated/divorced 2,921 10.1 1.09 (0.87–1.36)Never married 327 9.5 0.79 (0.52–1.20)
Body mass index (BMI) (kg/m2)Healthy (BMI <25) 2,239 12.6 1.0 ––Overweight (BMI >25–<30) 2,057 12.0 0.97 (0.77–1.22)Obese (BMI >30) 1,241 6.9 0.59 (0.45–0.77)
Self-reported health statusExcellent 814 20.0 1.0 ––Very good 1,456 12.8 0.67 (0.51–0.88)Good 1,888 9.4 0.50 (0.38–0.65)Fair or poor 1,379 6.1 0.37 (0.26–0.51)
Total 5,537 11.1 –– ––* Defined as engaging in strength training >2 days per week.†
Sample size.§
Odds ratio, adjusted for all other covariates.¶
Confidence interval.** Includes American Indian/Alaska Native, Asian, Native Hawaiian, and other Pacific
Islander.††
Estimate might be unstable.
TABLE 2. Percentage of adults aged >65 years who reported meetingthe 2010 national health objective for strength training*, by physicalactivity category† — National Health Interview Survey, United States,2001
% meetingPhysical activity category No.§ objective OR¶ (95% CI**)Active 1,176 24.7 1.0 ––Insufficiently active 1,296 14.0 0.50 (0.40–0.62)Inactive 3,065 4.0 0.13 (0.10–0.16)Total 5,537 11.1 –– ––* Defined as engaging in strength training >2 days per week.†
Active—engaging in moderate-intensity physical activity >5 days per week for>30 minutes each time or in vigorous-intensity physical activity >3 days per weekfor >20 minutes each time; insufficiently active—active at less than recommendedlevels; and inactive—engaging in no physical activity.
§Sample size.
¶Odds ratio, adjusted for the following covariates: sex, age, race/ethnicity, education,marital status, body mass index, and self-reported health status.
** Confidence interval.
Editorial Note: The findings in this report indicatethat, in 2001, the majority of older adults, includingthose who met the national objective for physicalactivity, did not engage in strength training. Theseresults suggest the need for targeted programs toencourage certain older-adult populations (e.g., womenand persons who are less educated, obese, or physi-cally inactive) to increase strength training. These popu-lations are similar to those previously identified amongpersons aged >18 years who were less likely to engagein weight lifting >2 days per week (6).
During 1998–2001, the proportion of older adultswho met the national objective for strength trainingincreased from 10% in 1998 (4) to 12% in 2001among those aged 65–74 years and from 7% (4) to10% among those aged >75 years. However, theseprevalences remained less than half the 2010 nationaltarget of 30% of the adult population. To increasestrength training among older adults, programs shouldaddress multiple factors, including 1) increasing aware-ness of fitness benefits, 2) affordability, 3) physical limi-tations, 4) accessibility (e.g., transportation), and 5)fear of injury. Programs can be offered at places ofworship, community centers, senior centers, schools,and fitness centers (7). Older adults also can performstrength training in their homes by using chair exer-cises as described in exercise guides, videos, and freeinformation from the Internet (Box) (3,8).
The findings in this report are subject to at least threelimitations. First, because the data are based on theself-reports of survey participants, errors in reportingmight have affected prevalence estimates. Second,because respondents were not asked to provide detailsabout their strength training (e.g., number of repeti-tions or number of muscle groups exercised), the qual-ity of the strength training could not be evaluated.Finally, because the survey did not include personsliving in institutions, the results might not be general-izable to all older adults.
The majority of older adults, including even thosephysically active, are missing opportunities to improvetheir overall health and fitness through regular strengthtraining. Because only 5.6% have met the nationalobjectives for both physical activity and strengthtraining, all older adults should be encouraged toincorporate both regimens into their lives. Additionalinformation is available at http://www.nia.nih.gov/exercisebook.

28 MMWR January 23, 2004
Office (AFRO) adopted a plan to reduce measles mortality>50% by 2005 (2). The plan recommended 1) increasingmeasles vaccination by strengthening routine health services;2) providing a second opportunity for measles vaccination forall children, primarily through wide–age-range supplementalimmunization activities (SIAs); 3) enhancing measles surveil-lance; and 4) improving management of measles cases. Theinitial wide–age-range SIA targets all children aged 9 months–14 years, regardless of history of measles disease or vaccina-tion. Follow-up SIAs are needed 3–5 years after the initialSIA to provide a second opportunity for vaccination to chil-dren born since the previous SIA (i.e., those aged 9 months–4 years). During the 1990s, the countries of the Americas andseven countries in southern Africa used this strategy to reducethe number of measles deaths to near zero (3–5). This reportdescribes the recent implementation of this strategy in threeWest African countries, where reported measles cases declined83%–97% during the first year after SIAs. Successful imple-mentation of this strategy by other African countries shouldresult in achieving the goal of >50% reduction in measlesmortality by 2005.
Routine and Supplemental ImmunizationsIn 2001, before use of wide–age-range SIAs, routine measles
vaccination coverage was estimated to be 69% by the admin-istrative method* in Burkina Faso, 37% by survey† in Mali,and 33% by survey in Togo (WHO/United Nations Children’sFund [UNICEF], unpublished data, 2002). During Decem-ber 2001–January 2002, nationwide SIAs among children aged9 months–14 years were conducted to give a second opportu-nity for measles vaccination in these three countries.
ImpactA total of 12.7 million children were targeted in the three
countries. National SIA coverage was estimated to be 95%–99% by survey method and 99%–104% by administrativemethod (Table 1). The number of reported measles cases anddeaths has decreased 91% and 84%, respectively, comparedwith the annual averages for 1996–2001 (Table 1). The num-ber of deaths averted was estimated by applying the observedpercentage reduction in reported measles deaths in 2002, com-pared with the average annual number of deaths reportedduring 1996–2001, to the estimated number of measles deaths
* Calculated by dividing the number of doses of vaccine administered throughroutine health services by the birth cohort of the previous year.
† Using either the Expanded Programme on Immunization method with 30clusters of seven children per cluster or population-based probability surveysconducted by international organizations (e.g., MACRO International, Inc.and UNICEF).
References1. American College of Sports Medicine. Position stand: the recommended
quantity and quality of exercise for developing and maintaining cardio-respiratory and muscular fitness, and flexibility in healthy adults. MedSci Sports Exerc 1998;30:975–91.
2. Christmas C, Andersen RA. Exercise and older patients: guidelines forthe clinician. J Am Geriatr Soc 2000;48:318–24.
3. National Institute on Aging. Exercise: A Guide from the National Insti-tute on Aging. Bethesda, Maryland: U.S. Department of Health andHuman Services, National Institutes of Health, National Institutes onAging, 2001. Available at http://www.nia.nih.gov/exercisebook.
4. U.S. Department of Health and Human Services. Healthy People 2010,2nd ed. With Understanding and Improving Health and Objectives forImproving Health. 2 vols. Washington, DC: U.S. Government Print-ing Office, 2000.
5. U.S. Department of Health and Human Services. 2001 National HealthInterview Survey (NHIS): public use data release. Hyattsville, Mary-land: U.S. Department of Health and Human Services, 2003.
6. Galuska DA, Earle D, Fulton JE. The epidemiology of U.S. adults whoregularly engage in resistance training. Res Q Exerc Sport 2001;73:330–4.
7. Robert Wood Johnson Foundation. National blueprint: increasing physi-cal activity among adults age 50 and older. Princeton, New Jersey: TheRobert Wood Johnson Foundation, 2001.
8. Seguin R, Epping J, Bloch R, Buchner D, Nelson M. Growing stronger:strength training for older adults. Available at http://www.cdc.gov/nccdphp/dnpa/physical/growing_stronger/growing_stronger.pdf.
Measles Mortality Reduction —West Africa, 1996–2002
The World Health Organization (WHO) estimates that,during 2000, measles accounted for approximately 777,000deaths worldwide, of which 452,000 (58%) occurred inAfrica (1). In response, in 2000, WHO’s African Regional
BOX. Strength training recommendations for older adults
• Exercises should be performed >2 days per week.• Certain exercises can be performed either standing or
seated.• Use hand and ankle weights, or resistance bands, or no
weights at all.• If weights are used, start with 1–2 pounds and gradu-
ally increase the weight over time.• Perform exercises that involve the major muscle groups
(e.g., arms, shoulders, chest, abdomen, back, hips, andlegs) and exercises that enhance grip strength.
• Perform 8–15 repetitions of each exercise, then performa second set.
• Do not hold your breath during strength exercises.• Rest between sets.• Avoid locking joints in arms and legs.• Stretch after completing all exercises.• If at any time you feel pain, stop exercising.
Source: National Institute on Aging.

Vol. 53 / No. 2 MMWR 29
in 1998 (6) (Tables 1 and 2). WHO estimated the number ofmeasles deaths in 1998 (before SIAs) by using the size of thesurviving birth cohort, the reported vaccine coverage, vaccineefficacy, and a measles case-fatality ratio (CFR) of 6.0 (6).§
The estimated number of deaths averted in the three coun-tries during 2002 was 26,365 (Table 2).
SurveillanceIn 2002, surveillance for measles was enhanced by starting
measles case-based surveillance with laboratory confirmationand intensifying supervision of all districts by provincial sur-veillance supervisors. According to regional guidelines, anyclinician diagnosis of measles or illnesses consistent with thecase definition of rash, fever, and cough, coryza, or conjunc-tivitis should be reported as suspected measles. In addition,all patients in whom measles is suspected should have bloodcollected for serologic confirmation.
In 2002, in Burkina Faso, blood specimens were taken for1,060 (62%) of the 1,712 suspected cases. Of the 1,029 caseswith laboratory results, 709 (69%) were measles-IgM posi-tive. Of these, 255 (36%) cases were in persons aged >15 years.A total of 319 (45%) laboratory-confirmed cases occurred inthe target age group for the SIAs (i.e., ages 9 months–14 years).
In Mali, specimens were collected for 63 (12%) of 533 sus-pected measles cases; 22 (35%) tested measles-IgM positive.Laboratory-confirmed measles outbreaks were detected in onenorthern district among a nomadic population (n = 39) andin one district along the Guinea border (n = 36). During Janu-ary 2001–December 2002, in Togo, specimens were collectedfrom 250 (75%) of 333 suspected measles cases; 23 (9%) testedmeasles-IgM positive. Of these, 14 (61%) were in the north-eastern province of Savane, and 11 (78%) were in the Tonedistrict bordering Burkina Faso.Reported by: Ministries of Health, Burkina Faso, Mali, and Togo;Country Offices for Burkina Faso, Mali, and Togo, World HealthOrganization. Measles Programme, Regional Office for Africa, WorldHealth Organization, Harare, Zimbabwe. Global Immunization Div,National Immunization Program, CDC.
Editorial Note: The measles mortality reduction strategiesimplemented in Burkina Faso, Mali, and Togo reduced theannual numbers of measles cases and deaths by 91% and84%, respectively, during the first year after implementationof SIAs, compared with 6 years preceding SIAs. In 2002, anestimated 26,365 measles deaths were prevented. The Minis-tries of Health in Burkina Faso, Mali, and Togo were respon-sible for planning and conducting SIAs. Financial and technicalsupport for implementing this strategy is being provided by acoalition of partners (The Measles Initiative) led by the Ameri-can Red Cross; other partners include the United NationsFoundation, UNICEF, WHO, and CDC.
Although the reductions in cases and deaths in Burkina Fasowere substantial compared with levels during 1996–2001,widespread measles transmission continued after the campaign.Widespread transmission after successful wide–age-range SIAshas not been reported in 13 other African countries (5; WHO,unpublished data, 2003). An outbreak investigation is underway to determine why the decline in cases in Burkina Fasowas not as marked as in the other countries.
Remaining subjects of concern for the measles mortalityreduction program include 1) the duration of effect of thewide–age-range SIAs, 2) the appropriate interval between the
TABLE 2. Estimated number of measles deaths averted in thefirst year after SIAs*, by country — Burkina Faso, Mali, andTogo, 2002
Estimated % declineno. annual in reported Estimated no.measles measles measles deathsdeaths deaths averted in first
before SIAs (1996–2001 year after SIAsCountry (1998) versus 2002) (2002)
Burkina Faso 15,626 78 12,201Mali 11,014 79 8,746Togo 5,475 99 5,417
Total 32,115 — 26,365
*Supplemental immunization activities.
TABLE 1. Estimated percentage reduction in reported measles cases and deaths, by country — Burkina Faso, Mali, and Togo,1996–2001 and 2002
Average Average % decline % declineannual annual in reported in reported
reported no. reported no. Reported Reported cases deathsNo. children % SIA* cases during deaths during no. cases no. deaths (1996–2001 (1996–2001
Country targeted coverage 1996–2001 1996–2001 in 2002 in 2002 versus 2002) versus 2002)
Burkina Faso 5,152,000 97 9,972 219 1,712 48 83 78Mali 5,074,610 99 6,663 34 533 7 92 79Togo 2,425,946 95 12,395 95 333 1 97 99Total 12,652,556 — 29,030 348 2,578 56 91 84
*Supplemental immunization activity.
§ Measles cases (i.e., number of susceptible children) = (1 – [coverage X vaccineefficacy]) X number of surviving infants.

30 MMWR January 23, 2004
initial wide–age-range and subsequent SIAs, and 3) the bestmethods for increasing routine vaccination. On the basis ofexperience in the Americas and southern Africa, a 4-yearinterval between SIAs will maintain measles mortality at nearzero if the routine measles coverage remains at >80% and theSIAs achieve coverage of >90% (3–6). However, attaining rou-tine coverage of >80% will be challenging for these countries.From 1998–2000 to 2002, the reported routine coverage withthe third dose of combined diphtheria-pertussis-tetanus vac-cine (DPT3) increased in Mali, from 32%–53% to 74%; inBurkina Faso, from 34%–57% to 75%; and in Togo, from36%–50% to 59% (WHO, unpublished data, 2003). Thelow routine measles vaccination coverage in these countrieswill result in accumulation of susceptible children born sincethe 2001 SIAs. This might result in small- to moderate-sizedmeasles outbreaks before the scheduled follow-up SIAs plannedfor the fall of 2004.
The findings in this report are subject to at least two limita-tions. First, the decline in reported measles cases and deathsmight be underestimated; <50% of serologic specimens, com-pared with >70% in countries with widespread measles trans-mission, drawn from patients with measles-compatible illnessesafter SIAs in Mali and Togo were confirmed as measles on thebasis of positive-IgM results. These findings are consistent withthose observed in southern Africa after nationwide wide–age-range SIAs (5). Second, the estimated number of measles deathsbefore implementation of SIAs assumed no herd immunityand relied on available CFRs for measles (6). In the absenceof recent population-based studies, these CFR estimates mighthave changed as a result of improvements in case manage-ment and a shift in the age distribution of patients. During1989–1991, a population-based study in rural Ghana founda measles CFR of 15%, even in an area with vitamin A supple-mentation (7); this figure is substantially higher than the 6%CFR used to estimate the number of measles deaths averted.
During the next few years, improved surveillance for measleswill be important to determine the effectiveness of the measlesmortality reduction strategy. An increase in populationimmunity to measles decreases the positive predictive value ofthe clinical case definition (3,5), thereby necessitating labora-tory confirmation of suspected cases. The implementation ofcase-based surveillance with serologic confirmation ofsuspected cases will require capacity for specimen collection,transportation, testing, and reporting of results. Previous ex-perience with case-based surveillance, specimen collection, andtesting for acute flaccid paralysis cases will guide this process.References1. Stein C, Birmingham M, Kurian M, Duclos P, Strebel P. The global
burden of measles in the year 2000—a model using country-specificindicators. J Infect Dis 2000;187(suppl 1):S8–S14.
2. African Regional Office of the World Health Organization. Plan ofAction for Measles Mortality Reduction in the African Region, 2001–2005. Harare, Zimbabwe: African Regional Office of the World HealthOrganization, 2000.
3. de Quadros CA, Olive J-M, Hersh BS, et al. Measles elimination in theAmericas—evolving strategies. JAMA 1996;275:224–9.
4. Hersh BS, Tambini G, Nogueira AC, Carrasco P, de Quadros C. Reviewof regional measles surveillance data in the Americas, 1996–99. Lancet2000;355:1943–8.
5. Biellik R, Madema S, Taole A, et al. First five years of measles elimina-tion in Southern Africa: 1996–2000. Lancet 2002;359:1564–8.
6. Otten M, Okwo-Bele JM, Kezaala R, Biellik R, Eggers R, NshimirimanaD. Impact of alternative approaches to accelerated measles control:report on the experience in the African Region, 1996–2002. J InfectDis 2003;187(suppl 1):S36–S43.
7. Dollimore N, Cutts F, Binka FN, Ross DA, Morris SS, Smith PG.Measles incidence, case fatality, and delayed mortality in children withor without vitamin A supplementation in rural Ghana. Am J Epidemiol1997;146:646–54.
Measles Outbreak Associated withan Imported Case in an Infant —
Alabama, 2002Local transmission of measles is rare in the United States.
Since 1997, the majority of measles outbreaks have been causedby imported* cases (1). During October 19–November 15,2002, an outbreak of 13 confirmed† cases of measles occurred,with exposure in Alabama; 11 cases were among day careattendees who had not yet been vaccinated for measles. Thiswas the largest outbreak of measles in the United States since1999 (2). In response to this outbreak, the Alabama Depart-ment of Public Health (ADPH) and CDC conducted an epi-demiologic investigation that determined the outbreak wasinitiated by an imported case in an infant aged 9 months whohad returned recently from the Philippines. Health-care pro-viders should continue to include measles in differential diag-noses for febrile rash illnesses in infants, particularly thosewith recent travel to areas where measles is endemic.
On November 3, 2002, a consulting physician suspectedmeasles in three infants aged 10 months who had been hospi-talized with rash onsets during October 28–31; all threeinfants had attended the same day care center and shared thesame room. ADPH confirmed measles in these infants andidentified two additional cases in the infant aged 9 monthsand in another infant aged 10 months, both of whom also
* Acquired outside the United States, Guam, Puerto Rico, and the U.S. VirginIslands.
† Defined as illness consistent with the clinical case definition and confirmed bylaboratory test or linked epidemiologically to a confirmed case. A clinical casewas defined as illness characterized by generalized rash lasting >3 days; atemperature of >101° F (>38.3° C); and cough, coryza, or conjunctivitis.

Morbidity and Mortality Weekly Report
Recommendations and Reports
September 13, 2002 / Vol. 51 / No. RR-13
Centers for Disease Control and Prevention
Centers for Disease Control and Prevention
Centers for Disease Control and Prevention
Centers for Disease Control and Prevention
Centers for Disease Control and Prevention
SAFER • HEAL
SAFER • HEAL
SAFER • HEAL
SAFER • HEAL
SAFER • HEALTHIER • PEOPLE
THIER • PEOPLE
THIER • PEOPLE
THIER • PEOPLE
THIER • PEOPLE TM
Folic Acid and Prevention
of Spina Bifida and Anencephaly
10 Years After the U.S. Public Health
Service Recommendation
know what matters.
trust • wor • thy: adj 1 : worthy of belief
2 : capable of being depended upon;
see also MMWR.
('tr st-"w r-the)e e

32 MMWR January 23, 2004
shared the same day care center room. The infant aged 9months was hospitalized during October 19–23 and had aninitial diagnosis of dengue fever, later reclassified as a fever ofunknown origin. The infant had been administered immu-noglobulin before departure from the United States to thePhilippines. Measles eventually was confirmed in all fiveinfants by enzyme-linked immunosorbent assay testing.
Outbreak investigators identified and interviewed personswho had been in contact with infants confirmed with measlesduring the 4 days before and after rash onset. An additionaleight cases were identified among six infants and two adults(Figure). All 11 infants attended the same day care center andshared the same room (attack rate: 100%). Among the 11infants, the median age was 11 months (range: 10–13 months);seven (64%) were female. The two adults, a man aged 31 yearsand a woman aged 50 years, were exposed to the same infant.The man had visited the infant’s home before hospitalization,and the woman provided nursing care to the infant duringhospitalization.
All 13 patients had rash, fever, coryza, and cough; 12 (92%)had conjunctivitis, and four (31%) were hospitalized. Na-sopharyngeal and/or urine samples were collected from 10patients (both adults and eight infants); all were positive formeasles by viral culture or by polymerase chain reaction. Viralisolates were identified as the D3 measles genotype, known tobe circulating in the Philippines (3).
Among the 11 infants, none had been vaccinated with ameasles-containing vaccine (MCV). None of the infants’mothers reported ever having measles; however, all mothershad been vaccinated with >1 dose of MCV. Among the adults,the man had been vaccinated with 2 doses of MCV before hisexposure; the woman had never been vaccinated for measles,although she knew she had a negative titer.
ADPH conducted contact tracing and identified 679 per-sons with known contact with the patients; 616 (91%) wereexposed before ADPH was notified. ADPH determinedwhether exposed persons were ill, assessed vaccination status
and recommended measles vaccine, and instructed contactsto monitor for fever during the 18 days after exposure to apatient. If fever occurred during this period, ADPH instructedcontacts to isolate themselves and notify their doctors andlocal health departments. All contacts were considered sus-ceptible unless they had documentation of adequate vaccina-tion, physician-diagnosed measles, laboratory evidence ofimmunity to measles, or were born before 1957. Householdswere called every other day to ask about fever status.
ADPH alerted all physicians in the affected county and pro-vided free measles, mumps, and rubella (MMR) vaccine toattendees of the affected day care center and to the public.ADPH recommended that the day care center exclude infantswith febrile rash illness until measles was ruled out in a sus-pected infant. ADPH also recommended a first dose of MMRfor day care attendees aged 6–11 months, followed by theregular MMR 2-dose series starting at age 12–15 months (4).In addition, ADPH recommended a first dose of MMR fornonvaccinated infants aged 12–15 months and a second doseof MMR for infants aged >12 months who had a first dose atleast 4 weeks previously.Reported by: JP Lofgren, MD, V Cochran, O Abbott, C Woernle,MD, Alabama Dept of Public Health. JM Hayes, DrPH, Div of AppliedPublic Health Training, Epidemiology Program Office, CDC.
Editorial Note: The findings in this report illustrate the hightransmissibility of measles when the virus is introduced intosusceptible populations. The infant with imported measles andnine infant contacts who had measles were not in an age grouprecommended to receive an MCV. The Advisory Committeeon Immunization Practices (ACIP) recommends that childrenreceive their first MMR dose at age 12–15 months (4). Thefindings also highlight the need for health-care workers tofollow ACIP guidelines to receive 2 doses of MCV or haveproof of positive measles titer (5).
High immunity levels and effective control measures helpedlimit the spread of measles in this outbreak. Among Alabamachildren born during February 1998–May 2000, approxi-mately 94% had >1 dose of MCV (6). ADPH efforts to limitexposure (<10% of contacts occurred after instituting controlmeasures), to educate clinicians and the public about thisoutbreak, and to increase vaccination services in the affectedcounty also might have helped limit measles transmission. Toensure prompt measles diagnoses, physicians who care forchildren need to be familiar with the clinical signs of measles.
To protect infants against measles, physicians should con-sider administering MMR vaccine to children aged >6 monthswho will be traveling outside of the United States and admin-ister it >14 days before administering immunoglobulin.Measles should be included in differential diagnoses for
FIGURE. Number of reported measles cases, by date of rashonset — Alabama, October 19–November 15, 2002
0
1
2
3
4
5
Date
Num
ber
Infants (n = 11)
Adults (n = two)
19 21 23 25 27 29 31 2 4 6 8 10 12 14
Oct Nov
Public healthintervention
initiated

Vol. 53 / No. 2 MMWR 33
febrile rash illnesses in infants, particularly among those withrecent travel to endemic areas. Physicians should report measlescases promptly to their state or local health departments.
AcknowledgmentsGeorgia Div of Public Health. Div of Applied Public Health
Training, Epidemiology Program Office; Div of Viral and RickettsialDiseases, National Center for Infectious Diseases; Div ofEpidemiology and Surveillance, National Immunization Program,CDC.
References1. CDC. Epidemiology and Prevention of Vaccine-Preventable Diseases,
7th ed. Atlanta, Georgia: U.S. Department of Health and HumanServices, CDC, 2003:96–114.
2. CDC. Measles—United States, 1999. MMWR 2000;49:557–60.3. Rota PA, Liffick SL, Rota JS, et al. Molecular epidemiology of measles
viruses in the United States, 1997–2001. Emerg Infect Dis 2002;8:902–8.4. CDC. Measles, mumps, and rubella—vaccine use and strategies for elimi-
nation of measles, rubella, and congenital rubella syndrome and controlof mumps: recommendations of the Advisory Committee on Immuni-zation Practices (ACIP). MMWR 1998;47(No. RR-8).
5. CDC. Immunization of health-care workers: recommendations of theAdvisory Committee on Immunization Practices (ACIP) and the Hos-pital Infection Control Practices Advisory Committee (HICPAC).MMWR 1997;46(No. RR-18).
6. CDC. 2001 National Immunization Survey. Available at http://www.cdc.gov/nip/coverage/default.htm#NIS.
Human Death Associated with BatRabies — California, 2003
Rabies is a rapidly progressive, incurable viral encephalitisthat is, with rare exception, transmitted by the bite of aninfected mammal. On September 14, 2003, a previouslyhealthy man aged 66 years who resided in Trinity County,California, died from rabies approximately 6 weeks afterbeing bitten by a bat. This report summarizes the investiga-tion by the Trinity and Shasta County Health Departmentsand the California Department of Health Services (CDHS).Persons should avoid direct contact with bats; however, if suchcontact occurs, the exposed person should visit a health-careprovider immediately, and the exposure should be reported tolocal public health officials.
In September 2003, the patient was admitted to a hospitalemergency department (ED) for assessment of atypical chestpain. He had a 2-week history of mild, nonspecific complaints(e.g., drowsiness, chronic headache, and malaise), a 5-dayhistory of progressive right arm pain and paresthesias, and a1-day history of right-hand weakness. The arm pain wassevere enough to wake him from sleep and progressively wors-ened. He also described a sharp pain radiating bilaterally upthe right arm to his axilla and left chest. The pain was relieved
cdc.gov/mmwr
MMWR Continuing Education is
designed with your needs in
mind: timely public health and
clinical courses, online exams,
instant course certificates, and
economical tuition (it's free).
Visit MMWR Online to learn
more about our program's
features and available courses.
MMWR CE
It's ready when you are.
Chinese Proverb
a teacher appears." "When the mind is ready,
ContinuingEducation

34 MMWR January 23, 2004
by administering nitroglycerin in the ED. The patient reportedbeing bitten by a bat on the right index finger while in his bedapproximately 5 weeks before admission. He removed the batfrom his home, and it flew away. The patient washed thewound but did not seek rabies postexposure prophylaxis (PEP)at that time. Because the patient reported to the ED at anearly stage of rabies infection, with predominantly localsymptoms near the bite site, rabies vaccine, rabies immuneglobulin, ribavirin, and interferon-alpha were administeredon the day of admission; a second dose of rabies vaccine wasadministered 3 days later.
On admission, he was afebrile, alert, and oriented but haddecreased right upper extremity strength, decreased sensationto light touch, and slight impairment in his ability to concen-trate. His white blood cell (WBC) count was elevated at 13,900cells/µL (normal: 3,700–9,400 cells/µL). All other laboratoryvalues were within the normal range.
The patient had steady neurologic decline during the fol-lowing week with confusion and disorientation. He becamefebrile on the fourth hospital day and was intubated for air-way protection. Electromyography of his right and left upperextremities indicated distal demyelinating polyneuropathy. Bythe fifth hospital day, he had a right lung infiltrate, and hiselectroencephalogram showed diffuse slowing. Two days later,he died. Four family members and two of 40 health-care work-ers involved in the patient’s treatment received rabies PEP as aprecautionary measure. The patient’s wife received PEPbecause she had been asleep in the same bed as the patientwhen the bat bit him and possibly had been exposed to thesame bat.
Antemortem specimens were sent to the Viral and Rickett-sial Disease Laboratory (VRDL) at CDHS and to CDC forevaluation. The specimens included multiple saliva andserum samples, nuchal skin biopsy, urine, and spinal fluid.Postmortem corneal impressions also were obtained. A nested,reverse transcription polymerase chain reaction assay per-formed on saliva samples was positive for evidence of rabiesvirus nucleic acid. Sequence analysis demonstrated 100%homology with a rabies virus variant associated with the silver-haired bat (Lasionycteris noctivagans).Reported by: A Deckert, MD, Shasta County Public Health, Redding;C Glaser, MD, Viral and Rickettsial Disease Laboratory; B Sun, DVM,Div of Communicable Disease Control, California Dept of Health Svcs.Div of Viral and Rickettsial Diseases, National Center for InfectiousDiseases; L Demma, PhD, EIS Officer, CDC.
Editorial Note: Although human rabies is rare in the UnitedStates, clinicians and public health workers should suspectrabies when a history of possible bat contact is known or whenunexplained atypical progressive neuropathy or unusual
febrile encephalitis is observed. Persons coming in direct con-tact with bats should seek consultation with their health-careproviders immediately to receive PEP, if appropriate.
Rabies is an acute, progressive, and fatal disease. The onlydocumented survivors received rabies prophylaxis before theonset of illness. However, an aggressive approach to therapymight be attempted in patients who are in an early stage ofclinical disease (1). A combination of therapies is suggested,including rabies vaccine, rabies immune globulin, ribavirin,interferon-alpha, monoclonal antibodies, and ketamine. Thepatient described in this report visited the ED at an early stagewith a predominant symptom of paraesthesia at the bite site.He was treated within approximately 24 hours of admission,albeit unsuccessfully, with the first four of these agents.
This fatality follows two other recent bat-associated cases ofhuman rabies in California (in Glenn County in 2002 and inAmador County in 2000) (2,3). However, these cases wereassociated with a Mexican free-tailed bat (Tadarida brasiliensis)rabies virus variant, and neither patient identified a definitivebat exposure. During 1990–1998, of 22 bat-associated rabiesinfections, 16 (75%) were associated with the virus variantfound among silver-haired and eastern pipistrelle bats (4).Properties of these viruses might allow infection and replica-tion under broader conditions than those of other rabies virusvariants (5).
During 1990–2000, a total of 24 (75%) of 32 U.S. humanrabies cases were caused by bat-associated rabies virus vari-ants. In 22 (92%) of these cases, no documentation of a biteexisted; however, this does not mean that a typical biteexposure did not take place. Instead, such a history was notuncovered during presentation or case investigation.
Human rabies is preventable with the proper and timelyadministration of rabies PEP (6). However, if a patient doesnot recognize the risk associated with an animal bite, PEPprobably will not be obtained. When a bat is found in livingquarters and a strong possibility exists that an exposure mighthave occurred, the animal should be submitted to a local publichealth laboratory for diagnostic testing. However, if the ani-mal is not available for testing, PEP should be administeredwhen there is a strong probability of exposure.
No laboratory-confirmed cases of human-to-human trans-mission from patients to health-care workers or family mem-bers have been documented. Delivery of health care to a patientwith rabies is not an indication for PEP unless a bite hasoccurred or an exposure of mucous membranes or nonintactskin to potentially infectious body fluids has occurred (6).Adherence to standard safety precautions for health-care work-ers will minimize the risk for exposure.
Public health professionals need to reemphasize effectivemeasures to reduce animal exposure and to keep pet and live-

Vol. 53 / No. 2 MMWR 35
stock vaccinations current. Persons who are bitten by a poten-tially rabid animal should immediately 1) disinfect and washthe wound, 2) capture the animal safely, 3) contact the localhealth department, and 4) see a physician for evaluation aboutthe need for PEP.
AcknowledgmentsThis report is based on data contributed by E Osvold-
Doppelhauer, Trinity County Health Dept, Weaverville;C Lakmann, K Thomas, Shasta County Public Health; H Birk,MD, KK Shwe, MD, S Menezes, MD, M O’Brien, MD, L Dayton,MD, Mercy Medical Center, Redding; D Schnurr, PhD,S Honarmand, C Kohlmeier, Viral and Rickettsial DiseaseLaboratory, Div of Communicable Disease Control, California Deptof Health Svcs. L Orciari, MS, M Niezgoda, MS, Div of Viral andRickettsial Diseases, National Center for Infectious Diseases, CDC.
References1. Jackson AC, Warrell MJ, Rupprecht CE, et al. Management of rabies in
humans. Clin Infect Dis 2003;36:60–3.2. CDC. Human rabies—California, 2002. MMWR 2002;51:686–8.3. CDC. Human rabies—California, Georgia, Minnesota, New York,
and Wisconsin, 2000. MMWR 2000;49:1111–5.4. Krebs JW, Smith JS, Rupprecht CE, Childs JE. Mammalian reservoirs
and epidemiology of rabies diagnosed in human beings in the UnitedStates, 1981–1998. Ann NY Acad Sci 2000;916:345–53.
5. Morimoto K, Patel M, Corisdeo S, et al. Characterization of a uniquevirus variant of bat rabies virus responsible for newly emerging humancases in North America. Proc Natl Acad Sci U S A 1996;93:5653–8.
6. CDC. Human rabies prevention—United States, 1999: recommenda-tions of the Advisory Committee on Immunization Practices (ACIP).MMWR 1999;48(No. RR-1).
Update: Influenza Activity —United States, January 11–17, 2004The number of states reporting widespread influenza
activity* continued to decrease during the reporting week ofJanuary 11–17, 2004†. Health departments in five statesreported widespread influenza activity. A total of 31 states andNew York City reported regional activity, eight states reportedlocal activity, and sporadic activity was reported by six states,the District of Columbia, Guam, and Puerto Rico (Figure 1).The percentage of outpatient visits for influenza-like illness
FIGURE 1. States in which estimated influenza activity levelshave been reported by state epidemiologists, by level ofactivity* — United States, January 11–17, 2004
* Levels of activity are 1) no activity, 2) sporadic—small numbers oflaboratory-confirmed influenza cases or a single influenza outbreakreported but no increase in cases of influenza-like illness (ILI), 3) local—outbreaks of influenza or increases in ILI cases and recent laboratory-confirmed influenza in a single region of a state, 4) regional—outbreaksof influenza or increases in ILI cases and recent laboratory-confirmedinfluenza in at least two but less than half the regions of a state, and 5)widespread—outbreaks of influenza or increases in ILI cases and recentlaboratory-confirmed influenza in at least half the regions of a state.
Widespread LocalRegional Sporadic
§ Temperature of >100.0º F (>37.8º C) and cough and/or sore throat in theabsence of a known cause other than influenza.
¶ Calculated as the mean percentage of visits for ILI during noninfluenza weeks,plus two standard deviations. Wide variability in regional data precludescalculating region-specific baselines and makes it inappropriate to apply thenational baseline to regional data
* Levels of activity are 1) no activity, 2) sporadic—small numbers of laboratory-confirmed influenza cases or a single influenza outbreak reported but no increasein cases of influenza-like illness (ILI), 3) local—outbreaks of influenza orincreases in ILI cases and recent laboratory-confirmed influenza in a singleregion of a state, 4) regional—outbreaks of influenza or increases in ILI casesand recent laboratory-confirmed influenza in at least two but less than half theregions of a state, and 5) widespread—outbreaks of influenza or increases in ILIcases and recent laboratory-confirmed influenza in at least half the regions of astate.
† Provisional data reported as of January 14.
(ILI)§ continued to decrease in all surveillance regions duringthe week ending January 17. For the first time since thereporting week ending November 8, 2003, the national per-centage for ILI (2.0%) declined below the national baseline¶
of 2.5%. The percentage of specimens testing positive forinfluenza also decreased, but the percentage of deaths attrib-uted to pneumonia and influenza (P&I) was unchanged.
Laboratory SurveillanceDuring the week ending January 17, World Health
Organization (WHO) laboratories reported testing 1,544specimens for influenza viruses, of which 123 (8.0%) werepositive. Of these, 26 were influenza A (H3N2) viruses, 95were influenza A viruses that were not subtyped, and two wereinfluenza B viruses.
Since September 28, WHO and NREVSS laboratories havetested 76,311 specimens for influenza viruses, of which 19,968(26.2%) were positive. Of these, 19,853 (99.4%) were influ-enza A viruses, and 115 (0.6%) were influenza B viruses. Of

36 MMWR January 23, 2004
FIGURE 3. Percentage of visits for influenza-like illnessreported by Sentinel Provider Surveillance Network, by week —United States, 1999–00, 2002–03, and 2003–04 influenzaseasons
* The 1999–00 season was selected for comparison because it was themost recent influenza A (H3N2) season of moderate severity.
0
1
2
3
4
5
6
7
8
9
10
40 42 44 46 48 50 52 1 3 5 7 9 11 13 15 17 19
Week
Per
cent
age
2003–04
1999–00*
2002–03
National baseline
21
FIGURE 2. Percentage of deaths attributed to pneumonia andinfluenza (P&I) reported by 122 Cities Mortality ReportingSystem, by week and year — United States, 2000–2004
* The epidemic threshold is 1.645 standard deviations above the seasonalbaseline percentage.
† The seasonal baseline is projected by using a robust regression procedurethat applies a periodic regression model to the observed percentage ofdeaths from P&I during the preceding 5 years.
4
6
8
10
12
Week and year
Per
cent
age
10 20 30 40 50 10 20 30 40 50 10 20 30 40 50 10 20 30 40 50
2000 2001 2002 2003
Epidemic threshold*
Seasonal baseline†
the 19,853 influenza A viruses, 4,652 (23.4%) have beensubtyped; 4,651 (99.9%) were influenza A (H3N2) viruses,and one (0.1%) was an influenza A (H1) virus.
Antigenic CharacterizationOf the 573 influenza viruses collected by U.S. laboratories
since October 1, 2003, and characterized antigenically byCDC, 565 were influenza A (H3N2) viruses, two were influ-enza A (H1) viruses, and six were influenza B viruses. Thehemagglutinin proteins of the influenza A (H1) viruses weresimilar antigenically to the hemagglutinin of the vaccine strainA/New Caledonia/20/99. Of the 565 influenza A (H3N2)isolates that have been characterized, 106 (18.8%) were simi-lar antigenically to the vaccine strain A/Panama/2007/99(H3N2), and 459 (81.2%) were similar to a drift variant, A/Fujian/411/2002 (H3N2)**. Five influenza B viruses charac-terized were similar antigenically to B/Sichuan/379/99 andone was similar antigenically to B/Hong Kong/330/2001.
P&I Mortality SurveillanceDuring the week ending January 17, P&I accounted for
10.3% of all deaths reported through the 122 Cities Mortal-ity Reporting System. This percentage is again above theepidemic threshold†† of 8.1% (Figure 2).
ILI SurveillanceThe percentage of patient visits§§ to approximately 1,000
U.S. sentinel providers nationwide for ILI decreased to 2.0%for the week ending January 17, which is below the nationalbaseline of 2.5% (Figure 3). The percentage of patient visitsfor ILI continued to decrease in all nine surveillance regions¶¶,ranging from 2.5% in the Pacific region to 1.1% in the NewEngland and West North Central regions.** Although vaccine effectiveness against A/Fujian/411/2002-like viruses might
be less than that against A/Panama/2007/99-like viruses, the current U.S.vaccine probably will offer some cross-protective immunity against theA/Fujian/411/2002-like viruses and reduce the severity of disease.
†† The expected baseline proportion of P&I deaths reported by the 122 CitiesMortality Reporting System is projected by using a robust regression procedurethat applies a periodic regression model to the observed percentage of deathsfrom P&I during the preceding 5 years; the epidemic threshold is 1.645standard deviations above the seasonal baseline percentage.
§§ National and regional percentage of patient visits for ILI are weighted on thebasis of state population.
¶¶ New England=Connecticut, Maine, Massachusetts, New Hampshire, RhodeIsland, and Vermont; Mid-Atlantic=New Jersey, New York City, Pennsylvania,and Upstate New York; East North Central=Illinois, Indiana, Michigan, Ohio,and Wisconsin; West North Central=Iowa, Kansas, Minnesota, Missouri,Nebraska, North Dakota, and South Dakota; South Atlantic=Delaware, Districtof Columbia, Florida, Georgia, Maryland, North Carolina, South Carolina,Virginia, and West Virginia; East South Central=Alabama, Kentucky,Mississippi, and Tennessee; West South Central=Arkansas, Louisiana, Oklahoma,and Texas; Mountain=Arizona, Colorado, Idaho, Montana, Nevada, NewMexico, Utah, and Wyoming; and Pacific=Alaska, California, Hawaii, Oregon,and Washington.
Activity Reported by State and TerritorialEpidemiologists
During the week ending January 17, influenza activity wasreported as widespread in five states (Delaware, Minnesota,New York, Pennsylvania, and Vermont). Regional activity wasreported in 31 states (Colorado, Connecticut, Florida, Georgia,Hawaii, Idaho, Indiana, Iowa, Kentucky, Louisiana, Maine,Massachusetts, Michigan, Mississippi, Missouri, Montana,New Hampshire, New Jersey, North Carolina, North Dakota,Ohio, Oregon, Rhode Island, South Carolina, Tennessee,

Vol. 53 / No. 2 MMWR 37
TABLE. Number of influenza-associated deaths reportedamong children aged <18 years, by state — United States,2003–04 influenza season*State No. deaths
Alabama 2Alaska 1Arkansas 1Arizona 4California 7Colorado 12Connecticut 1Florida 4Georgia 5Illinois 3Indiana 1Iowa 4Kansas 1Louisiana 2Maryland 3Michigan 1Missouri 4Montana 1New Jersey 1New Mexico 3New York 7North Carolina 9Ohio 5Oklahoma 4Oregon 1South Carolina 4South Dakota 1Tennessee 1Texas 12Utah 1Vermont 1Wisconsin 3Wyoming 1Total 111
* As of January 20, 2004.
infection detected by rapid-antigen testing or other labora-tory tests. Among reported deaths, 56 (50.5%) were male.The median age was 4 years (range: 1 month–17 years).Of the 64 children aged <5 years, 38 were aged 6 months–23months. Twenty-one children had high-risk medical condi-tions that put them at increased risk for complications frominfluenza. Of the children whose influenza vaccination statuswas reported, three were vaccinated according to recommen-dations (1), and 49 were not vaccinated.Reference1. CDC. Prevention and control of influenza: recommendations of the
Advisory Committee on Immunization Practices (ACIP). MMWR2003;52(No. RR-8).
Notice to Readers
Updated Guidelines for the Useof Rifamycins for the Treatment
of Tuberculosis Among HIV-InfectedPatients Taking Protease Inhibitors
or Nonnucleoside Reverse TranscriptaseInhibitors
Guidelines for managing the pharmacologic interactions thatcan result when patients receive protease inhibitors (PIs) andnonnucleoside reverse transcriptase inhibitors (NNRTIs) fortreatment of human immunodeficiency virus (HIV) infectiontogether with rifamycins for the treatment of tuberculosis havebeen published previously (1,2). New guidelines regardinginteractions among these agents, with recommendations fortheir use from CDC and partners, are available at http://www.cdc.gov/nchstp/tb/tb_hiv_drugs/toc.htm. Informationincludes initial recommendations for the new PIs lopinavir/ritonavir, atazanavir, and fosamprenavir, and updated recom-mendations for other dual PI regimens and NNRTIs. Thenew recommendations expand the use of rifampin with theseantiretroviral drugs, which is critical in regions where rifabutinis unavailable. Periodic updates will be posted to the websiteto provide clinicians with the latest information.References1. CDC. Prevention and treatment of tuberculosis among patients infected
with human immunodeficiency virus: principles of therapy and revisedrecommendations. MMWR 1998;47(No. RR-20).
2. CDC. Updated guidelines for the use of rifabutin or rifampin for thetreatment and prevention of tuberculosis among HIV-infected patientstaking protease inhibitors or nonnucleoside reverse transcriptase inhibi-tors. MMWR 2000;49:185–9.
Texas, Utah, Virginia, West Virginia, Wisconsin, andWyoming) and New York City. Local activity was reported ineight states (Alaska, Arizona, California, Illinois, Kansas, Mary-land, Nebraska, and Washington). Sporadic activity wasreported in six states (Alabama, Arkansas, Nevada, NewMexico, Oklahoma, and South Dakota), the District ofColumbia, Guam, and Puerto Rico.
Weekly updates on influenza activity will be published inMMWR during the influenza season. Additional informationabout influenza activity is available from CDC at http://www.cdc.gov/flu.
Influenza-Associated Deaths in ChildrenAged <18 Years
As of January 20, 2004, CDC had received reports of 111influenza-associated deaths in U.S. residents aged <18 years.This update is based on preliminary data reported from 33states (Table). All patients had evidence of influenza virus

38 MMWR January 23, 2004
Online
know what matters.
e ncore.Week after week, MMWR Online plays an important role in helping
you stay informed. From the latest CDC guidance to breaking
health news, count on MMWR Online to deliver the news you
need, when you need it.
Log on to cdc.gov/mmwr and enjoy MMWR performance.

Vol. 53 / No. 2 MMWR 39
-: No reported cases.* Incidence data for reporting years 2003 and 2004 are provisional and cumulative (year-to-date).†
Not notifiable in all states.§
Updated monthly from reports to the Division of HIV/AIDS Prevention — Surveillance and Epidemiology, National Center for HIV, STD, and TB Prevention.Last update November 30, 2003.
¶Of two cases reported, one was indigenous, and one was imported from another country.
** Updated weekly from reports to the Division of Viral and Rickettsial Diseases, National Center for Infectious Diseases (notifiable as of July 2003).††
Not previously notifiable.
TABLE I. Summary of provisional cases of selected notifiable diseases, United States, cumulative, week ending January 17, 2004 (2nd Week)*
Cum. Cum. Cum. Cum.2004 2003 2004 2003
Anthrax - - Hemolytic uremic syndrome, postdiarrheal† - 1Botulism: - - HIV infection, pediatric†§ - 22
foodborne - 1 Measles, total 2¶ -infant - 2 Mumps 6 2other (wound & unspecified 1 - Plague - -
Brucellosis† - 3 Poliomyelitis, paralytic - -Chancroid 1 1 Psittacosis† - 1Cholera - - Q fever† - 1Cyclosporiasis† - - Rabies, human - -Diphtheria - - Rubella - -Ehrlichiosis: - - Rubella, congenital syndrome - -
human granulocytic (HGE)† 2 1 SARS-associated coronavirus disease† ** - -human monocytic (HME)† - - Smallpox† †† - NAhuman, other and unspecified - - Staphylococcus aureus: - -
Encephalitis/Meningitis: - - Vancomycin-intermediate (VISA)† †† - NACalifornia serogroup viral† - - Vancomycin-resistant (VRSA)† †† - NAeastern equine† - - Streptococcal toxic-shock syndrome† 4 6Powassan† - - Tetanus - 1St. Louis† - - Toxic-shock syndrome 4 1western equine† - - Trichinosis - -
Hansen disease (leprosy)† 3 - Tularemia† - -Hantavirus pulmonary syndrome† - 1 Yellow fever - -
* Ratio of current 4-week total to mean of 15 4-week totals (from previous, comparable, and subsequent 4-week periods for the past 5 years). The point where the hatched areabegins is based on the mean and two standard deviations of these 4-week totals.
FIGURE I. Selected notifiable disease reports, United States, comparison of provisional 4-week totals January 17, 2004, with historicaldata
DISEASE
4210.50.25
Ratio (Log Scale)*Beyond Historical Limits
DECREASE INCREASECASES CURRENT
4 WEEKS
227
210
30
63
2
93
8
297
1
Hepatitis A, acute
Hepatitis B, acute
Hepatitis C, acute
Legionellosis
Measles, Total
Mumps
Pertussis
Rubella
Meningococcal disease

40 MMWR January 23, 2004
N: Not notifiable. U: Unavailable. -: No reported cases. C.N.M.I.: Commonwealth of Northern Mariana Islands.* Incidence data for reporting years 2003 and 2004 are provisional and cumulative (year-to-date).† Chlamydia refers to genital infections caused by C. trachomatis.§ Updated monthly from reports to the Division of HIV/AIDS Prevention — Surveillance and Epidemiology, National Center for HIV, STD, and TB Prevention. Last update
November 30, 2003.¶ Contains data reported through National Electronic Disease Surveillance System (NEDSS).
TABLE II. Provisional cases of selected notifiable diseases, United States, weeks ending January 17, 2004, and January 11, 2003(2nd Week)*
Encephalitis/MeningitisAIDS Chlamydia† Coccidiodomycosis Cryptosporidiosis West Nile
Cum. Cum. Cum. Cum. Cum. Cum. Cum. Cum. Cum. Cum.Reporting area 2004§ 2003 2004 2003 2004 2003 2004 2003 2004 2003
UNITED STATES - 3,016 16,669 23,949 48 84 57 41 - -
NEW ENGLAND - 64 739 944 - - 2 5 - -Maine - - - 52 N N - - - -N.H. - 1 - 50 - - - - - -Vt. - - 28 18 - - 2 1 - -Mass. - 1 505 292 - - - 4 - -R.I. - 5 206 105 - - - - - -Conn. - 57 - 427 N N - - - -
MID. ATLANTIC - 905 2,589 2,943 - - 7 8 - -Upstate N.Y. - 51 254 122 N N 5 - - -N.Y. City - 430 1,010 906 - - 1 6 - -N.J. - 72 585 606 - - - - - -Pa. - 352 740 1,309 N N 1 2 - -
E.N. CENTRAL - 278 2,477 5,229 - 1 4 10 - -Ohio - 61 161 1,527 - - 2 - - -Ind. - 42 505 635 N N - - - -Ill. - 81 623 1,844 - - - 1 - -Mich. - 89 1,149 599 - 1 2 2 - -Wis. - 5 39 624 - - - 7 - -
W.N. CENTRAL - 36 562 1,530 - - 6 4 - -Minn. - - - 390 N N - 1 - -Iowa - 13 - 64 N N 1 1 - -Mo. - 22 171 523 - - - 1 - -N. Dak. - - 7 9 N N - - - -S. Dak. - 1 24 67 - - 2 1 - -Nebr.¶ - - - 118 - - - - - -Kans. - - 360 359 N N 3 - - -
S. ATLANTIC - 643 3,530 3,734 - - 22 9 - -Del. - - 104 111 N N - - - -Md. - 12 663 461 - - 1 1 - -D.C. - 157 99 141 - - - - - -Va. - 137 992 434 - - - - - -W. Va. - - 97 87 N N - - - -N.C. - 3 529 808 N N 7 - - -S.C.¶ - 35 357 387 - - - - - -Ga. - 155 10 355 - - 6 7 - -Fla. - 144 679 950 N N 8 1 - -
E.S. CENTRAL - 17 1,317 1,680 N N 2 2 - -Ky. - 5 267 234 N N - - - -Tenn. - - 396 423 N N 2 2 - -Ala. - 12 460 416 - - - - - -Miss. - - 194 607 N N - - - -
W.S. CENTRAL - 572 2,566 3,135 - - 1 - - -Ark. - - 267 185 - - 1 - - -La. - - 931 147 N N - - - -Okla. - 1 232 300 N N - - - -Tex. - 571 1,136 2,503 - - - - - -
MOUNTAIN - 120 512 1,673 - 83 1 3 - -Mont. - 6 - 76 N N - - - -Idaho - - 97 102 N N - 2 - -Wyo. - 1 35 31 - - 1 - - -Colo. - 22 35 433 N N - 1 - -N. Mex. - - 20 203 - - - - - -Ariz. - 78 312 590 - 82 - - - -Utah - 6 13 37 - - - - - -Nev. - 7 - 201 - 1 - - - -
PACIFIC - 381 2,377 3,081 48 - 12 - - -Wash. - 31 469 391 N N - - - -Oreg. - 35 - 210 - - 1 - - -Calif. - 312 1,806 2,235 48 - 11 - - -Alaska - 3 91 49 - - - - - -Hawaii - - 11 196 - - - - - -
Guam - - - - - - - - - -P.R. - - 50 19 N N N N - -V.I. - - - 13 - - - - - -Amer. Samoa U U U U U U U U U UC.N.M.I. - U - U - U - U - U

Vol. 53 / No. 2 MMWR 41
N: Not notifiable. U: Unavailable. - : No reported cases.* Incidence data for reporting years 2003 and 2004 are provisional and cumulative (year-to-date).
TABLE II. (Continued) Provisional cases of selected notifiable diseases, United States, weeks ending January 17, 2004, and January 11, 2003(2nd Week)*
Escherichia coli, Enterohemorrhagic (EHEC)Shiga toxin positive, Shiga toxin positive,
O157:H7 serogroup non-O157 not serogrouped Giardiasis GonorrheaCum. Cum. Cum. Cum. Cum. Cum. Cum. Cum. Cum. Cum.
Reporting area 2004 2003 2004 2003 2004 2003 2004 2003 2004 2003
UNITED STATES 17 28 - 5 1 1 267 464 6,393 10,397
NEW ENGLAND - 3 - - - - 18 31 179 292Maine - - - - - - - 3 - 3N.H. - - - - - - - - - 6Vt. - - - - - - 2 5 - 1Mass. - 3 - - - - 16 23 135 76R.I. - - - - - - - - 44 36Conn. - - - - - - - - - 170
MID. ATLANTIC 1 6 - - - 1 46 83 868 1,351Upstate N.Y. - - - - - - 11 3 88 73N.Y. City - - - - - - 4 38 368 385N.J. - 2 - - - - 6 15 187 383Pa. 1 4 - - - 1 25 27 225 510
E.N. CENTRAL 5 13 - - 1 - 38 80 915 2,568Ohio 2 4 - - 1 - 21 42 86 871Ind. - - - - - - - - 200 256Ill. - - - - - - 1 10 227 945Mich. 3 4 - - - - 16 16 387 265Wis. - 5 - - - - - 12 15 231
W.N. CENTRAL 1 3 - - - - 14 43 234 575Minn. - - - - - - 2 - - 133Iowa - - - - - - 8 10 - 9Mo. - 2 - - - - - 26 96 289N. Dak. - - - - - - - - - 1S. Dak. - - - - - - 1 - 5 1Nebr. - 1 - - - - - 3 - 27Kans. 1 - - - - - 3 4 133 115
S. ATLANTIC 2 - - 3 - - 76 120 1,687 2,073Del. - - N N N N - 2 46 53Md. - - - - - - 4 6 350 321D.C. - - - - - - - - 80 92Va. - - - - - - - - 374 219W. Va. - - - - - - - - 39 31N.C. - - - 2 - - N N 284 404S.C. - - - - - - - - 171 265Ga. - - - - - - 34 89 11 164Fla. 2 - - 1 - - 38 23 332 524
E.S. CENTRAL - - - - - - 2 10 701 976Ky. - - - - - - N N 121 122Tenn. - - - - - - 2 6 203 249Ala. - - - - - - - 4 281 293Miss. - - - - - - - - 96 312
W.S. CENTRAL - 1 - 1 - - 3 - 1,081 1,425Ark. - - - - - - 3 - 116 132La. - - - - - - - - 475 159Okla. - - - - - - - - 105 127Tex. - 1 - 1 - - - - 385 1,007
MOUNTAIN 2 2 - 1 - - 11 30 144 432Mont. - - - - - - 1 1 - 6Idaho 1 - - - - - 5 4 3 6Wyo. - - - - - - - 2 2 2Colo. - 1 - - - - - 13 35 135N. Mex. - - - 1 - - - 1 4 51Ariz. - 1 N N N N - 5 94 175Utah 1 - - - - - 5 1 6 4Nev. - - - - - - - 3 - 53
PACIFIC 6 - - - - - 59 67 584 705Wash. - - - - - - - - 73 74Oreg. 1 - - - - - 12 9 - 20Calif. 5 - - - - - 46 54 497 565Alaska - - - - - - 1 3 13 9Hawaii - - - - - - - 1 1 37
Guam N N - - - - - - - -P.R. - - - - - - - 1 2 1V.I. - - - - - - - - - 4Amer. Samoa U U U U U U U U U UC.N.M.I. - U - U - U - U - U

42 MMWR January 23, 2004
N: Not notifiable. U: Unavailable. -: No reported cases.* Incidence data for reporting years 2003 and 2004 are provisional and cumulative (year-to-date).
TABLE II. (Continued) Provisional cases of selected notifiable diseases, United States, weeks ending January 17, 2004, and January 11, 2003(2nd Week)*
Haemophilus influenzae, invasive Hepatitis
All ages Age <5 years (viral, acute), by type
All serotypes Serotype b Non-serotype b Unknown serotype ACum. Cum. Cum. Cum. Cum. Cum. Cum. Cum. Cum. Cum.
Reporting area 2004 2003 2004 2003 2004 2003 2004 2003 2004 2003
UNITED STATES 38 34 - 1 - - 4 4 123 147
NEW ENGLAND 1 3 - - - - - - 14 3Maine - - - - - - - - - -N.H. - - - - - - - - - -Vt. 1 - - - - - - - - -Mass. - 1 - - - - - - 13 3R.I. - - - - - - - - - -Conn. - 2 - - - - - - 1 -
MID. ATLANTIC 15 9 - - - - 1 1 19 32Upstate N.Y. 3 - - - - - - - 1 -N.Y. City 2 4 - - - - 1 1 1 22N.J. - 2 - - - - - - 3 4Pa. 10 3 - - - - - - 14 6
E.N. CENTRAL 5 4 - - - - 2 1 9 21Ohio 3 1 - - - - 1 1 1 4Ind. - - - - - - - - - -Ill. - 2 - - - - - - 3 4Mich. 2 - - - - - 1 - 5 10Wis. - 1 - - - - - - - 3
W.N. CENTRAL - 1 - - - - - - 4 3Minn. - - - - - - - - - -Iowa - - - - - - - - 2 2Mo. - 1 - - - - - - - 1N. Dak. - - - - - - - - - -S. Dak. - - - - - - - - - -Nebr. - - - - - - - - - -Kans. - - - - - - - - 2 -
S. ATLANTIC 14 6 - - - - 1 - 39 63Del. - - - - - - - - - 1Md. 4 4 - - - - - - 5 8D.C. - - - - - - - - - -Va. - - - - - - - - - -W. Va. - - - - - - - - - -N.C. - - - - - - - - - -S.C. - - - - - - - - - -Ga. 6 2 - - - - 1 - 21 34Fla. 4 - - - - - - - 13 20
E.S. CENTRAL 1 3 - - - - - 1 - 3Ky. - - - - - - - - - -Tenn. 1 1 - - - - - - - -Ala. - 2 - - - - - 1 - 2Miss. - - - - - - - - - 1
W.S. CENTRAL 1 1 - - - - - - 1 13Ark. - - - - - - - - - -La. - 1 - - - - - - - 1Okla. 1 - - - - - - - - -Tex. - - - - - - - - 1 12
MOUNTAIN - 6 - - - - - 1 1 7Mont. - - - - - - - - - -Idaho - - - - - - - - - -Wyo. - - - - - - - - 1 -Colo. - 2 - - - - - - - 1N. Mex. - - - - - - - - - -Ariz. - 3 - - - - - - - 4Utah - 1 - - - - - 1 - -Nev. - - - - - - - - - 2
PACIFIC 1 1 - 1 - - - - 36 2Wash. - - - - - - - - - -Oreg. 1 - - - - - - - 1 2Calif. - 1 - 1 - - - - 35 -Alaska - - - - - - - - - -Hawaii - - - - - - - - - -
Guam - - - - - - - - - -P.R. - - - - - - - - - -V.I. - - - - - - - - - -Amer. Samoa U U U U U U U U U UC.N.M.I. - U - U - U - U - U

Vol. 53 / No. 2 MMWR 43
N: Not notifiable. U: Unavailable. -: No reported cases.* Incidence data for reporting years 2003 and 2004 are provisional and cumulative (year-to-date).
TABLE II. (Continued) Provisional cases of selected notifiable diseases, United States, weeks ending January 17, 2004, and January 11, 2003(2nd Week)*
Hepatitis (viral, acute), by typeB C Legionellosis Listeriosis Lyme disease
Cum. Cum. Cum. Cum. Cum. Cum. Cum. Cum. Cum. Cum.Reporting area 2004 2003 2004 2003 2004 2003 2004 2003 2004 2003UNITED STATES 90 192 15 85 32 33 12 12 143 191
NEW ENGLAND 2 16 - - - 3 - 1 1 9Maine - - - - - - - - - -N.H. - - - - - - - - - -Vt. - 1 - - - - - - - 1Mass. 2 10 - - - 2 - 1 1 8R.I. - - - - - - - - - -Conn. - 5 U U - 1 - - - -
MID. ATLANTIC 5 23 3 3 7 6 2 5 122 148Upstate N.Y. 1 - 1 - 1 1 - - 58 -N.Y. City - 7 - - - 1 - 2 - -N.J. 3 10 - - 1 - 1 - 9 55Pa. 1 6 2 3 5 4 1 3 55 93
E.N. CENTRAL 3 22 3 6 10 11 1 1 - 4Ohio 1 9 - - 5 7 1 1 - -Ind. - - - - - - - - - -Ill. - - - 2 - - - - - -Mich. 2 7 3 4 5 4 - - - -Wis. - 6 - - - - - - U 4
W.N. CENTRAL - 11 - 6 1 1 - 1 2 1Minn. - - - - - - - - - -Iowa - - - - - - - - - -Mo. - 10 - 6 - - - - - 1N. Dak. - - - - - - - - - -S. Dak. - - - - 1 - - - - -Nebr. - 1 - - - - - 1 - -Kans. - - - - - 1 - - 2 -
S. ATLANTIC 62 85 7 3 10 5 5 1 14 21Del. - - - - - - N N - 5Md. 5 3 1 1 1 3 2 - 11 12D.C. - - - - - - - - - -Va. - - - - - - - - - -W. Va. - - - - - - - - - -N.C. - 1 - 1 3 1 1 1 - 3S.C. - - - - - - - - - -Ga. 33 72 2 1 - 1 1 - - -Fla. 24 9 4 - 6 - 1 - 3 1
E.S. CENTRAL - 10 - 5 - 1 1 2 - 3Ky. - 1 - - - - 1 - - -Tenn. - 2 - 2 - 1 - - - -Ala. - 2 - - - - - 2 - -Miss. - 5 - 3 - - - - - 3
W.S. CENTRAL - 4 - 58 - 6 - 1 - 4Ark. - - - - - - - - - -La. - 2 - 2 - - - - - -Okla. - - - - - - - - - -Tex. - 2 - 56 - 6 - 1 - 4
MOUNTAIN 2 14 - 2 1 - - - - 1Mont. - 1 - - - - - - - -Idaho 1 - - - - - - - - -Wyo. 1 1 - - 1 - - - - -Colo. - 1 - 2 - - - - - -N. Mex. - 1 - - - - - - - -Ariz. - 7 - - - - - - - -Utah - - - - - - - - - -Nev. - 3 - - - - - - - 1
PACIFIC 16 7 2 2 3 - 3 - 4 -Wash. - - - - - - - - - -Oreg. 2 6 1 1 N N - - - -Calif. 14 - 1 - 3 - 3 - 4 -Alaska - - - - - - - - - -Hawaii - 1 - 1 - - - - N N
Guam - - - - - - - - - -P.R. - 2 - - - - - - N NV.I. - - - - - - - - - -Amer. Samoa U U U U U U U U U UC.N.M.I. - U - U - U - U - U

44 MMWR January 23, 2004
N: Not notifiable. U: Unavailable. - : No reported cases.* Incidence data for reporting years 2003 and 2004 are provisional and cumulative (year-to-date).
TABLE II. (Continued) Provisional cases of selected notifiable diseases, United States, weeks ending January 17, 2004, and January 11, 2003(2nd Week)*
Meningococcal Rocky MountainMalaria disease Pertussis Rabies, animal spotted fever
Cum. Cum. Cum. Cum. Cum. Cum. Cum. Cum. Cum. Cum.Reporting area 2004 2003 2004 2003 2004 2003 2004 2003 2004 2003
UNITED STATES 18 20 69 40 70 188 86 100 6 5
NEW ENGLAND 1 2 1 3 6 41 4 12 - -Maine - 1 - - - - - - - -N.H. - - - - - - - - - -Vt. - - - - - 11 - 2 - -Mass. 1 1 1 2 6 29 4 5 - -R.I. - - - - - - - - - -Conn. - - - 1 - 1 - 5 - -
MID. ATLANTIC 1 4 8 7 25 14 13 24 1 -Upstate N.Y. - - 4 1 14 2 13 8 - -N.Y. City - 3 1 2 - - - 1 - -N.J. - 1 - 1 - 4 - 6 - -Pa. 1 - 3 3 11 8 - 9 1 -
E.N. CENTRAL - 4 11 6 9 17 - - - -Ohio - 1 6 3 5 9 - - - -Ind. - - - 1 - - - - - -Ill. - 1 - - - - - - - -Mich. - 1 5 1 4 2 - - - -Wis. - 1 - 1 - 6 - - - -
W.N. CENTRAL - 1 3 6 7 9 4 17 - -Minn. - - - 1 - - - 1 - -Iowa - 1 1 2 4 - 2 - - -Mo. - - - 3 - 6 - - - -N. Dak. - - - - - - - - - -S. Dak. - - 1 - - - - 2 - -Nebr. - - - - - - - 2 - -Kans. - - 1 - 3 3 2 12 - -
S. ATLANTIC 13 3 14 3 5 22 58 39 4 5Del. - - - - - - - - - -Md. 5 2 2 2 3 3 11 11 3 2D.C. - - - - - - - - - -Va. - - - - 2 - - 8 - -W. Va. - - - - - - 3 1 - -N.C. - - - 1 - 6 14 16 - 3S.C. - - - - - - - 2 - -Ga. 1 1 3 - - 13 30 - 1 -Fla. 7 - 9 - - - - 1 - -
E.S. CENTRAL - - 2 3 2 3 2 3 1 -Ky. - - - - - 1 1 1 - -Tenn. - - 2 1 2 - 1 1 1 -Ala. - - - 2 - 2 - 1 - -Miss. - - - - - - - - - -
W.S. CENTRAL - 3 2 8 - - 2 1 - -Ark. - - - - - - - - - -La. - - - 3 - - - - - -Okla. - - - - - - 2 1 - -Tex. - 3 2 5 - - - - - -
MOUNTAIN - - 2 2 4 26 2 4 - -Mont. - - - - - - - 1 - -Idaho - - 1 - 2 - - - - -Wyo. - - 1 - 1 - - - - -Colo. - - - - - 10 - - - -N. Mex. - - - 1 - 3 - - - -Ariz. - - - 1 - 11 2 3 - -Utah - - - - 1 - - - - -Nev. - - - - - 2 - - - -
PACIFIC 3 3 26 2 12 56 1 - - -Wash. - - - - - - - - - -Oreg. - 3 6 2 12 5 - - - -Calif. 3 - 20 - - 51 1 - - -Alaska - - - - - - - - - -Hawaii - - - - - - - - - -
Guam - - - - - - - - - -P.R. - - - - - - 1 1 N NV.I. - - - - - - - - - -Amer. Samoa U U U U U U U U U UC.N.M.I. - U - U - U - U - U
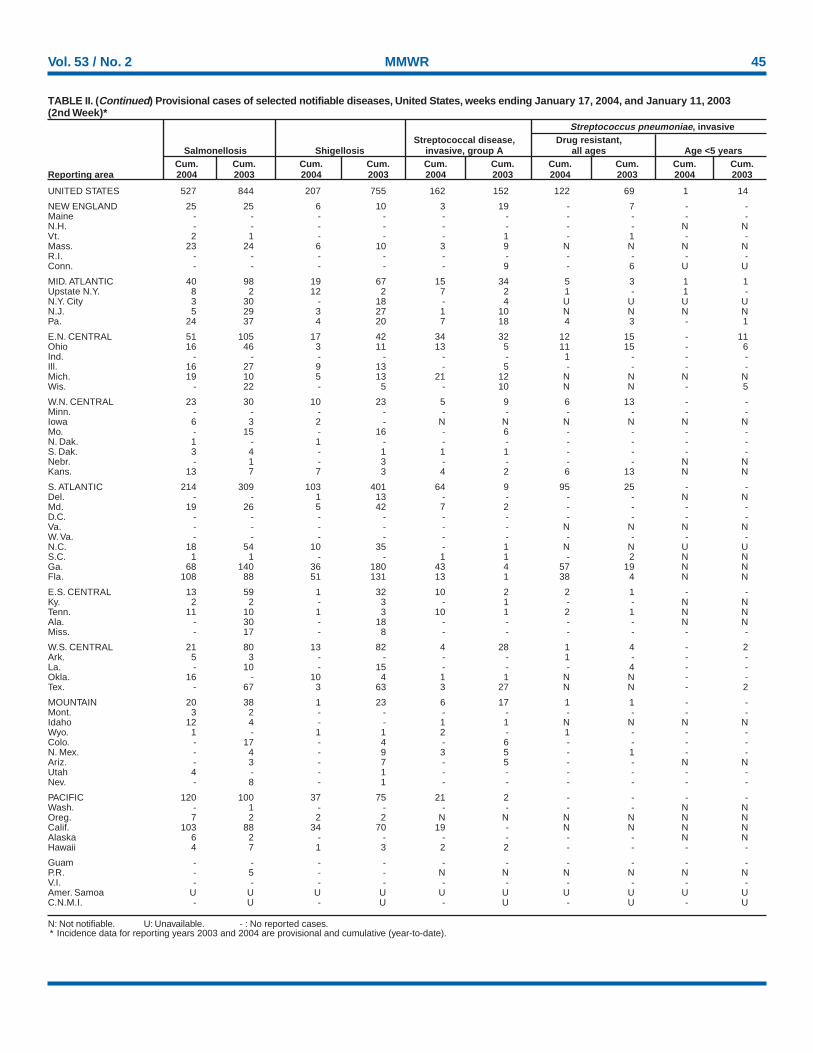
Vol. 53 / No. 2 MMWR 45
N: Not notifiable. U: Unavailable. - : No reported cases.* Incidence data for reporting years 2003 and 2004 are provisional and cumulative (year-to-date).
TABLE II. (Continued) Provisional cases of selected notifiable diseases, United States, weeks ending January 17, 2004, and January 11, 2003(2nd Week)*
Streptococcus pneumoniae, invasiveStreptococcal disease, Drug resistant,
Salmonellosis Shigellosis invasive, group A all ages Age <5 yearsCum. Cum. Cum. Cum. Cum. Cum. Cum. Cum. Cum. Cum.
Reporting area 2004 2003 2004 2003 2004 2003 2004 2003 2004 2003
UNITED STATES 527 844 207 755 162 152 122 69 1 14
NEW ENGLAND 25 25 6 10 3 19 - 7 - -Maine - - - - - - - - - -N.H. - - - - - - - - N NVt. 2 1 - - - 1 - 1 - -Mass. 23 24 6 10 3 9 N N N NR.I. - - - - - - - - - -Conn. - - - - - 9 - 6 U U
MID. ATLANTIC 40 98 19 67 15 34 5 3 1 1Upstate N.Y. 8 2 12 2 7 2 1 - 1 -N.Y. City 3 30 - 18 - 4 U U U UN.J. 5 29 3 27 1 10 N N N NPa. 24 37 4 20 7 18 4 3 - 1
E.N. CENTRAL 51 105 17 42 34 32 12 15 - 11Ohio 16 46 3 11 13 5 11 15 - 6Ind. - - - - - - 1 - - -Ill. 16 27 9 13 - 5 - - - -Mich. 19 10 5 13 21 12 N N N NWis. - 22 - 5 - 10 N N - 5
W.N. CENTRAL 23 30 10 23 5 9 6 13 - -Minn. - - - - - - - - - -Iowa 6 3 2 - N N N N N NMo. - 15 - 16 - 6 - - - -N. Dak. 1 - 1 - - - - - - -S. Dak. 3 4 - 1 1 1 - - - -Nebr. - 1 - 3 - - - - N NKans. 13 7 7 3 4 2 6 13 N N
S. ATLANTIC 214 309 103 401 64 9 95 25 - -Del. - - 1 13 - - - - N NMd. 19 26 5 42 7 2 - - - -D.C. - - - - - - - - - -Va. - - - - - - N N N NW. Va. - - - - - - - - - -N.C. 18 54 10 35 - 1 N N U US.C. 1 1 - - 1 1 - 2 N NGa. 68 140 36 180 43 4 57 19 N NFla. 108 88 51 131 13 1 38 4 N N
E.S. CENTRAL 13 59 1 32 10 2 2 1 - -Ky. 2 2 - 3 - 1 - - N NTenn. 11 10 1 3 10 1 2 1 N NAla. - 30 - 18 - - - - N NMiss. - 17 - 8 - - - - - -
W.S. CENTRAL 21 80 13 82 4 28 1 4 - 2Ark. 5 3 - - - - 1 - - -La. - 10 - 15 - - - 4 - -Okla. 16 - 10 4 1 1 N N - -Tex. - 67 3 63 3 27 N N - 2
MOUNTAIN 20 38 1 23 6 17 1 1 - -Mont. 3 2 - - - - - - - -Idaho 12 4 - - 1 1 N N N NWyo. 1 - 1 1 2 - 1 - - -Colo. - 17 - 4 - 6 - - - -N. Mex. - 4 - 9 3 5 - 1 - -Ariz. - 3 - 7 - 5 - - N NUtah 4 - - 1 - - - - - -Nev. - 8 - 1 - - - - - -
PACIFIC 120 100 37 75 21 2 - - - -Wash. - 1 - - - - - - N NOreg. 7 2 2 2 N N N N N NCalif. 103 88 34 70 19 - N N N NAlaska 6 2 - - - - - - N NHawaii 4 7 1 3 2 2 - - - -
Guam - - - - - - - - - -P.R. - 5 - - N N N N N NV.I. - - - - - - - - - -Amer. Samoa U U U U U U U U U UC.N.M.I. - U - U - U - U - U
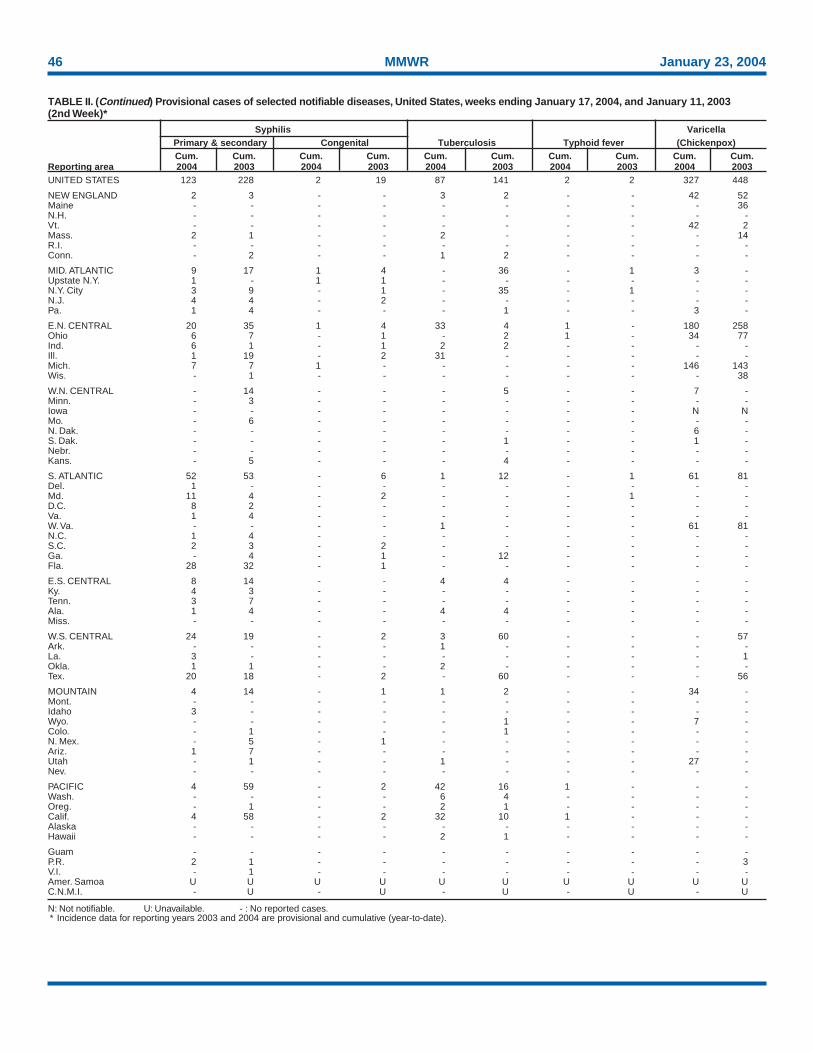
46 MMWR January 23, 2004
N: Not notifiable. U: Unavailable. - : No reported cases.* Incidence data for reporting years 2003 and 2004 are provisional and cumulative (year-to-date).
TABLE II. (Continued) Provisional cases of selected notifiable diseases, United States, weeks ending January 17, 2004, and January 11, 2003(2nd Week)*
Syphilis VaricellaPrimary & secondary Congenital Tuberculosis Typhoid fever (Chickenpox)Cum. Cum. Cum. Cum. Cum. Cum. Cum. Cum. Cum. Cum.
Reporting area 2004 2003 2004 2003 2004 2003 2004 2003 2004 2003UNITED STATES 123 228 2 19 87 141 2 2 327 448
NEW ENGLAND 2 3 - - 3 2 - - 42 52Maine - - - - - - - - - 36N.H. - - - - - - - - - -Vt. - - - - - - - - 42 2Mass. 2 1 - - 2 - - - - 14R.I. - - - - - - - - - -Conn. - 2 - - 1 2 - - - -
MID. ATLANTIC 9 17 1 4 - 36 - 1 3 -Upstate N.Y. 1 - 1 1 - - - - - -N.Y. City 3 9 - 1 - 35 - 1 - -N.J. 4 4 - 2 - - - - - -Pa. 1 4 - - - 1 - - 3 -
E.N. CENTRAL 20 35 1 4 33 4 1 - 180 258Ohio 6 7 - 1 - 2 1 - 34 77Ind. 6 1 - 1 2 2 - - - -Ill. 1 19 - 2 31 - - - - -Mich. 7 7 1 - - - - - 146 143Wis. - 1 - - - - - - - 38
W.N. CENTRAL - 14 - - - 5 - - 7 -Minn. - 3 - - - - - - - -Iowa - - - - - - - - N NMo. - 6 - - - - - - - -N. Dak. - - - - - - - - 6 -S. Dak. - - - - - 1 - - 1 -Nebr. - - - - - - - - - -Kans. - 5 - - - 4 - - - -
S. ATLANTIC 52 53 - 6 1 12 - 1 61 81Del. 1 - - - - - - - - -Md. 11 4 - 2 - - - 1 - -D.C. 8 2 - - - - - - - -Va. 1 4 - - - - - - - -W. Va. - - - - 1 - - - 61 81N.C. 1 4 - - - - - - - -S.C. 2 3 - 2 - - - - - -Ga. - 4 - 1 - 12 - - - -Fla. 28 32 - 1 - - - - - -
E.S. CENTRAL 8 14 - - 4 4 - - - -Ky. 4 3 - - - - - - - -Tenn. 3 7 - - - - - - - -Ala. 1 4 - - 4 4 - - - -Miss. - - - - - - - - - -
W.S. CENTRAL 24 19 - 2 3 60 - - - 57Ark. - - - - 1 - - - - -La. 3 - - - - - - - - 1Okla. 1 1 - - 2 - - - - -Tex. 20 18 - 2 - 60 - - - 56
MOUNTAIN 4 14 - 1 1 2 - - 34 -Mont. - - - - - - - - - -Idaho 3 - - - - - - - - -Wyo. - - - - - 1 - - 7 -Colo. - 1 - - - 1 - - - -N. Mex. - 5 - 1 - - - - - -Ariz. 1 7 - - - - - - - -Utah - 1 - - 1 - - - 27 -Nev. - - - - - - - - - -
PACIFIC 4 59 - 2 42 16 1 - - -Wash. - - - - 6 4 - - - -Oreg. - 1 - - 2 1 - - - -Calif. 4 58 - 2 32 10 1 - - -Alaska - - - - - - - - - -Hawaii - - - - 2 1 - - - -
Guam - - - - - - - - - -P.R. 2 1 - - - - - - - 3V.I. - 1 - - - - - - - -Amer. Samoa U U U U U U U U U UC.N.M.I. - U - U - U - U - U
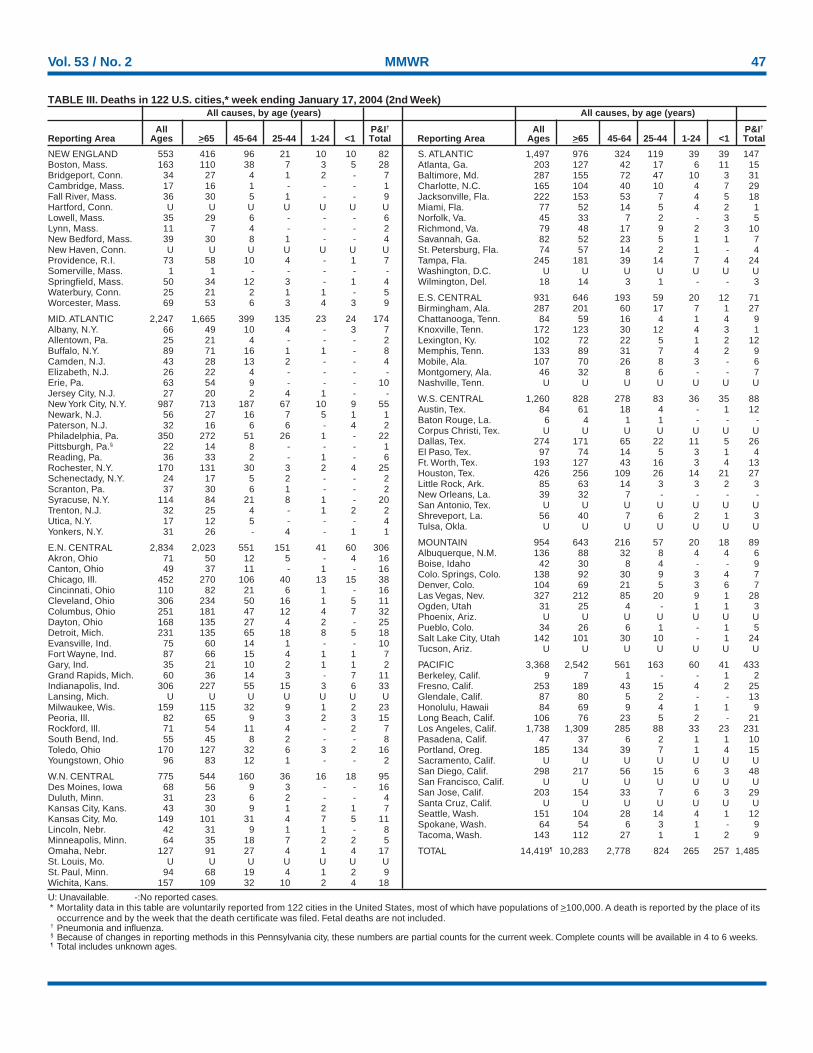
Vol. 53 / No. 2 MMWR 47
U: Unavailable. -:No reported cases.* Mortality data in this table are voluntarily reported from 122 cities in the United States, most of which have populations of >100,000. A death is reported by the place of its
occurrence and by the week that the death certificate was filed. Fetal deaths are not included.† Pneumonia and influenza.§ Because of changes in reporting methods in this Pennsylvania city, these numbers are partial counts for the current week. Complete counts will be available in 4 to 6 weeks.¶ Total includes unknown ages.
NEW ENGLAND 553 416 96 21 10 10 82Boston, Mass. 163 110 38 7 3 5 28Bridgeport, Conn. 34 27 4 1 2 - 7Cambridge, Mass. 17 16 1 - - - 1Fall River, Mass. 36 30 5 1 - - 9Hartford, Conn. U U U U U U ULowell, Mass. 35 29 6 - - - 6Lynn, Mass. 11 7 4 - - - 2New Bedford, Mass. 39 30 8 1 - - 4New Haven, Conn. U U U U U U UProvidence, R.I. 73 58 10 4 - 1 7Somerville, Mass. 1 1 - - - - -Springfield, Mass. 50 34 12 3 - 1 4Waterbury, Conn. 25 21 2 1 1 - 5Worcester, Mass. 69 53 6 3 4 3 9
MID. ATLANTIC 2,247 1,665 399 135 23 24 174Albany, N.Y. 66 49 10 4 - 3 7Allentown, Pa. 25 21 4 - - - 2Buffalo, N.Y. 89 71 16 1 1 - 8Camden, N.J. 43 28 13 2 - - 4Elizabeth, N.J. 26 22 4 - - - -Erie, Pa. 63 54 9 - - - 10Jersey City, N.J. 27 20 2 4 1 - -New York City, N.Y. 987 713 187 67 10 9 55Newark, N.J. 56 27 16 7 5 1 1Paterson, N.J. 32 16 6 6 - 4 2Philadelphia, Pa. 350 272 51 26 1 - 22Pittsburgh, Pa.§ 22 14 8 - - - 1Reading, Pa. 36 33 2 - 1 - 6Rochester, N.Y. 170 131 30 3 2 4 25Schenectady, N.Y. 24 17 5 2 - - 2Scranton, Pa. 37 30 6 1 - - 2Syracuse, N.Y. 114 84 21 8 1 - 20Trenton, N.J. 32 25 4 - 1 2 2Utica, N.Y. 17 12 5 - - - 4Yonkers, N.Y. 31 26 - 4 - 1 1
E.N. CENTRAL 2,834 2,023 551 151 41 60 306Akron, Ohio 71 50 12 5 - 4 16Canton, Ohio 49 37 11 - 1 - 16Chicago, Ill. 452 270 106 40 13 15 38Cincinnati, Ohio 110 82 21 6 1 - 16Cleveland, Ohio 306 234 50 16 1 5 11Columbus, Ohio 251 181 47 12 4 7 32Dayton, Ohio 168 135 27 4 2 - 25Detroit, Mich. 231 135 65 18 8 5 18Evansville, Ind. 75 60 14 1 - - 10Fort Wayne, Ind. 87 66 15 4 1 1 7Gary, Ind. 35 21 10 2 1 1 2Grand Rapids, Mich. 60 36 14 3 - 7 11Indianapolis, Ind. 306 227 55 15 3 6 33Lansing, Mich. U U U U U U UMilwaukee, Wis. 159 115 32 9 1 2 23Peoria, Ill. 82 65 9 3 2 3 15Rockford, Ill. 71 54 11 4 - 2 7South Bend, Ind. 55 45 8 2 - - 8Toledo, Ohio 170 127 32 6 3 2 16Youngstown, Ohio 96 83 12 1 - - 2
W.N. CENTRAL 775 544 160 36 16 18 95Des Moines, Iowa 68 56 9 3 - - 16Duluth, Minn. 31 23 6 2 - - 4Kansas City, Kans. 43 30 9 1 2 1 7Kansas City, Mo. 149 101 31 4 7 5 11Lincoln, Nebr. 42 31 9 1 1 - 8Minneapolis, Minn. 64 35 18 7 2 2 5Omaha, Nebr. 127 91 27 4 1 4 17St. Louis, Mo. U U U U U U USt. Paul, Minn. 94 68 19 4 1 2 9Wichita, Kans. 157 109 32 10 2 4 18
S. ATLANTIC 1,497 976 324 119 39 39 147Atlanta, Ga. 203 127 42 17 6 11 15Baltimore, Md. 287 155 72 47 10 3 31Charlotte, N.C. 165 104 40 10 4 7 29Jacksonville, Fla. 222 153 53 7 4 5 18Miami, Fla. 77 52 14 5 4 2 1Norfolk, Va. 45 33 7 2 - 3 5Richmond, Va. 79 48 17 9 2 3 10Savannah, Ga. 82 52 23 5 1 1 7St. Petersburg, Fla. 74 57 14 2 1 - 4Tampa, Fla. 245 181 39 14 7 4 24Washington, D.C. U U U U U U UWilmington, Del. 18 14 3 1 - - 3
E.S. CENTRAL 931 646 193 59 20 12 71Birmingham, Ala. 287 201 60 17 7 1 27Chattanooga, Tenn. 84 59 16 4 1 4 9Knoxville, Tenn. 172 123 30 12 4 3 1Lexington, Ky. 102 72 22 5 1 2 12Memphis, Tenn. 133 89 31 7 4 2 9Mobile, Ala. 107 70 26 8 3 - 6Montgomery, Ala. 46 32 8 6 - - 7Nashville, Tenn. U U U U U U U
W.S. CENTRAL 1,260 828 278 83 36 35 88Austin, Tex. 84 61 18 4 - 1 12Baton Rouge, La. 6 4 1 1 - - -Corpus Christi, Tex. U U U U U U UDallas, Tex. 274 171 65 22 11 5 26El Paso, Tex. 97 74 14 5 3 1 4Ft. Worth, Tex. 193 127 43 16 3 4 13Houston, Tex. 426 256 109 26 14 21 27Little Rock, Ark. 85 63 14 3 3 2 3New Orleans, La. 39 32 7 - - - -San Antonio, Tex. U U U U U U UShreveport, La. 56 40 7 6 2 1 3Tulsa, Okla. U U U U U U U
MOUNTAIN 954 643 216 57 20 18 89Albuquerque, N.M. 136 88 32 8 4 4 6Boise, Idaho 42 30 8 4 - - 9Colo. Springs, Colo. 138 92 30 9 3 4 7Denver, Colo. 104 69 21 5 3 6 7Las Vegas, Nev. 327 212 85 20 9 1 28Ogden, Utah 31 25 4 - 1 1 3Phoenix, Ariz. U U U U U U UPueblo, Colo. 34 26 6 1 - 1 5Salt Lake City, Utah 142 101 30 10 - 1 24Tucson, Ariz. U U U U U U U
PACIFIC 3,368 2,542 561 163 60 41 433Berkeley, Calif. 9 7 1 - - 1 2Fresno, Calif. 253 189 43 15 4 2 25Glendale, Calif. 87 80 5 2 - - 13Honolulu, Hawaii 84 69 9 4 1 1 9Long Beach, Calif. 106 76 23 5 2 - 21Los Angeles, Calif. 1,738 1,309 285 88 33 23 231Pasadena, Calif. 47 37 6 2 1 1 10Portland, Oreg. 185 134 39 7 1 4 15Sacramento, Calif. U U U U U U USan Diego, Calif. 298 217 56 15 6 3 48San Francisco, Calif. U U U U U U USan Jose, Calif. 203 154 33 7 6 3 29Santa Cruz, Calif. U U U U U U USeattle, Wash. 151 104 28 14 4 1 12Spokane, Wash. 64 54 6 3 1 - 9Tacoma, Wash. 143 112 27 1 1 2 9
TOTAL 14,419¶ 10,283 2,778 824 265 257 1,485
TABLE III. Deaths in 122 U.S. cities,* week ending January 17, 2004 (2nd Week)All causes, by age (years) All causes, by age (years)
All P&I† All P&I†
Reporting Area Ages >65 45-64 25-44 1-24 <1 Total Reporting Area Ages >65 45-64 25-44 1-24 <1 Total

MMWR
The Morbidity and Mortality Weekly Report (MMWR) Series is prepared by the Centers for Disease Control and Prevention (CDC) and is available free of chargein electronic format and on a paid subscription basis for paper copy. To receive an electronic copy each week, send an e-mail message to [email protected]. Thebody content should read SUBscribe mmwr-toc. Electronic copy also is available from CDC’s World-Wide Web server at http://www.cdc.gov/mmwr or from CDC’sfile transfer protocol server at ftp://ftp.cdc.gov/pub/publications/mmwr. To subscribe for paper copy, contact Superintendent of Documents, U.S. GovernmentPrinting Office, Washington, DC 20402; telephone 202-512-1800.
Data in the weekly MMWR are provisional, based on weekly reports to CDC by state health departments. The reporting week concludes at close of business onFriday; compiled data on a national basis are officially released to the public on the following Friday. Address inquiries about the MMWR Series, including materialto be considered for publication, to Editor, MMWR Series, Mailstop C-08, CDC, 1600 Clifton Rd., N.E., Atlanta, GA 30333; telephone 888-232-3228.
All material in the MMWR Series is in the public domain and may be used and reprinted without permission; citation as to source, however, is appreciated.
All MMWR references are available on the Internet at http://www.cdc.gov/mmwr. Use the search function to find specific articles.
Use of trade names and commercial sources is for identification only and does not imply endorsement by the U.S. Department of Health and Human Services.
References to non-CDC sites on the Internet are provided as a service to MMWR readers and do not constitute or imply endorsement of these organizations ortheir programs by CDC or the U.S. Department of Health and Human Services. CDC is not responsible for the content of these sites. URL addresses listed inMMWR were current as of the date of publication.
✩ U.S. Government Printing Office: 2004-633-140/69167 Region IV ISSN: 0149-2195
48 January 23, 2004