Embed Size (px)
Citation preview

NATIONAL HEALTH AND MORBIDITY SURVEY 2015 MINISTRY OF HEALTH MALAYSIA
1
Non-Communicable Diseases, Risk Factors & Other Health Problems Volume II
(NMRR – 14-1064-21877)
VOLUME II :
Non-Communicable
Diseases, Risk Factors &
Other Health Problems
NATIONAL HEALTH AND MORBIDITY SURVEY 2015 MINISTRY OF HEALTH MALAYSIA
2
Non-Communicable Diseases, Risk Factors & Other Health Problems Volume II
Contributors
The following persons had contributed in the interpretation of findings, discussion
on implication, conclusions and/or drawing recommendations for this report.
(In alphabetical order)
Abd Kadir Abu Bakar, Abdul Aiman Abd Ghani, Abu Bakar Rahman, Ahmad Ali
Zainuddin, Ahmad Nadzri Jai, Arunah Chandran, Asmah Razali, Azli Baharudin,
Azriman Rosman, Balkish Mahadir Naidu, Chan Ying Ying, Chandrika Jeevenathan,
Cheong Siew Man, Christopher Eugene, Faizah Paiwai, Fatanah Ismail, Fatimah
Othman, Feisul Idzwan Mustapha, Gunenthira Rao a/l Subbarao, Hamizatul Akmal
Abd Hamid, Hasimah Ismail, Idayu Badilla Idris, Jane Ling Miaw Yn, Jemsee Onggi,
Jiloris F. Dony, Joanita Sulaiman, Kamarul Zaman Salleh, Khir Abdullah, Khoo Yi Yi,
Lim Chong Hum, Lim Kuang Hock, Lim Kuang Kuay, Mastura Ismail, Mohamad
Aznuddin Abd Razak, Mohamad Fuad Mohamad Anuar, Mohamad Hasnan Ahmad,
Mohamad Naim Mohamad Rasidi, Mohamed Naim Abdul Kadir, Mohammad
Nazarudin Bahari, Mohd Azahadi Omar, Mohd Hatta Abdul Mutalip, Mohd Hazrin
Hashim, Mohd Yussof Sabtu, Muhammad Fadhli Mohd Yusoff, Muhammad Ismail,
Muslimah Yusof, Nizam Baharom, Noor Ani Ahmad, Noor Safiza Mohamad Nor, Nor
Azian Mohd Zaki, Noraida Mohamad Kasim, Noran Naqiah Hairi, Norayana Hasan,
Norazizah Ibrahim Wong, Norhafizah Sahril, Norhayati Hussein, Norlida
Zulkafly,Norrafizah Jaafar, Norsiah Ali, Norzawati Yoep, Nur Ashikin Ibrahim, Nur
Azna Mahmud, Nur Liana Ab Majid, Nur Shahida Abd Aziz, Nurashikin Ibrahim,
Rahama Samad, Rajini Sooryanarayana, Rashidah Ambak, Rozanim Kamarudin,
Rusidah Selamat, S Maria Awaluddin, Salimah Othman, Sayan Pan, Shubash Shander
a/l Ganapathy, Siti Fatimah Mat Hussin, Siti Suriani Che Hussin, Sobashini a/p
Kanniah, Tee Guat Hiong, Wan Shakira Rodzlan Hasani, Yusniza Mohd Yusof, Zaidi
Yaacob, Zanariah Zaini.
Editors
Tahir Aris, Muhammad Fadhli Mohd Yusoff, Abdul Aiman Abd Ghani, Noor Ani
Ahmad, Mohd Azahadi Omar, Tee Guat Hiong, Nur Hazwani Mohd Hasri, Nur
Fadzilla Mohd Radzi, Nur Syazwani Manan, Nurul Aini Kamaruddin.
NATIONAL HEALTH AND MORBIDITY SURVEY 2015 MINISTRY OF HEALTH MALAYSIA
3
Non-Communicable Diseases, Risk Factors & Other Health Problems Volume II
Volumes in this series The report comprises of several volumes, as follows:
i. Volume I : Methodology and General Findings
ii. Volume II : Non-Communicable Diseases, Risk Factors &
Other Health Problems
iii. Volume III : Health Care Demands
iv. Volume IV : Traditional & Complementary Medicine
©2015, Institute for Public Health, National Institutes of Health, Ministry of Health Malaysia, Kuala Lumpur. ISBN: 978-983-2387-23-7 Suggested citation: Institute for Public Health (IPH) 2015. National Health and Morbidity Survey 2015 (NHMS 2015). Vol. II: Non-Communicable Diseases, Risk Factors & Other Health Problems; 2015. Disclaimer The views expressed in this report are those of the authors alone and do not necessarily represent the opinions of the other investigators participating in the survey, nor the views or policy of the Ministry of Health Malaysia. Produced and Distributed by: The National Health and Morbidity Survey 2015, Institute for Public Health, National Institutes of Health, Ministry of Health, Jalan Bangsar, 50590 Kuala Lumpur, Malaysia. Tel: +603-22979400 Fax: +603-22823114 Any enquiries about or comments on this report should be directed to: Principal Investigator, The National Health and Morbidity Survey 2015, Institute for Public Health, National Institutes of Health, Ministry of Health, Jalan Bangsar, 50590 Kuala Lumpur, Malaysia. Tel: +603-22979593 Fax: +603-22823114 Published by Institute for Public Health, Ministry of Health, Malaysia
NATIONAL HEALTH AND MORBIDITY SURVEY 2015 MINISTRY OF HEALTH MALAYSIA
4
Non-Communicable Diseases, Risk Factors & Other Health Problems Volume II
ACKNOWLEDGEMENT First of all, the authors would like to thank the Director General of Health for his great support in the implementation of the National Health and Morbidity Survey 2015. Special thanks to the Deputy Director General of Health (Research and Technical Support) and the Director of Institute for Public Health for their continuous advice, guidance and support throughout the process of the survey. The National Health and Morbidity Survey 2015 was conducted with the funding from the Ministry of Health Malaysia and the authors would like to express their gratitude to the Ministry for this financial support. We would like to acknowledge the Steering Committee, chaired by the Director General of Health for their advices and approval on the scopes of NHMS 2015. Gratitude to the Department of Statistics Malaysia for their assistance especially in the sampling process and preparation of data collection. Our acknowledgement also goes to all State Directors and all State Liaison Officers who have been very supportive in mobilising resources during the preparation and implementation of data collection. Thanks to all field supervisors, nurses, data collectors, scouts, drivers and all individual who have assisted in the implementation of the survey. Last but not least, our sincere appreciation to all respondents who have participated in the survey. Their contributions in the survey would assist Ministry of Health in improving health services in Malaysia.

NATIONAL HEALTH AND MORBIDITY SURVEY 2015 MINISTRY OF HEALTH MALAYSIA
5
Non-Communicable Diseases, Risk Factors & Other Health Problems Volume II
TABLE OF CONTENTS
Topic Pages
1. CARDIOVASCULAR DISEASES………………...…………...…………………….…........13 1.1 Diabetes Mellitus 14 1.2 Hypertension 17 1.3 Hypercholesterolemia 20 1.4 Implication 22 1.5 Conclusion 23 1.6 Recommendations 23 1.7 References 24
2. NUTRITIONAL STATUS…..………………………………...……………….……………...46 2.1 Nutritional Status of Malaysian Adults (Aged ≥ 18 Years Old) 47
2.1.1 Background 47 2.1.2 Objectives 47 2.1.3 Target Population, Study Instrument And Definitions 47 2.1.4 Findings 48 2.1.5 Conclusion 51
2.2 Nutritional Status of Children (Aged < 18 Years Old) 76 2.2.1 Background 76 2.2.2 Objectives 76 2.2.3 Target Population, Study Instrument And Definitions 76 2.2.4 Findings 77 2.2.5 Conclusion 78
3. TOBACCO USE..………………………………...……..………………………………….....83 3.1 Background 84 3.2 Objectives 84 3.3 Target Population, Study Instrument And Definitions 84 3.4 Findings 85 3.5 Conclusion 91 3.6 Recommendations 91 3.7 References 92
4. ALCOHOL CONSUMPTION.………….………….……...……………………………...….153 4.1 Background 154 4.2 Objectives 154 4.3 Target Population, Study Instrument And Definitions 154 4.4 Findings 155 4.5 Conclusion 157 4.6 References 157
5. PHYSICAL ACTIVITY………………………………...……………………………….….....163 5.1 Background 164 5.2 Objectives 164 5.3 Target Population, Study Instrument And Definitions 164 5.4 Findings 165 5.5 Conclusion 166
NATIONAL HEALTH AND MORBIDITY SURVEY 2015 MINISTRY OF HEALTH MALAYSIA
6
Non-Communicable Diseases, Risk Factors & Other Health Problems Volume II
6. DIETARY PRACTICES ………………………………...…………………….…………....172 6.1 Background 173 6.2 Objectives 173 6.3 Target Population, Study Instrument And Definitions 173 6.4 Findings 174 6.5 Conclusion 175
7. MENTAL HEALTH PROBLEMS OF ADULTS…………………………………..….…..184 7.1 Background 185 7.2 Objectives 185 7.3 Target Population, Study Instrument And Definitions 185 7.4 Findings 186 7.5 Conclusion 187 7.6 References 187
8. MENTAL HEALTH PROBLEMS OF CHILDREN ………………………………………..190 8.1 Background 191 8.2 Objectives 191 8.3 Target Population, Study Instrument And Definitions 191 8.4 Findings 192 8.5 Conclusion 193 8.6 References 193
9. ANAEMIA………………………………...……………………………………………..…….206 9.1 Background 207 9.2 Objectives 207 9.3 Target Population, Study Instrument And Definitions 207 9.4 Findings 208 9.5 Conclusion 209 9.6 References 209
10. DENGUE……………………………...……………………………………………..……….215 10.1 Background 216 10.2 Objectives 216 10.3 Target Population, Study Instrument And Definitions 216 10.4 Findings 217 10.5 Conclusion 219
11. TUBERCULOSIS……………………………...………………………………………........237 11.1 Background 238 11.2 Objectives 238 11.3 Target Population, Study Instrument And Definitions 238 11.4 Findings 239 11.5 Conclusion 240 11.6 References 240
12. LEPROSY……………………………...………………………………………………........247 12.1 Background 248 12.2 Objectives 248 12.3 Target Population, Study Instrument And Definitions 248 12.4 Findings 249 12.5 Conclusion 250
NATIONAL HEALTH AND MORBIDITY SURVEY 2015 MINISTRY OF HEALTH MALAYSIA
7
Non-Communicable Diseases, Risk Factors & Other Health Problems Volume II
13. DISABILITY ...…………………………...…………………………………………….........256 13.1 Background 257 13.2 Objectives 257 13.3 Target Population, Study Instrument And Definitions 257 13.4 Findings 258 13.5 Conclusion 266 13.6 Recommendations 267
14. HEALTH LITERACY……………………………………………...………………………..285 14.1 Background 286 14.2 Objectives 286 14.3 Target Population, Study Instrument And Definitions 287 14.4 Findings 287 14.5 Conclusion 288 14.6 Recommendations 288
NATIONAL HEALTH AND MORBIDITY SURVEY 2015 MINISTRY OF HEALTH MALAYSIA
8
Non-Communicable Diseases, Risk Factors & Other Health Problems Volume II
LIST OF TABLES
CARDIOVASCULAR DISEASES
Table 1.1.1 Prevalence of overall diabetes by socio-demographic characteristics 25 Table 1.1.2 Prevalence of known diabetes by socio-demographic characteristics 27 Table 1.1.3 Prevalence of undiagnosed diabetes by socio-demographic
characteristics 29
Table 1.1.4 Prevalence of impaired fasting glucose by socio-demographic characteristics
31
Table 1.2.1 Prevalence of overall hypertension by socio-demographic characteristics 33 Table 1.2.2 Prevalence of known hypertension by socio-demographic characteristics 35 Table 1.2.3 Prevalence of undiagnosed hypertension by socio-demographic
characteristics 37
Table 1.3.1 Prevalence of overall hypercholesterolemia by socio-demographic characteristics
39
Table 1.3.2 Prevalence of known hypercholesterolemia by socio-demographic characteristics
41
Table 1.3.3 Prevalence of undiagnosed hypercholesterolemia by socio-demographic characteristics
43
NUTRITIONAL STATUS OF MALAYSIAN ADULTS (AGED ≥ 18 YEARS OLD)
Table 2.1.1 Prevalence of underweight BMI among adults (aged≥ 18 years old) by socio-demographic characteristics
51
Table 2.1.2 Prevalence of normal BMI among adults (aged≥ 18 years old) by socio-demographic characteristics
53
Table 2.1.3 Prevalence of overweight among adults (aged≥ 18 years old) by socio-demographic characteristics
56
Table 2.1.4 Prevalence of obesity among adults (aged≥ 18 years old) by socio-demographic characteristics
59
Table 2.1.5 Prevalence of obesity I to III (WHO 1998) among adults (aged ≥18 years old) by socio- demographic characteristics
62
Table 2.1.6 Prevalence of obesity I to III (CPG 2004) among adults (aged ≥18 years old) by socio-demographic characteristics
65
Table 2.1.7 Prevalence of abdominal obesity (WHO 1998) among adults (aged ≥18 years old) by socio-demographic characteristic
68
Table 2.1.8 Prevalence of abdominal obesity (WHO 2000) among adults (aged ≥18 years old) by socio-demographic characteristic
70
Table 2.1.9 Prevalence of muscle wasting among elderly (aged 60 years and above) by socio-demographics
72
NUTRITIONAL STATUS OF CHILDREN (AGED < 18 YEARS OLD)
Table 2.2.1 Prevalence of Body Mass Index (BMI) for age status based on WHO 2006 among children (aged <18 years old) by socio-demographic characteristics
78
Table 2.2.2 Prevalence of weight for age status based on WHO 2006 among children (aged <18 years old) by socio-demographic characteristics
70
Table 2.2.3 Prevalence of height for age status based on WHO 2006 among children (aged <18 years old) by socio-demographic characteristics
80
Table 2.2.4 Prevalence of weight for height status based on WHO 2006 among children (aged <6 years old) by socio-demographic characteristics
81

NATIONAL HEALTH AND MORBIDITY SURVEY 2015 MINISTRY OF HEALTH MALAYSIA
9
Non-Communicable Diseases, Risk Factors & Other Health Problems Volume II
TOBACCO USE
Table 3.1.1 Prevalence of current tobacco smoker by socio-demographic characteristics
92
Table 3.1.2 Current smokers of any smoked tobacco product by socio-demographic characteristics
94
Table 3.1.3 Current smokers of any cigarette by socio-demographic characteristics 96 Table 3.1.4 Current smokers of manufactured cigarette by socio-demographic
characteristics 98
Table 3.1.5 Current smokers of hand-rolled cigarette by socio-demographic characteristics
100
Table 3.1.6 Current smokers of kretek by socio-demographic characteristics 102 Table 3.1.7 Current smokers of other tobacco product by socio-demographic
characteristics 104
Table 3.1.8 Cigarette smoked per day among daily cigarette smokers by socio-demographic characteristics
106
Table 3.1.9 Prevalence of smokeless tobacco used by socio-demographic characteristics
112
Table 3.1.10 Exposure to second-hand smoke at home among all respondents by socio-demographic characteristics
114
Table 3.1.11 Exposure to second-hand smoke at home among non-smokers by socio-demographic characteristics
116
Table 3.1.12 Exposure to second-hand smoke at work among all respondents by socio-demographic characteristics
118
Table 3.1.13 Exposure to second-hand smoke at home among non-smokers by socio-demographic characteristics
120
Table 3.1.14 Current smokers who made a quit attempt in the past 12 months by socio-demographic characteristics
122
Table 3.1.15 Current smokers who visited a healthcare provider in the past 12 months by socio-demographic characteristics
124
Table 3.1.16 Current smokers who advised to quit smoking by a healthcare provider in the past 12 months by socio-demographic characteristics
126
Table 3.1.17 Noticing anti-cigarette smoking information during the last 30 days in newspapers or magazine by socio-demographic characteristics
128
Table 3.1.18 Noticing anti-cigarette smoking information during the last 30 days on television by socio-demographic characteristics
131
Table 3.1.19 Current smokers who noticed health warning on cigarette package during the last 30 days by socio-demographic characteristics
134
Table 3.1.20 Current smokers who considered quitting because of the warnings during the last 30 days by socio-demographic characteristics
136
Table 3.1.21 Noticing cigarette advertising during the last 30 days in stores by socio-demographic characteristics
138
Table 3.1.22 Noticing cigarette promotion (free sample) during the last 30 days by socio-demographic characteristics
140
Table 3.1.23 Noticing cigarette promotion (cigarette at sales prices) during the last 30 days by socio-demographic characteristics
142
Table 3.1.24 Noticing cigarette promotion (coupons for cigarette) during the last 30 days by socio-demographic characteristics
144

NATIONAL HEALTH AND MORBIDITY SURVEY 2015 MINISTRY OF HEALTH MALAYSIA
10
Non-Communicable Diseases, Risk Factors & Other Health Problems Volume II
Table 3.1.25 Noticing cigarette promotion (free gifts/discount on other products) during the last 30 days by socio-demographic characteristics
146
Table 3.1.26 Noticing cigarette promotion (clothing/item with brand name or logo) during the last 30 days by socio-demographic characteristics
148
Table 3.1.27 Noticing cigarette promotion (mail promoting cigarette) during the last 30 days by socio-demographic characteristics
150
ALCOHOL CONSUMPTION
Table 4.1.1 Prevalence of current drinker (≥13 years old) by socio-demographic characteristics
157
Table 4.1.2 Prevalence of current drinker (≥18 years old) by socio-demographic characteristics
159
Table 4.1.3 Prevalence of binge drinker among current drinker (≥18 years old) by socio-demographic characteristic
161
Table 4.1.4 Risk related to pattern of drinking (≥18 years old) 161
PHYSICAL ACTIVITY
Table 5.1.1 Prevalence of physically active by socio-demographic characteristics 166 Table 5.1.2 Level of physical activity by socio-demographic characteristics 168
DIETARY PRACTICE
Table 6.1.1 Intake of fruit and/or vegetables by socio-demographic characteristics 175 Table 6.1.2 Adequate intake of fruits (≥ 2 servings) by socio-demographic
characteristics 177
Table 6.1.3 Adequate intake of vegetables (≥ 3 servings) by socio-demographic characteristics
179
Table 6.1.4 Adequate intake of plain water (≥6 glasses) by socio-demographic characteristics
181
MENTAL HEALTH PROBLEMS OF ADULTS
Table 7.1.1 Prevalence of Adult Mental Health problems by socio-demographic characteristics
187
MENTAL HEALTH PROBLEMS OF CHILDREN
Table 8.1.1 Prevalence of mental health problems among children 5-15 years old by socio-demographic characteristics
193
Table 8.1.2 Prevalence of emotional problems among children 5-15 years old by socio-demographic characteristics
195
Table 8.1.3 Prevalence of conduct problems among children 5-15 years old by socio-demographic characteristics
197
Table 8.1.4 Prevalence of hyperactivity problems among children 5-15 years old by socio-demographic characteristics
199
Table 8.1.5 Prevalence of peer problems among children 5-15 years old by socio-demographic characteristics
201
Table 8.1.6 Prevalence of pro-social skills among children 5-15 years old by socio-demographic characteristics
203
ANAEMIA
Table 9.1.1 Prevalence of anaemia by socio-demographic characteristics 209 Table 9.1.2 Prevalence of anaemia level by socio-demographic characteristics 211
NATIONAL HEALTH AND MORBIDITY SURVEY 2015 MINISTRY OF HEALTH MALAYSIA
11
Non-Communicable Diseases, Risk Factors & Other Health Problems Volume II
DENGUE
Table 10.1.1 Prevalence of adults who did not check their home at least once a week to eliminate mosquito breading site (aged≥ 18 years old) by socio-demographic
219
Table 10.1.2 Methods used to eliminate indoor mosquito breeding sites among adults (aged≥ 18 years old)
221
Table 10.1.3 Methods used to eliminate outdoor mosquito breeding sites among adults (aged≥ 18 years old)
221
Table 10.1.4 Prevalence of knowledge of active biting time for Aedes mosquitoes among adults (aged ≥18 years old)
221
Table 10.1.5 Prevalence of correct knowledge on active biting time for Aedes mosquitoes among adults (aged ≥18 years old) by socio-demographic characteristic
222
Table 10.1.6 Prevalence of preventive measure taken to prevent mosquito bites among adults (aged≥ 18 years old)
224
Table 10.1.7 Prevalence of reasons for not using larvicide among adults (aged≥ 18 years old)
224
Table 10.1.8 Source of larvicide supply 225 Table 10.1.9 Prevalence of places where larvicide were applied 225 Table 10.1.10 How soon respondents sought treatment from clinic/hospital if they
had fever 225
Table 10.1.11 Prevalence of action taken among adults who did not seek treatment (aged≥ 18 years old)
226
Table 10.1.12 Prevalence of adults who received the health promotion material by socio-demographic characteristics
227
Table 10.1.13 Type of health promotion material received among adults (aged≥ 18 years old)
229
Table 10.1.14 Prevalence of adults who knew dengue can cause death (aged≥ 18 years old) by socio-demographic characteristics
230
Table 10.1.15 Prevalence of action taken by respondents if neighbour has been infected by dengue fever
232
Table 10.1.16 Type of garbage disposal among adults (aged≥ 18 years old) 232 Table 10.1.17 Type of garbage disposal among adults (aged≥ 18 years old) by socio-
demographic characteristics 233
Table 10.1.18 Responsibility for keeping cleanliness outside respondent‟s premises 235 Table 10.1.19 Action taken by respondents for abandoned garbage 235
TUBERCULOSIS
Table 11.1.1 Prevalence of individuals with TB-like symptoms 15 years and above by socio-demographic characteristics
240
Table 11.1.2 Proportion of TB-like symptoms among respondents aged 15 years and above
242
Table 11.1.3 Health seeking behavior among individuals with TB-like symptoms aged 15 years and above
243
Table 11.1.4 Prevalence of individuals with TB-like symptoms aged 15 years and above screened for tuberculosis by healthcare facilities
244
Table 11.1.5 Reasons for not seeking treatment for individuals with TB-like symptoms aged 15 years and above
245

NATIONAL HEALTH AND MORBIDITY SURVEY 2015 MINISTRY OF HEALTH MALAYSIA
12
Non-Communicable Diseases, Risk Factors & Other Health Problems Volume II
LEPROSY
Table 12.1.1 Prevalence of ever heard about leprosy by socio-demographic characteristics
250
Table 12.1.2 Prevalence of believe leprosy still exist in Malaysia by socio-demographic characteristics
252
Table 12.1.3 Awareness and perception on leprosy among respondents 254
DISABILITY
Table 13.1.1 Prevalence of difficulty in seeing by socio demographic characteristics 265 Table 13.1.2 Prevalence of difficulty in listening by socio demographic
characteristics 269
Table 13.1.3 Prevalence of difficulty in walking by socio demographic characteristics
272
Table 13.1.4 Prevalence of difficulty in remembering by socio demographic characteristics
275
Table 13.1.5 Prevalence of difficulty in self-care by socio demographic characteristics
278
Table 13.1.6 Prevalence of difficulty in communicating by socio demographic characteristics
281
HEALTH LITERACY
Table 14.1.1 Level of Health Literacy among Malaysian Adult Population 288

1


NATIONAL HEALTH AND MORBIDITY SURVEY 2015 MINISTRY OF HEALTH MALAYSIA
13
Non-Communicable Diseases, Risk Factors & Other Health Problems Volume II
1. CARDIOVASCULAR DISEASES
Contributors to this section: Feisul Idzwan Mustapha, Muhammad Fadhli Mohd Yusoff,
Mohammad Nazarudin Bahari, Mastura Ismail, Fatanah Ismail, Abdul Aiman Abd. Ghani, Hasimah
Ismail, Arunah Chandran, Nur Liana Ab. Majid, Jane Ling Miaw Yn, Mohamad Naim Mohamad
Rasidi, Hamizatul Akmal, Rashidah Ambak, Nor Azian Mohd Zaki, Nur Shahida Abd Aziz, Balkish
Mahadir Naidu, Noor Safiza Mohamad Nor, Siti Fatimah Mat Hussin, Khoo Yi Yi, Mohamad Fuad
Mohamad Anuar.
Background
Non-Communicable Diseases (NCDs) now contribute to an estimated 73% of total deaths in
Malaysia, with the biggest contributor being cardiovascular diseases that include heart attacks and
strokes. An estimated 35% of deaths occur in individuals aged less than 60 years, which are
mainly our working population. The Second Burden of Disease Study for Malaysia, published by
the Institute for Public Health in 2012, ranked hypertension, smoking, diabetes, high cholesterol
and high BMI as the biggest contributors to both disability adjusted life-years (DALY) and deaths.
Data from the previous National Health and Morbidity Surveys (NHMS) showed an increasing
trend for all NCD risk factors. An analysis of NHMS 2011 showed that at least 63% of adults aged
18 years and above had at least one NCD risk factor (either overweight/obesity, high blood
pressure, high blood sugar or high blood cholesterol). In short, Malaysia now has a “sick” or “at
risk” population. More alarmingly, our children are just as vulnerable to the risk of NCDs right from
foetal development and increase further during childhood with the exposure to unhealthy diets,
lack of exercise as well as smoking and excessive alcohol consumption.
Our healthcare delivery systems are facing with increasing pressure to provide quality care to
patients with NCDs and their various complications. Chronic diseases place a substantial
economic burden on society. Estimates by the United States place the costs of chronic illness at
around three-quarters of the total national health expenditure. Some individual chronic diseases,
such as diabetes, account for between 2% and 15% of national health expenditure in some
European countries. Our NHMS data also showed a high proportion of Malaysians with
undiagnosed NCD risk factors. This contributes to late diagnosis, with complications and much
more difficult and costly to manage, further contributing to the increasing burden of NCDs in the
country.
NATIONAL HEALTH AND MORBIDITY SURVEY 2015 MINISTRY OF HEALTH MALAYSIA
14
Non-Communicable Diseases, Risk Factors & Other Health Problems Volume II
1.1 DIABETES MELLITUS
1.1.1 Objectives
1.1.1.1 General Objective
To determine the prevalence of diabetes in Malaysia.
1.1.1.2 Specific Objectives
a. To determine the prevalence of overall diabetes by socio-demographic sub-groups;
b. To determine the prevalence of known diabetes by socio-demographic sub-groups; and
c. To determine the prevalence of undiagnosed diabetes by socio-demographic subgroups.
1.1.2 Findings
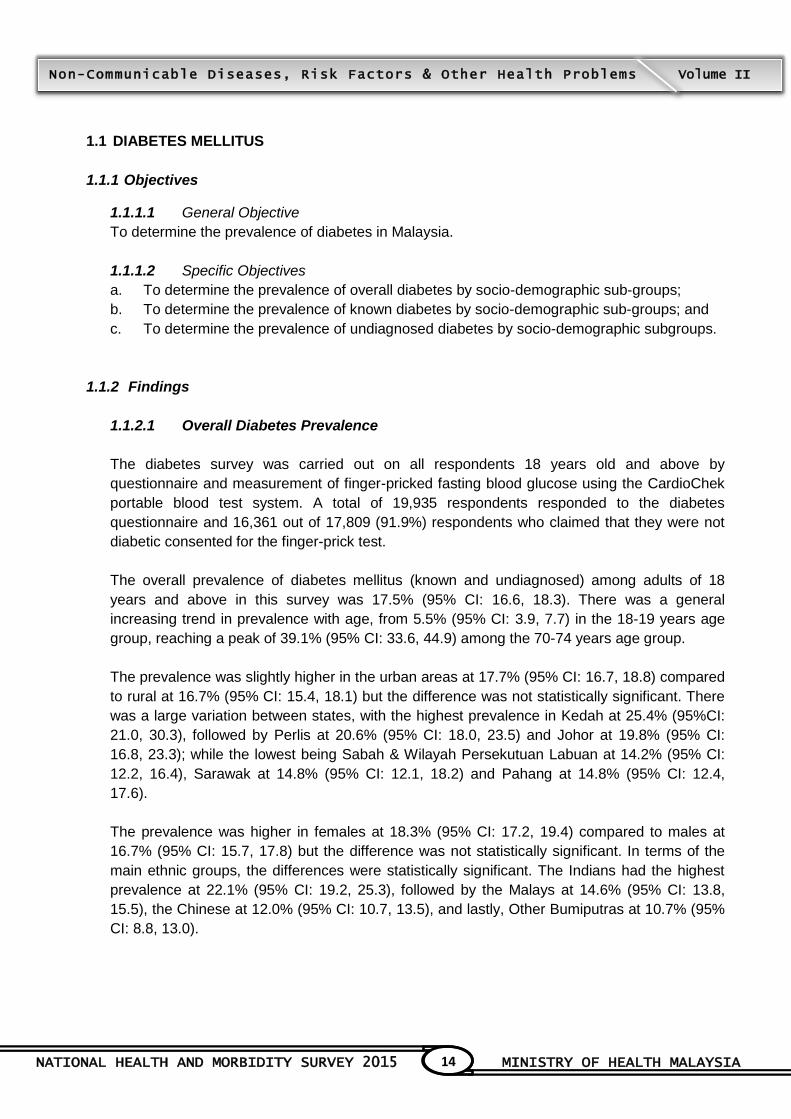
1.1.2.1 Overall Diabetes Prevalence
The diabetes survey was carried out on all respondents 18 years old and above by
questionnaire and measurement of finger-pricked fasting blood glucose using the CardioChek
portable blood test system. A total of 19,935 respondents responded to the diabetes
questionnaire and 16,361 out of 17,809 (91.9%) respondents who claimed that they were not
diabetic consented for the finger-prick test.
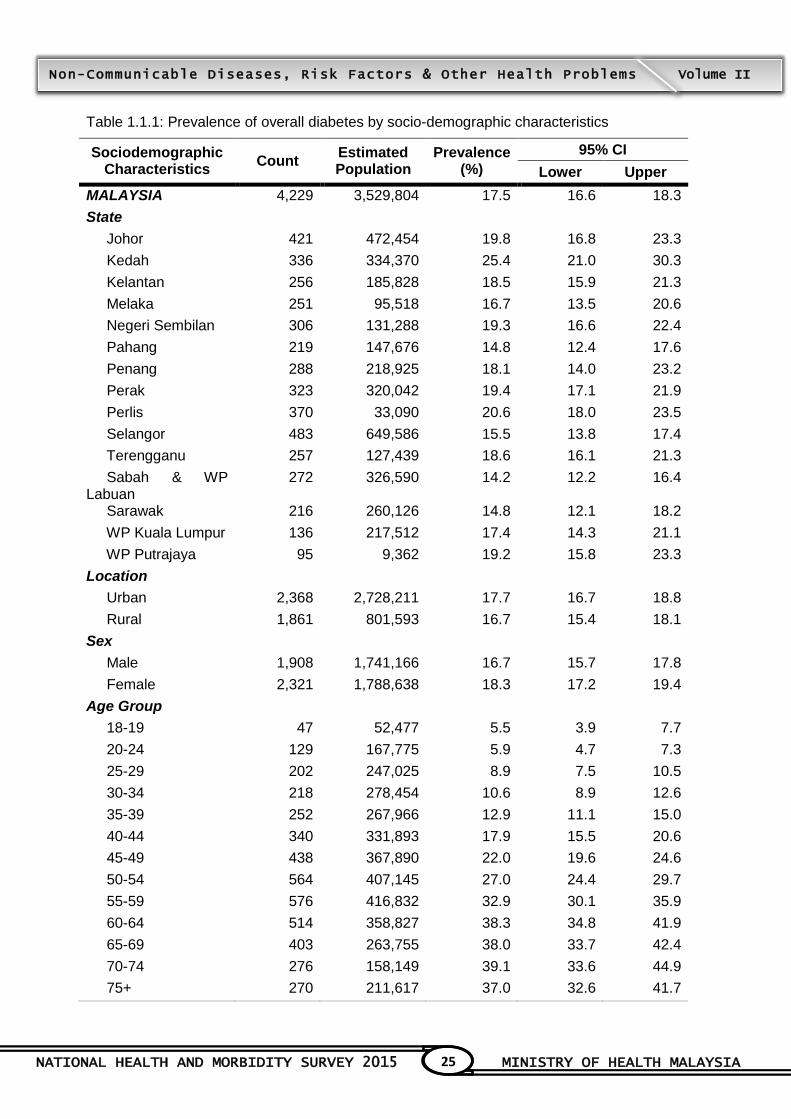
The overall prevalence of diabetes mellitus (known and undiagnosed) among adults of 18
years and above in this survey was 17.5% (95% CI: 16.6, 18.3). There was a general
increasing trend in prevalence with age, from 5.5% (95% CI: 3.9, 7.7) in the 18-19 years age
group, reaching a peak of 39.1% (95% CI: 33.6, 44.9) among the 70-74 years age group.
The prevalence was slightly higher in the urban areas at 17.7% (95% CI: 16.7, 18.8) compared
to rural at 16.7% (95% CI: 15.4, 18.1) but the difference was not statistically significant. There
was a large variation between states, with the highest prevalence in Kedah at 25.4% (95%CI:
21.0, 30.3), followed by Perlis at 20.6% (95% CI: 18.0, 23.5) and Johor at 19.8% (95% CI:
16.8, 23.3); while the lowest being Sabah & Wilayah Persekutuan Labuan at 14.2% (95% CI:
12.2, 16.4), Sarawak at 14.8% (95% CI: 12.1, 18.2) and Pahang at 14.8% (95% CI: 12.4,
17.6).
The prevalence was higher in females at 18.3% (95% CI: 17.2, 19.4) compared to males at
16.7% (95% CI: 15.7, 17.8) but the difference was not statistically significant. In terms of the
main ethnic groups, the differences were statistically significant. The Indians had the highest
prevalence at 22.1% (95% CI: 19.2, 25.3), followed by the Malays at 14.6% (95% CI: 13.8,
15.5), the Chinese at 12.0% (95% CI: 10.7, 13.5), and lastly, Other Bumiputras at 10.7% (95%
CI: 8.8, 13.0).

NATIONAL HEALTH AND MORBIDITY SURVEY 2015 MINISTRY OF HEALTH MALAYSIA
15
Non-Communicable Diseases, Risk Factors & Other Health Problems Volume II
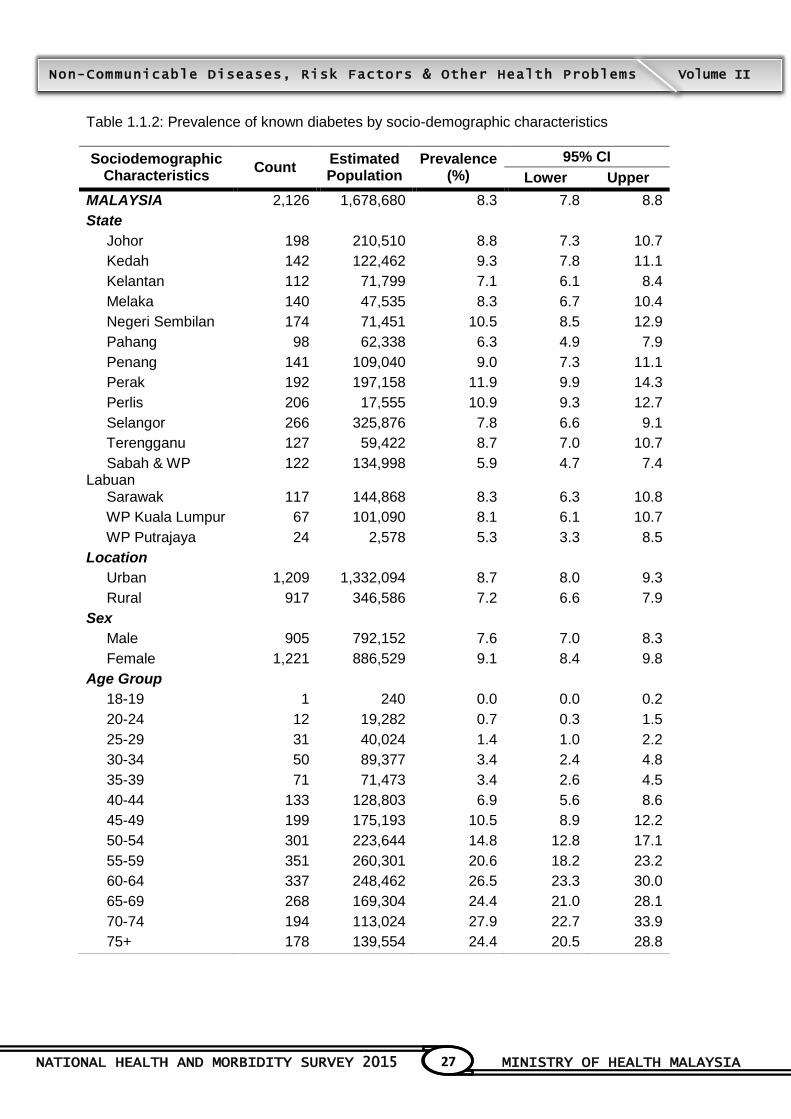
1.1.2.2 Prevalence of Known Diabetes
For this survey, "known diabetes" was defined as self-reported of being told to have diabetes
by a doctor or assistant medical officer (AMO).
The prevalence of individuals with known diabetes was at 8.3% (95% CI: 7.8, 8.8). There was
also a general increasing trend with age, starting from 0.7% (95% CI: 0.3, 1.5) within the age
group of 20-24 years old, reaching a peak of 27.9% (95% CI: 22.7, 33.9) at age group 70-74
years.
The prevalence was higher in the urban areas at 8.7% (95% CI: 8.0, 9.3) compared to rural at
7.2% (95% CI: 6.6, 7.9) and the difference was statistically significant. Again, there was a large
variation between states; the highest prevalence being in Perak at 11.9% (95% CI: 9.9, 14.3),
followed by Perlis at 10.9% (95% CI: 9.3, 12.7) and Negeri Sembilan at 10.5% (95% CI: 8.5,
12.9); while the lowest being WP Putrajaya at 5.3% (95% CI: 3.3, 8.5) and Sabah and Wilayah
Persekutuan Labuan at 5.9% (95% CI: 4.7, 7.4).
The prevalence was higher in females at 9.1% (95% CI: 8.4, 9.8) compared to males at 7.6%
(95% CI: 7.0, 8.3) and the difference was statistically significant. In terms of the main ethnic
groups, the differences were statistically significant. The Indians had the highest prevalence at
16.0% (95% CI: 13.7, 18.6), followed by the Malays at 9.0% (95% CI: 8.4, 9.7), Chinese at
7.7% (95% CI: 6.7, 8.9) and Other Bumiputras at 6.8% (95% CI: 5.3, 8.8).
Among the known diabetics, 25.1% claimed that they were on insulin therapy, 79.1% claimed
to be on oral anti-diabetic drugs within the past 2 weeks, 82.3% had received specific diabetes
diet advice from a healthcare personnel, 69.6% claimed to have been advised by healthcare
personnel to lose weight and 76.8% have been advised to be more physically active or start
exercising. With regards to their usual place of treatment, majority sought treatment at MOH
health clinics (59.3%), followed by MOH hospitals (20.0%), private clinics (15.1%) and private
hospitals (3.6%). About 1.5% self-medicated by purchasing medications directly from
pharmacies and 0.5% opted for traditional and complementary medicine as their main mode of
treatment.
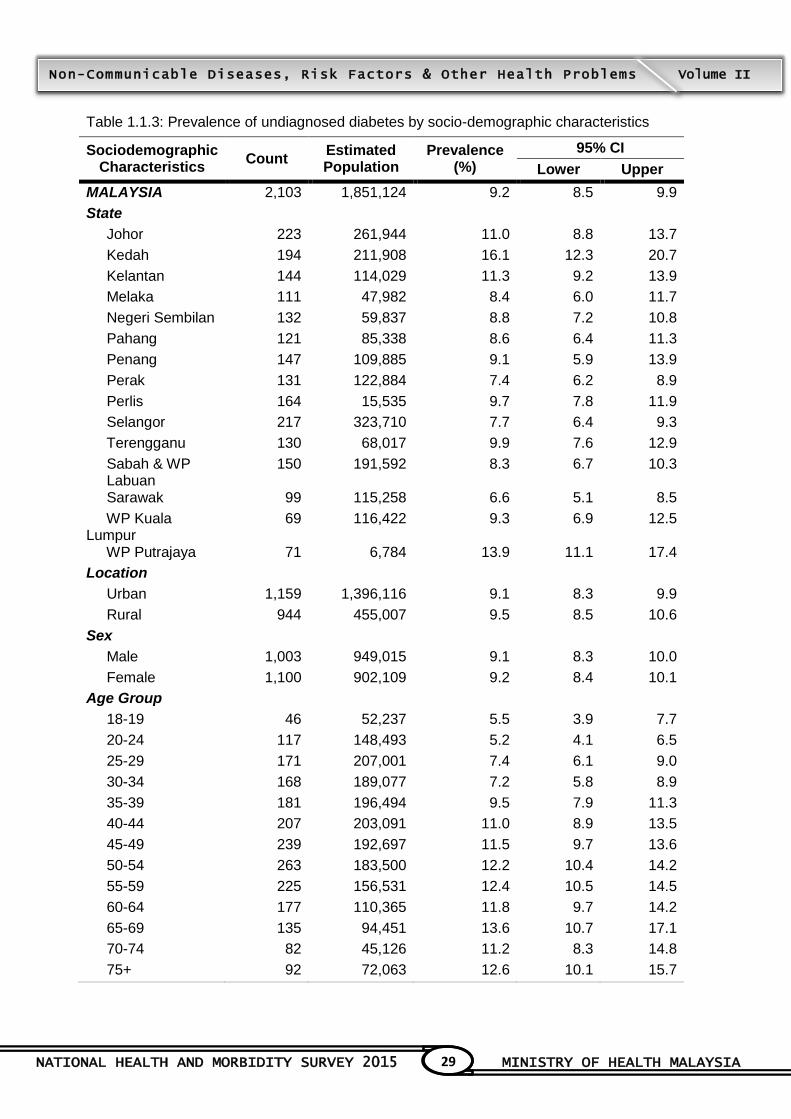
1.1.2.3 Prevalence of Undiagnosed Diabetes
For this survey, a respondent was classified as having "undiagnosed diabetes" when the
respondent was not known to have diabetes and had a fasting capillary blood glucose (FBG) of
6.1 mmol/L or more (or non-fasting blood glucose of more than 11.1 mmol/L).
The prevalence of undiagnosed diabetes was 9.2% (95% CI: 8.5, 9.9). There was also a
general increasing trend with age, starting from 5.5% (95% CI: 3.9, 7.7) at age group 18-19
years, reaching a peak of 13.6% (95% CI: 10.7, 17.1) at age group 65-69 year olds.

NATIONAL HEALTH AND MORBIDITY SURVEY 2015 MINISTRY OF HEALTH MALAYSIA
16
Non-Communicable Diseases, Risk Factors & Other Health Problems Volume II
The prevalence was higher in the rural compared to the urban areas, however the difference
was not statistically significant. Again, there was a large variation between states; the highest
prevalence being in Kedah at 16.1% (95% CI: 12.3, 20.7), followed by WP Putrajaya at 13.9%
(95% CI: 11.1, 17.4) and Kelantan at 11.3% (95% CI: 9.2, 13.9), while the lowest being
Sarawak at 6.6% (95% CI: 5.1, 8.5), Perak at 7.4% (95% CI: 6.2, 8.9) and Selangor at 7.7%
(95% CI: 6.4, 9.3).
The prevalence was slightly higher in females at 9.2% (95% CI: 8.4, 10.1) compared to males
at 9.1% (95% CI: 8.3, 10.0), but the difference was not statistically significant. The Indians had
the highest prevalence at 11.9% (95% CI: 9.5, 14.9), followed by the Malays at 9.8% (95% CI:
9.1, 10.6), Others at 8.6% (95% CI: 6.7, 11.1), Other Bumiputras at 8.1% (95% CI: 6.6, 9.8)
and Chinese at 7.7% (95% CI: 6.4, 9.4).
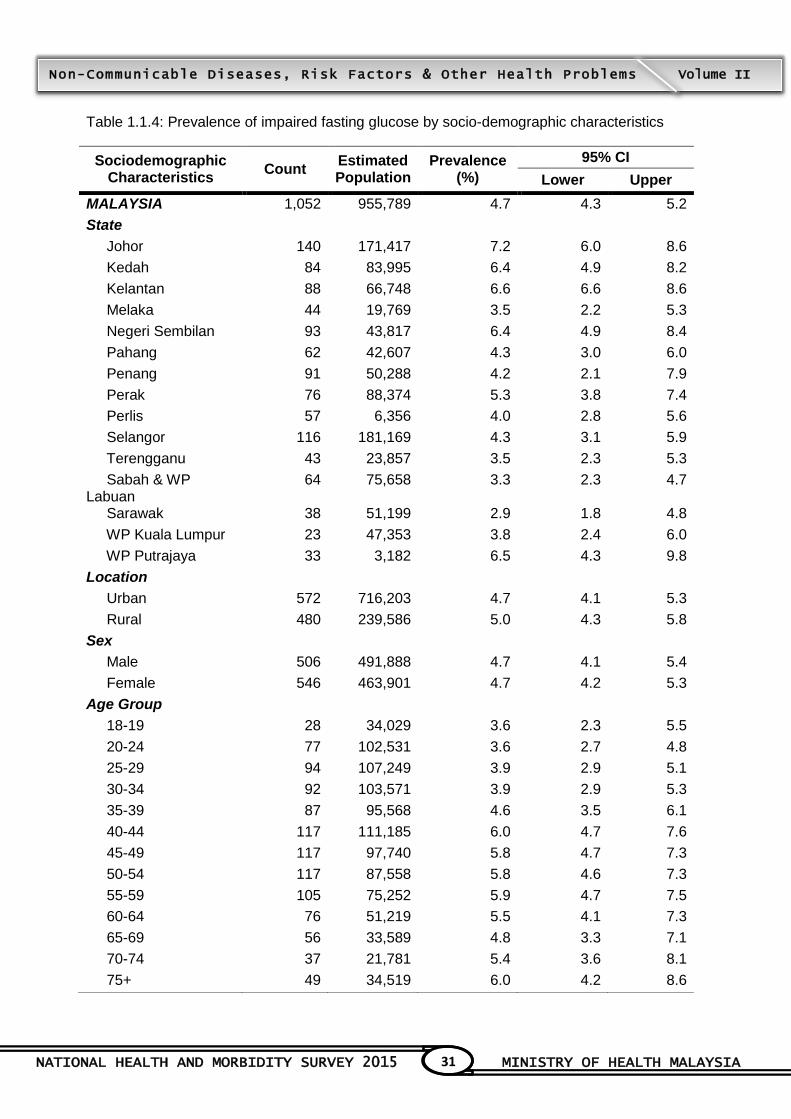
1.1.2.4 Prevalence of Impaired Fasting Glucose
For this survey, a respondent was classified as having "impaired fasting glucose" or IFG when
the respondent was not known to have diabetes and had a fasting capillary blood glucose
(FBG) of between 5.6 and less than 6.1 mmol/L.
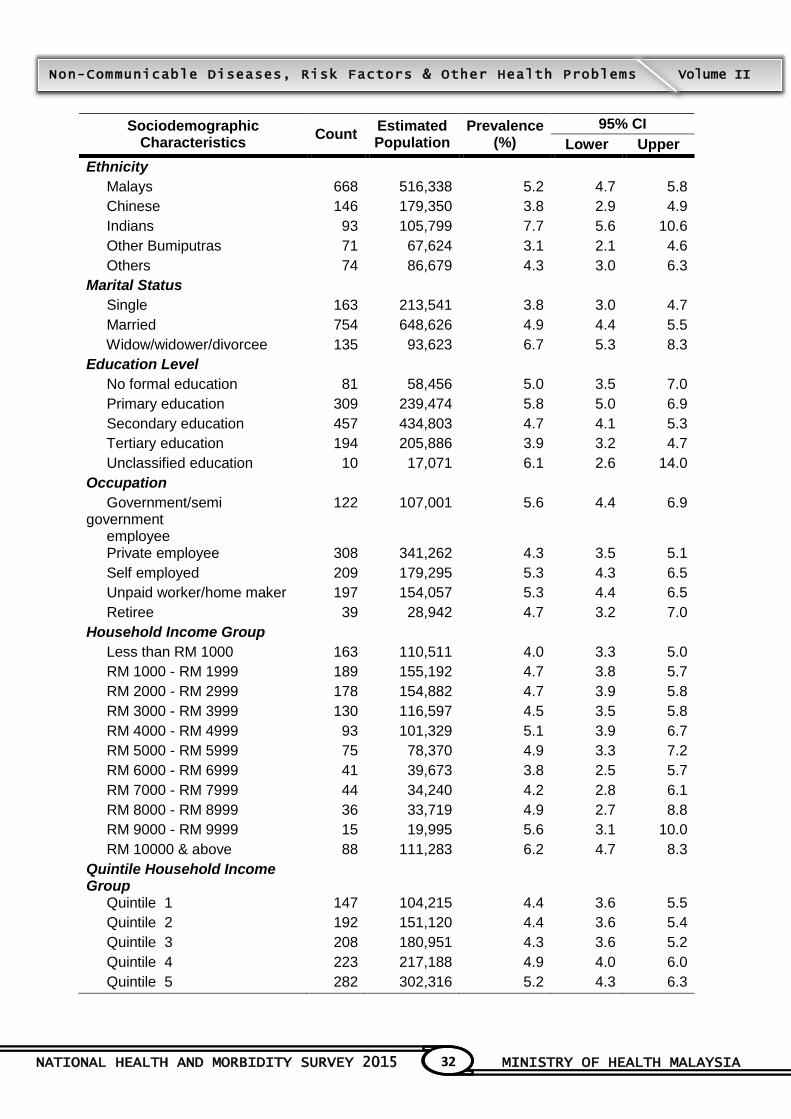
The prevalence of IFG was 4.7% (95% CI: 4.3, 5.2). The differences by age groups were not
statistically significant, hovering between 3.6% and 6.0%.
There was no significant difference in prevalence between urban and rural areas. There was
variation between states; the highest prevalence being in Johor at 7.2% (95% CI: 6.0, 8.6),
while the lowest being in Sarawak at 2.9% (95% CI: 1.8, 4.8).
No significant difference in gender was observed. By ethnicity, the Indians had the highest
prevalence at 7.7% (95% CI: 5.6, 10.6), followed by the Malays at 5.2% (95% CI: 4.7, 5.8),
Others at 4.3% (95% CI: 3.0, 6.3), and lastly the Chinese at 3.8% (95% CI: 2.9, 4.9).

NATIONAL HEALTH AND MORBIDITY SURVEY 2015 MINISTRY OF HEALTH MALAYSIA
17
Non-Communicable Diseases, Risk Factors & Other Health Problems Volume II
1.2 HYPERTENSION
1.2.1 Objectives
1.2.1.1 General Objective
To determine the prevalence of hypertension in Malaysia.
1.2.1.2 Specific Objectives
a. To determine the prevalence of overall hypertension by socio-demographic sub-groups;
b. To determine the prevalence of known hypertension by socio-demographic sub-groups;
and
c. To determine the prevalence of undiagnosed hypertension by socio-demographic
subgroups.
1.2.2 Findings
1.2.2.1 Overall Hypertension Prevalence
The hypertension survey was carried out on all respondents 18 years old and above by
questionnaire and measurement of their blood pressure using the Omron Digital Automatic
Blood Pressure Monitor Model HEM-907. A total of 19,936 respondents responded to the
hypertension questionnaire and 16,017 out of 16,681 (96.0%) respondents who claimed that
they were not hypertensive consented for the blood pressure measurement.
The overall prevalence of hypertension (known and undiagnosed) among adults of 18 years
and above in this survey was 30.3% (95% CI: 29.3, 31.2). There was a general increasing
trend in prevalence with age, from 6.7% (95% CI: 4.7, 9.4) in the 18-19 years age group,
reaching a peak of 75.4% (95% CI: 70.5, 79.7) among the 70-74 years age group.
The prevalence was significantly higher in the rural areas at 33.5% (95% CI: 31.6, 35.4)
compared to urban areas at 29.3% (95% CI: 28.2, 30.4). There was a large variation between
states, with the highest prevalence in Kedah at 37.5% (95% CI: 33.5, 41.6), followed by
Sarawak at 37.3% (95% CI: 33.7, 41.1) and Perak at 36.4% (95% CI: 33.2, 39.8), while the
lowest was Wilayah Persekutuan Putrajaya at 24.1% (95% CI: 19.0, 30.0).
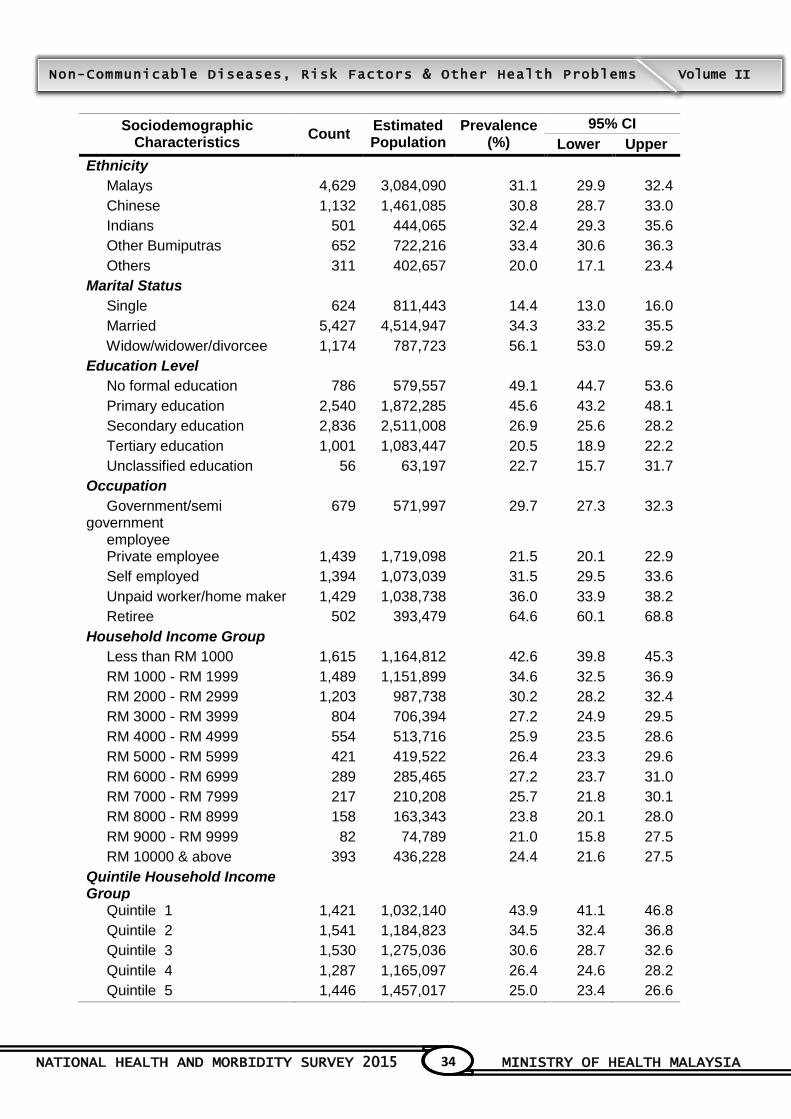
No significant difference between genders was observed with the prevalence in males being
30.8 %( 95% CI 29.5, 32.2) and females at 29.7% (95% CI 28.5, 30.9). In terms of the main
ethnic groups, the Other Bumiputras had the highest prevalence at 33.4% (95% CI: 30.6,
36.3), followed by the Indians at 32.4% (95% CI: 29.3, 35.6), Malay at 31.1% (95% CI: 29.9,
32.4), and lastly the Chinese at 30.8% (95% CI: 28.7, 33.0).
NATIONAL HEALTH AND MORBIDITY SURVEY 2015 MINISTRY OF HEALTH MALAYSIA
18
Non-Communicable Diseases, Risk Factors & Other Health Problems Volume II
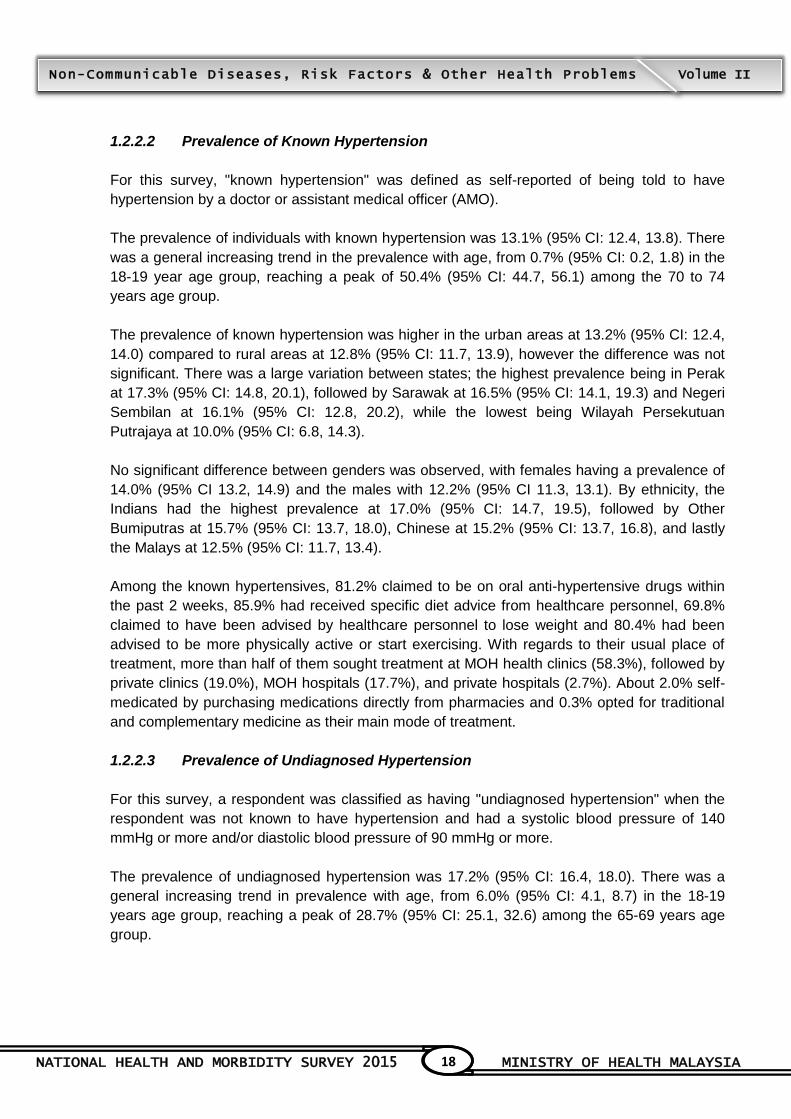
1.2.2.2 Prevalence of Known Hypertension
For this survey, "known hypertension" was defined as self-reported of being told to have
hypertension by a doctor or assistant medical officer (AMO).
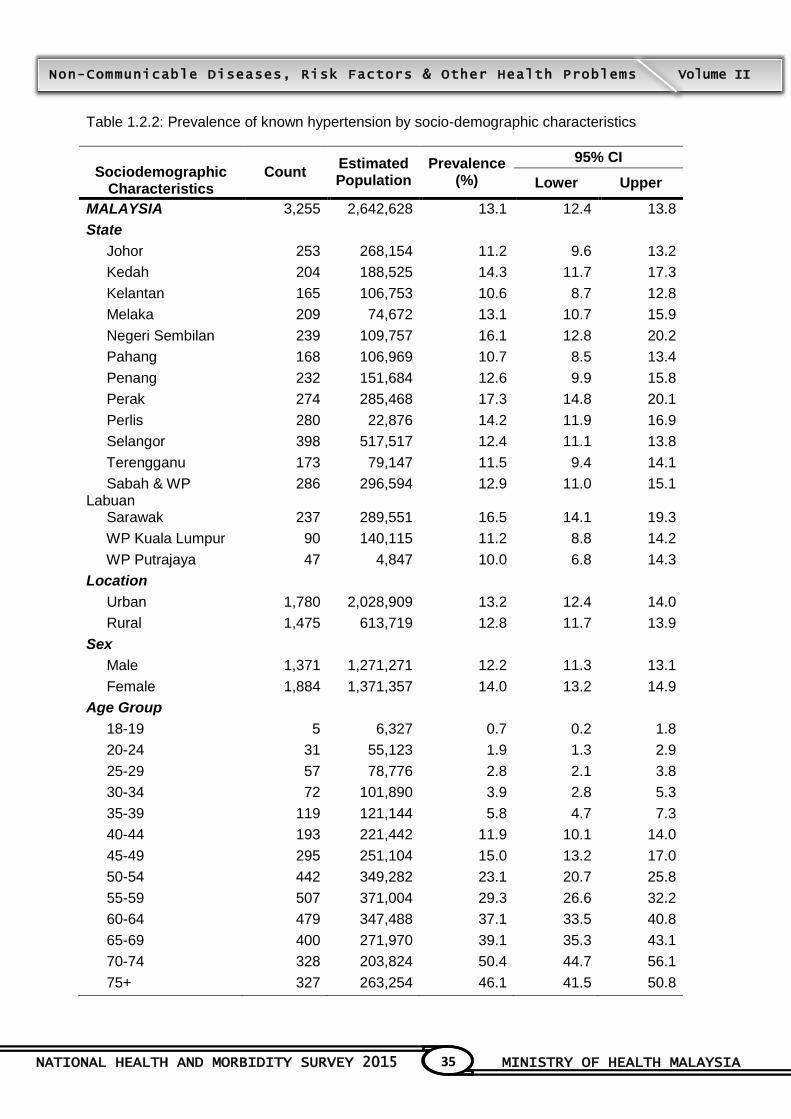
The prevalence of individuals with known hypertension was 13.1% (95% CI: 12.4, 13.8). There
was a general increasing trend in the prevalence with age, from 0.7% (95% CI: 0.2, 1.8) in the
18-19 year age group, reaching a peak of 50.4% (95% CI: 44.7, 56.1) among the 70 to 74
years age group.
The prevalence of known hypertension was higher in the urban areas at 13.2% (95% CI: 12.4,
14.0) compared to rural areas at 12.8% (95% CI: 11.7, 13.9), however the difference was not
significant. There was a large variation between states; the highest prevalence being in Perak
at 17.3% (95% CI: 14.8, 20.1), followed by Sarawak at 16.5% (95% CI: 14.1, 19.3) and Negeri
Sembilan at 16.1% (95% CI: 12.8, 20.2), while the lowest being Wilayah Persekutuan
Putrajaya at 10.0% (95% CI: 6.8, 14.3).
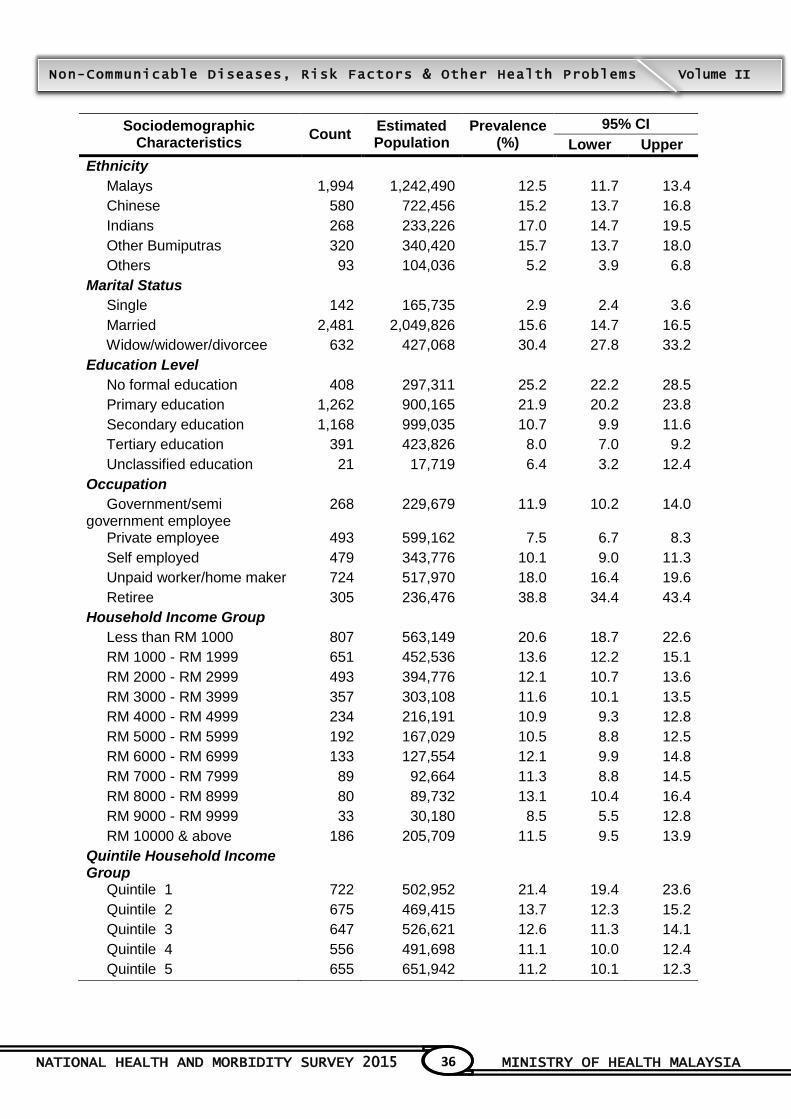
No significant difference between genders was observed, with females having a prevalence of
14.0% (95% CI 13.2, 14.9) and the males with 12.2% (95% CI 11.3, 13.1). By ethnicity, the
Indians had the highest prevalence at 17.0% (95% CI: 14.7, 19.5), followed by Other
Bumiputras at 15.7% (95% CI: 13.7, 18.0), Chinese at 15.2% (95% CI: 13.7, 16.8), and lastly
the Malays at 12.5% (95% CI: 11.7, 13.4).
Among the known hypertensives, 81.2% claimed to be on oral anti-hypertensive drugs within
the past 2 weeks, 85.9% had received specific diet advice from healthcare personnel, 69.8%
claimed to have been advised by healthcare personnel to lose weight and 80.4% had been
advised to be more physically active or start exercising. With regards to their usual place of
treatment, more than half of them sought treatment at MOH health clinics (58.3%), followed by
private clinics (19.0%), MOH hospitals (17.7%), and private hospitals (2.7%). About 2.0% self-
medicated by purchasing medications directly from pharmacies and 0.3% opted for traditional
and complementary medicine as their main mode of treatment.
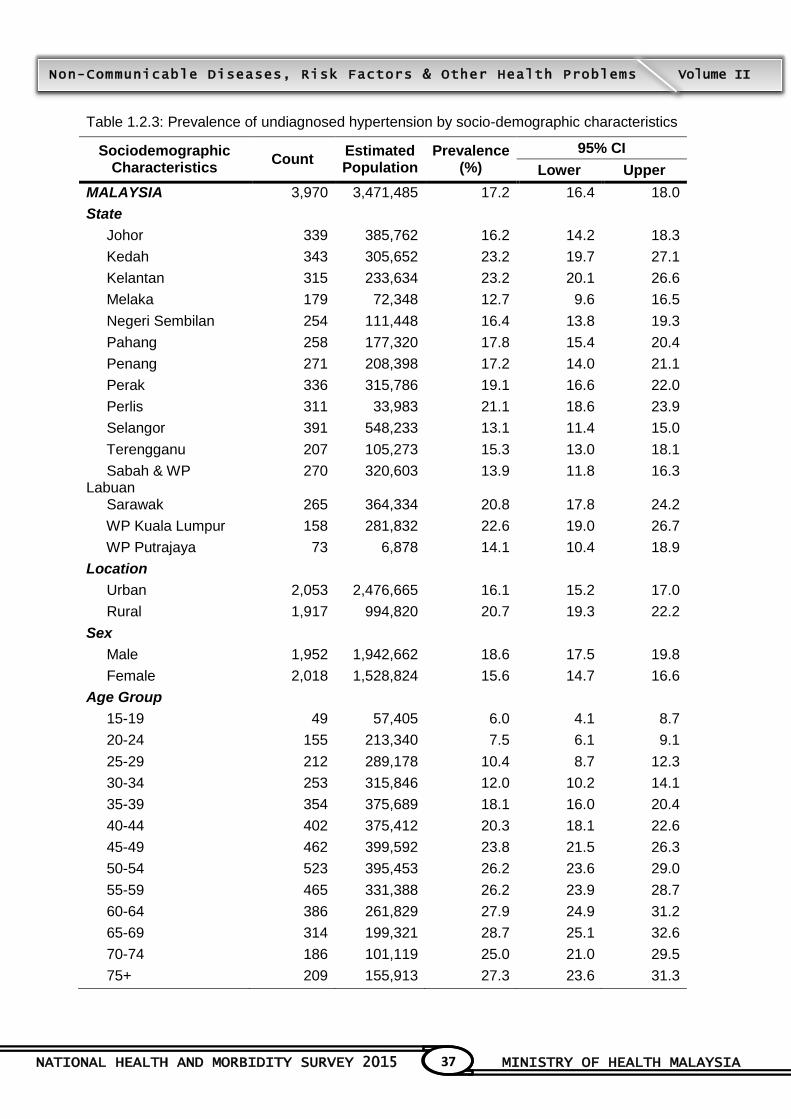
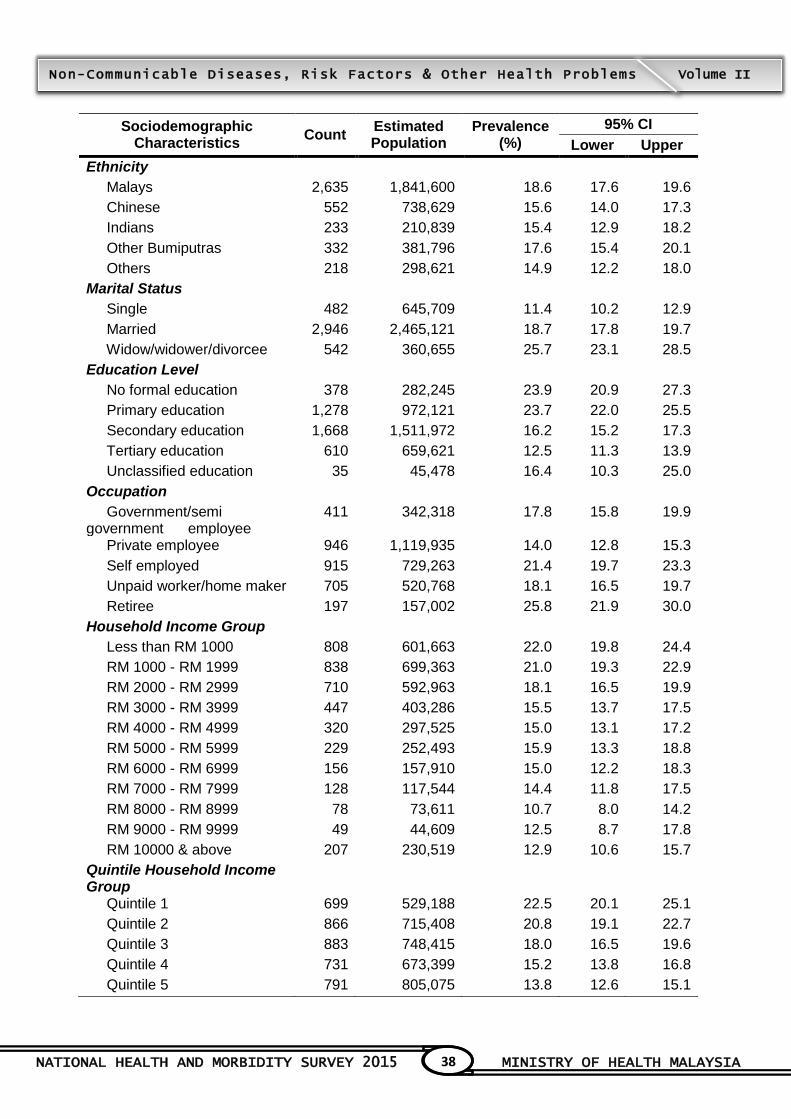
1.2.2.3 Prevalence of Undiagnosed Hypertension
For this survey, a respondent was classified as having "undiagnosed hypertension" when the
respondent was not known to have hypertension and had a systolic blood pressure of 140
mmHg or more and/or diastolic blood pressure of 90 mmHg or more.
The prevalence of undiagnosed hypertension was 17.2% (95% CI: 16.4, 18.0). There was a
general increasing trend in prevalence with age, from 6.0% (95% CI: 4.1, 8.7) in the 18-19
years age group, reaching a peak of 28.7% (95% CI: 25.1, 32.6) among the 65-69 years age
group.
NATIONAL HEALTH AND MORBIDITY SURVEY 2015 MINISTRY OF HEALTH MALAYSIA
19
Non-Communicable Diseases, Risk Factors & Other Health Problems Volume II
The prevalence was significantly higher in the rural areas at 20.7% (95% CI: 19.3, 22.2)
compared to urban areas at 16.1% (95% CI: 15.2, 17.0). There was a large variation between
states; the highest prevalence of 23.2% were in the 2 states; Kedah (95% CI9.7, 27.1) and
Kelantan (95% CI 20.1, 26.6), followed by WP Kuala Lumpur at 22.6% (95% CI: 19.0, 26.7),
while the lowest was Melaka at 12.7% (95% CI: 9.6, 16.5).
The prevalence of undiagnosed hypertension was significantly higher in males at 18.6% (95%
CI: 17.5, 19.8) compared to females at 15.6 (95% CI: 14.7, 16.6). By ethnicity, Malays had the
highest prevalence at 18.6% (95% CI: 17.6, 19.6), followed by Other Bumiputras at 17.6%
(95% CI: 15.4, 20.1), Chinese at 15.6% (95% CI: 14.0, 17.3), and lastly Indians at 15.4% (95%
CI: 12.9, 18.2).
NATIONAL HEALTH AND MORBIDITY SURVEY 2015 MINISTRY OF HEALTH MALAYSIA
20
Non-Communicable Diseases, Risk Factors & Other Health Problems Volume II
1.3 HYPERCHOLESTEROLEMIA
1.3.1 Objectives
1.3.1.1 General Objective
To determine the prevalence of hypercholesterolemia in Malaysia.
1.3.1.2 Specific Objectives
a. To determine the prevalence of overall hypercholesterolemia by socio-demographic sub-
groups;
b. To determine the prevalence of known hypercholesterolemia by socio-demographic sub-
groups; and
c. To determine the prevalence of undiagnosed hypercholesterolemia by socio-demographic
subgroups.
1.3.2 Findings
1.3.2.1 Overall Hypercholesterolemia Prevalence
The hypercholesterolemia survey was carried out on all respondents aged 18 years old and
above by questionnaire and measurement of finger-pricked total cholesterol using the
CardioChek portable blood test system. A total of 19,935 respondents responded to the
hypercholesterolemia questionnaire, and 16,225 out of 17,712 (91.6%) respondents who
claimed that they were not having high cholesterol consented for the finger-prick test.
The overall prevalence of hypercholesterolemia (known and undiagnosed) among adults of 18
years and above in this survey was 47.7% (95% CI: 46.5, 48.9). There was a general
increasing trend in the prevalence of hypercholesterolemia with age, from 22.0% (95% CI:
18.8, 25.7) in the 18-19 years age group, reaching a peak of 68.8% (95% CI: 65.9, 71.5)
among the 55-59 years age group.
The prevalence of hypercholesterolemia was comparable among respondents in the rural
47.7% (95% CI urban: 46.3, 49.2) and urban areas (95% CI rural: 45.6, 49.7). There was a
large variation between states, with the highest prevalence in Pahang at 56.2% (95% CI: 52.2,
60.3), followed by Kedah at 53.5% (95% CI: 48.5, 58.4) and WP Kuala Lumpur at 52.9% (95%
CI: 47.7, 58.1), while the lowest was Sabah and WP Labuan at 40.9 % (95% CI: 36.9, 45.0).
The prevalence was significantly higher among females at 52.2% (95% CI: 50.7, 53.7)
compared to males at 43.5% (95% CI: 42.0, 45.1). In terms of the main ethnic groups, the
Malays and Indians had the highest prevalence at both Malays and Indians had the same
prevalence of 50.1% (95% CI: 48.7, 51.5) for Malays, (95% CI: 46.2, 53.9) for Indians, and
lastly the Chinese at 47.5% (95% CI: 44.7, 50.3).
1.3.2.2 Prevalence of Known Hypercholesterolemia
For this survey, "known hypercholesterolemia" was defined as self-reported of being told to
have hypercholesterolemia by a doctor or assistant medical officer (AMO).
NATIONAL HEALTH AND MORBIDITY SURVEY 2015 MINISTRY OF HEALTH MALAYSIA
21
Non-Communicable Diseases, Risk Factors & Other Health Problems Volume II
The prevalence of individuals with known hypercholesterolemia was 9.1% (95% CI: 8.6, 9.7).
There was also a general increasing trend with age, starting from 0.2% (95% CI: 0.04, 0.7)
within the age group of 18-19 years, reaching a peak of 25.2% (95% CI: 22.1, 28.7) in the 60-
64 years age group.
The prevalence was significantly higher in the urban areas at 9.7% (95% CI: 9.0, 10.5)
compared to rural areas at 7.1% (95% CI: 6.4, 8.0). Again, there was a large variation between
states, the highest prevalence being in Perlis at 13.8% (95% CI: 11.7, 16.3), followed by
Sarawak at 12.6% (95% CI: 10.0, 15.6) and Penang at 12.2% (95% CI: 9.5, 15.4), while the
lowest was in Kelantan at 5.3% (95% CI: 4.0, 6.9).
No significant difference between genders was observed. By ethnicity, the Indians had the
highest prevalence at 12.3% (95% CI: 10.1, 14.8), followed by the Other Bumiputras at 11.2%
(95% CI: 9.2, 13.6), Chinese at 11.0% (95% CI: 9.7, 12.4), and lastly the Malays at 8.7% (95%
CI: 8.0, 9.5).
Among the known hypercholesterolemia, 66.8% claimed to be on oral drugs within the past 2
weeks, 84.4% had received specific diet advice from healthcare personnel, 70.3% claimed to
have been advised by healthcare personnel to lose weight and 81.3% have been advised to be
more physically active or start exercising. With regards to their usual place of treatment, half of
them seek treatment at MOH health clinics (50.0%), followed by private clinics (23.7%), MOH
hospitals (19.1%), and private hospitals (4.6%). About 2.3% self-medicate by purchasing
medications directly from pharmacies and 0.3% opted for traditional and complementary
medicine as their main mode of treatment.
1.3.2.3 Prevalence of Undiagnosed Hypercholesterolemia
For this survey, a respondent was classified as having "undiagnosed hypercholesterolemia"
when the respondent was not known to have hypercholesterolemia and had a total blood
cholesterol of 5.2 mmol/L or more.
The prevalence of undiagnosed hypercholesterolemia was 38.6% (95% CI: 37.4, 39.8). There
was also a general increasing trend with age starting from 21.9% (95% CI: 18.6, 25.6) at age
group of 18-19 years, reaching a peak of 48.5% (95% CI: 45.3, 51.8) at the age group of 55-59
years.
The prevalence was significantly higher in the rural areas at 40.5% (95% CI: 38.5, 42.6)
compared to urban areas at 38.0% (95% CI: 36.6, 39.4). Again there was a large variation
between states; the highest prevalence was recorded in Pahang at 50.2% (95% CI: 46.5,
53.8), followed by Kelantan at 46.5% (95% CI: 42.4, 50.6) and Kedah at 46.1% (95% CI: 41.1,
51.1), while the lowest prevalence was found in Sabah and WP Labuan at 32.6% (95% CI:
28.7, 36.8).
The prevalence of undiagnosed hypercholesterolemia was much higher in females at 42.4%
(95% CI: 41.0, 43.9) compared to males at 35.0% (95% CI: 33.6, 36.5). By ethnicity, Malays
had the highest prevalence at 41.4% (95% CI: 40.0, 42.8), followed by the Indians at 37.8%
(95% CI: 33.8, 42.0), and lastly the Chinese at 36.5% (95% CI: 33.7, 39.3).

NATIONAL HEALTH AND MORBIDITY SURVEY 2015 MINISTRY OF HEALTH MALAYSIA
22
Non-Communicable Diseases, Risk Factors & Other Health Problems Volume II
1.4 IMPLICATIONS
The overall prevalence of three major Non-Communicable Disease (NCD) risk factors remained
high; i.e. high blood sugar (diabetes) and high blood cholesterol (hypercholesterolemia) continues
to increase in Malaysia, while high blood pressure (hypertension) showed a decrease.
The prevalence of diabetes in Malaysia had increased a relative of 15%, from 15.2% (2011) to the
current 17.5%, compared to the relative increase of 31.0% between 2006 (prevalence: 11.6%) and
2011. This increase was mostly contributed by the increased proportion of "undiagnosed
diabetes", similar to 2011. Almost similar to 2011, current data shows that “undiagnosed diabetes
remains at 9.2% i.e. for every one “diagnosed diabetes”, there is one “undiagnosed diabetes” (a
ratio of 1:1).
The prevalence of "impaired fasting glucose" had remained somewhat constant, from 4.2% (2006),
4.9% (2011) to the current 4.7%.
The prevalence of diabetes in Sabah, WP Labuan and Sarawak are currently on par with several
other states in the Peninsular as compared to before year 2006 when the prevalences was much
lower in these states.
The prevalence of hypertension in Malaysia had decreased, from 32.7% (2011) to the current
30.3%, as compared to the slight increase between 2006 (prevalence: 32.2%) and 2011. However,
similar to 2011, the proportion of “undiagnosed hypertension” remains high at 17.2% i.e. for every
two “diagnosed hypertension”, there are three “undiagnosed hypertension” (a ratio of 2:3). This
ratio is similar to 2011.
The prevalence of hypercholesterolemia in Malaysia continued to increase from 32.6% in 2011 to
47.7%, a relative increase of 46%, compared to the relative increase of 58% between 2006
(prevalence: 20.7%) and 2011. The increase was mostly contributed to “undiagnosed”. The
proportion of “undiagnosed hypercholesterolemia” has increased to 38.6% from 26.6% (2011). For
every one “diagnosed hypercholesterolemia”, there were four “undiagnosed hypercholesterolemia”
(a ratio of 1:4), similar to 2011.

NATIONAL HEALTH AND MORBIDITY SURVEY 2015 MINISTRY OF HEALTH MALAYSIA
23
Non-Communicable Diseases, Risk Factors & Other Health Problems Volume II
1.5 CONCLUSION
The overall increasing or high prevalence of these three major NCD risk factors will increase the
burden of disease of NCDs in Malaysia. NCD is already the main cause of death in Malaysia and
the biggest contributor in terms of disability life-years (DALY) 1. The number of patients diagnose
with NCDs will continue to rise and they will seek treatment at all levels of care. With the
increasing economic pressure Malaysia is facing currently, it is expected that many more will turn
to the public healthcare sector for treatment.
By nature, NCDs are silent diseases, and therefore the high proportions of individuals with
undiagnosed NCD risk factors are particularly worrying. Low detection results in individuals
presenting later in the course of their disease, at an advanced stage where the risk of
complications is already high or presenting already with disease-related complications particularly
cardiovascular events such as heart attack and stroke. These patients are much more difficult and
costly to manage. Specific for diabetes, a study had shown that up to 73% of diabetes-related
healthcare costs result from hospitalization and ambulatory care, as a result of complications due
to poor blood sugar control2. With the increasing burden of NCDs, it will only be a matter of time
when our highly subsidized public healthcare system reaches its breaking point.
1.6 RECOMMENDATIONS
At the 65th World Health Assembly in May 2013, the Assembly adopted the Global Action Plan for
the Prevention and Control of Non-Communicable Diseases (GAP-NCD) 2013-20203. At the same
meeting, the Assembly also adopted the Global Monitoring Framework for NCD (GMF-NCD) with
25 indicators and nine voluntary global targets4.
Malaysia has already set the national targets for NCDs based on the voluntary global targets for
year 2025 against the baseline in 2010. The indicators relevant to this section are:
Diabetes: Prevalence of not more than 15.0%
Hypertension: Reducing the prevalence to less than 24.0%
The National Strategic Plan for Non-Communicable Diseases (NSP-NCD) 2010-2014 was
developed to strengthen Malaysia‟s response to NCD prevention and control. Based on the latest
findings, it is obvious that there are many gaps in implementation that needs to be addressed. The
post-2015 Strategic Plan is currently being developed must critically examine Malaysia‟s response
thus far to this NCD epidemic, if we are ever to achieve the ambitious global targets.
Current scientific evidence shows that increasing knowledge and awareness by themselves are
inadequate to change behaviours. Our own experiences from the various national healthy lifestyle
campaigns from early 1990s attest to this fact. We need to adopt a more aggressive approach,
combining both soft and hard policies. An effective response requires that individuals and societies
take more responsibility for their own health, while at the same time governments must take strong
action to reduce the exposure of its population to NCD risk factors through hard policies.
NATIONAL HEALTH AND MORBIDITY SURVEY 2015 MINISTRY OF HEALTH MALAYSIA
24
Non-Communicable Diseases, Risk Factors & Other Health Problems Volume II
There are many lessons that we can learn from the various hard policies currently implemented in
many countries and the scientific base of effectiveness of these interventions are rapidly
expanding. The creation of health-promoting environments requires strong political will and the
healthcare sector must continue to be strong advocates in championing hard policies for the
country.
Starting in October 2013, the Ministry of Health had embarked on an aggressive and intensified
community-based intervention, called the “Komuniti Sihat, Perkasa Negara” (“KOSPEN” or
Strengthening communities, empowering the Nation) initiative. Through a blue ocean strategy, the
MOH has collaborated with other government ministries and agencies with existing programs and
activities at the grass-root levels such as the Department of Community Development (KEMAS)
and the Community Watch (Rukun Tetangga or RT) under the Department of National Unity and
Integration (JPNIN) by establishing KOSPEN-KEMAS and KOSPEN-RT respectively. The five
main scopes of KOSPEN are healthy eating, active living, weight management, smoke-free (or not
smoking) and screening for NCD risk factors, MOH must ensure adequate resources are allocated
for KOSPEN to ensure its success.
1.7 REFERENCES
1. Noor Azah D, Mohd Azahadi O, Ummi Nadiah Y, Teh Chien Huey. 2014. Burden of
Disease Study: Estimating mortality & cause of death in Malaysia. Institute of Public Health
2. Jonsson B. Revealing the costs of type 2 diabetes in the EU and findings from 8 EU
countries. Diabetologia 2002;45:S5-S12.
3. http://www.who.int/nmh/events/ncd_action_plan/en/; accessed 4 July 2015
4. http://www.who.int/nmh/global_monitoring_framework/en/; accessed 4 July 2015
NATIONAL HEALTH AND MORBIDITY SURVEY 2015 MINISTRY OF HEALTH MALAYSIA
25
Non-Communicable Diseases, Risk Factors & Other Health Problems Volume II
Table 1.1.1: Prevalence of overall diabetes by socio-demographic characteristics
Sociodemographic Characteristics
Count Estimated Population
Prevalence (%)
95% CI
Lower Upper
MALAYSIA 4,229 3,529,804 17.5 16.6 18.3
State
Johor 421 472,454 19.8 16.8 23.3
Kedah 336 334,370 25.4 21.0 30.3
Kelantan 256 185,828 18.5 15.9 21.3
Melaka 251 95,518 16.7 13.5 20.6
Negeri Sembilan 306 131,288 19.3 16.6 22.4
Pahang 219 147,676 14.8 12.4 17.6
Penang 288 218,925 18.1 14.0 23.2
Perak 323 320,042 19.4 17.1 21.9
Perlis 370 33,090 20.6 18.0 23.5
Selangor 483 649,586 15.5 13.8 17.4
Terengganu 257 127,439 18.6 16.1 21.3
Sabah & WP Labuan
272 326,590 14.2 12.2 16.4
Sarawak 216 260,126 14.8 12.1 18.2
WP Kuala Lumpur 136 217,512 17.4 14.3 21.1
WP Putrajaya 95 9,362 19.2 15.8 23.3
Location
Urban 2,368 2,728,211 17.7 16.7 18.8
Rural 1,861 801,593 16.7 15.4 18.1
Sex
Male 1,908 1,741,166 16.7 15.7 17.8
Female 2,321 1,788,638 18.3 17.2 19.4
Age Group
18-19 47 52,477 5.5 3.9 7.7
20-24 129 167,775 5.9 4.7 7.3
25-29 202 247,025 8.9 7.5 10.5
30-34 218 278,454 10.6 8.9 12.6
35-39 252 267,966 12.9 11.1 15.0
40-44 340 331,893 17.9 15.5 20.6
45-49 438 367,890 22.0 19.6 24.6
50-54 564 407,145 27.0 24.4 29.7
55-59 576 416,832 32.9 30.1 35.9
60-64 514 358,827 38.3 34.8 41.9
65-69 403 263,755 38.0 33.7 42.4
70-74 276 158,149 39.1 33.6 44.9
75+ 270 211,617 37.0 32.6 41.7

NATIONAL HEALTH AND MORBIDITY SURVEY 2015 MINISTRY OF HEALTH MALAYSIA
26
Non-Communicable Diseases, Risk Factors & Other Health Problems Volume II
Sociodemographic Characteristics
Count Estimated Population
Prevalence (%)
95% CI
Lower Upper
Ethnicity
Malays 2,191 1,450,762 14.6 13.8 15.5
Chinese 455 569,688 12.0 10.7 13.5
Indians 350 303,228 22.1 19.2 25.3
Other Bumiputras 203 232,054 10.7 8.8 13.0
Others 123 149,589 7.4 5.9 9.4
Marital Status
Single 380 447,041 7.9 6.9 9.1
Married 3,187 2,667,950 20.3 19.3 21.3
Widow/widower/divorcee 662 414,814 29.5 27.0 32.3
Education Level
No formal education 436 328,535 27.9 24.4 31.6
Primary education 1,409 1,018,619 24.8 22.9 26.9
Secondary education 1,736 1,517,874 16.2 15.2 17.4
Tertiary education 609 633,703 12.0 10.7 13.4
Unclassified education 36 28,993 10.4 6.4 16.6
Occupation
Government/semi government employee
390 332,575 17.3 15.2 19.6
Private employee 836 970,047 12.1 11.0 13.3
Self employed 791 603,557 17.7 16.1 19.5
Unpaid worker/home maker 853 643,467 22.3 20.5 24.2
Retiree 317 232,880 38.2 34.0 42.6
Household Income Group
Less than RM 1000 865 603,884 22.1 20.0 24.3
RM 1000 - RM 1999 838 615,880 18.5 16.9 20.3
RM 2000 - RM 2999 707 593,166 18.1 16.3 20.1
RM 3000 - RM 3999 544 453,604 17.4 15.5 19.6
RM 4000 - RM 4999 330 331,025 16.7 14.4 19.3
RM 5000 - RM 5999 263 240,802 15.1 12.9 17.7
RM 6000 - RM 6999 171 163,310 15.5 12.6 19.1
RM 7000 - RM 7999 143 127,326 15.6 12.3 19.6
RM 8000 - RM 8999 102 101,960 14.9 11.8 18.5
RM 9000 - RM 9999 57 69,078 19.4 14.2 26.0
RM 10000 & above 209 229,769 12.9 10.8 15.3
Quintile Household Income Group
Quintile 1 758 519,581 22.1 19.9 24.5
Quintile 2 862 645,310 18.8 17.2 20.5
Quintile 3 907 762,122 18.3 16.7 20.0
Quintile 4 811 731,878 16.6 15.1 18.2
Quintile 5 891 870,914 14.9 13.6 16.4
NATIONAL HEALTH AND MORBIDITY SURVEY 2015 MINISTRY OF HEALTH MALAYSIA
27
Non-Communicable Diseases, Risk Factors & Other Health Problems Volume II
Table 1.1.2: Prevalence of known diabetes by socio-demographic characteristics
Sociodemographic Characteristics
Count Estimated Population
Prevalence (%)
95% CI
Lower Upper
MALAYSIA 2,126 1,678,680 8.3 7.8 8.8
State
Johor 198 210,510 8.8 7.3 10.7
Kedah 142 122,462 9.3 7.8 11.1
Kelantan 112 71,799 7.1 6.1 8.4
Melaka 140 47,535 8.3 6.7 10.4
Negeri Sembilan 174 71,451 10.5 8.5 12.9
Pahang 98 62,338 6.3 4.9 7.9
Penang 141 109,040 9.0 7.3 11.1
Perak 192 197,158 11.9 9.9 14.3
Perlis 206 17,555 10.9 9.3 12.7
Selangor 266 325,876 7.8 6.6 9.1
Terengganu 127 59,422 8.7 7.0 10.7
Sabah & WP Labuan
122 134,998 5.9 4.7 7.4
Sarawak 117 144,868 8.3 6.3 10.8
WP Kuala Lumpur 67 101,090 8.1 6.1 10.7
WP Putrajaya 24 2,578 5.3 3.3 8.5
Location
Urban 1,209 1,332,094 8.7 8.0 9.3
Rural 917 346,586 7.2 6.6 7.9
Sex
Male 905 792,152 7.6 7.0 8.3
Female 1,221 886,529 9.1 8.4 9.8
Age Group
18-19 1 240 0.0 0.0 0.2
20-24 12 19,282 0.7 0.3 1.5
25-29 31 40,024 1.4 1.0 2.2
30-34 50 89,377 3.4 2.4 4.8
35-39 71 71,473 3.4 2.6 4.5
40-44 133 128,803 6.9 5.6 8.6
45-49 199 175,193 10.5 8.9 12.2
50-54 301 223,644 14.8 12.8 17.1
55-59 351 260,301 20.6 18.2 23.2
60-64 337 248,462 26.5 23.3 30.0
65-69 268 169,304 24.4 21.0 28.1
70-74 194 113,024 27.9 22.7 33.9
75+ 178 139,554 24.4 20.5 28.8

NATIONAL HEALTH AND MORBIDITY SURVEY 2015 MINISTRY OF HEALTH MALAYSIA
28
Non-Communicable Diseases, Risk Factors & Other Health Problems Volume II
Sociodemographic Characteristics
Count Estimated Population
Prevalence (%)
95% CI
Lower Upper
Ethnicity
Malays 1,395 894,514 9.0 8.4 9.7
Chinese 300 365,693 7.7 6.7 8.9
Indians 254 219,258 16.0 13.7 18.6
Other Bumiputras 130 148,051 6.8 5.3 8.8
Others 47 51,166 2.5 1.7 3.8
Marital Status
Single 76 83,482 1.5 1.1 2.0
Married 1,648 1,349,204 10.3 9.6 11.0
Widow/widower/divorcee 402 245,995 17.5 15.4 19.9
Education Level
No formal education 243 176,741 15.0 12.3 18.2
Primary education 812 562,459 13.7 12.4 15.1
Secondary education 798 674,946 7.2 6.6 7.9
Tertiary education 258 256,784 4.9 4.1 5.7
Unclassified education 14 7,451 2.7 1.4 5.2
Occupation
Government/semi government employee
190 174,927 9.1 7.7 10.7
Private employee 300 322,970 4.0 3.5 4.7
Self employed 312 231,767 6.8 5.9 7.8
Unpaid worker/home maker 468 347,288 12.0 10.7 13.5
Retiree 211 160,214 26.3 22.7 30.2
Household Income Group
Less than RM 1000 507 335,251 12.2 10.7 14.0
RM 1000 - RM 1999 433 291,589 8.8 7.7 10.0
RM 2000 - RM 2999 322 253,006 7.7 6.6 9.1
RM 3000 - RM 3999 263 205,409 7.9 6.7 9.3
RM 4000 - RM 4999 156 145,819 7.4 6.0 9.0
RM 5000 - RM 5999 118 110,983 7.0 5.5 8.8
RM 6000 - RM 6999 79 78,004 7.4 5.7 9.7
RM 7000 - RM 7999 59 59,090 7.2 5.3 9.7
RM 8000 - RM 8999 51 56,336 8.2 6.0 11.3
RM 9000 - RM 9999 22 24,765 7.0 4.4 10.9
RM 10000 & above 116 118,429 6.6 5.2 8.3
Quintile Household Income Group
Quintile 1 454 295,594 12.6 10.9 14.4
Quintile 2 444 304,309 8.9 7.8 10.1
Quintile 3 420 334,861 8.0 7.0 9.2
Quintile 4 387 320,390 7.3 6.4 8.2
Quintile 5 421 423,527 7.3 6.4 8.2
NATIONAL HEALTH AND MORBIDITY SURVEY 2015 MINISTRY OF HEALTH MALAYSIA
29
Non-Communicable Diseases, Risk Factors & Other Health Problems Volume II
Table 1.1.3: Prevalence of undiagnosed diabetes by socio-demographic characteristics
Sociodemographic Characteristics
Count Estimated Population
Prevalence (%)
95% CI
Lower Upper
MALAYSIA 2,103 1,851,124 9.2 8.5 9.9
State
Johor 223 261,944 11.0 8.8 13.7
Kedah 194 211,908 16.1 12.3 20.7
Kelantan 144 114,029 11.3 9.2 13.9
Melaka 111 47,982 8.4 6.0 11.7
Negeri Sembilan 132 59,837 8.8 7.2 10.8
Pahang 121 85,338 8.6 6.4 11.3
Penang 147 109,885 9.1 5.9 13.9
Perak 131 122,884 7.4 6.2 8.9
Perlis 164 15,535 9.7 7.8 11.9
Selangor 217 323,710 7.7 6.4 9.3
Terengganu 130 68,017 9.9 7.6 12.9
Sabah & WP Labuan
150 191,592 8.3 6.7 10.3
Sarawak 99 115,258 6.6 5.1 8.5
WP Kuala Lumpur
69 116,422 9.3 6.9 12.5
WP Putrajaya 71 6,784 13.9 11.1 17.4
Location
Urban 1,159 1,396,116 9.1 8.3 9.9
Rural 944 455,007 9.5 8.5 10.6
Sex
Male 1,003 949,015 9.1 8.3 10.0
Female 1,100 902,109 9.2 8.4 10.1
Age Group
18-19 46 52,237 5.5 3.9 7.7
20-24 117 148,493 5.2 4.1 6.5
25-29 171 207,001 7.4 6.1 9.0
30-34 168 189,077 7.2 5.8 8.9
35-39 181 196,494 9.5 7.9 11.3
40-44 207 203,091 11.0 8.9 13.5
45-49 239 192,697 11.5 9.7 13.6
50-54 263 183,500 12.2 10.4 14.2
55-59 225 156,531 12.4 10.5 14.5
60-64 177 110,365 11.8 9.7 14.2
65-69 135 94,451 13.6 10.7 17.1
70-74 82 45,126 11.2 8.3 14.8
75+ 92 72,063 12.6 10.1 15.7

NATIONAL HEALTH AND MORBIDITY SURVEY 2015 MINISTRY OF HEALTH MALAYSIA
30
Non-Communicable Diseases, Risk Factors & Other Health Problems Volume II
Sociodemographic Characteristics
Count Estimated Population
Prevalence (%)
95% CI
Lower Upper
Ethnicity
Malays 1,353 972,628 9.8 9.1 10.6
Chinese 278 367,393 7.7 6.4 9.4
Indians 180 163,889 11.9 9.5 14.9
Other Bumiputras 160 174,327 8.1 6.6 9.8
Others 132 172,887 8.6 6.7 11.1
Marital Status
Single 304 363,559 6.4 5.5 7.6
Married 1,539 1,318,746 10.0 9.2 10.9
Widow/widower/divorcee 260 168,819 12.0 10.2 14.2
Education Level
No formal education 193 151,794 12.9 10.5 15.7
Primary education 597 456,160 11.1 9.8 12.5
Secondary education 938 842,928 9.0 8.2 10.0
Tertiary education 351 376,919 7.1 6.2 8.3
Unclassified education 22 21,542 7.8 4.3 13.7
Occupation
Government/semi government employee
200 157,647 8.2 6.8 9.8
Private employee 536 647,077 8.1 7.2 9.1
Self employed 479 371,790 10.9 9.6 12.4
Unpaid worker/home maker 385 296,180 10.3 9.0 11.8
Retiree 106 72,666 11.9 9.3 15.1
Household Income Group
Less than RM 1000 358 268,633 9.8 8.5 11.3
RM 1000 - RM 1999 405 324,291 9.8 8.5 11.2
RM 2000 - RM 2999 385 340,160 10.4 9.1 11.9
RM 3000 - RM 3999 281 248,195 9.5 8.0 11.3
RM 4000 - RM 4999 174 185,205 9.4 7.4 11.8
RM 5000 - RM 5999 145 129,819 8.2 6.5 10.2
RM 6000 - RM 6999 92 85,307 8.1 5.9 11.1
RM 7000 - RM 7999 84 68,236 8.4 6.1 11.3
RM 8000 - RM 8999 51 45,624 6.7 4.8 9.1
RM 9000 - RM 9999 35 44,313 12.5 7.9 19.2
RM 10000 & above 93 111,340 6.2 4.6 8.4
Quintile Household Income Group
Quintile 1 304 223,987 9.5 8.2 11.1
Quintile 2 418 341,001 9.9 8.7 11.3
Quintile 3 487 427,261 10.3 9.0 11.6
Quintile 4 424 411,488 9.3 8.0 10.8
Quintile 5 470 447,387 7.7 6.6 8.8
NATIONAL HEALTH AND MORBIDITY SURVEY 2015 MINISTRY OF HEALTH MALAYSIA
31
Non-Communicable Diseases, Risk Factors & Other Health Problems Volume II
Table 1.1.4: Prevalence of impaired fasting glucose by socio-demographic characteristics
Sociodemographic Characteristics
Count Estimated Population
Prevalence (%)
95% CI
Lower Upper
MALAYSIA 1,052 955,789 4.7 4.3 5.2
State
Johor 140 171,417 7.2 6.0 8.6
Kedah 84 83,995 6.4 4.9 8.2
Kelantan 88 66,748 6.6 6.6 8.6
Melaka 44 19,769 3.5 2.2 5.3
Negeri Sembilan 93 43,817 6.4 4.9 8.4
Pahang 62 42,607 4.3 3.0 6.0
Penang 91 50,288 4.2 2.1 7.9
Perak 76 88,374 5.3 3.8 7.4
Perlis 57 6,356 4.0 2.8 5.6
Selangor 116 181,169 4.3 3.1 5.9
Terengganu 43 23,857 3.5 2.3 5.3
Sabah & WP Labuan
64 75,658 3.3 2.3 4.7
Sarawak 38 51,199 2.9 1.8 4.8
WP Kuala Lumpur 23 47,353 3.8 2.4 6.0
WP Putrajaya 33 3,182 6.5 4.3 9.8
Location
Urban 572 716,203 4.7 4.1 5.3
Rural 480 239,586 5.0 4.3 5.8
Sex
Male 506 491,888 4.7 4.1 5.4
Female 546 463,901 4.7 4.2 5.3
Age Group
18-19 28 34,029 3.6 2.3 5.5
20-24 77 102,531 3.6 2.7 4.8
25-29 94 107,249 3.9 2.9 5.1
30-34 92 103,571 3.9 2.9 5.3
35-39 87 95,568 4.6 3.5 6.1
40-44 117 111,185 6.0 4.7 7.6
45-49 117 97,740 5.8 4.7 7.3
50-54 117 87,558 5.8 4.6 7.3
55-59 105 75,252 5.9 4.7 7.5
60-64 76 51,219 5.5 4.1 7.3
65-69 56 33,589 4.8 3.3 7.1
70-74 37 21,781 5.4 3.6 8.1
75+ 49 34,519 6.0 4.2 8.6
NATIONAL HEALTH AND MORBIDITY SURVEY 2015 MINISTRY OF HEALTH MALAYSIA
32
Non-Communicable Diseases, Risk Factors & Other Health Problems Volume II
Sociodemographic Characteristics
Count Estimated Population
Prevalence (%)
95% CI
Lower Upper
Ethnicity
Malays 668 516,338 5.2 4.7 5.8
Chinese 146 179,350 3.8 2.9 4.9
Indians 93 105,799 7.7 5.6 10.6
Other Bumiputras 71 67,624 3.1 2.1 4.6
Others 74 86,679 4.3 3.0 6.3
Marital Status
Single 163 213,541 3.8 3.0 4.7
Married 754 648,626 4.9 4.4 5.5
Widow/widower/divorcee 135 93,623 6.7 5.3 8.3
Education Level
No formal education 81 58,456 5.0 3.5 7.0
Primary education 309 239,474 5.8 5.0 6.9
Secondary education 457 434,803 4.7 4.1 5.3
Tertiary education 194 205,886 3.9 3.2 4.7
Unclassified education 10 17,071 6.1 2.6 14.0
Occupation
Government/semi government employee
122 107,001 5.6 4.4 6.9
Private employee 308 341,262 4.3 3.5 5.1
Self employed 209 179,295 5.3 4.3 6.5
Unpaid worker/home maker 197 154,057 5.3 4.4 6.5
Retiree 39 28,942 4.7 3.2 7.0
Household Income Group
Less than RM 1000 163 110,511 4.0 3.3 5.0
RM 1000 - RM 1999 189 155,192 4.7 3.8 5.7
RM 2000 - RM 2999 178 154,882 4.7 3.9 5.8
RM 3000 - RM 3999 130 116,597 4.5 3.5 5.8
RM 4000 - RM 4999 93 101,329 5.1 3.9 6.7
RM 5000 - RM 5999 75 78,370 4.9 3.3 7.2
RM 6000 - RM 6999 41 39,673 3.8 2.5 5.7
RM 7000 - RM 7999 44 34,240 4.2 2.8 6.1
RM 8000 - RM 8999 36 33,719 4.9 2.7 8.8
RM 9000 - RM 9999 15 19,995 5.6 3.1 10.0
RM 10000 & above 88 111,283 6.2 4.7 8.3
Quintile Household Income Group
Quintile 1 147 104,215 4.4 3.6 5.5
Quintile 2 192 151,120 4.4 3.6 5.4
Quintile 3 208 180,951 4.3 3.6 5.2
Quintile 4 223 217,188 4.9 4.0 6.0
Quintile 5 282 302,316 5.2 4.3 6.3

NATIONAL HEALTH AND MORBIDITY SURVEY 2015 MINISTRY OF HEALTH MALAYSIA
33
Non-Communicable Diseases, Risk Factors & Other Health Problems Volume II
Table 1.2.1 Prevalence of overall hypertension by socio-demographic characteristics
Sociodemographic Characteristics
Count Estimated Population
Prevalence (%)
95% CI
Lower Upper
MALAYSIA 7,225 6,114,113 30.3 29.3 31.2
State
Johor 592 653,917 27.4 24.6 30.4
Kedah 547 494,177 37.5 33.5 41.6
Kelantan 480 340,387 33.8 30.1 37.7
Melaka 388 147,020 25.8 21.8 30.2
Negeri Sembilan 493 221,205 32.5 28.2 37.2
Pahang 426 284,288 28.5 25.2 32.1
Penang 503 360,082 29.8 26.0 33.9
Perak 610 601,255 36.4 33.2 39.8
Perlis 591 56,859 35.4 31.9 38.9
Selangor 789 1,065,750 25.5 23.4 27.7
Terengganu 380 184,419 26.9 23.7 30.3
Sabah & WP Labuan
556 617,197 26.8 23.8 30.0
Sarawak 502 653,885 37.3 33.7 41.1
WP Kuala Lumpur 248 421,947 33.8 29.7 38.2
WP Putrajaya 120 11,724 24.1 19.0 30.0
Location
Urban 3,833 4,505,574 29.3 28.2 30.4
Rural 3,392 1,608,540 33.5 31.6 35.4
Sex
Male 3,323 3,213,932 30.8 29.5 32.2
Female 3,902 2,900,181 29.7 28.5 30.9
Age Group
18-19 54 63,732 6.7 4.7 9.4
20-24 186 268,463 9.4 7.8 11.3
25-29 269 367,953 13.2 11.4 15.3
30-34 325 417,736 15.9 13.9 18.2
35-39 473 496,833 23.9 21.7 26.3
40-44 595 596,853 32.2 29.4 35.1
45-49 757 650,697 38.8 36.1 41.7
50-54 965 744,734 49.3 46.3 52.4
55-59 972 702,392 55.5 52.6 58.4
60-64 865 609,317 65.0 61.4 68.4
65-69 714 471,292 67.8 63.7 71.7
70-74 514 304,943 75.4 70.5 79.7
75+ 536 419,168 73.4 68.9 77.4
NATIONAL HEALTH AND MORBIDITY SURVEY 2015 MINISTRY OF HEALTH MALAYSIA
34
Non-Communicable Diseases, Risk Factors & Other Health Problems Volume II
Sociodemographic Characteristics
Count Estimated Population
Prevalence (%)
95% CI
Lower Upper
Ethnicity
Malays 4,629 3,084,090 31.1 29.9 32.4
Chinese 1,132 1,461,085 30.8 28.7 33.0
Indians 501 444,065 32.4 29.3 35.6
Other Bumiputras 652 722,216 33.4 30.6 36.3
Others 311 402,657 20.0 17.1 23.4
Marital Status
Single 624 811,443 14.4 13.0 16.0
Married 5,427 4,514,947 34.3 33.2 35.5
Widow/widower/divorcee 1,174 787,723 56.1 53.0 59.2
Education Level
No formal education 786 579,557 49.1 44.7 53.6
Primary education 2,540 1,872,285 45.6 43.2 48.1
Secondary education 2,836 2,511,008 26.9 25.6 28.2
Tertiary education 1,001 1,083,447 20.5 18.9 22.2
Unclassified education 56 63,197 22.7 15.7 31.7
Occupation
Government/semi government employee
679 571,997 29.7 27.3 32.3
Private employee 1,439 1,719,098 21.5 20.1 22.9
Self employed 1,394 1,073,039 31.5 29.5 33.6
Unpaid worker/home maker 1,429 1,038,738 36.0 33.9 38.2
Retiree 502 393,479 64.6 60.1 68.8
Household Income Group
Less than RM 1000 1,615 1,164,812 42.6 39.8 45.3
RM 1000 - RM 1999 1,489 1,151,899 34.6 32.5 36.9
RM 2000 - RM 2999 1,203 987,738 30.2 28.2 32.4
RM 3000 - RM 3999 804 706,394 27.2 24.9 29.5
RM 4000 - RM 4999 554 513,716 25.9 23.5 28.6
RM 5000 - RM 5999 421 419,522 26.4 23.3 29.6
RM 6000 - RM 6999 289 285,465 27.2 23.7 31.0
RM 7000 - RM 7999 217 210,208 25.7 21.8 30.1
RM 8000 - RM 8999 158 163,343 23.8 20.1 28.0
RM 9000 - RM 9999 82 74,789 21.0 15.8 27.5
RM 10000 & above 393 436,228 24.4 21.6 27.5
Quintile Household Income Group
Quintile 1 1,421 1,032,140 43.9 41.1 46.8
Quintile 2 1,541 1,184,823 34.5 32.4 36.8
Quintile 3 1,530 1,275,036 30.6 28.7 32.6
Quintile 4 1,287 1,165,097 26.4 24.6 28.2
Quintile 5 1,446 1,457,017 25.0 23.4 26.6
NATIONAL HEALTH AND MORBIDITY SURVEY 2015 MINISTRY OF HEALTH MALAYSIA
35
Non-Communicable Diseases, Risk Factors & Other Health Problems Volume II
Table 1.2.2: Prevalence of known hypertension by socio-demographic characteristics
Sociodemographic
Characteristics Count
Estimated Population
Prevalence (%)
95% CI
Lower Upper
MALAYSIA 3,255 2,642,628 13.1 12.4 13.8
State
Johor 253 268,154 11.2 9.6 13.2
Kedah 204 188,525 14.3 11.7 17.3
Kelantan 165 106,753 10.6 8.7 12.8
Melaka 209 74,672 13.1 10.7 15.9
Negeri Sembilan 239 109,757 16.1 12.8 20.2
Pahang 168 106,969 10.7 8.5 13.4
Penang 232 151,684 12.6 9.9 15.8
Perak 274 285,468 17.3 14.8 20.1
Perlis 280 22,876 14.2 11.9 16.9
Selangor 398 517,517 12.4 11.1 13.8
Terengganu 173 79,147 11.5 9.4 14.1
Sabah & WP Labuan
286 296,594 12.9 11.0 15.1
Sarawak 237 289,551 16.5 14.1 19.3
WP Kuala Lumpur 90 140,115 11.2 8.8 14.2
WP Putrajaya 47 4,847 10.0 6.8 14.3
Location
Urban 1,780 2,028,909 13.2 12.4 14.0
Rural 1,475 613,719 12.8 11.7 13.9
Sex
Male 1,371 1,271,271 12.2 11.3 13.1
Female 1,884 1,371,357 14.0 13.2 14.9
Age Group
18-19 5 6,327 0.7 0.2 1.8
20-24 31 55,123 1.9 1.3 2.9
25-29 57 78,776 2.8 2.1 3.8
30-34 72 101,890 3.9 2.8 5.3
35-39 119 121,144 5.8 4.7 7.3
40-44 193 221,442 11.9 10.1 14.0
45-49 295 251,104 15.0 13.2 17.0
50-54 442 349,282 23.1 20.7 25.8
55-59 507 371,004 29.3 26.6 32.2
60-64 479 347,488 37.1 33.5 40.8
65-69 400 271,970 39.1 35.3 43.1
70-74 328 203,824 50.4 44.7 56.1
75+ 327 263,254 46.1 41.5 50.8
NATIONAL HEALTH AND MORBIDITY SURVEY 2015 MINISTRY OF HEALTH MALAYSIA
36
Non-Communicable Diseases, Risk Factors & Other Health Problems Volume II
Sociodemographic Characteristics
Count Estimated Population
Prevalence (%)
95% CI
Lower Upper
Ethnicity
Malays 1,994 1,242,490 12.5 11.7 13.4
Chinese 580 722,456 15.2 13.7 16.8
Indians 268 233,226 17.0 14.7 19.5
Other Bumiputras 320 340,420 15.7 13.7 18.0
Others 93 104,036 5.2 3.9 6.8
Marital Status
Single 142 165,735 2.9 2.4 3.6
Married 2,481 2,049,826 15.6 14.7 16.5
Widow/widower/divorcee 632 427,068 30.4 27.8 33.2
Education Level
No formal education 408 297,311 25.2 22.2 28.5
Primary education 1,262 900,165 21.9 20.2 23.8
Secondary education 1,168 999,035 10.7 9.9 11.6
Tertiary education 391 423,826 8.0 7.0 9.2
Unclassified education 21 17,719 6.4 3.2 12.4
Occupation
Government/semi government employee
268 229,679 11.9 10.2 14.0
Private employee 493 599,162 7.5 6.7 8.3
Self employed 479 343,776 10.1 9.0 11.3
Unpaid worker/home maker 724 517,970 18.0 16.4 19.6
Retiree 305 236,476 38.8 34.4 43.4
Household Income Group
Less than RM 1000 807 563,149 20.6 18.7 22.6
RM 1000 - RM 1999 651 452,536 13.6 12.2 15.1
RM 2000 - RM 2999 493 394,776 12.1 10.7 13.6
RM 3000 - RM 3999 357 303,108 11.6 10.1 13.5
RM 4000 - RM 4999 234 216,191 10.9 9.3 12.8
RM 5000 - RM 5999 192 167,029 10.5 8.8 12.5
RM 6000 - RM 6999 133 127,554 12.1 9.9 14.8
RM 7000 - RM 7999 89 92,664 11.3 8.8 14.5
RM 8000 - RM 8999 80 89,732 13.1 10.4 16.4
RM 9000 - RM 9999 33 30,180 8.5 5.5 12.8
RM 10000 & above 186 205,709 11.5 9.5 13.9
Quintile Household Income Group
Quintile 1 722 502,952 21.4 19.4 23.6
Quintile 2 675 469,415 13.7 12.3 15.2
Quintile 3 647 526,621 12.6 11.3 14.1
Quintile 4 556 491,698 11.1 10.0 12.4
Quintile 5 655 651,942 11.2 10.1 12.3
NATIONAL HEALTH AND MORBIDITY SURVEY 2015 MINISTRY OF HEALTH MALAYSIA
37
Non-Communicable Diseases, Risk Factors & Other Health Problems Volume II
Table 1.2.3: Prevalence of undiagnosed hypertension by socio-demographic characteristics
Sociodemographic Characteristics
Count Estimated Population
Prevalence (%)
95% CI
Lower Upper
MALAYSIA 3,970 3,471,485 17.2 16.4 18.0
State
Johor 339 385,762 16.2 14.2 18.3
Kedah 343 305,652 23.2 19.7 27.1
Kelantan 315 233,634 23.2 20.1 26.6
Melaka 179 72,348 12.7 9.6 16.5
Negeri Sembilan 254 111,448 16.4 13.8 19.3
Pahang 258 177,320 17.8 15.4 20.4
Penang 271 208,398 17.2 14.0 21.1
Perak 336 315,786 19.1 16.6 22.0
Perlis 311 33,983 21.1 18.6 23.9
Selangor 391 548,233 13.1 11.4 15.0
Terengganu 207 105,273 15.3 13.0 18.1
Sabah & WP Labuan
270 320,603 13.9 11.8 16.3
Sarawak 265 364,334 20.8 17.8 24.2
WP Kuala Lumpur 158 281,832 22.6 19.0 26.7
WP Putrajaya 73 6,878 14.1 10.4 18.9
Location
Urban 2,053 2,476,665 16.1 15.2 17.0
Rural 1,917 994,820 20.7 19.3 22.2
Sex
Male 1,952 1,942,662 18.6 17.5 19.8
Female 2,018 1,528,824 15.6 14.7 16.6
Age Group
15-19 49 57,405 6.0 4.1 8.7
20-24 155 213,340 7.5 6.1 9.1
25-29 212 289,178 10.4 8.7 12.3
30-34 253 315,846 12.0 10.2 14.1
35-39 354 375,689 18.1 16.0 20.4
40-44 402 375,412 20.3 18.1 22.6
45-49 462 399,592 23.8 21.5 26.3
50-54 523 395,453 26.2 23.6 29.0
55-59 465 331,388 26.2 23.9 28.7
60-64 386 261,829 27.9 24.9 31.2
65-69 314 199,321 28.7 25.1 32.6
70-74 186 101,119 25.0 21.0 29.5
75+ 209 155,913 27.3 23.6 31.3
NATIONAL HEALTH AND MORBIDITY SURVEY 2015 MINISTRY OF HEALTH MALAYSIA
38
Non-Communicable Diseases, Risk Factors & Other Health Problems Volume II
Sociodemographic Characteristics
Count Estimated Population
Prevalence (%)
95% CI
Lower Upper
Ethnicity
Malays 2,635 1,841,600 18.6 17.6 19.6
Chinese 552 738,629 15.6 14.0 17.3
Indians 233 210,839 15.4 12.9 18.2
Other Bumiputras 332 381,796 17.6 15.4 20.1
Others 218 298,621 14.9 12.2 18.0
Marital Status
Single 482 645,709 11.4 10.2 12.9
Married 2,946 2,465,121 18.7 17.8 19.7
Widow/widower/divorcee 542 360,655 25.7 23.1 28.5
Education Level
No formal education 378 282,245 23.9 20.9 27.3
Primary education 1,278 972,121 23.7 22.0 25.5
Secondary education 1,668 1,511,972 16.2 15.2 17.3
Tertiary education 610 659,621 12.5 11.3 13.9
Unclassified education 35 45,478 16.4 10.3 25.0
Occupation
Government/semi government employee
411 342,318 17.8 15.8 19.9
Private employee 946 1,119,935 14.0 12.8 15.3
Self employed 915 729,263 21.4 19.7 23.3
Unpaid worker/home maker 705 520,768 18.1 16.5 19.7
Retiree 197 157,002 25.8 21.9 30.0
Household Income Group
Less than RM 1000 808 601,663 22.0 19.8 24.4
RM 1000 - RM 1999 838 699,363 21.0 19.3 22.9
RM 2000 - RM 2999 710 592,963 18.1 16.5 19.9
RM 3000 - RM 3999 447 403,286 15.5 13.7 17.5
RM 4000 - RM 4999 320 297,525 15.0 13.1 17.2
RM 5000 - RM 5999 229 252,493 15.9 13.3 18.8
RM 6000 - RM 6999 156 157,910 15.0 12.2 18.3
RM 7000 - RM 7999 128 117,544 14.4 11.8 17.5
RM 8000 - RM 8999 78 73,611 10.7 8.0 14.2
RM 9000 - RM 9999 49 44,609 12.5 8.7 17.8
RM 10000 & above 207 230,519 12.9 10.6 15.7
Quintile Household Income Group
Quintile 1 699 529,188 22.5 20.1 25.1
Quintile 2 866 715,408 20.8 19.1 22.7
Quintile 3 883 748,415 18.0 16.5 19.6
Quintile 4 731 673,399 15.2 13.8 16.8
Quintile 5 791 805,075 13.8 12.6 15.1
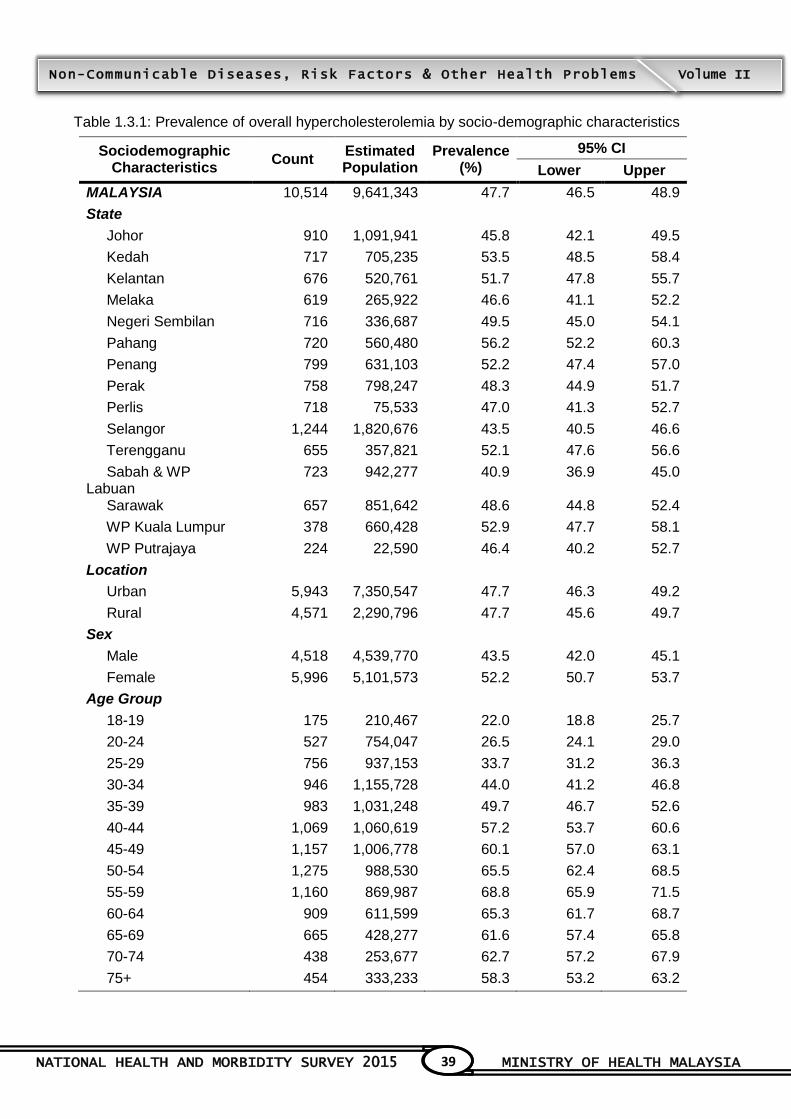
NATIONAL HEALTH AND MORBIDITY SURVEY 2015 MINISTRY OF HEALTH MALAYSIA
39
Non-Communicable Diseases, Risk Factors & Other Health Problems Volume II
Table 1.3.1: Prevalence of overall hypercholesterolemia by socio-demographic characteristics
Sociodemographic Characteristics
Count Estimated Population
Prevalence (%)
95% CI
Lower Upper
MALAYSIA 10,514 9,641,343 47.7 46.5 48.9
State
Johor 910 1,091,941 45.8 42.1 49.5
Kedah 717 705,235 53.5 48.5 58.4
Kelantan 676 520,761 51.7 47.8 55.7
Melaka 619 265,922 46.6 41.1 52.2
Negeri Sembilan 716 336,687 49.5 45.0 54.1
Pahang 720 560,480 56.2 52.2 60.3
Penang 799 631,103 52.2 47.4 57.0
Perak 758 798,247 48.3 44.9 51.7
Perlis 718 75,533 47.0 41.3 52.7
Selangor 1,244 1,820,676 43.5 40.5 46.6
Terengganu 655 357,821 52.1 47.6 56.6
Sabah & WP Labuan
723 942,277 40.9 36.9 45.0
Sarawak 657 851,642 48.6 44.8 52.4
WP Kuala Lumpur 378 660,428 52.9 47.7 58.1
WP Putrajaya 224 22,590 46.4 40.2 52.7
Location
Urban 5,943 7,350,547 47.7 46.3 49.2
Rural 4,571 2,290,796 47.7 45.6 49.7
Sex
Male 4,518 4,539,770 43.5 42.0 45.1
Female 5,996 5,101,573 52.2 50.7 53.7
Age Group
18-19 175 210,467 22.0 18.8 25.7
20-24 527 754,047 26.5 24.1 29.0
25-29 756 937,153 33.7 31.2 36.3
30-34 946 1,155,728 44.0 41.2 46.8
35-39 983 1,031,248 49.7 46.7 52.6
40-44 1,069 1,060,619 57.2 53.7 60.6
45-49 1,157 1,006,778 60.1 57.0 63.1
50-54 1,275 988,530 65.5 62.4 68.5
55-59 1,160 869,987 68.8 65.9 71.5
60-64 909 611,599 65.3 61.7 68.7
65-69 665 428,277 61.6 57.4 65.8
70-74 438 253,677 62.7 57.2 67.9
75+ 454 333,233 58.3 53.2 63.2
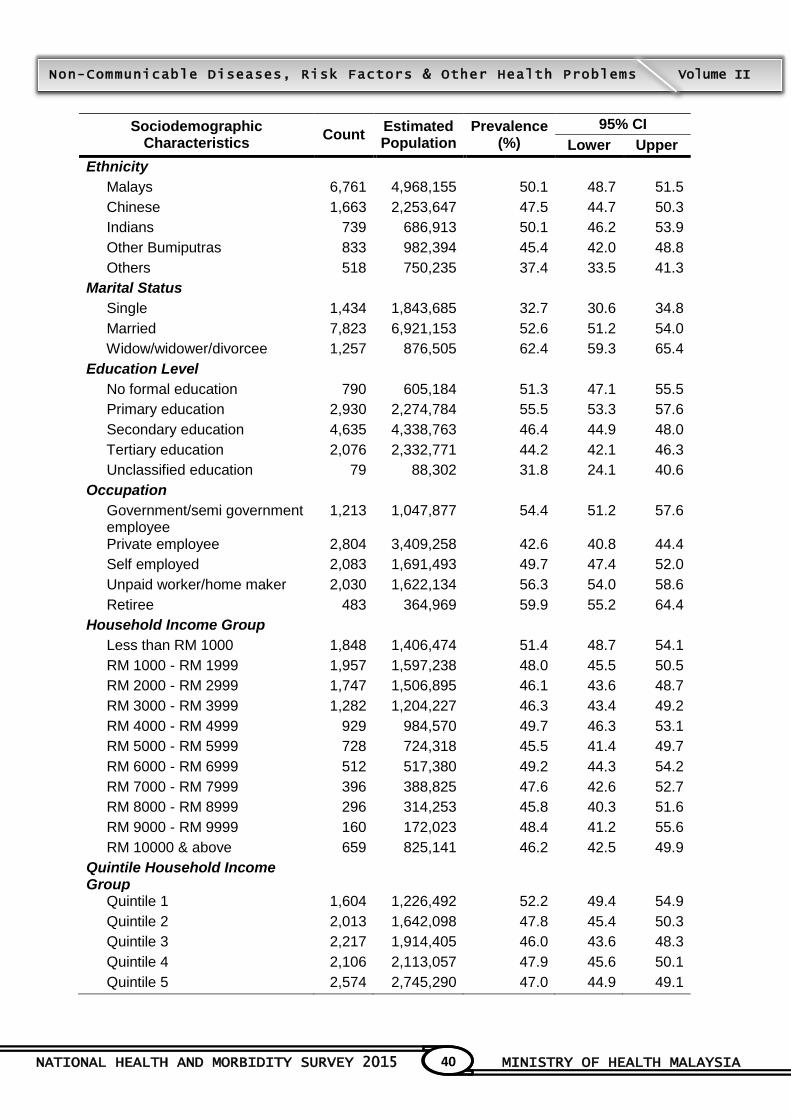
NATIONAL HEALTH AND MORBIDITY SURVEY 2015 MINISTRY OF HEALTH MALAYSIA
40
Non-Communicable Diseases, Risk Factors & Other Health Problems Volume II
Sociodemographic Characteristics
Count Estimated Population
Prevalence (%)
95% CI
Lower Upper
Ethnicity
Malays 6,761 4,968,155 50.1 48.7 51.5
Chinese 1,663 2,253,647 47.5 44.7 50.3
Indians 739 686,913 50.1 46.2 53.9
Other Bumiputras 833 982,394 45.4 42.0 48.8
Others 518 750,235 37.4 33.5 41.3
Marital Status
Single 1,434 1,843,685 32.7 30.6 34.8
Married 7,823 6,921,153 52.6 51.2 54.0
Widow/widower/divorcee 1,257 876,505 62.4 59.3 65.4
Education Level
No formal education 790 605,184 51.3 47.1 55.5
Primary education 2,930 2,274,784 55.5 53.3 57.6
Secondary education 4,635 4,338,763 46.4 44.9 48.0
Tertiary education 2,076 2,332,771 44.2 42.1 46.3
Unclassified education 79 88,302 31.8 24.1 40.6
Occupation
Government/semi government employee
1,213 1,047,877 54.4 51.2 57.6
Private employee 2,804 3,409,258 42.6 40.8 44.4
Self employed 2,083 1,691,493 49.7 47.4 52.0
Unpaid worker/home maker 2,030 1,622,134 56.3 54.0 58.6
Retiree 483 364,969 59.9 55.2 64.4
Household Income Group
Less than RM 1000 1,848 1,406,474 51.4 48.7 54.1
RM 1000 - RM 1999 1,957 1,597,238 48.0 45.5 50.5
RM 2000 - RM 2999 1,747 1,506,895 46.1 43.6 48.7
RM 3000 - RM 3999 1,282 1,204,227 46.3 43.4 49.2
RM 4000 - RM 4999 929 984,570 49.7 46.3 53.1
RM 5000 - RM 5999 728 724,318 45.5 41.4 49.7
RM 6000 - RM 6999 512 517,380 49.2 44.3 54.2
RM 7000 - RM 7999 396 388,825 47.6 42.6 52.7
RM 8000 - RM 8999 296 314,253 45.8 40.3 51.6
RM 9000 - RM 9999 160 172,023 48.4 41.2 55.6
RM 10000 & above 659 825,141 46.2 42.5 49.9
Quintile Household Income Group
Quintile 1 1,604 1,226,492 52.2 49.4 54.9
Quintile 2 2,013 1,642,098 47.8 45.4 50.3
Quintile 3 2,217 1,914,405 46.0 43.6 48.3
Quintile 4 2,106 2,113,057 47.9 45.6 50.1
Quintile 5 2,574 2,745,290 47.0 44.9 49.1
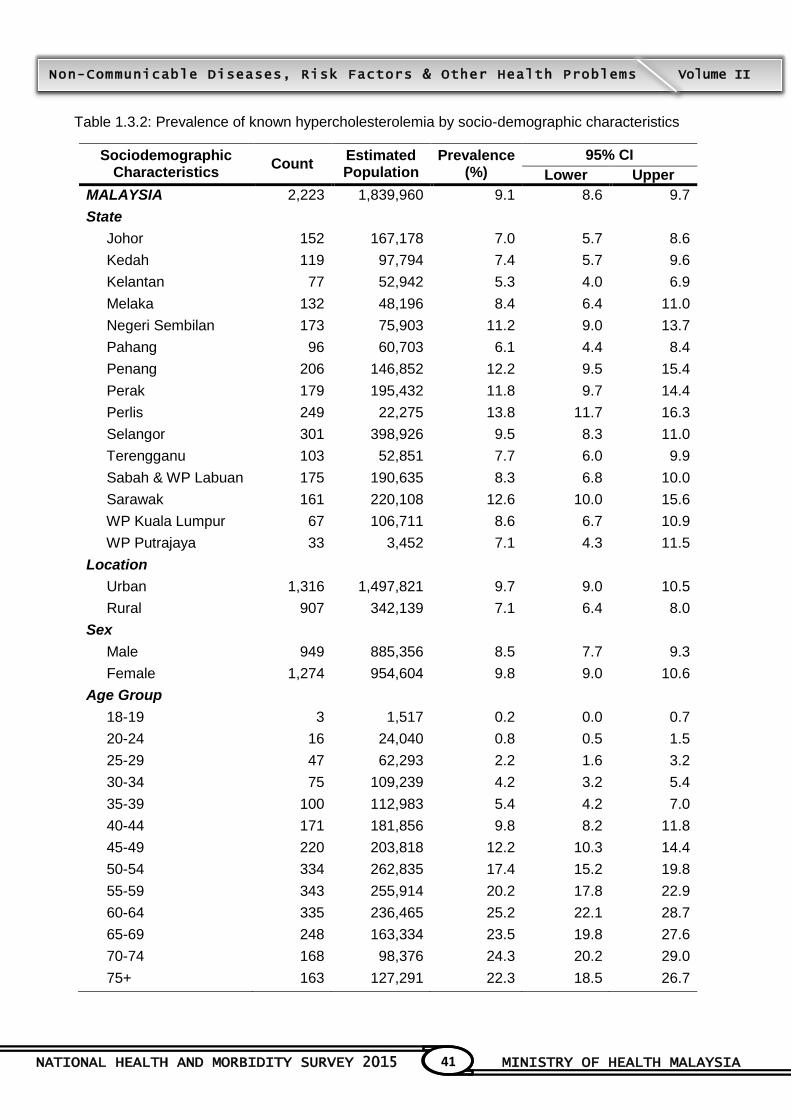
NATIONAL HEALTH AND MORBIDITY SURVEY 2015 MINISTRY OF HEALTH MALAYSIA
41
Non-Communicable Diseases, Risk Factors & Other Health Problems Volume II
Table 1.3.2: Prevalence of known hypercholesterolemia by socio-demographic characteristics
Sociodemographic Characteristics
Count Estimated Population
Prevalence (%)
95% CI
Lower Upper
MALAYSIA 2,223 1,839,960 9.1 8.6 9.7
State
Johor 152 167,178 7.0 5.7 8.6
Kedah 119 97,794 7.4 5.7 9.6
Kelantan 77 52,942 5.3 4.0 6.9
Melaka 132 48,196 8.4 6.4 11.0
Negeri Sembilan 173 75,903 11.2 9.0 13.7
Pahang 96 60,703 6.1 4.4 8.4
Penang 206 146,852 12.2 9.5 15.4
Perak 179 195,432 11.8 9.7 14.4
Perlis 249 22,275 13.8 11.7 16.3
Selangor 301 398,926 9.5 8.3 11.0
Terengganu 103 52,851 7.7 6.0 9.9
Sabah & WP Labuan 175 190,635 8.3 6.8 10.0
Sarawak 161 220,108 12.6 10.0 15.6
WP Kuala Lumpur 67 106,711 8.6 6.7 10.9
WP Putrajaya 33 3,452 7.1 4.3 11.5
Location
Urban 1,316 1,497,821 9.7 9.0 10.5
Rural 907 342,139 7.1 6.4 8.0
Sex
Male 949 885,356 8.5 7.7 9.3
Female 1,274 954,604 9.8 9.0 10.6
Age Group
18-19 3 1,517 0.2 0.0 0.7
20-24 16 24,040 0.8 0.5 1.5
25-29 47 62,293 2.2 1.6 3.2
30-34 75 109,239 4.2 3.2 5.4
35-39 100 112,983 5.4 4.2 7.0
40-44 171 181,856 9.8 8.2 11.8
45-49 220 203,818 12.2 10.3 14.4
50-54 334 262,835 17.4 15.2 19.8
55-59 343 255,914 20.2 17.8 22.9
60-64 335 236,465 25.2 22.1 28.7
65-69 248 163,334 23.5 19.8 27.6
70-74 168 98,376 24.3 20.2 29.0
75+ 163 127,291 22.3 18.5 26.7
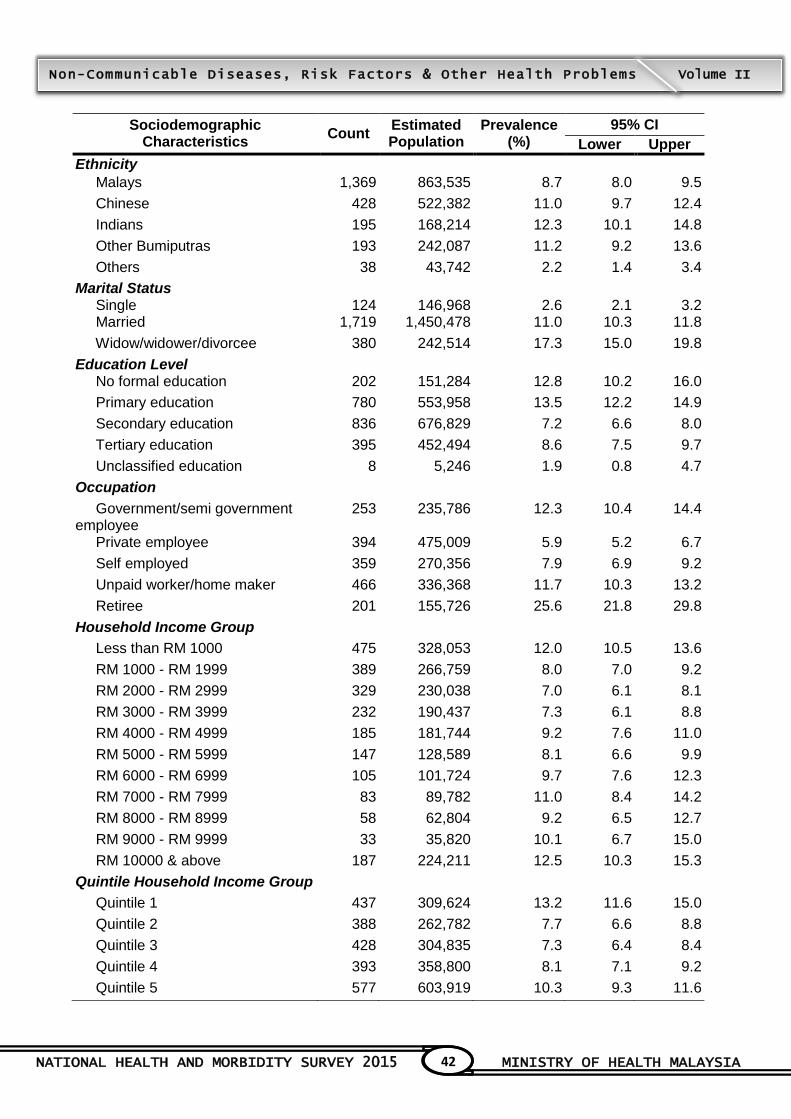
NATIONAL HEALTH AND MORBIDITY SURVEY 2015 MINISTRY OF HEALTH MALAYSIA
42
Non-Communicable Diseases, Risk Factors & Other Health Problems Volume II
Sociodemographic Characteristics
Count Estimated Population
Prevalence (%)
95% CI
Lower Upper
Ethnicity
Malays 1,369 863,535 8.7 8.0 9.5
Chinese 428 522,382 11.0 9.7 12.4
Indians 195 168,214 12.3 10.1 14.8
Other Bumiputras 193 242,087 11.2 9.2 13.6
Others 38 43,742 2.2 1.4 3.4
Marital Status Single 124 146,968 2.6 2.1 3.2 Married 1,719 1,450,478 11.0 10.3 11.8
Widow/widower/divorcee 380 242,514 17.3 15.0 19.8
Education Level No formal education 202 151,284 12.8 10.2 16.0
Primary education 780 553,958 13.5 12.2 14.9
Secondary education 836 676,829 7.2 6.6 8.0
Tertiary education 395 452,494 8.6 7.5 9.7
Unclassified education 8 5,246 1.9 0.8 4.7
Occupation
Government/semi government employee
253 235,786 12.3 10.4 14.4
Private employee 394 475,009 5.9 5.2 6.7
Self employed 359 270,356 7.9 6.9 9.2
Unpaid worker/home maker 466 336,368 11.7 10.3 13.2
Retiree 201 155,726 25.6 21.8 29.8
Household Income Group
Less than RM 1000 475 328,053 12.0 10.5 13.6
RM 1000 - RM 1999 389 266,759 8.0 7.0 9.2
RM 2000 - RM 2999 329 230,038 7.0 6.1 8.1
RM 3000 - RM 3999 232 190,437 7.3 6.1 8.8
RM 4000 - RM 4999 185 181,744 9.2 7.6 11.0
RM 5000 - RM 5999 147 128,589 8.1 6.6 9.9
RM 6000 - RM 6999 105 101,724 9.7 7.6 12.3
RM 7000 - RM 7999 83 89,782 11.0 8.4 14.2
RM 8000 - RM 8999 58 62,804 9.2 6.5 12.7
RM 9000 - RM 9999 33 35,820 10.1 6.7 15.0
RM 10000 & above 187 224,211 12.5 10.3 15.3
Quintile Household Income Group
Quintile 1 437 309,624 13.2 11.6 15.0
Quintile 2 388 262,782 7.7 6.6 8.8
Quintile 3 428 304,835 7.3 6.4 8.4
Quintile 4 393 358,800 8.1 7.1 9.2
Quintile 5 577 603,919 10.3 9.3 11.6
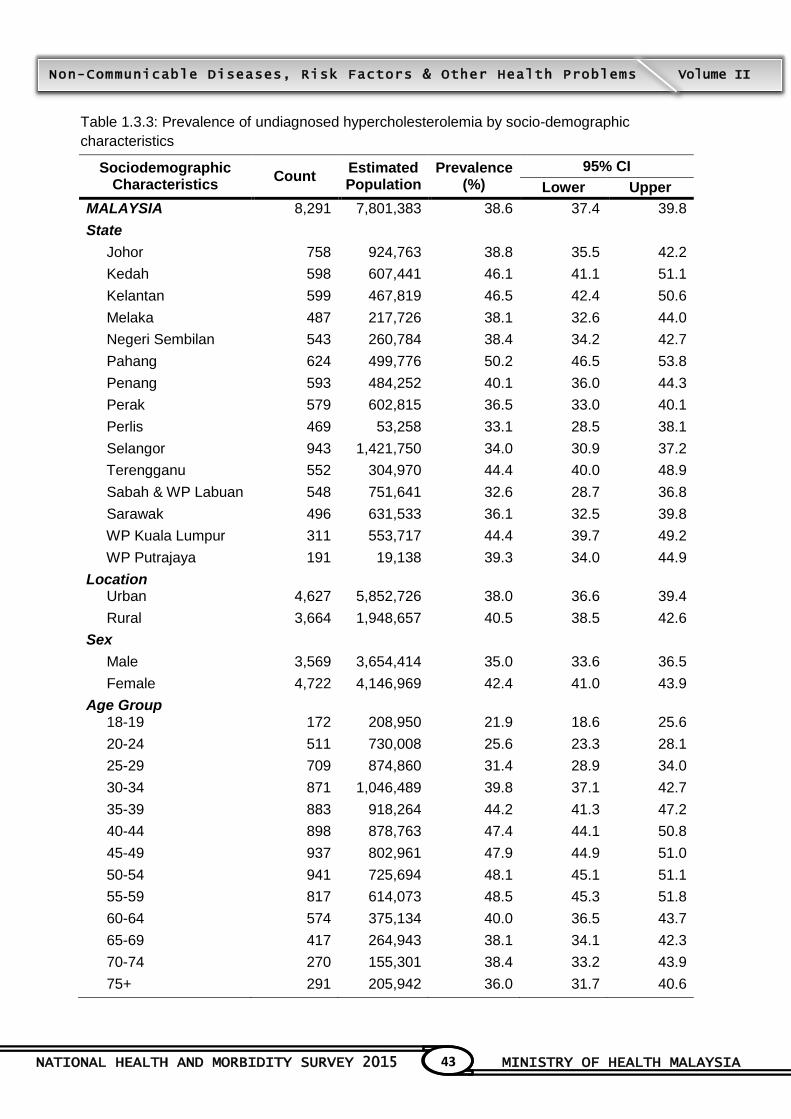
NATIONAL HEALTH AND MORBIDITY SURVEY 2015 MINISTRY OF HEALTH MALAYSIA
43
Non-Communicable Diseases, Risk Factors & Other Health Problems Volume II
Table 1.3.3: Prevalence of undiagnosed hypercholesterolemia by socio-demographic
characteristics
Sociodemographic Characteristics
Count Estimated Population
Prevalence (%)
95% CI
Lower Upper
MALAYSIA 8,291 7,801,383 38.6 37.4 39.8
State
Johor 758 924,763 38.8 35.5 42.2
Kedah 598 607,441 46.1 41.1 51.1
Kelantan 599 467,819 46.5 42.4 50.6
Melaka 487 217,726 38.1 32.6 44.0
Negeri Sembilan 543 260,784 38.4 34.2 42.7
Pahang 624 499,776 50.2 46.5 53.8
Penang 593 484,252 40.1 36.0 44.3
Perak 579 602,815 36.5 33.0 40.1
Perlis 469 53,258 33.1 28.5 38.1
Selangor 943 1,421,750 34.0 30.9 37.2
Terengganu 552 304,970 44.4 40.0 48.9
Sabah & WP Labuan 548 751,641 32.6 28.7 36.8
Sarawak 496 631,533 36.1 32.5 39.8
WP Kuala Lumpur 311 553,717 44.4 39.7 49.2
WP Putrajaya 191 19,138 39.3 34.0 44.9
Location Urban 4,627 5,852,726 38.0 36.6 39.4
Rural 3,664 1,948,657 40.5 38.5 42.6
Sex
Male 3,569 3,654,414 35.0 33.6 36.5
Female 4,722 4,146,969 42.4 41.0 43.9
Age Group 18-19 172 208,950 21.9 18.6 25.6
20-24 511 730,008 25.6 23.3 28.1
25-29 709 874,860 31.4 28.9 34.0
30-34 871 1,046,489 39.8 37.1 42.7
35-39 883 918,264 44.2 41.3 47.2
40-44 898 878,763 47.4 44.1 50.8
45-49 937 802,961 47.9 44.9 51.0
50-54 941 725,694 48.1 45.1 51.1
55-59 817 614,073 48.5 45.3 51.8
60-64 574 375,134 40.0 36.5 43.7
65-69 417 264,943 38.1 34.1 42.3
70-74 270 155,301 38.4 33.2 43.9
75+ 291 205,942 36.0 31.7 40.6
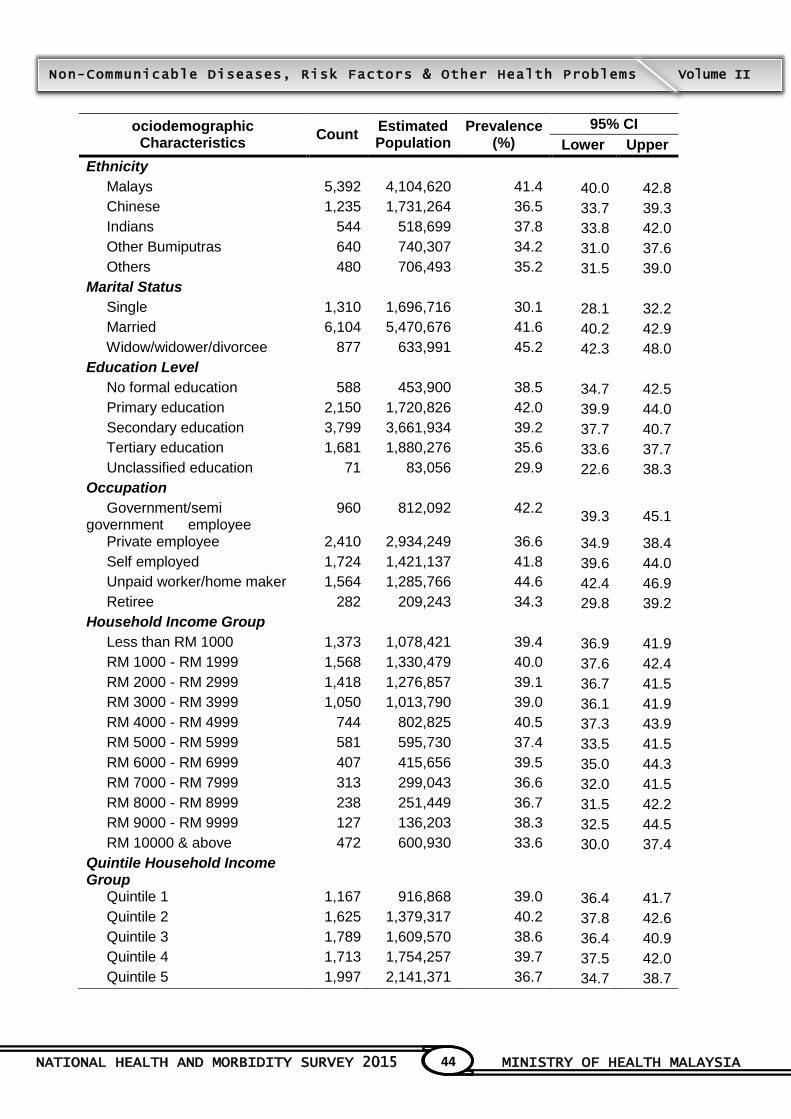
NATIONAL HEALTH AND MORBIDITY SURVEY 2015 MINISTRY OF HEALTH MALAYSIA
44
Non-Communicable Diseases, Risk Factors & Other Health Problems Volume II
ociodemographic Characteristics
Count Estimated Population
Prevalence (%)
95% CI
Lower Upper
Ethnicity
Malays 5,392 4,104,620 41.4 40.0 42.8
Chinese 1,235 1,731,264 36.5 33.7 39.3
Indians 544 518,699 37.8 33.8 42.0
Other Bumiputras 640 740,307 34.2 31.0 37.6
Others 480 706,493 35.2 31.5 39.0
Marital Status
Single 1,310 1,696,716 30.1 28.1 32.2
Married 6,104 5,470,676 41.6 40.2 42.9
Widow/widower/divorcee 877 633,991 45.2 42.3 48.0
Education Level
No formal education 588 453,900 38.5 34.7 42.5
Primary education 2,150 1,720,826 42.0 39.9 44.0
Secondary education 3,799 3,661,934 39.2 37.7 40.7
Tertiary education 1,681 1,880,276 35.6 33.6 37.7
Unclassified education 71 83,056 29.9 22.6 38.3
Occupation
Government/semi government employee
960 812,092 42.2 39.3 45.1
Private employee 2,410 2,934,249 36.6 34.9 38.4
Self employed 1,724 1,421,137 41.8 39.6 44.0
Unpaid worker/home maker 1,564 1,285,766 44.6 42.4 46.9
Retiree 282 209,243 34.3 29.8 39.2
Household Income Group
Less than RM 1000 1,373 1,078,421 39.4 36.9 41.9
RM 1000 - RM 1999 1,568 1,330,479 40.0 37.6 42.4
RM 2000 - RM 2999 1,418 1,276,857 39.1 36.7 41.5
RM 3000 - RM 3999 1,050 1,013,790 39.0 36.1 41.9
RM 4000 - RM 4999 744 802,825 40.5 37.3 43.9
RM 5000 - RM 5999 581 595,730 37.4 33.5 41.5
RM 6000 - RM 6999 407 415,656 39.5 35.0 44.3
RM 7000 - RM 7999 313 299,043 36.6 32.0 41.5
RM 8000 - RM 8999 238 251,449 36.7 31.5 42.2
RM 9000 - RM 9999 127 136,203 38.3 32.5 44.5
RM 10000 & above 472 600,930 33.6 30.0 37.4
Quintile Household Income Group
Quintile 1 1,167 916,868 39.0 36.4 41.7
Quintile 2 1,625 1,379,317 40.2 37.8 42.6
Quintile 3 1,789 1,609,570 38.6 36.4 40.9
Quintile 4 1,713 1,754,257 39.7 37.5 42.0
Quintile 5 1,997 2,141,371 36.7 34.7 38.7

TOPIC 2

NATIONAL HEALTH AND MORBIDITY SURVEY 2015 MINISTRY OF HEALTH MALAYSIA
47
Non-Communicable Diseases, Risk Factors & Other Health Problems Volume II
2. NUTRITIONAL STATUS
2.1 NUTRITIONAL STATUS OF MALAYSIAN ADULT (AGE ≥ 18 YEARS OLD)
Contributors to this section: Azli Baharuddin, Rashidah Ambak, Fatimah Othman, Nur Shahida
Abdul Aziz, Mohamad Hasnan Ahmad, Nor Azian Mohd Zaki, Cheong Siew Man, Ahmad Ali
Zainuddin, Rusidah Selamat, Norlida Zulkafly
2.1.1 Background
Nutritional status is an essential element of the health of the population. Body Mass Index, waist
and calf circumference are important and universally acceptable anthropometric measurements
among adults aged more than 18 years old. These are non-invasive methods that can assess size,
proportion and composition of the human body. The nutritional assessments are not only limited to
individuals but also reflect the health status, social and economic circumstances of population
groups.
2.1.2 Objectives
2.1.2.1 General Objective
To determine the body mass index, waist circumference and calf circumference status
among Malaysians aged 18 years old and above.
2.1.2.2 Specific objectives
a. To determine the prevalence of underweight, normal, overweight and obesity among
Malaysian adults
b. To determine the prevalence of underweight, normal, overweight and obesity among
Malaysian adults by socio-demography subgroups.
c. To determine the prevalence of abdominal obesity among Malaysian adults
d. To determine the prevalence of abdominal obesity among Malaysian adult by socio-
demography subgroups
e. To determine the prevalence of muscle wasting among adults aged more than 60 years
old
2.1.3 Target Population, Study Instrument And Definitions
Anthropometric measurements namely body weight, height and waist circumference were taken
from eligible respondents aged 18 years and above by trained nurses.
Weight was measured using Tanita Digital Weighing Scale (Tanita HD319, Japan) to the nearest
0.1 kilogram. The standing height was measured without shoes using SECA Portable Stadiometer
(SECA 213 Germany) to the nearest 0.1 centimetre. Waist circumference was measured by SECA
measuring tape (SECA 201, Germany). All measurements were taken twice and the average value
was used for data entry.

NATIONAL HEALTH AND MORBIDITY SURVEY 2015 MINISTRY OF HEALTH MALAYSIA
48
Non-Communicable Diseases, Risk Factors & Other Health Problems Volume II
For the purpose of analysis, Body Mass Index (BMI) was classified using two guidelines; the
Malaysian Clinical Practice Guidelines of Obesity (2004) and World Health Organization (1998).
Based on the classification from the Malaysian Clinical Practice Guidelines of Obesity (2004), BMI
was classified into 6 categories; underweight (<18.50 kg/m2), normal (18.50 - 22.99 kg/m2),
overweight (23.00 - 27.49 kg/m2), obese I (27.50 - 34.99 kg/m2), obese II (35.00 - 39.99) and
obese III (>40 kg/m2). The World Health Organization (1998) classified body mass Index (BMI)
into 6 categories; underweight (<18.5 kg/m2), normal (18.5-24.99 kg/m2), overweight (25.0-29.99
kg/m2), obese I (30.34-34.99 kg/m2), obese II (35.39-39.99) and obese III (>40 kg/m2).
For assessing central abdominal obesity, waist circumference (WC) cut off values based on the
International Diabetes Institute/ Western Pacific World Health Organization/ International
Association for the study of Obesity/ International Obesity Task Force (WHO/IASO/IOTF, 2000)
(>90 cm for men and > 80 cm for women) was used in this study.
2.1.4 Findings
According to the classification of Malaysian Clinical Practice Guidelines (CPG) on Management of
Obesity (2004) and World Health Organization‟s classifications (WHO, 2008), the prevalence of
underweight among adults was 6.7% (95% CI: 6.2, 7.3). Kelantan [8.4% (95% CI: 6.5, 10.8)] was
the state with the highest prevalence of underweight as compared to other states. The results
revealed that higher prevalence of underweight were observed among those from rural areas
[7.1% (95% CI: 6.3, 8.1)], females [7.3% (95% CI: 6.5, 8.2)], aged 18 -19 years old [18.7% (95%
CI: 15.5 , 22.3)], Chinese [8.3% (95% CI : 6.9, 10.0)], singles [13.0% (95% CI: 11.6, 14.5],
secondary education attainers [7.6% (95% CI: 6.7, 8.5)], and private sector employees [6.6%
(95% CI : 5.8, 7.5)].
According to the CPG classifications, the overall prevalence of normal weight among adults was
29.3% (95% CI: 28.2, 30.4). By state, Sabah & Wilayah Persekutuan Labuan had the highest
prevalence of normal weight [33.4% (95% CI: 29.7, 37.3)]. Besides, there was a significant
difference in the prevalence of normal weight between residents in urban [28.3% (95% CI: 27.1,
29.5)] and rural areas [32.2% (95% CI: 30.1, 34.5)]. The results revealed that the prevalence of
normal weight was higher among males [30.2% (95% CI: 28.7, 31.8)], adults aged 20-24 years old
[40.9% (95% CI: 38.1 -43.7)], other ethnicity [42.2% (95% CI: 37.9, 46.7)], unmarried adults
[38.5% (95% CI: 36.6, 40.5)], unclassified education [40.1% (95% CI : 31.4, 49.5)], and private
employees [33.1% (95% CI: 31.3, 35.0)].
Based on WHO classification, the prevalence of normal weight among Malaysian adults was
45.6% (95% CI: 44.5, 46.7)]. By state, Sabah & Wilayah Persekutuan Labuan had the highest
prevalence of normal weight [52.6% (95% CI: 49.1, 56.0)]. While, normal weight prevalence was
higher among those living in rural areas [47.3% (95% CI: 45.1, 49.5)], males [47.3% (95% CI:
45.7, 48.8)], and elderly aged 75 years old and above [55.9% (95% CI: 50.7, 61.0)].
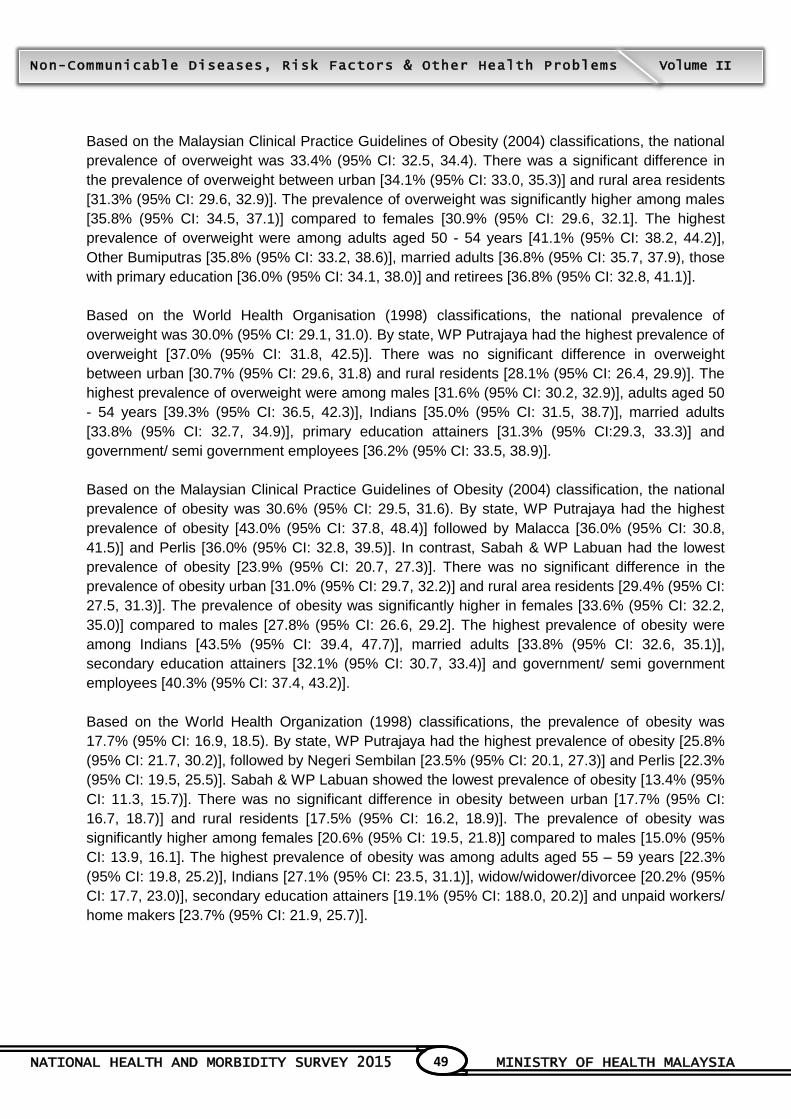
NATIONAL HEALTH AND MORBIDITY SURVEY 2015 MINISTRY OF HEALTH MALAYSIA
49
Non-Communicable Diseases, Risk Factors & Other Health Problems Volume II
Based on the Malaysian Clinical Practice Guidelines of Obesity (2004) classifications, the national
prevalence of overweight was 33.4% (95% CI: 32.5, 34.4). There was a significant difference in
the prevalence of overweight between urban [34.1% (95% CI: 33.0, 35.3)] and rural area residents
[31.3% (95% CI: 29.6, 32.9)]. The prevalence of overweight was significantly higher among males
[35.8% (95% CI: 34.5, 37.1)] compared to females [30.9% (95% CI: 29.6, 32.1]. The highest
prevalence of overweight were among adults aged 50 - 54 years [41.1% (95% CI: 38.2, 44.2)],
Other Bumiputras [35.8% (95% CI: 33.2, 38.6)], married adults [36.8% (95% CI: 35.7, 37.9), those
with primary education [36.0% (95% CI: 34.1, 38.0)] and retirees [36.8% (95% CI: 32.8, 41.1)].
Based on the World Health Organisation (1998) classifications, the national prevalence of
overweight was 30.0% (95% CI: 29.1, 31.0). By state, WP Putrajaya had the highest prevalence of
overweight [37.0% (95% CI: 31.8, 42.5)]. There was no significant difference in overweight
between urban [30.7% (95% CI: 29.6, 31.8) and rural residents [28.1% (95% CI: 26.4, 29.9)]. The
highest prevalence of overweight were among males [31.6% (95% CI: 30.2, 32.9)], adults aged 50
- 54 years [39.3% (95% CI: 36.5, 42.3)], Indians [35.0% (95% CI: 31.5, 38.7)], married adults
[33.8% (95% CI: 32.7, 34.9)], primary education attainers [31.3% (95% CI:29.3, 33.3)] and
government/ semi government employees [36.2% (95% CI: 33.5, 38.9)].
Based on the Malaysian Clinical Practice Guidelines of Obesity (2004) classification, the national
prevalence of obesity was 30.6% (95% CI: 29.5, 31.6). By state, WP Putrajaya had the highest
prevalence of obesity [43.0% (95% CI: 37.8, 48.4)] followed by Malacca [36.0% (95% CI: 30.8,
41.5)] and Perlis [36.0% (95% CI: 32.8, 39.5)]. In contrast, Sabah & WP Labuan had the lowest
prevalence of obesity [23.9% (95% CI: 20.7, 27.3)]. There was no significant difference in the
prevalence of obesity urban [31.0% (95% CI: 29.7, 32.2)] and rural area residents [29.4% (95% CI:
27.5, 31.3)]. The prevalence of obesity was significantly higher in females [33.6% (95% CI: 32.2,
35.0)] compared to males [27.8% (95% CI: 26.6, 29.2]. The highest prevalence of obesity were
among Indians [43.5% (95% CI: 39.4, 47.7)], married adults [33.8% (95% CI: 32.6, 35.1)],
secondary education attainers [32.1% (95% CI: 30.7, 33.4)] and government/ semi government
employees [40.3% (95% CI: 37.4, 43.2)].
Based on the World Health Organization (1998) classifications, the prevalence of obesity was
17.7% (95% CI: 16.9, 18.5). By state, WP Putrajaya had the highest prevalence of obesity [25.8%
(95% CI: 21.7, 30.2)], followed by Negeri Sembilan [23.5% (95% CI: 20.1, 27.3)] and Perlis [22.3%
(95% CI: 19.5, 25.5)]. Sabah & WP Labuan showed the lowest prevalence of obesity [13.4% (95%
CI: 11.3, 15.7)]. There was no significant difference in obesity between urban [17.7% (95% CI:
16.7, 18.7)] and rural residents [17.5% (95% CI: 16.2, 18.9)]. The prevalence of obesity was
significantly higher among females [20.6% (95% CI: 19.5, 21.8)] compared to males [15.0% (95%
CI: 13.9, 16.1]. The highest prevalence of obesity was among adults aged 55 – 59 years [22.3%
(95% CI: 19.8, 25.2)], Indians [27.1% (95% CI: 23.5, 31.1)], widow/widower/divorcee [20.2% (95%
CI: 17.7, 23.0)], secondary education attainers [19.1% (95% CI: 188.0, 20.2)] and unpaid workers/
home makers [23.7% (95% CI: 21.9, 25.7)].

NATIONAL HEALTH AND MORBIDITY SURVEY 2015 MINISTRY OF HEALTH MALAYSIA
50
Non-Communicable Diseases, Risk Factors & Other Health Problems Volume II
In assessing central obesity or abdominal obesity, the International Diabetes Institute/Western
Pacific World Health Organization/ International association for the study of Obesity/International
Obesity Task Force (WHO/IASO/IOTF, 2000) has recommended the use of waist circumference
(WC) cut-off values of > 90 cm for men and > 80 cm for women. The national prevalence of
abdominal obesity was 48.6% (95% CI: 47.4, 49.9). By state, WP Putrajaya [61.3% (95% CI: 57.2,
65.3] had the highest prevalence of abdominal obesity followed by Penang [56.8% (95% CI: 51.1,
62.3)] and Malacca [54.2% (95% CI: 49.1, 59.2)]. The prevalence of abdominal obesity was
slightly higher in the urban areas [49.4% (95% CI: 47.9, 51.0)] as compared to the rural areas
[46.2% (95% CI: 44.0, 48.4)] but this difference was not statistically significant. Females showed a
significantly higher prevalence of abdominal obesity [60.2% (95% CI: 58.5, 61.8)] than males
[38.2% (95% CI: 36.6, 39.9)]. Adults aged 60 - 64 years old [66.4% (95% CI: 62.7 , 69.9)], Indians
[66.2% (95% CI: 61.6, 70.6)], widow/widower/divorcee [63.3% (95% CI: 60.2, 66.3)], primary
education attainers [53.3% (95% CI: 50.9, 55.6)], unpaid workers/ home makers [67.3% (95% CI :
64.8, 69.6)], and those earned between RM 9000 – RM 9999 [56.7% (95% CI: 48.4, 64.6)] had the
highest prevalence of abdominal obesity.
The cut-off values for abdominal obesity were also classified based on recommendation by WHO
Expert Consultation on Obesity (2000a). In this classification, waist circumference of > 102 cm for
men and > 88 cm for women are the cut-off values for metabolic complication risk. According to
this classification, the national prevalence of abdominal obesity was 23.0% (95% CI: 23.0, 24) and
the prevalence was found to be lower than the prevalence classified by WHO/IASO/IOTF.
Prevalence of abdominal obesity were found to be the highest in Perlis [27.7% (95% CI: 23.8,
31.9)], urban residents [23.2% (95% CI: 22.0, 24.4)], females [35.4% (95% CI: 33.8, 36.9)], Indians
[37.2% (95% CI: 33.4, 41.1)], primary education attainers [27.0% (95% CI: 25.1, 29.0)], and unpaid
workers [42.0 % (95% CI: 39.5, 44.5)].
Calf circumference was used to identify individuals aged 60 years and above who were at risk of
malnutrition or peripheral muscle wasting (<30.1 cm for men and <27.3 cm for women) (Sakinah et
al., 2004). The overall prevalence of peripheral muscle wasting in this study was 20.0% (95% CI:
17.8, 22.5). By state, Negeri Sembilan had the highest prevalence of peripheral muscle wasting
[40.7% (95% CI: 29.5, 53.0)] followed by Sarawak [29.6 (95% (21.6, 39.1)]. In contrast, Penang
had the lowest prevalence of peripheral muscle wasting [3.5% (95% CI: 1.9, 6.6)]. Older persons
from rural areas had significantly increased risk of malnutrition [24.7% (95% CI: 21.5, 28.2)]
compared to those living in urban areas [18.2% (95% CI: 15.4, 21.4)]. Males showed a significantly
higher risk of peripheral muscle wasting [23.3% (95% CI: 20.2, 26.7)] than females 16.9% (95%
CI: 14.5, 19.7)].
NATIONAL HEALTH AND MORBIDITY SURVEY 2015 MINISTRY OF HEALTH MALAYSIA
51
Non-Communicable Diseases, Risk Factors & Other Health Problems Volume II
2.1.5 Conclusion
The NHMS 2015 showed that the national prevalence of overweight, obesity and abdominal
obesity had increased by 0.6%, 2.6% and 2.0% respectively as compared to the previous findings
of NHMS 2011. Currently, the prevalence of obesity in Malaysia is also higher than the world
prevalence of 13.0% in 2014 (www.who.int). As the number of people with obesity increases, the
nation now is facing an upward surge of non-communicable diseases such as diabetes and
cardiovascular diseases. The alarming trend of the obesity epidemic in Malaysia does not only
require immediate revision of public health policies, but to provide supportive environment and
communities for Malaysians to work towards practising healthier lifestyle.
Meanwhile, the slight increment of older individuals who were at risk for malnutrition compared to NHMS 2011 survey should alert the healthcare and related agencies to prepare and provide the necessary environments for a healthier aging in the country

NATIONAL HEALTH AND MORBIDITY SURVEY 2015 MINISTRY OF HEALTH MALAYSIA
52
Non-Communicable Diseases, Risk Factors & Other Health Problems Volume II
Table 2.1.1: Prevalence of underweight BMI among adults (aged≥ 18 years old) by socio-demographic characteristics
Sociodemographic Characteristics
CPG 2004 (BMI <18.5 kg/m2) & WHO 1998 (BMI <18.5 kg/m2)
Count Estimated Population
Prevalence (%)
95% CI
Lower Upper
MALAYSIA 1,107 1,259,017 6.7 6.2 7.3
State
Johor 88 131,205 6.0 4.7 7.7
Kedah 78 101,024 8.2 5.9 11.4
Kelantan 81 80,629 8.4 6.5 10.8
Melaka 52 20,566 4.3 2.7 6.8
Negeri Sembilan 63 48,414 8.1 4.8 13.2
Pahang 68 67,195 7.1 5.5 9.2
Penang 78 79,623 7.0 4.8 10.2
Perak 75 98,475 6.3 4.6 8.7
Perlis 76 11,289 7.5 5.3 10.4
Selangor 149 248,160 6.6 5.3 8.2
Terengganu 91 53,938 8.3 6.7 10.2
Sabah & WP Labuan 77 129,598 5.9 4.4 7.8
Sarawak 82 121,450 7.2 5.8 8.9
WP Kuala Lumpur 36 66,070 5.7 4.0 8.0
WP Putrajaya 13 1,382 3.0 1.6 5.6
Location
Urban 605 935,621 6.6 5.9 7.3
Rural 502 323,396 7.1 6.3 8.1
Sex
Male 545 609,227 6.2 5.5 6.9
Female 562 649,791 7.3 6.5 8.2
Age Group
18-19 153 172,409 18.7 15.5 22.3
20-24 248 369,720 14.0 12.0 16.2
25-29 176 221,212 8.7 7.3 10.4
30-34 95 117,244 4.9 3.8 6.3
35-39 64 68,748 3.6 2.6 4.8
40-44 60 78,331 4.4 3.2 6.2
45-49 49 45,490 2.8 2.1 3.9
50-54 40 35,935 2.5 1.7 3.7
55-59 31 20,192 1.7 1.1 2.6
60-64 40 32,553 3.7 2.4 5.5
65-69 37 26,269 4.1 2.8 6.2
70-74 43 21,055 5.8 3.6 9.0
75+ 71 49,860 10.9 8.1 14.4
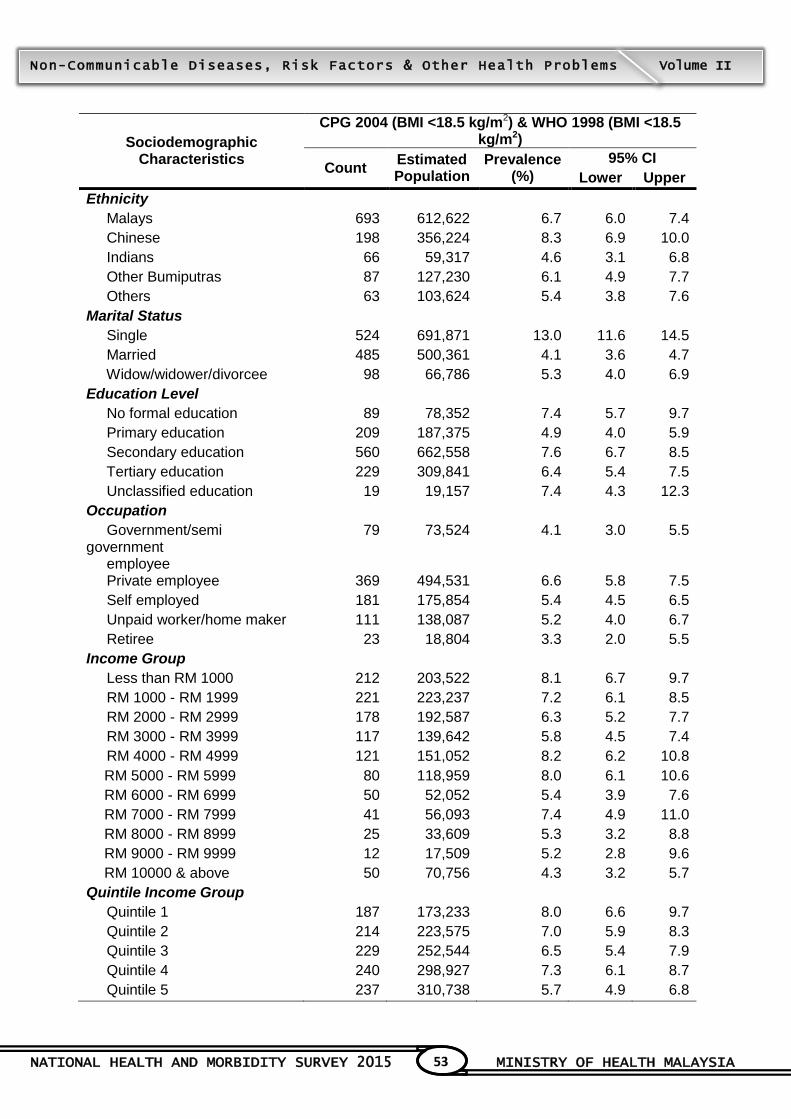
NATIONAL HEALTH AND MORBIDITY SURVEY 2015 MINISTRY OF HEALTH MALAYSIA
53
Non-Communicable Diseases, Risk Factors & Other Health Problems Volume II
Sociodemographic Characteristics
CPG 2004 (BMI <18.5 kg/m2) & WHO 1998 (BMI <18.5 kg/m2)
Count Estimated Population
Prevalence (%)
95% CI
Lower Upper
Ethnicity
Malays 693 612,622 6.7 6.0 7.4
Chinese 198 356,224 8.3 6.9 10.0
Indians 66 59,317 4.6 3.1 6.8
Other Bumiputras 87 127,230 6.1 4.9 7.7
Others 63 103,624 5.4 3.8 7.6
Marital Status
Single 524 691,871 13.0 11.6 14.5
Married 485 500,361 4.1 3.6 4.7
Widow/widower/divorcee 98 66,786 5.3 4.0 6.9
Education Level
No formal education 89 78,352 7.4 5.7 9.7
Primary education 209 187,375 4.9 4.0 5.9
Secondary education 560 662,558 7.6 6.7 8.5
Tertiary education 229 309,841 6.4 5.4 7.5
Unclassified education 19 19,157 7.4 4.3 12.3
Occupation
Government/semi government employee
79 73,524 4.1 3.0 5.5
Private employee 369 494,531 6.6 5.8 7.5
Self employed 181 175,854 5.4 4.5 6.5
Unpaid worker/home maker 111 138,087 5.2 4.0 6.7
Retiree 23 18,804 3.3 2.0 5.5
Income Group
Less than RM 1000 212 203,522 8.1 6.7 9.7
RM 1000 - RM 1999 221 223,237 7.2 6.1 8.5
RM 2000 - RM 2999 178 192,587 6.3 5.2 7.7
RM 3000 - RM 3999 117 139,642 5.8 4.5 7.4
RM 4000 - RM 4999 121 151,052 8.2 6.2 10.8
RM 5000 - RM 5999 80 118,959 8.0 6.1 10.6
RM 6000 - RM 6999 50 52,052 5.4 3.9 7.6
RM 7000 - RM 7999 41 56,093 7.4 4.9 11.0
RM 8000 - RM 8999 25 33,609 5.3 3.2 8.8
RM 9000 - RM 9999 12 17,509 5.2 2.8 9.6
RM 10000 & above 50 70,756 4.3 3.2 5.7
Quintile Income Group
Quintile 1 187 173,233 8.0 6.6 9.7
Quintile 2 214 223,575 7.0 5.9 8.3
Quintile 3 229 252,544 6.5 5.4 7.9
Quintile 4 240 298,927 7.3 6.1 8.7
Quintile 5 237 310,738 5.7 4.9 6.8
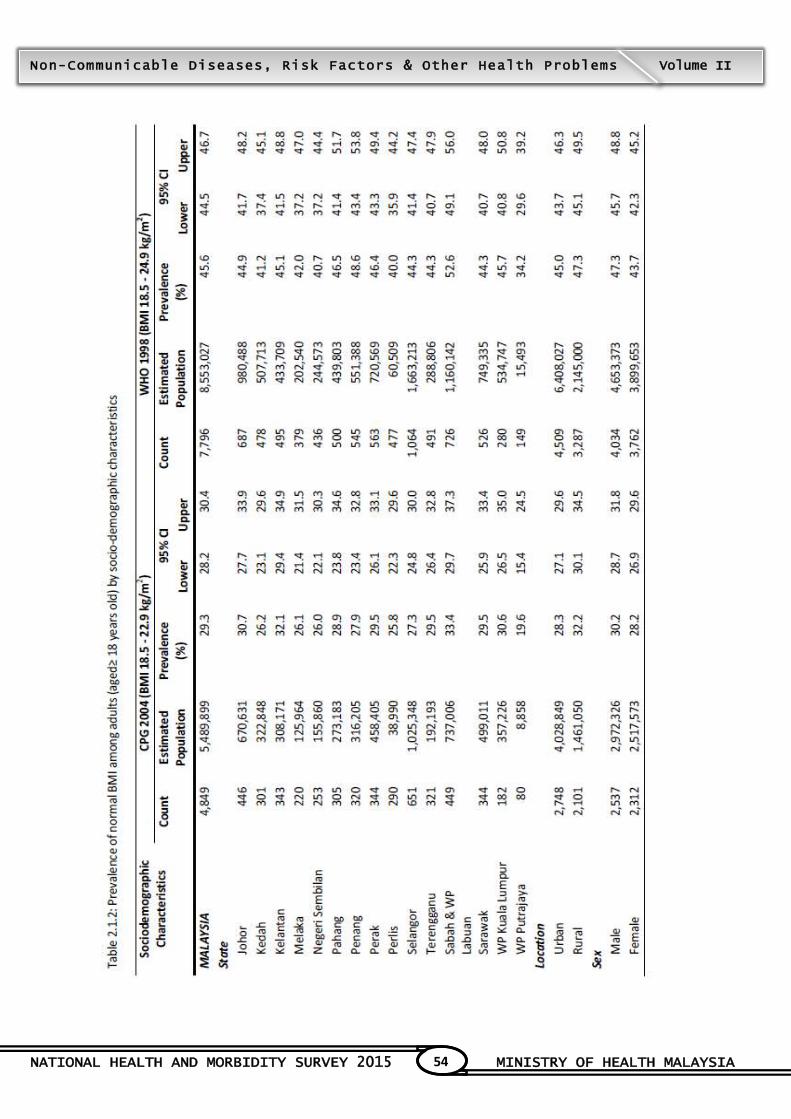
NATIONAL HEALTH AND MORBIDITY SURVEY 2015 MINISTRY OF HEALTH MALAYSIA
54
Non-Communicable Diseases, Risk Factors & Other Health Problems Volume II
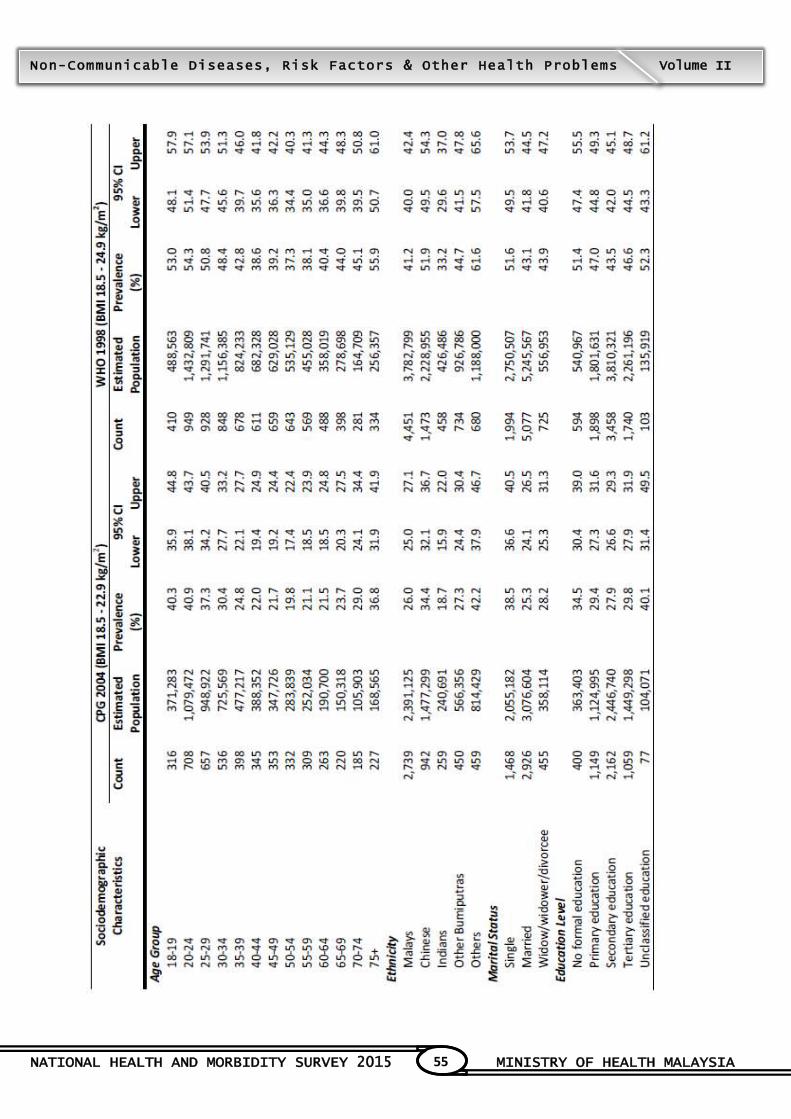
NATIONAL HEALTH AND MORBIDITY SURVEY 2015 MINISTRY OF HEALTH MALAYSIA
55
Non-Communicable Diseases, Risk Factors & Other Health Problems Volume II
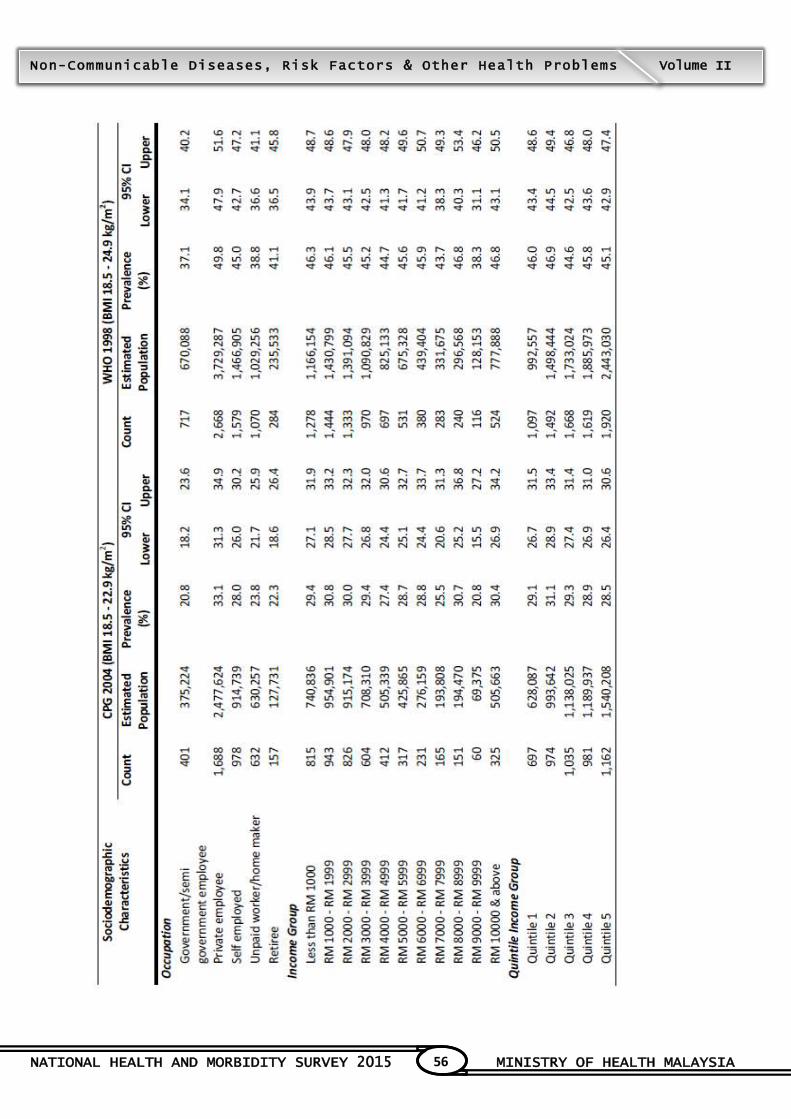
NATIONAL HEALTH AND MORBIDITY SURVEY 2015 MINISTRY OF HEALTH MALAYSIA
56
Non-Communicable Diseases, Risk Factors & Other Health Problems Volume II
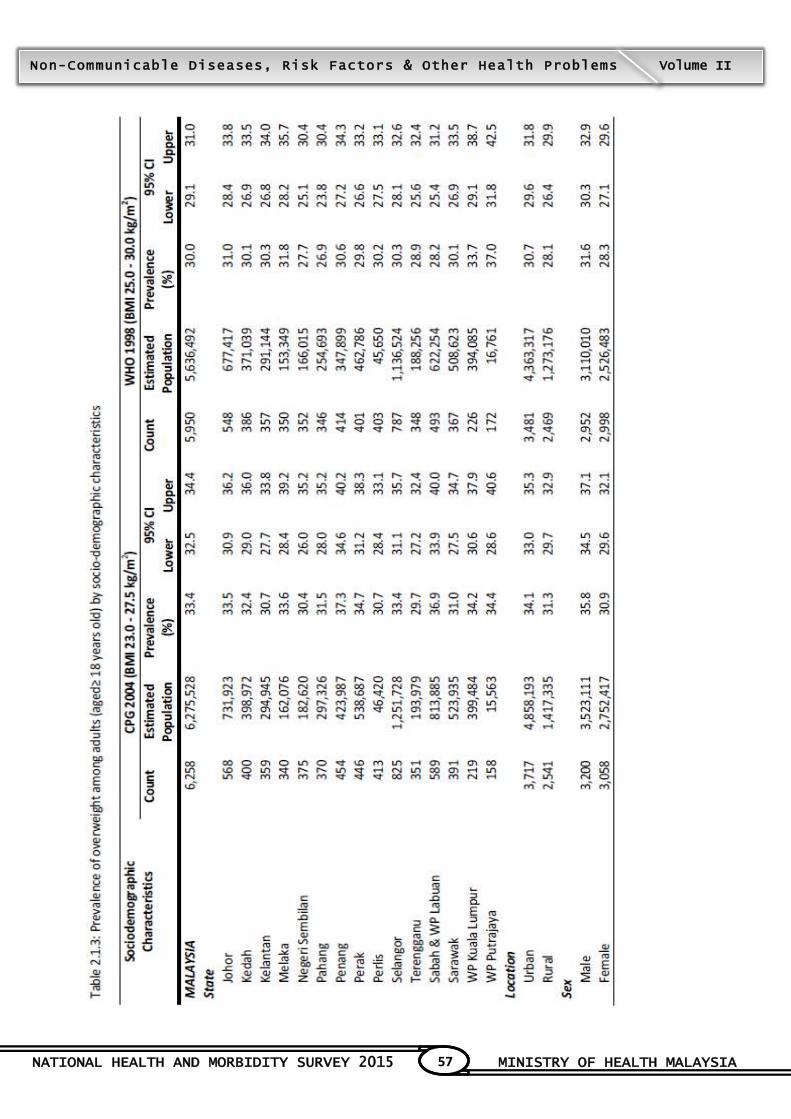
NATIONAL HEALTH AND MORBIDITY SURVEY 2015 MINISTRY OF HEALTH MALAYSIA
57
Non-Communicable Diseases, Risk Factors & Other Health Problems Volume II
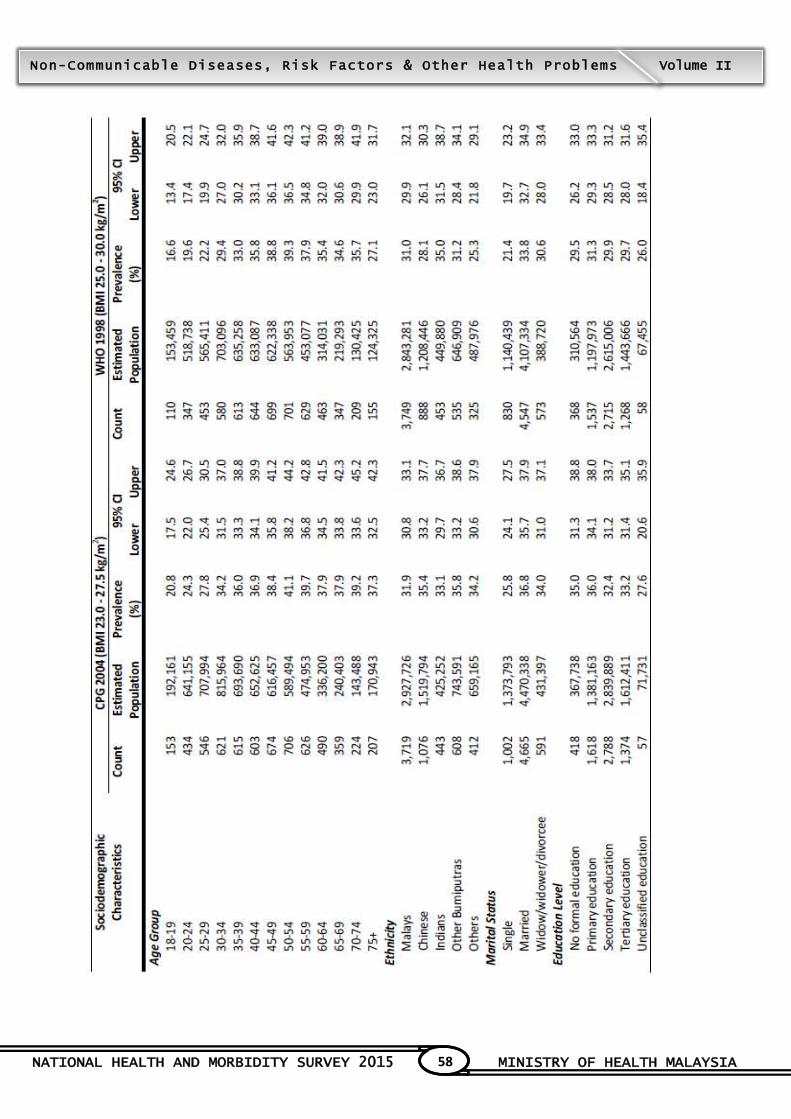
NATIONAL HEALTH AND MORBIDITY SURVEY 2015 MINISTRY OF HEALTH MALAYSIA
58
Non-Communicable Diseases, Risk Factors & Other Health Problems Volume II
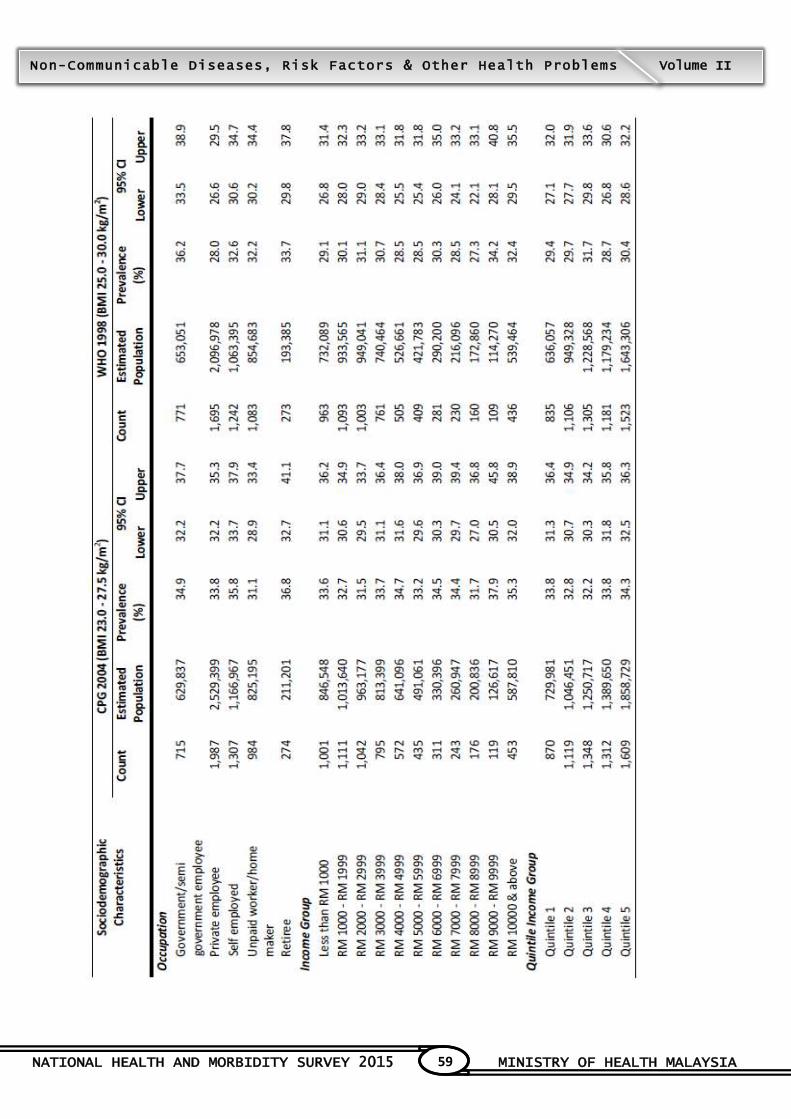
NATIONAL HEALTH AND MORBIDITY SURVEY 2015 MINISTRY OF HEALTH MALAYSIA
59
Non-Communicable Diseases, Risk Factors & Other Health Problems Volume II
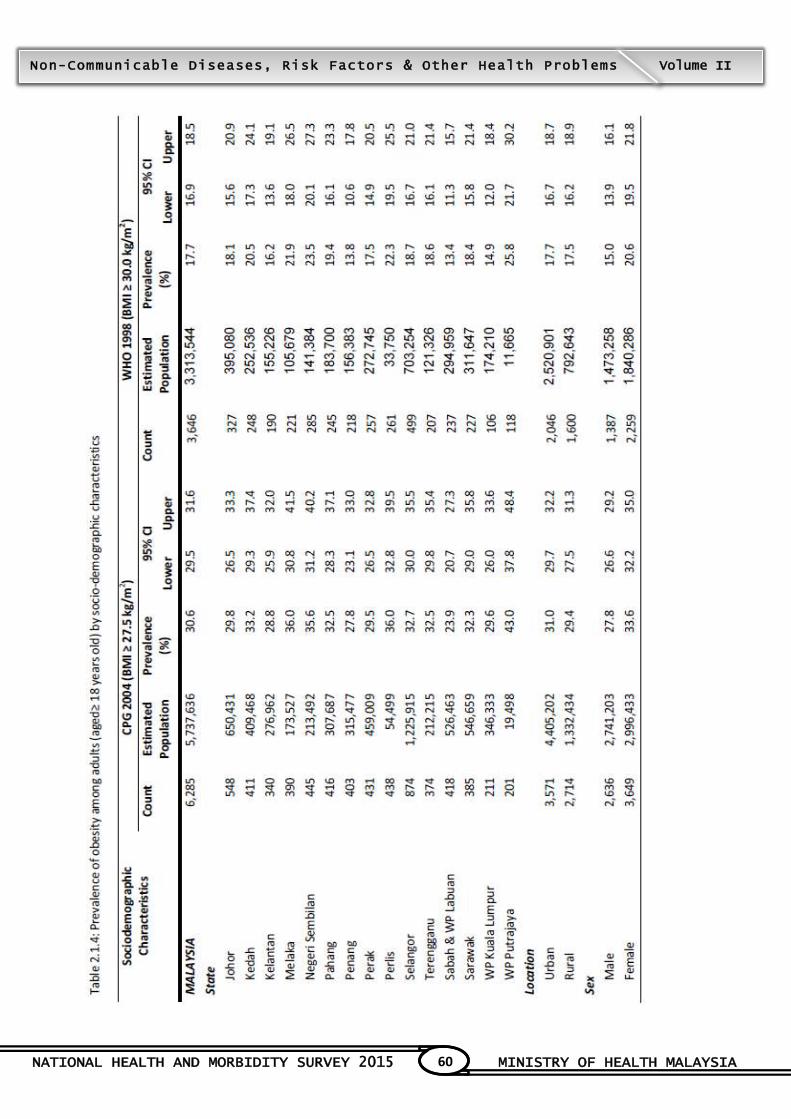
NATIONAL HEALTH AND MORBIDITY SURVEY 2015 MINISTRY OF HEALTH MALAYSIA
60
Non-Communicable Diseases, Risk Factors & Other Health Problems Volume II
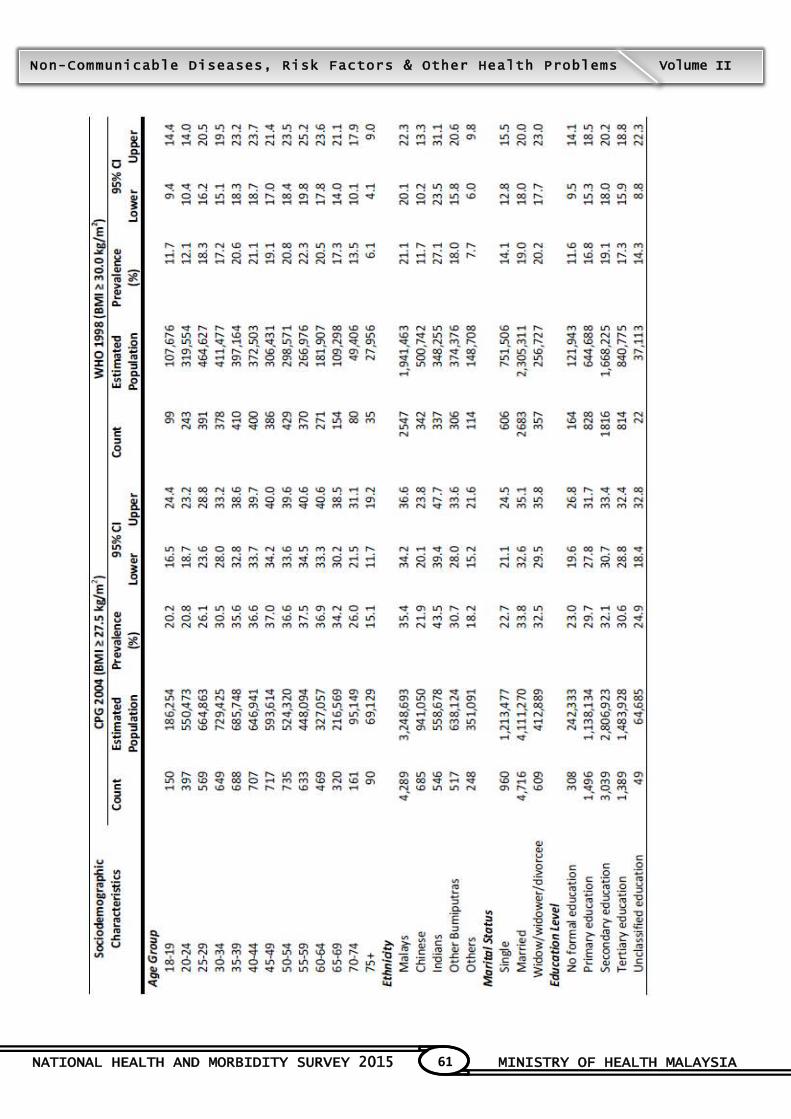
NATIONAL HEALTH AND MORBIDITY SURVEY 2015 MINISTRY OF HEALTH MALAYSIA
61
Non-Communicable Diseases, Risk Factors & Other Health Problems Volume II
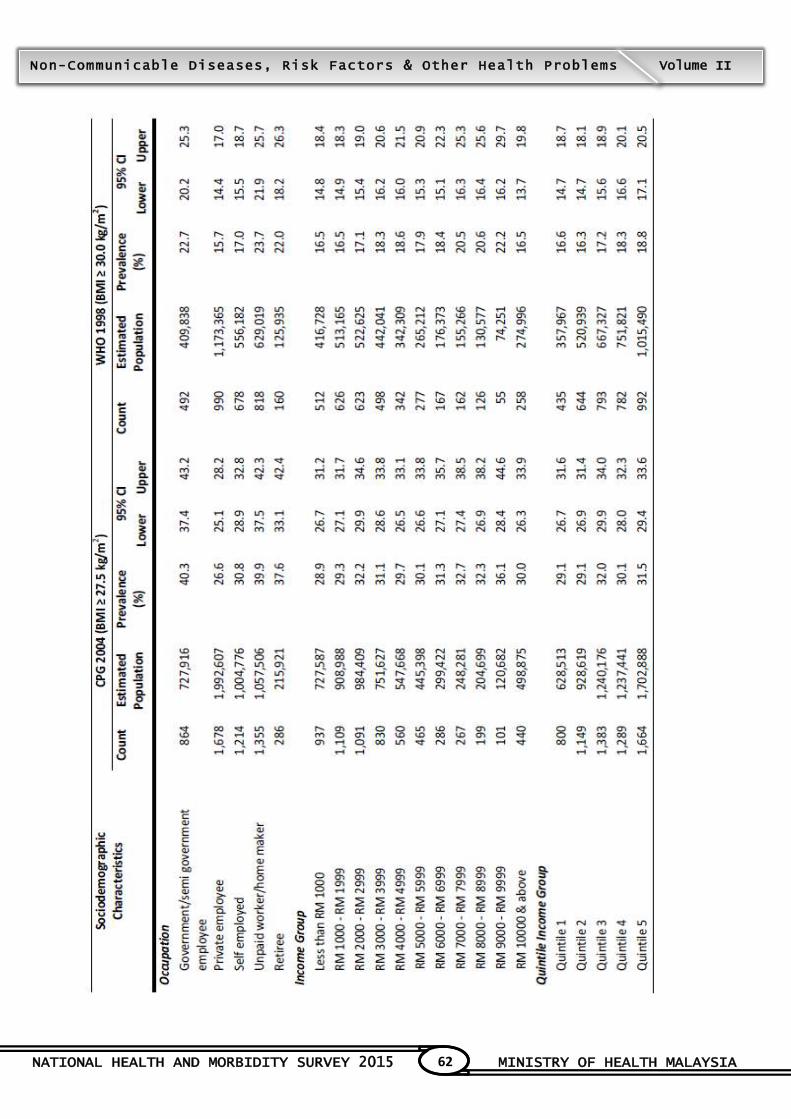
NATIONAL HEALTH AND MORBIDITY SURVEY 2015 MINISTRY OF HEALTH MALAYSIA
62
Non-Communicable Diseases, Risk Factors & Other Health Problems Volume II
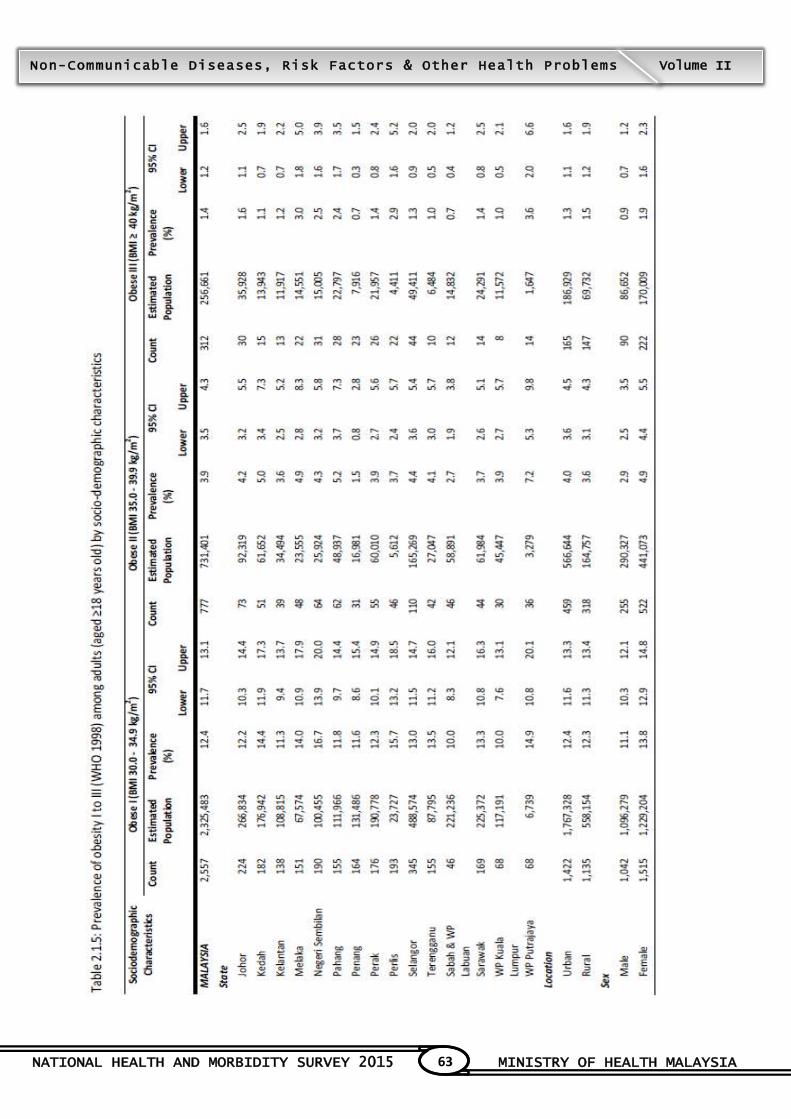
NATIONAL HEALTH AND MORBIDITY SURVEY 2015 MINISTRY OF HEALTH MALAYSIA
63
Non-Communicable Diseases, Risk Factors & Other Health Problems Volume II
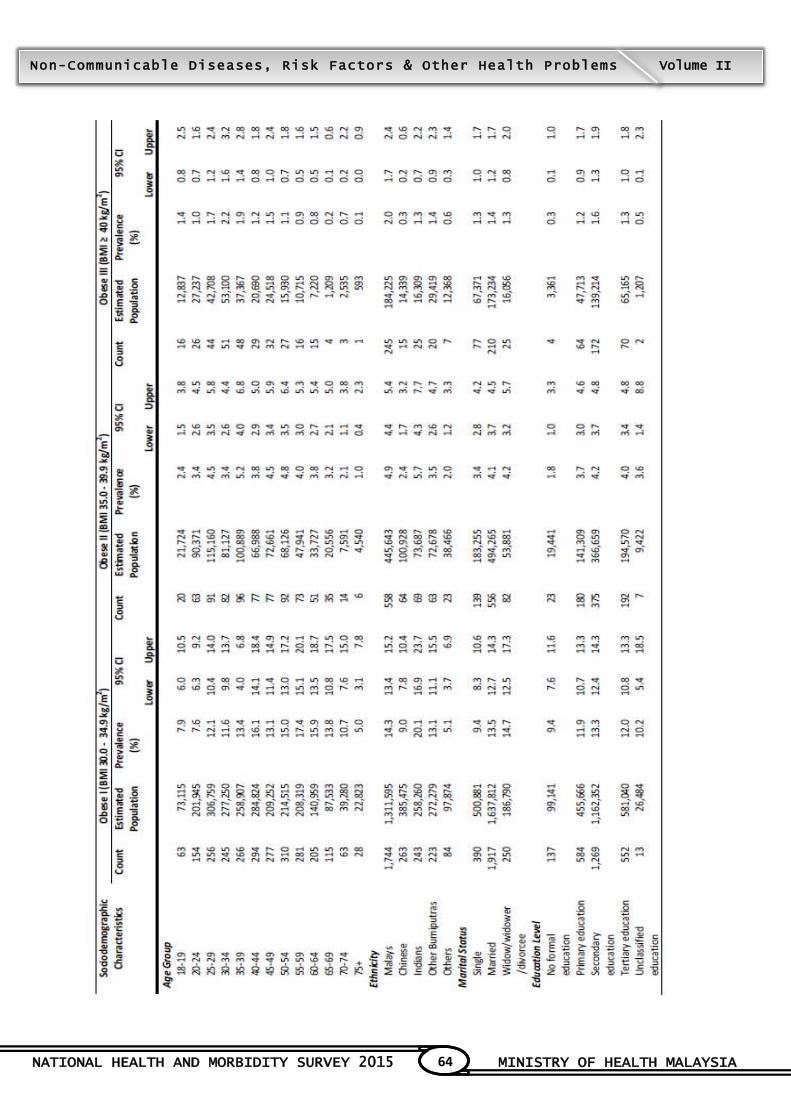
NATIONAL HEALTH AND MORBIDITY SURVEY 2015 MINISTRY OF HEALTH MALAYSIA
64
Non-Communicable Diseases, Risk Factors & Other Health Problems Volume II
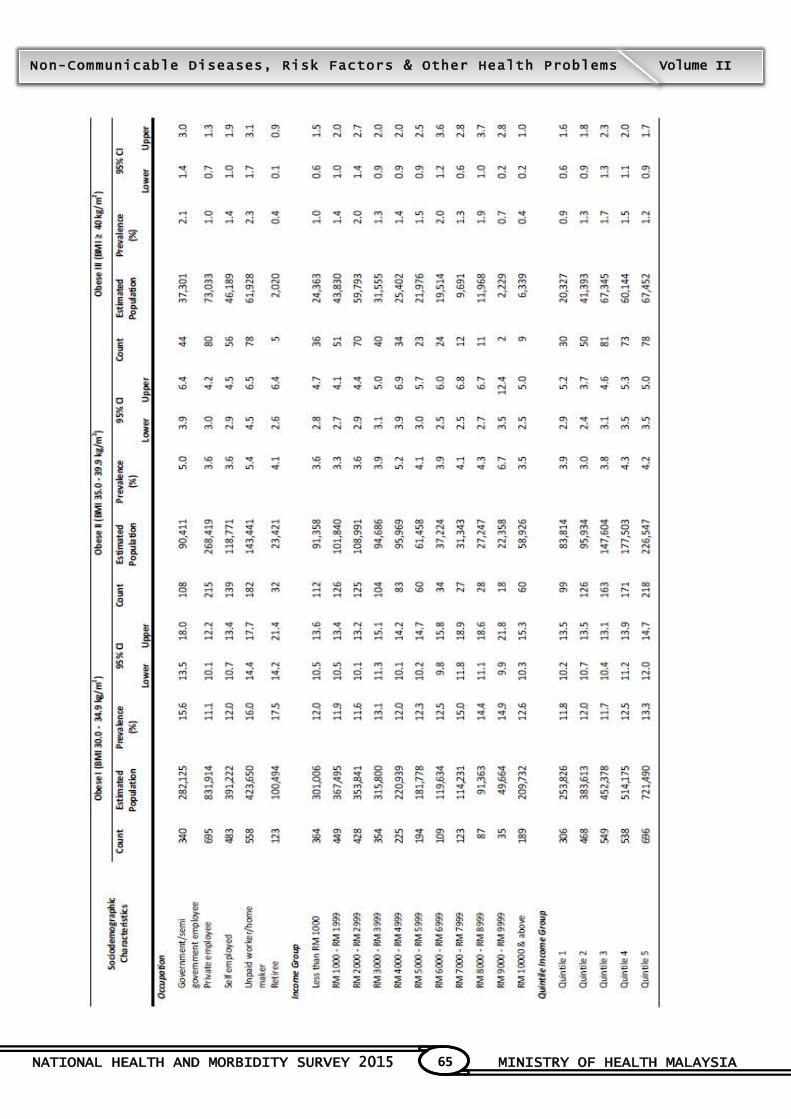
NATIONAL HEALTH AND MORBIDITY SURVEY 2015 MINISTRY OF HEALTH MALAYSIA
65
Non-Communicable Diseases, Risk Factors & Other Health Problems Volume II
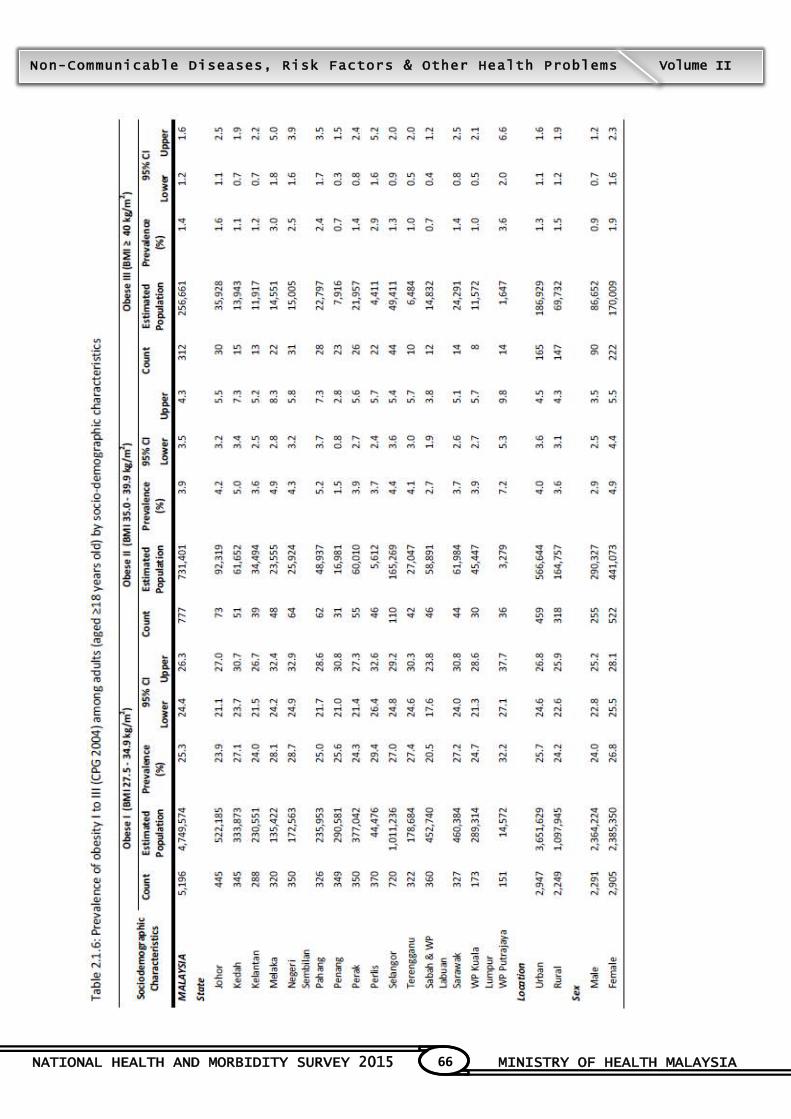
NATIONAL HEALTH AND MORBIDITY SURVEY 2015 MINISTRY OF HEALTH MALAYSIA
66
Non-Communicable Diseases, Risk Factors & Other Health Problems Volume II
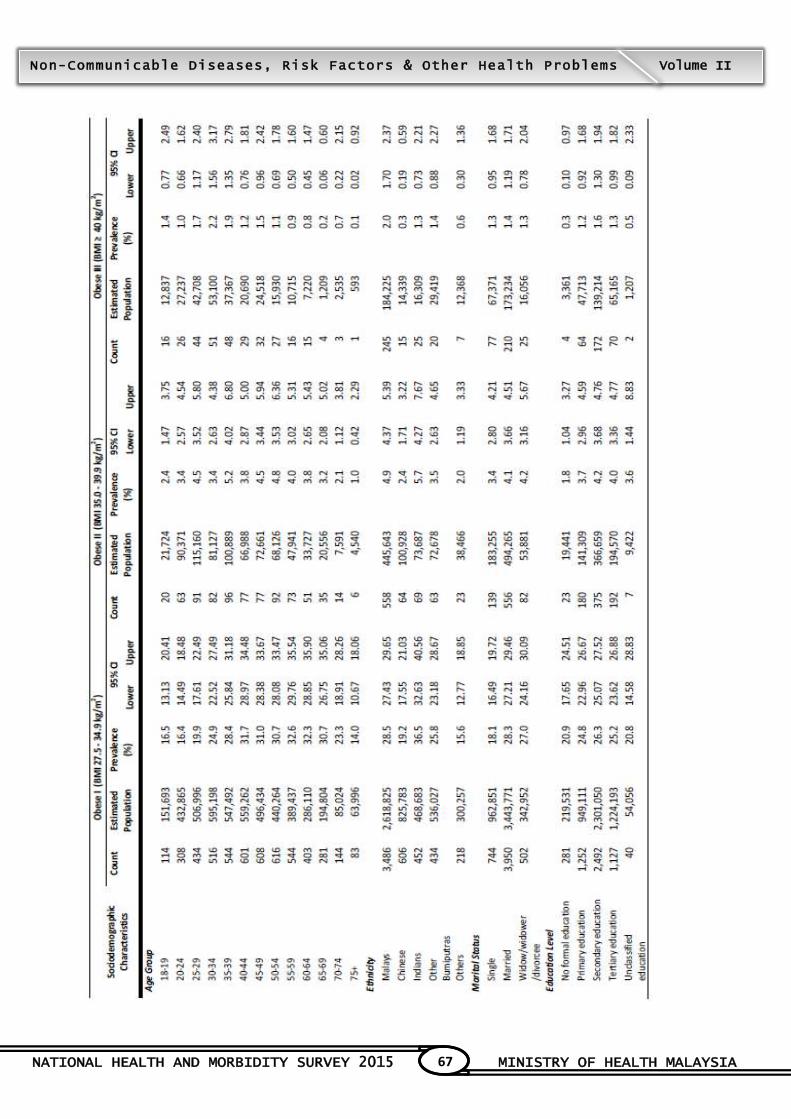
NATIONAL HEALTH AND MORBIDITY SURVEY 2015 MINISTRY OF HEALTH MALAYSIA
67
Non-Communicable Diseases, Risk Factors & Other Health Problems Volume II
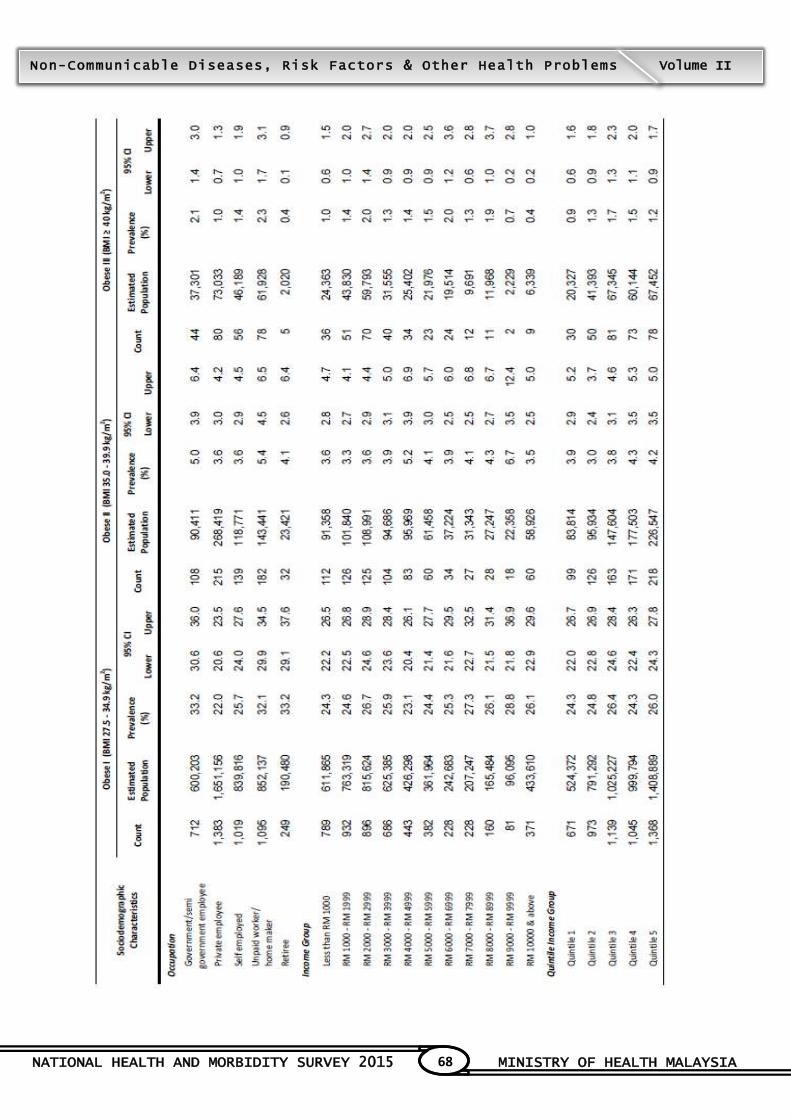
NATIONAL HEALTH AND MORBIDITY SURVEY 2015 MINISTRY OF HEALTH MALAYSIA
68
Non-Communicable Diseases, Risk Factors & Other Health Problems Volume II
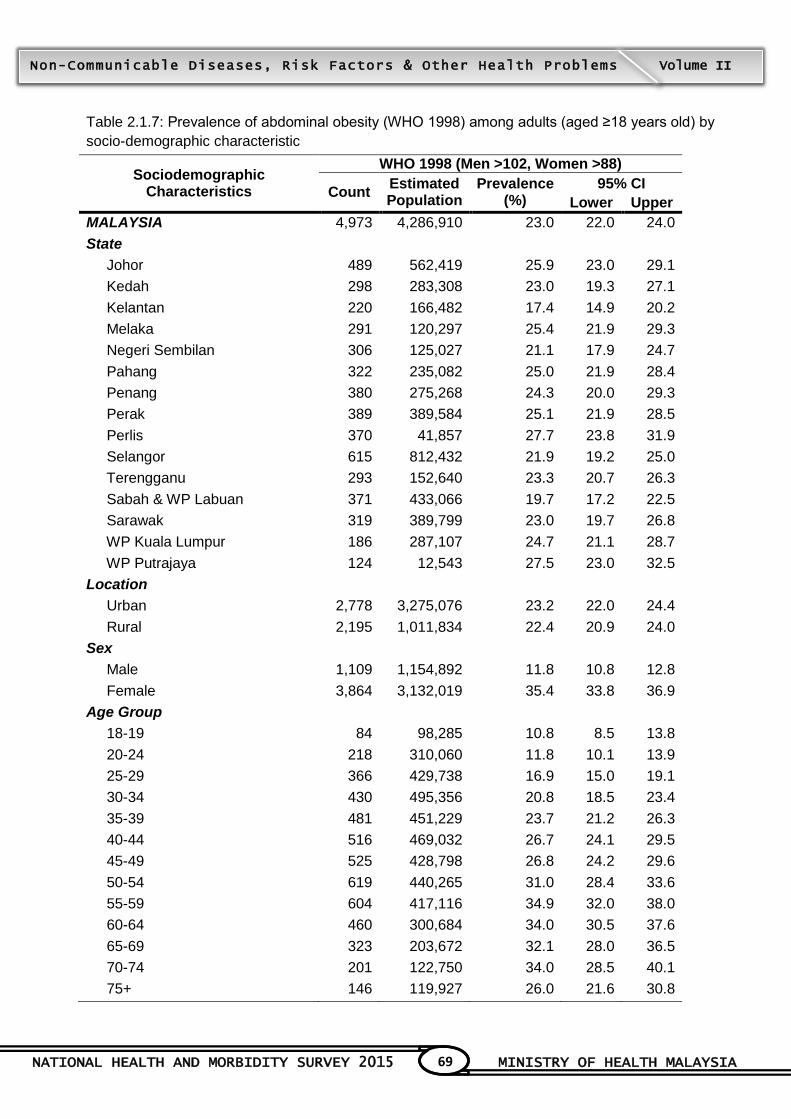
NATIONAL HEALTH AND MORBIDITY SURVEY 2015 MINISTRY OF HEALTH MALAYSIA
69
Non-Communicable Diseases, Risk Factors & Other Health Problems Volume II
Table 2.1.7: Prevalence of abdominal obesity (WHO 1998) among adults (aged ≥18 years old) by
socio-demographic characteristic
Sociodemographic Characteristics
WHO 1998 (Men >102, Women >88)
Count Estimated Population
Prevalence (%)
95% CI
Lower Upper
MALAYSIA 4,973 4,286,910 23.0 22.0 24.0
State
Johor 489 562,419 25.9 23.0 29.1
Kedah 298 283,308 23.0 19.3 27.1
Kelantan 220 166,482 17.4 14.9 20.2
Melaka 291 120,297 25.4 21.9 29.3
Negeri Sembilan 306 125,027 21.1 17.9 24.7
Pahang 322 235,082 25.0 21.9 28.4
Penang 380 275,268 24.3 20.0 29.3
Perak 389 389,584 25.1 21.9 28.5
Perlis 370 41,857 27.7 23.8 31.9
Selangor 615 812,432 21.9 19.2 25.0
Terengganu 293 152,640 23.3 20.7 26.3
Sabah & WP Labuan 371 433,066 19.7 17.2 22.5
Sarawak 319 389,799 23.0 19.7 26.8
WP Kuala Lumpur 186 287,107 24.7 21.1 28.7
WP Putrajaya 124 12,543 27.5 23.0 32.5
Location
Urban 2,778 3,275,076 23.2 22.0 24.4
Rural 2,195 1,011,834 22.4 20.9 24.0
Sex
Male 1,109 1,154,892 11.8 10.8 12.8
Female 3,864 3,132,019 35.4 33.8 36.9
Age Group
18-19 84 98,285 10.8 8.5 13.8
20-24 218 310,060 11.8 10.1 13.9
25-29 366 429,738 16.9 15.0 19.1
30-34 430 495,356 20.8 18.5 23.4
35-39 481 451,229 23.7 21.2 26.3
40-44 516 469,032 26.7 24.1 29.5
45-49 525 428,798 26.8 24.2 29.6
50-54 619 440,265 31.0 28.4 33.6
55-59 604 417,116 34.9 32.0 38.0
60-64 460 300,684 34.0 30.5 37.6
65-69 323 203,672 32.1 28.0 36.5
70-74 201 122,750 34.0 28.5 40.1
75+ 146 119,927 26.0 21.6 30.8
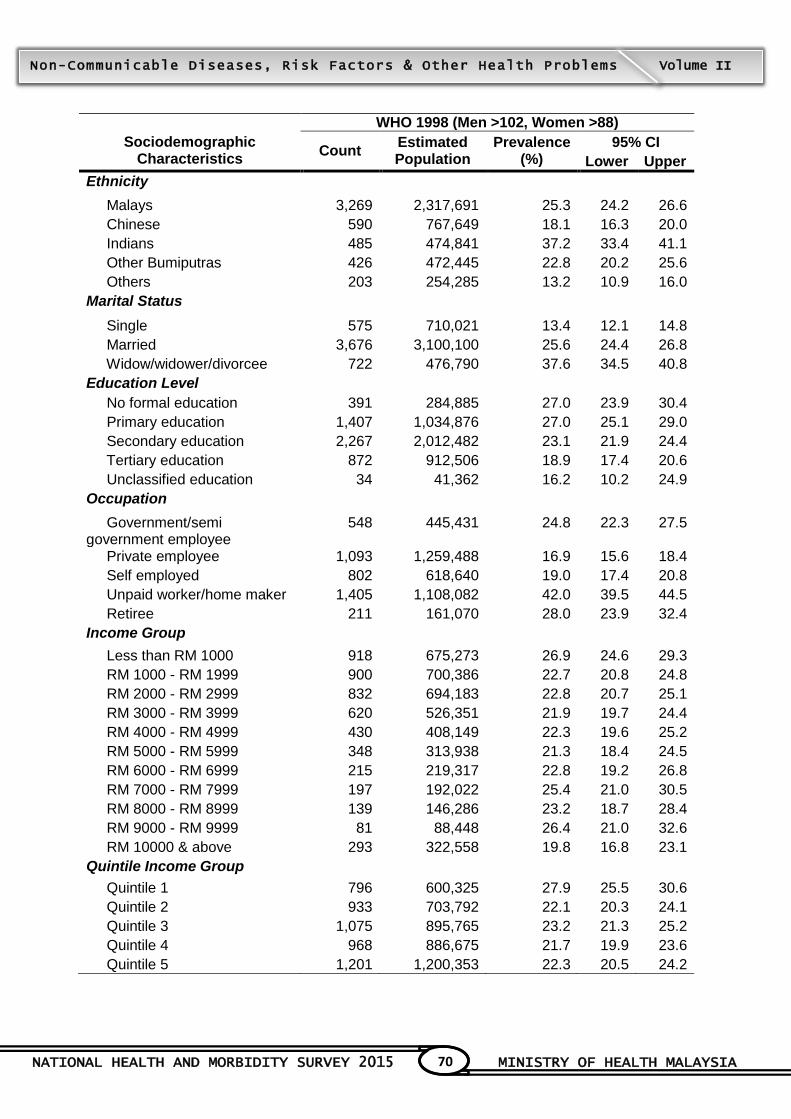
NATIONAL HEALTH AND MORBIDITY SURVEY 2015 MINISTRY OF HEALTH MALAYSIA
70
Non-Communicable Diseases, Risk Factors & Other Health Problems Volume II
Sociodemographic
Characteristics
WHO 1998 (Men >102, Women >88)
Count Estimated Population
Prevalence (%)
95% CI
Lower Upper
Ethnicity
Malays 3,269 2,317,691 25.3 24.2 26.6
Chinese 590 767,649 18.1 16.3 20.0
Indians 485 474,841 37.2 33.4 41.1
Other Bumiputras 426 472,445 22.8 20.2 25.6
Others 203 254,285 13.2 10.9 16.0
Marital Status
Single 575 710,021 13.4 12.1 14.8
Married 3,676 3,100,100 25.6 24.4 26.8
Widow/widower/divorcee 722 476,790 37.6 34.5 40.8
Education Level
No formal education 391 284,885 27.0 23.9 30.4
Primary education 1,407 1,034,876 27.0 25.1 29.0
Secondary education 2,267 2,012,482 23.1 21.9 24.4
Tertiary education 872 912,506 18.9 17.4 20.6
Unclassified education 34 41,362 16.2 10.2 24.9
Occupation
Government/semi government employee
548 445,431 24.8 22.3 27.5
Private employee 1,093 1,259,488 16.9 15.6 18.4
Self employed 802 618,640 19.0 17.4 20.8
Unpaid worker/home maker 1,405 1,108,082 42.0 39.5 44.5
Retiree 211 161,070 28.0 23.9 32.4
Income Group
Less than RM 1000 918 675,273 26.9 24.6 29.3
RM 1000 - RM 1999 900 700,386 22.7 20.8 24.8
RM 2000 - RM 2999 832 694,183 22.8 20.7 25.1
RM 3000 - RM 3999 620 526,351 21.9 19.7 24.4
RM 4000 - RM 4999 430 408,149 22.3 19.6 25.2
RM 5000 - RM 5999 348 313,938 21.3 18.4 24.5
RM 6000 - RM 6999 215 219,317 22.8 19.2 26.8
RM 7000 - RM 7999 197 192,022 25.4 21.0 30.5
RM 8000 - RM 8999 139 146,286 23.2 18.7 28.4
RM 9000 - RM 9999 81 88,448 26.4 21.0 32.6
RM 10000 & above 293 322,558 19.8 16.8 23.1
Quintile Income Group
Quintile 1 796 600,325 27.9 25.5 30.6
Quintile 2 933 703,792 22.1 20.3 24.1
Quintile 3 1,075 895,765 23.2 21.3 25.2
Quintile 4 968 886,675 21.7 19.9 23.6
Quintile 5 1,201 1,200,353 22.3 20.5 24.2
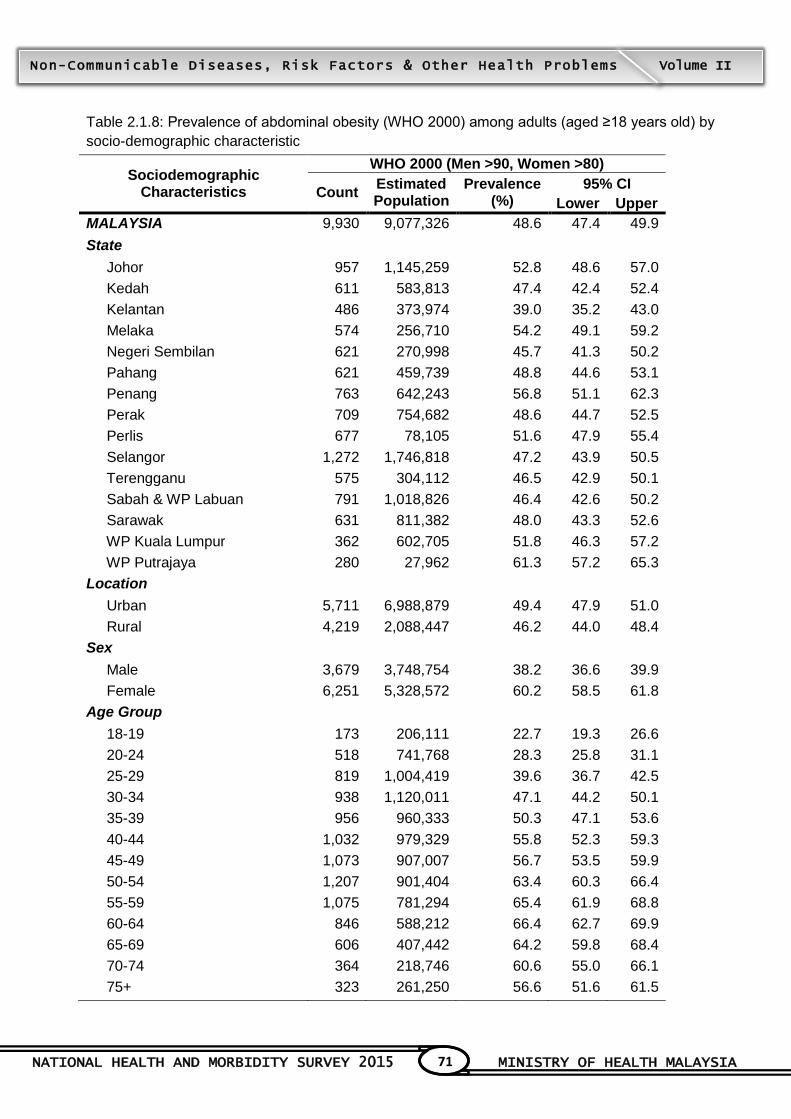
NATIONAL HEALTH AND MORBIDITY SURVEY 2015 MINISTRY OF HEALTH MALAYSIA
71
Non-Communicable Diseases, Risk Factors & Other Health Problems Volume II
Table 2.1.8: Prevalence of abdominal obesity (WHO 2000) among adults (aged ≥18 years old) by
socio-demographic characteristic
Sociodemographic Characteristics
WHO 2000 (Men >90, Women >80)
Count Estimated Population
Prevalence (%)
95% CI
Lower Upper
MALAYSIA 9,930 9,077,326 48.6 47.4 49.9
State
Johor 957 1,145,259 52.8 48.6 57.0
Kedah 611 583,813 47.4 42.4 52.4
Kelantan 486 373,974 39.0 35.2 43.0
Melaka 574 256,710 54.2 49.1 59.2
Negeri Sembilan 621 270,998 45.7 41.3 50.2
Pahang 621 459,739 48.8 44.6 53.1
Penang 763 642,243 56.8 51.1 62.3
Perak 709 754,682 48.6 44.7 52.5
Perlis 677 78,105 51.6 47.9 55.4
Selangor 1,272 1,746,818 47.2 43.9 50.5
Terengganu 575 304,112 46.5 42.9 50.1
Sabah & WP Labuan 791 1,018,826 46.4 42.6 50.2
Sarawak 631 811,382 48.0 43.3 52.6
WP Kuala Lumpur 362 602,705 51.8 46.3 57.2
WP Putrajaya 280 27,962 61.3 57.2 65.3
Location
Urban 5,711 6,988,879 49.4 47.9 51.0
Rural 4,219 2,088,447 46.2 44.0 48.4
Sex
Male 3,679 3,748,754 38.2 36.6 39.9
Female 6,251 5,328,572 60.2 58.5 61.8
Age Group
18-19 173 206,111 22.7 19.3 26.6
20-24 518 741,768 28.3 25.8 31.1
25-29 819 1,004,419 39.6 36.7 42.5
30-34 938 1,120,011 47.1 44.2 50.1
35-39 956 960,333 50.3 47.1 53.6
40-44 1,032 979,329 55.8 52.3 59.3
45-49 1,073 907,007 56.7 53.5 59.9
50-54 1,207 901,404 63.4 60.3 66.4
55-59 1,075 781,294 65.4 61.9 68.8
60-64 846 588,212 66.4 62.7 69.9
65-69 606 407,442 64.2 59.8 68.4
70-74 364 218,746 60.6 55.0 66.1
75+ 323 261,250 56.6 51.6 61.5
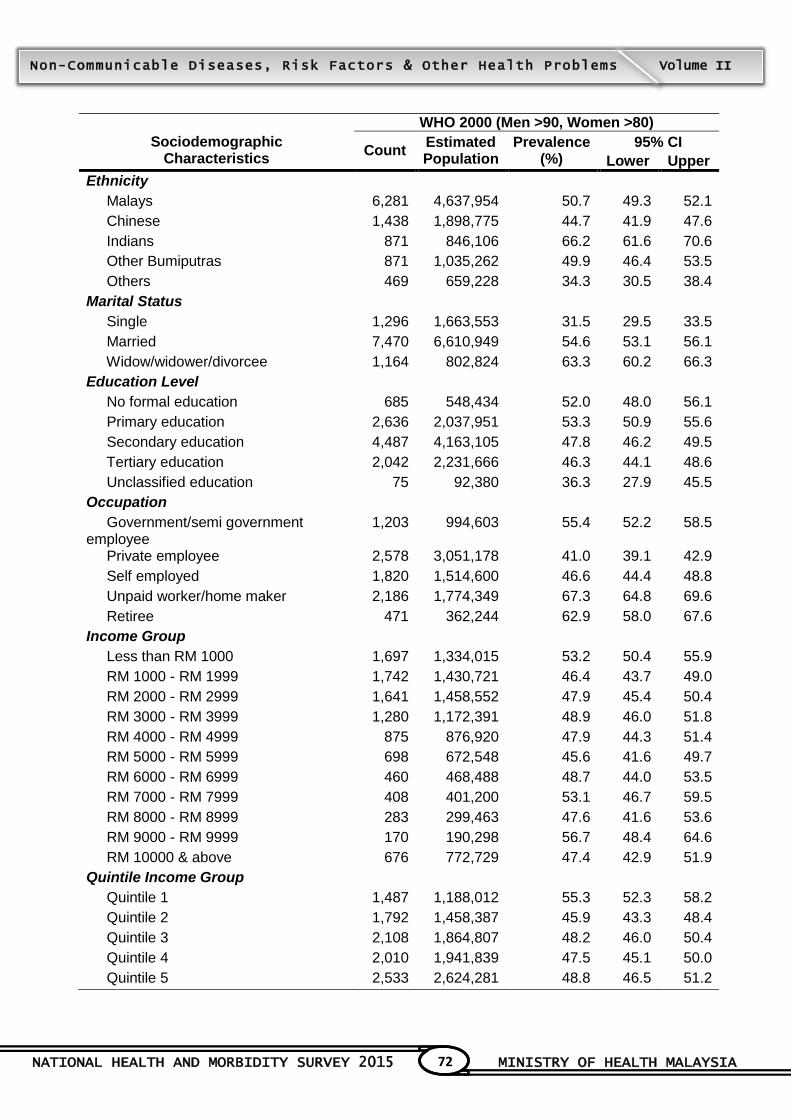
NATIONAL HEALTH AND MORBIDITY SURVEY 2015 MINISTRY OF HEALTH MALAYSIA
72
Non-Communicable Diseases, Risk Factors & Other Health Problems Volume II
Sociodemographic
Characteristics
WHO 2000 (Men >90, Women >80)
Count Estimated Population
Prevalence (%)
95% CI
Lower Upper
Ethnicity
Malays 6,281 4,637,954 50.7 49.3 52.1
Chinese 1,438 1,898,775 44.7 41.9 47.6
Indians 871 846,106 66.2 61.6 70.6
Other Bumiputras 871 1,035,262 49.9 46.4 53.5
Others 469 659,228 34.3 30.5 38.4
Marital Status
Single 1,296 1,663,553 31.5 29.5 33.5
Married 7,470 6,610,949 54.6 53.1 56.1
Widow/widower/divorcee 1,164 802,824 63.3 60.2 66.3
Education Level
No formal education 685 548,434 52.0 48.0 56.1
Primary education 2,636 2,037,951 53.3 50.9 55.6
Secondary education 4,487 4,163,105 47.8 46.2 49.5
Tertiary education 2,042 2,231,666 46.3 44.1 48.6
Unclassified education 75 92,380 36.3 27.9 45.5
Occupation
Government/semi government employee
1,203 994,603 55.4 52.2 58.5
Private employee 2,578 3,051,178 41.0 39.1 42.9
Self employed 1,820 1,514,600 46.6 44.4 48.8
Unpaid worker/home maker 2,186 1,774,349 67.3 64.8 69.6
Retiree 471 362,244 62.9 58.0 67.6
Income Group
Less than RM 1000 1,697 1,334,015 53.2 50.4 55.9
RM 1000 - RM 1999 1,742 1,430,721 46.4 43.7 49.0
RM 2000 - RM 2999 1,641 1,458,552 47.9 45.4 50.4
RM 3000 - RM 3999 1,280 1,172,391 48.9 46.0 51.8
RM 4000 - RM 4999 875 876,920 47.9 44.3 51.4
RM 5000 - RM 5999 698 672,548 45.6 41.6 49.7
RM 6000 - RM 6999 460 468,488 48.7 44.0 53.5
RM 7000 - RM 7999 408 401,200 53.1 46.7 59.5
RM 8000 - RM 8999 283 299,463 47.6 41.6 53.6
RM 9000 - RM 9999 170 190,298 56.7 48.4 64.6
RM 10000 & above 676 772,729 47.4 42.9 51.9
Quintile Income Group
Quintile 1 1,487 1,188,012 55.3 52.3 58.2
Quintile 2 1,792 1,458,387 45.9 43.3 48.4
Quintile 3 2,108 1,864,807 48.2 46.0 50.4
Quintile 4 2,010 1,941,839 47.5 45.1 50.0
Quintile 5 2,533 2,624,281 48.8 46.5 51.2

NATIONAL HEALTH AND MORBIDITY SURVEY 2015 MINISTRY OF HEALTH MALAYSIA
73
Non-Communicable Diseases, Risk Factors & Other Health Problems Volume II
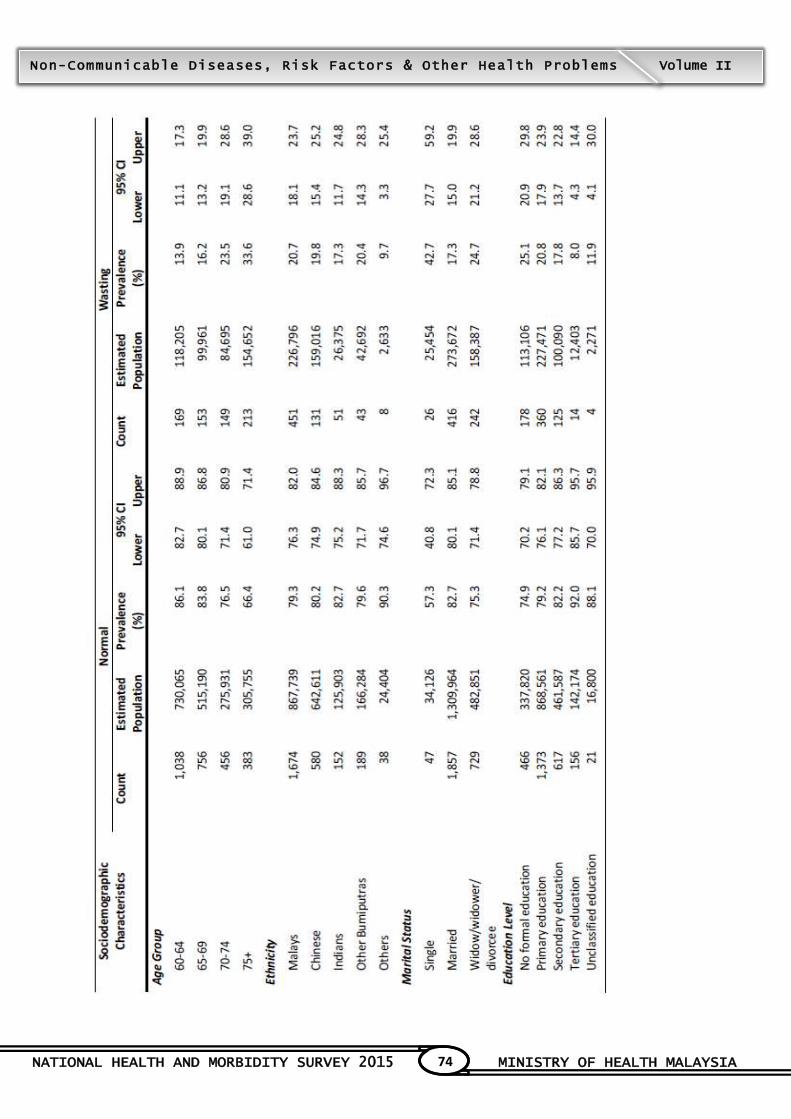
NATIONAL HEALTH AND MORBIDITY SURVEY 2015 MINISTRY OF HEALTH MALAYSIA
74
Non-Communicable Diseases, Risk Factors & Other Health Problems Volume II

NATIONAL HEALTH AND MORBIDITY SURVEY 2015 MINISTRY OF HEALTH MALAYSIA
75
Non-Communicable Diseases, Risk Factors & Other Health Problems Volume II
NATIONAL HEALTH AND MORBIDITY SURVEY 2015 MINISTRY OF HEALTH MALAYSIA
76
Non-Communicable Diseases, Risk Factors & Other Health Problems Volume II
2.2 NUTRITIONAL STATUS OF CHILDREN (AGE < 18 YEARS OLD)
Contributors to this section: Rashidah Ambak, Fatimah Othman, Nor Azian Mohd Zaki, Nur
Shahida Abd Aziz, Cheong Siew Man, Azli Baharuddin, Mohamad Hasnan Ahmad, Ahmad Ali
Zainuddin, Rusidah Selamat, Norlida Zulkafly
2.2.1 Background
Nutritional status contributes to a healthy development of children. Anthropometric measurements
are part of nutritional status components to assess body size, composition and reflect adequate,
inadequate or excessive food intake. It also reflects individual activity level and disease. They
demonstrate that deprivation and excess may coexist, not only across but also take places in the
household, community or the country. Performing simple body measurements also permit the
selection of individual, family or the community for intervention that can improve not only nutrition
but also their health as a whole.
2.2.2 Objectives
2.2.2.1 General Objective
To determine the nutritional status among Malaysian children aged below 18 years old.
2.2.2.2 Specific objectives
a. To determine the prevalence of underweight, normal weight, overweight, obesity, stunting
and wasting among Malaysian children below 18 years old.
b. To determine the prevalence of underweight, normal weight, overweight, obesity, stunting
and wasting among Malaysian children by socio-demography subgroups.
2.2.3 Target Population, Study Instrument And Definitions
Nutritional status for children below 18 years old was calculated based on the Centre of Disease
Control Growth Chart (CDC Growth Chart, 200). Four indices were used to reflect the nutritional
status for children: height for age z-score (HAZ), Body Mass Index (BMI) for age, weight for age
and weight for height. These measurements were taken based on standard procedures from the
protocol of World Health Organization (WHO, 1995).
Weight was measured using Tanita Digital Weighing Scale (Tanita 1583, Japan) to the nearest 0.1
kilogram. The standing height was measured without shoes using SECA Portable Stadiometer
(SECA 213 Germany) to the nearest 0.1 centimetre. Measuring mat (SECA 210) was used to
measure children below 2 years old which were not able to stand steadily. All measurements were
taken twice and the average value was used for data entry.
NATIONAL HEALTH AND MORBIDITY SURVEY 2015 MINISTRY OF HEALTH MALAYSIA
77
Non-Communicable Diseases, Risk Factors & Other Health Problems Volume II
Classification of Z score and BMI cut off point for nutritional status (WHO, 2006):
<-2SD Low weight for age Underweight
Low height for age Stunting
Low weight for height Wasting
BMI Thinness
>+2SD Weight for age Overweight
BMI, 0-5 years old Overweight
BMI, 5-19 years old Obesity
2.2.4 Findings
2.2.4.1 Prevalence of thinness (BMI for age <-2SD)
The findings of the survey showed that the national prevalence of thinness (BMI for age <-2SD),
was 7.8% (95% CI: 7.1, 8.6). By state, Kedah had the highest prevalence of thinness [10.1% (95%
CI: 7.9, 12.8)] and the lowest in Negeri Sembilan at 4.5% (95% CI: 3.1, 6.4). The prevalence of
thinness was higher among residents in the urban [8.0% (95% CI: 7.1, 9.1) than in rural areas
[7.2% (95 CI: 6.2, 8.4)]. The survey found a higher prevalence among boys 8.7% (95% CI: 7.6,
9.9) compared to girls [6.9% (95% CI: 6.0, 7.9). By age groups, the highest prevalence was noted
among children aged 5 to 9 years [9.0% (95% CI: 7.2, 11.1)] and lowest among children aged 10 -
14 years old [6.9% (95% CI: 5.8, 8.2)]. According to the ethnic groups, Indians had the highest
prevalence of thinness [11.3% (95% CI: 7.8, 16.0)], followed by Others [9.7% (95% CI: 6.2, 15.0)],
while the lowest prevalence was found among Other Bumiputra ethnicity [6.1% (95% CI: 6.1, 4.6)].
2.2.4.2 Prevalence of normal nutritional status (BMI for age >-2SD - ≤+2SD)
Overall, the survey found 80.3% (95% CI: 79.1, 81.5) of the children with normal BMI. The state of
Sabah & WP Labuan had the highest prevalence of children with normal BMI for age [85.0% (95%
CI: 81.0, 88.4)] and the lowest prevalence was in WP Kuala Lumpur [72.8% (95% CI: 62.5, 81.2)].
Children from rural areas showed a high prevalence of normal BMI for age [81.6% (95% CI: 80.0,
83.2)] than their counterparts in urban areas [79.8% (95% CI: 78.3, 81.3)]. Higher prevalence of
normal BMI for age was shown among girls [83.1% (95% CI: 81.7, 84.5)] compared to the boys
[77.7% (95% CI: 75.9, 79.4)]. By age group, the highest prevalence of children with normal BMI for
age was found among children below 5 years old [84.2% (95% CI: 82.1, 86.2)] and the lowest
among children aged 5 - 9 years at 76.2% [(95% CI: 73.8, 78.5)].
2.2.4.3 Prevalence of obesity (BMI for age >+2SD)
National prevalence of obesity (BMI for age >+2SD) was 11.9% (95% CI: 10.9, 12.9). By state,
Perak had the highest prevalence of obesity [14.1% (95% CI: 10.3, 19.0)] and the lowest in Sabah
& WP Labuan [8.0% (95% CI: 6.0, 10.5)]. The prevalence of obesity was slightly higher among
children in the urban areas [12.1% (95% CI: 10.9, 13.5)] than in the rural areas 11.2% [(95% CI:
9.9, 12.6)] and significant among boys [13.6% (95% CI: 12.2, 15.2)] compared to girls [10.0%
(95% CI: 8.9, 11.3)]. By age group, the highest prevalence was noted among children aged 5-9
years [14.8% (95% CI: 13.0, 16.7)] followed by children aged 10-14 years [14.4% (95% CI: 12.6,
16.4)]. Among ethnic groups, Chinese had the highest prevalence of obesity [13.0% (95% CI:
10.0, 16.8)], followed by Indians and Malays at [12.6% (95% CI: 8.7, 17.9)] and [11.8 % (95% CI:
10.7, 13.1)] respectively.
NATIONAL HEALTH AND MORBIDITY SURVEY 2015 MINISTRY OF HEALTH MALAYSIA
78
Non-Communicable Diseases, Risk Factors & Other Health Problems Volume II
2.2.4.4 Prevalence of underweight (weight for age <-2SD)
The national prevalence of underweight (weight for age<-2SD) was 13.0% (95% CI: 11.7, 14.5).
By state, Pahang had the highest prevalence of underweight [17.1% (95% CI: 13.4, 21.6)] followed
by Sabah & WP Labuan [16.7% (95% CI: 12.1, 22.5)]. In contrast, Penang had the lowest
prevalence of underweight at 5.6% (95% CI: 2.7, 11.1). Children from rural areas had higher
prevalence of underweight [14.9% (95% CI: 13.0, 17.0) compared to children from urban areas
[12.3% (95%CI: 10.7, 14.1)]. The prevalence of underweight was lower among girls [12.2% (95%
CI: 10.7, 13.9)] than boys [13.8% (95% CI: 11.9, 15.9)]. By age group, the highest prevalence was
noted among children aged 5 to 9 years [13.6% (95% CI: 11.7, 15.8)] and lowest prevalence was
among children below 5 years old [12.4 % (95% CI: 10.9, 14.1)].
2.2.4.5 Prevalence of stunting (height for age <-2SD)
The national prevalence of stunting (height for age <-2SD) among children was 13.4% (95% CI:
12.4, 14.5). By state, Kelantan, Pahang and Terengganu showed similar prevalence of stunting
[18.2% (95% CI: 14.9, 22.0)], [18.2% (95% CI: 13.9, 23.4)], [18.1% (95% CI: 15.1, 21.5)]
respectively. Children from rural areas showed significantly higher prevalence of stunting [16.8%
(95% CI: 15.2, 18.5)] than children from urban areas [12.1% (95% CI: 10.9, 13.5). Girls showed a
higher prevalence of stunting [14.1% (95% CI: 12.8, 15.6)] than boys [12.7% (95% CI: 11.5, 14.1)].
By age group, the highest prevalence of stunting was noted among children below 5 years old at
17.7% (95% CI: 15.7, 19.8) and the lowest was among children aged 10-14 years [11.0% (95% CI:
9.5, 12.7)].
2.2.4.6 Prevalence of wasting (weight for height <-2SD)
The national prevalence of wasting (weight for height <-2SD) among children was 7.9% (95% CI:
6.7, 9.4). By state, Selangor [10.9% (95% CI: 7.5, 15.5)] had the highest prevalence of wasting
followed by Kelantan [10.2% (95% CI: 6.3, 15.9)] and Perak [9.3% (95% CI: 5.0, 16.6)]. Children
from urban areas showed a higher prevalence of wasting [8.2% (95% CI: 6.7, 10.1)] than children
from rural areas [7.2% (95% CI: 5.6, 9.2)]. Boys showed a higher prevalence of wasting [9.2%
(95% CI: 7.3, 11.5)] than girls [6.6% (95% CI: 5.1, 8.5)]. By age group, the highest prevalence of
wasting was noted among children below 5 years old at 8.0% (95% CI: 6.8, 9.5) and the lowest
among children aged 5 - 9 years at 0.5% (95% CI: 0.1, 3.8).
2.2.5 Conclusion
The overall prevalence of thinness among children aged less than 18 years old was quite low.
Thinness problem was highest in Kedah, among boys, children aged 5 to 9 years old, and Indians.
Meanwhile, the prevalence of obesity was highest in Perak, and among boys, children aged 5 to 9
years old and 10 to 14 years old. Underweight was most prevalent in Pahang, Sabah / Labuan,
rural areas and among boys. Stunting was significantly higher in the rural areas, among girls and
children less than 5 years old. Stunting was also prevalent in Kelantan, Pahang and Terengganu.
On the other hand, wasting was significantly prevalent in the urban areas, among boys and
children aged less than 5 years old.
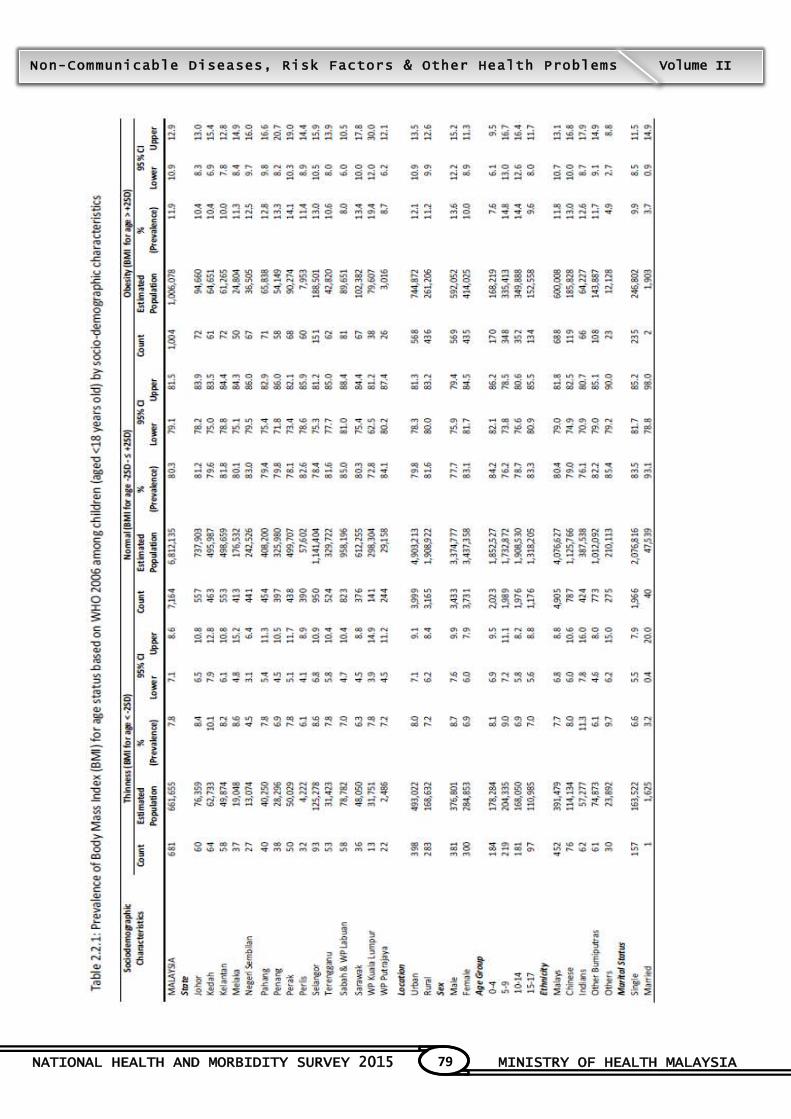
NATIONAL HEALTH AND MORBIDITY SURVEY 2015 MINISTRY OF HEALTH MALAYSIA
79
Non-Communicable Diseases, Risk Factors & Other Health Problems Volume II
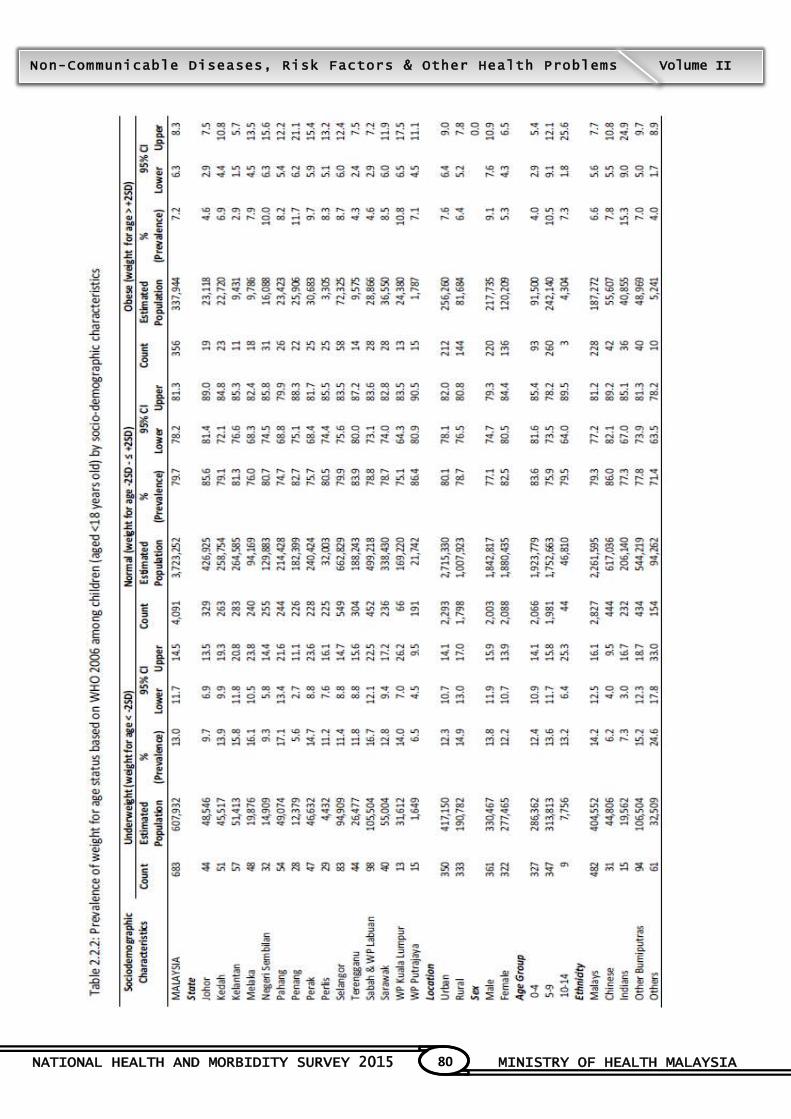
NATIONAL HEALTH AND MORBIDITY SURVEY 2015 MINISTRY OF HEALTH MALAYSIA
80
Non-Communicable Diseases, Risk Factors & Other Health Problems Volume II
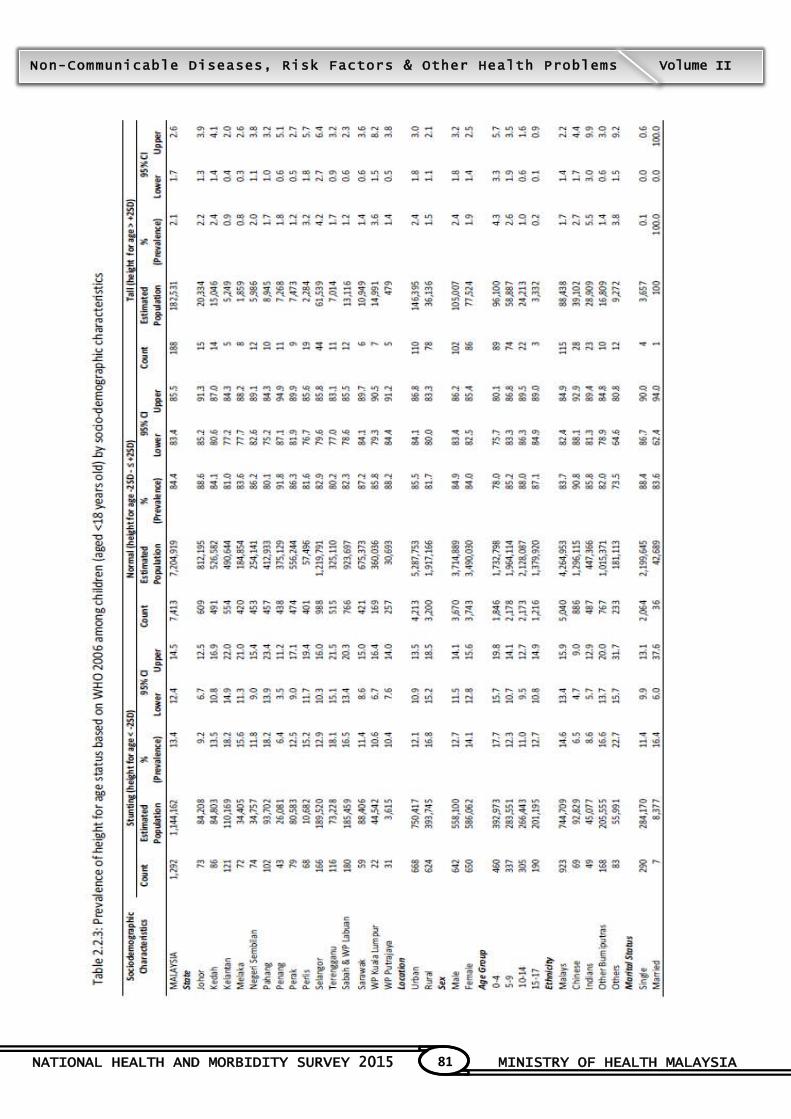
NATIONAL HEALTH AND MORBIDITY SURVEY 2015 MINISTRY OF HEALTH MALAYSIA
81
Non-Communicable Diseases, Risk Factors & Other Health Problems Volume II
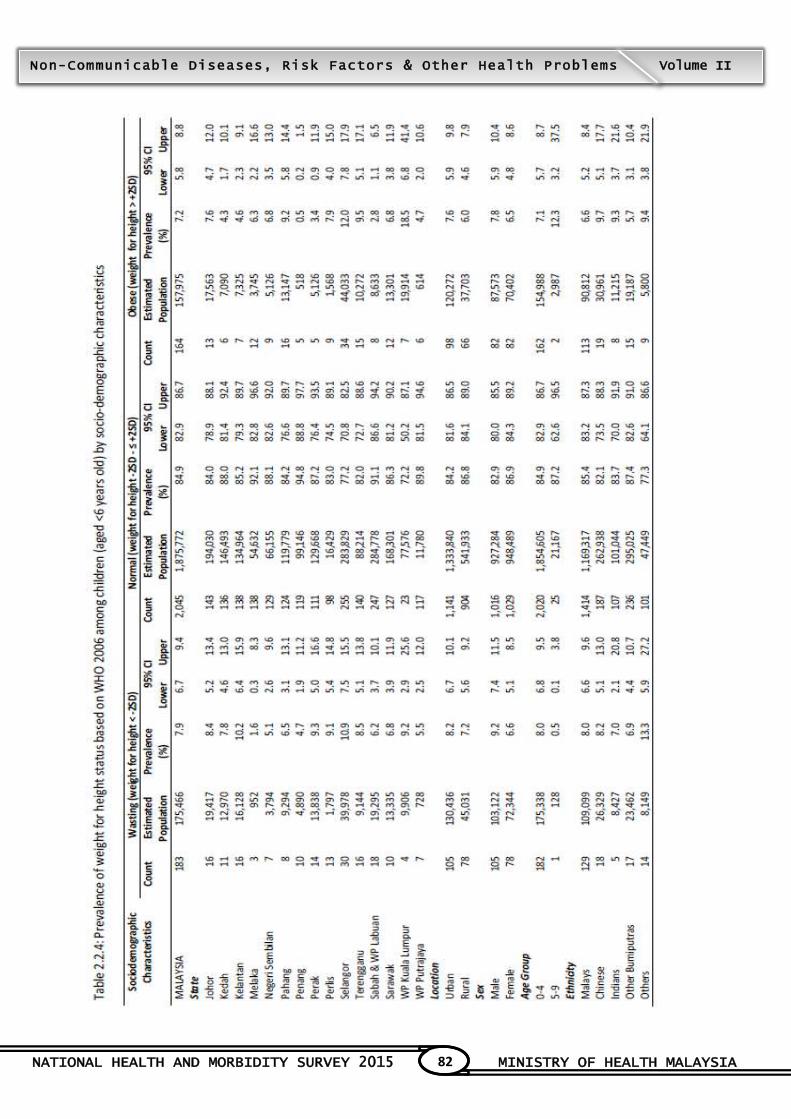
NATIONAL HEALTH AND MORBIDITY SURVEY 2015 MINISTRY OF HEALTH MALAYSIA
82
Non-Communicable Diseases, Risk Factors & Other Health Problems Volume II

TOPIC 3

NATIONAL HEALTH AND MORBIDITY SURVEY 2015 MINISTRY OF HEALTH MALAYSIA
84
Non-Communicable Diseases, Risk Factors & Other Health Problems Volume II
3. TOBACCO USE
Contributors to this section: Muhammad Fadhli Yusoff, Mohd Azahadi Omar, Norayana Hasan,
Nizam Baharom, Christopher Eugene, Tee Guat Hiong, Lim Kuang Hock, Abdul Aiman Abd Ghani,
Jane Ling Miaw Yn, Gunenthira Rao a/l Subbarao,
3.1 Background
Smoking-related diseases such as cancer and cardiovascular diseases are the main causes of
premature death in Malaysia for the past three decades. Smoking kills 20,000 Malaysians every
year and will increase to 30,000 by the year 2020 if the pattern of smoking does not change1.
Studies on the burden of diseases in 2003 and 2011 revealed that one-fifth of disability adjusted
life years (DALYs) and one-third of years of life lost (YLL) for Malaysians were due to smoking-
related diseases2. The current pattern of morbidity and mortality will continue in the future in view
of almost half of adult males are current smokers and a third of adolescents aged 13-15 years old
also practice the similar behavior3. In addition, Malaysia spends as much as RM 2.92 billion per
year treating chronic obstructive pulmonary disease, ischemic heart disease and lung cancer4.
Malaysia needs to reduce the smoking prevalence to 15% by the year 2025, if we are to achieve
the World Health Organization Non Communicable Diseases Global Target.
3.2 Objectives
3.2.1 General Objective
To determine the prevalence of current smokers by social demographic characteristic
among adults aged 15 years and above in Malaysia.
3.2.2 Specific objectives
a. To determine the prevalence of current smokers and passive smokers by socio-
demographic characteristics.
b. To establish smoking patterns among current smokers by socio-demographic
characteristics.
c. To identify cessation behaviour of current smokers by socio-demographic characteristics.
d. To determine awareness of anti-smoking campaign among respondents.
e. To determine awareness of health warning on cigarette packages by current smokers.
f. To determine awareness of cigarette promotion and advertising among respondents.
3.3 Target Population, Study Instrument And Definitions
The target population consisted of non-institution respondents aged 15 years and above in
Malaysia. The study used the short version of Global Adult Tobacco Surveillance questionnaire,
which had been translated, pre-tested and validated among selected respondents in Bangsar,
Wilayah Persekutuan Kuala Lumpur. The questionnaire consisted of 20 items which measured
the proportion of daily and occasional smokers among participants aged 15 years and above;
types and quantities of tobacco products smoked; exposure to secondhand smoke at home and
work place among smokers and non-smokers; smoking cessation behaviour among current
smokers; awareness of anti-smoking campaign, cigarette advertising and promotion.

NATIONAL HEALTH AND MORBIDITY SURVEY 2015 MINISTRY OF HEALTH MALAYSIA
85
Non-Communicable Diseases, Risk Factors & Other Health Problems Volume II
Definitions: Current smoker - Smoker who daily or occasionally smokes any tobacco product. Current smokeless tobacco user – Smoker who daily or occasionally use any smokeless tobacco product Tobacco product – Consist of: Smoked tobacco: which included manufactured cigarettes, hand-rolled cigarettes, kreteks, others smoked tobacco such as pipe, curut, cigar, cigarillos, water pipes/sisha hookah, bidis and others. Smokeless tobacco: snuff by keeping in mouth, nose, chewing tobacco, betel quid with tobacco, electronic cigarettes, and others.
3.4 Findings
A total of 21,410 adults aged 15 years and above responded to this module.
3.4.1 Smoking prevalence
3.4.1.1 Prevalence of current tobacco smoker
Overall, the prevalence of current smoker was 22.8% (95%CI: 21.9, 23.8). There was a slight
reduction from 23.1% reported in Global Adult Tobacco Survey (GATS) 2011. It was estimated
that nearly five million Malaysians aged 15 years and above smoked. The prevalence was highest
in Sabah and WP Labuan (28.4%, 95%CI: 25.2, 31.9), followed by Kedah (26.5%, 95%CI: 23.1,
30.2) and Pahang (25.5%, 95%CI: 21.8, 29.6); while the lowest prevalence was in WP Putrajaya
(12.4%, 95%CI: 9.8, 15.7). All three states (Malacca, Johor and Penang) with Smoke-free City
projects consistently had lower smoking prevalence than the national level. The proportion of
current smokers was 30 times higher among males compared to females (43.0%, 95%CI: 41.4,
44.6 vs 1.4%, 95%CI: 1.1, 1.8). It was also observed that the prevalence of male smokers had
reduced slightly from 43.9% in 2011 to 43.0% in the current survey. Nonetheless, the prevalence
among females had increased from 1.0% in 2011 to 1.4% in 2015.
Significantly higher prevalence of tobacco use was observed among respondents in rural areas
(27.9%, 95%CI: 26.3, 29.6), as compared to respondents in urban areas (21.2%, 95%CI: 20.1,
22.4). Lower proportion of current smokers was observed among the 15-19 years old age group at
13.2% (95%CI: 11.5,15.2) and peaked at 35-39 years old age group at 17.4% (95%CI: 15.3,19.7).
The lowest prevalence was reported among 75+ age group with prevalence at 9.2% (95%CI: 7.0,
12.1).
Approximately a quarter of Malays (24.7%, 95%CI: 23.6, 25.9) and other Bumiputras (25.8%,
95%CI: 23.4, 28.4) were current smokers and their prevalence were remarkably higher than
Chinese (14.2%, 95%CI: 12.7, 15.9) and Indians (16.5%, 95%CI: 14.0, 19.4). There was
considerable difference of smoking prevalence among those with different education background.
Respondents with tertiary education had the lowest prevalence at 14.9% (95%CI: 13.6, 16.3) when
compared to respondents with secondary education (25.2%, 95%CI: 23.3, 27.2) and primary
education attainment (25.8%, 95%CI: 24.5, 27.1). The study also revealed that the proportion of
NATIONAL HEALTH AND MORBIDITY SURVEY 2015 MINISTRY OF HEALTH MALAYSIA
86
Non-Communicable Diseases, Risk Factors & Other Health Problems Volume II
current smokers was notably lower among participants with Q1 income level (16.5%, 95%CI: 14.6,
18.6) and Q5 income level (19.3%, 95%CI: 17.7, 21.1) as compared to their counterparts from Q2
(26.8%, 95%CI: 24.8, 28.8), Q3 (25.1%, 95%CI: 23.4, 26.9) and Q4 (25.5%, 95%CI: 23.7, 27.4)
income levels.
One fifth (23.1%, 95%CI: 20.6, 25.8) of government/semi government employees were current
smokers. This proportion was lower compared to the private sector employees (31.7%, 95%CI:
29.9, 33.6) and the self-employed (35.4%, 95%CI: 33.2, 37.6). As for marital status,
widow/widower/divorcee were reported to have the lowest proportion of being current smokers
(9.7%, 95%CI: 8.0, 11.8) compared to married (23.8%, 95%CI: 22.8, 24.9) and single respondents
(23.6%, 95%CI: 21.9, 25.3).
3.4.1.2 Prevalence of smoked tobacco use
Approximately one fifth of the respondents (20.1%, 95%CI: 19.2, 21.0) smoked manufactured
cigarettes. The prevalence was remarkably higher among male current smokers (37.9%, 95%CI:
36.4, 39.4) as compared to female current smokers (1.1%, 95%CI: 0.8, 1.5). Smoked tobacco use
was also considerably higher among those in rural areas (23.1%, 95%CI: 21.8, 24.6) compared to
those in urban areas (19.1%, 95%CI: 18.0, 20.2). The study also showed that the respondents
with no formal education (15.5%, 95%CI: 12.1, 19.6) and those with tertiary education attainment
(13.8%, 95%CI: 12.6, 15.2) had lower prevalence of consuming manufactured cigarettes
compared to those with primary (20.7%, 95%CI: 18.8, 22.6) and secondary education attainment
(23.4%, 95%CI: 22.2, 24.6).
Only a small proportion (2.3%, 95%CI: 2.0, 2.6) of current smokers consumed hand-rolled
cigarettes. Hand-rolled cigarette consumption rates in Kedah (9.7%, 95%CI: 7.9, 11.8), Perlis
(7.4%, 95%CI: 5.8, 9.4) and Kelantan (6.0%, 95%CI: 4.6, 7.8) were 3-4 times higher than the
national prevalence. Hand-rolled cigarettes were more popular among older age groups (i.e. 50
years old and above). As for the ethnic groups, Malays were reported to have the highest
proportion of hand-rolled cigarettes consumption (3.5%, 95%CI: 3.1, 4.0), followed by Other
Bumiputras (2.2%, 95%CI: 1.5, 3.2), Chinese (0.4%, 95%CI: 0.2, 0.9) and Indians (0.4%, 95%CI:
0.1, 1.2).
The prevalence of kretek consumption was 2.6% (95%CI: 2.2, 3.1). Sabah was reported to have
the highest prevalence of kretek consumption at 6.6% (95%CI: 4.9, 8.8), followed by Pahang
(4.3%, 95%CI: 2.2, 8.0), Johor (4.2%, 95%CI: 2.8, 6.2), Perlis (0.4%, 95%CI: 0.1, 1.2) and the
lowest in Penang (0.3%, 95%CI: 0.1, 0.9). Kretek consumption was more than twice higher in the
rural compared to urban areas (4.7%, 95%CI: 3.7, 6.0 vs 2.0%, 95%CI: 1.6, 2.4). The usage of
kretek was highest among other Bumiputras (3.6%, 95%CI: 2.6, 5.0) followed by Malays (2.6%,
95%CI: 2.2, 3.1), Chinese (0.5%, 95%CI: 0.3, 1.0) and Indians (0.4%, 95%CI: 0.2, 0.9).
Approximately a quarter (24.2%, 95%CI: 22.4, 26.1) of daily smokers consumed 15-24 sticks of
cigarette per day; the highest prevalence was in Negeri Sembilan (41.3%, 95%CI: 31.4, 52.0),
followed by Terengganu (35.7%, 95%CI: 28.4, 43.9) and Perlis (28.5%, 95%CI: 21.1, 37.3), while
the lowest was in WP Putrajaya (13.3%, 95%CI: 6.8, 24.4). One quarter of males (24.2%, 95%CI:
22.6, 26.3) consumed 15-24 cigarette sticks per day which was much higher compared to females
(17.1%, 95%CI: 8.9, 30.1).

NATIONAL HEALTH AND MORBIDITY SURVEY 2015 MINISTRY OF HEALTH MALAYSIA
87
Non-Communicable Diseases, Risk Factors & Other Health Problems Volume II
3.4.1.3 Prevalence of smokeless tobacco use
The prevalence of smokeless tobacco use among Malaysian population aged 15 years and above
was 10.9% (95%CI: 10.1, 11.7). There was a significant increase from 0.7% reported in GATS
2011. The proportion of smokeless tobacco use in Kelantan (17.6%, 95%CI: 15.0, 20.5), Kedah
(17.5%, 95%CI: 14.7, 20.8) and Pahang (15.3%, 95%CI: 12.0, 19.3) were significantly higher than
the national prevalence. The lowest proportion was in Penang (4.3%, 95%CI: 2.0, 9.1). The use of
smokeless tobacco among male current smokers were almost 25 times higher than females
(20.4%, 95%CI: 18.9, 21.9 vs 0.8%, 95%CI: 0.6, 1.2) and significantly higher among respondents
in rural areas (13.7%, 95%CI: 12.2, 15.3) compared to residents from urban areas (10.0%, 95%CI:
9.1, 11.0). Malays (12.6%, 95%CI: 11.6, 13.7) and other Bumiputras (11.0 %, 95%CI: 9.2, 14.1)
consumed more smokeless tobacco compared to Chinese (6.4%, 95%CI: 5.3, 7.7) and Indians
(7.9%, 95%CI: 6.0, 10.2) and the difference were statistically significant. Participants with tertiary
education attainment reported significantly lower proportion (7.3%, 95%CI: 6.3, 8.4) of smokeless
tobacco consumption compared to those with primary (11.1%, 95%CI: 9.9, 13.1) and secondary
education attainment (12.8%, 95%CI: 11.7, 13.9).
The proportion of smokeless tobacco consumption was highest among the 25-29 age group
(14.1%, 95%CI: 12.2, 16.2), followed by the 30-34 age group (13.5%, 95%CI: 11.6, 15, 7) and the
40-44 age group (13.4%, 95%CI: 11.4, 15.8). The proportion of smokeless tobacco use was lower
among respondents with the highest (Q5) (7.8%, 95%CI: 6.5, 9.2) and lowest income levels (Q1)
(8.7%, 95%CI: 7.6, 10.0) compared to those with Q2 (13.4%, 95%CI: 11.7, 15.2), Q3 (12.6%,
95%CI: 11.2, 14.1) and Q4 (11.9%, 95%CI: 10.5, 13.5) income levels.
3.4.2 Exposure to secondhand smoke
3.4.2.1 Exposure to secondhand smoke at home
The prevalence of exposure to secondhand smoke at home by all respondents (smokers and non-
smokers) was 37.1% (95%CI: 35.6, 38.6). Rural residents had much higher exposure to
secondhand smoke at 48.8% (95%CI: 46.6, 51.1) compared to those living in urban areas at
33.3% (95%CI: 31.5, 35.2). More than half of the participants in Kelantan (53.0%, 95%CI: 47.6,
58.3), Kedah (51.2%, 95%CI: 46.0, 56.3) and Terengganu (50.1%, 95%CI: 44.72, 55.49) reported
exposure to secondhand smoke at home. In addition, exposure to secondhand smoke was
considerably higher among Malays (42.5%, 95%CI: 40.7, 44.3) and other Bumiputras (43.9%,
95%CI: 40.0, 47.9) compared to Chinese (20.8%, 95%CI: 18.4, 23.4) and Indians (25.1%, 95%CI:
21.0, 29.7). By education attainment, respondents with tertiary education (24.9%, 95%CI: 23.0,
26.9) were less exposed to secondhand smoke compared to those without formal education
(43.9%, 95%CI: 39.7, 48.3), those with primary education (41.26%, 95%CI: 39.3, 43.8) and
secondary education attainment of (40.4%, 95%CI: 38.6, 42.3).
More than a quarter (25.9%, 95%CI: 24.6, 27.2) of non-smokers reported exposure to secondhand
smoke at home. The prevalence was much higher in rural areas (36.0%, 95%CI: 33.9, 38.3) and
among females at 31.3% (95%CI: 29.8, 32.8) compared to respondents in urban areas (22.9%,
95%CI: 21.47, 24.47) and among males (17.1%, 95%CI: 15.6, 18.8). For non-smokers, there was
much higher exposure to secondhand smoke among other Bumiputras (33.9%, 95%CI: 30.2, 37.8)
NATIONAL HEALTH AND MORBIDITY SURVEY 2015 MINISTRY OF HEALTH MALAYSIA
88
Non-Communicable Diseases, Risk Factors & Other Health Problems Volume II
and Malays (31.0%, 95%CI: 29.1, 32.7) compared to Chinese (13.2%, 95%CI: 11.4, 15.4) and
Indians (17.7%, 95%CI: 14.3, 21.7).
3.4.2.2 Exposure to secondhand smoke at work
More than one third (37.3%, 95%CI: 35.3, 39.2) of the respondents were exposed to secondhand
smoke at work. The proportion of males exposed to secondhand smoke was almost two times
higher than females (48.1%, 95%CI: 45.4, 50.9 vs 24.2%, 95%CI: 22.2, 26.4), whilst no significant
differences were observed between respondents with different marital status, ethnic groups and
residency.
There was an inverse relationship between the exposure to secondhand smoke at work and
educational attainment, whereby approximately a quarter (25.4%, 95%CI: 23.1, 27.8) of the
respondents with tertiary education and almost half (43.9%; 95%CI: 31.3, 57.3) of the respondents
with no formal education were exposed to secondhand smoke at work.
3.4.3 Smoking cessation behaviour
3.4.3.1 Quit Attempt
More than half (52.3%, 95%CI: 49.9, 54.8) of the current smokers made an attempt to quit
smoking in the past 12 months. Similar proportions were observed among current smokers from
urban (52.8%, 95%CI: 49.7, 55.9) and rural areas (51.2%, 95%CI: 47.3, 55.1). The proportion of
cessation attempt was higher among female current smokers at 59.2% (95%CI: 48.3, 69.3)
compared to males at 52.1% (95%CI: 47.3, 55.1) with no significant difference. A comparison
across the age groups showed that the percentage of quit attempt was highest among current
smokers in 25-29 years age group, at 56.8% (95%CI: 51.2, 62.1) and lowest among 75 years and
above (33.1%, 95%CI: 20.8, 48.3). Linear relationship of proportion of quit attempt and education
levels were observed among current smokers.
3.4.3.2 Current smokers who visited healthcare provider in the past 12 months
Less than 10% (9.7%, 95%CI: 8.4, 11.1) of current smokers visited a healthcare provider in the
past 12 months. The prevalence were higher in Kelantan (18.5%, 95%CI: 12.9, 25.9) followed by
Melaka (15.2%, 95%CI: 10.1, 22.3) and Penang (14.4%, 95%CI: 8.8, 22.7). The prevalence of
female current smokers who visited the healthcare provider in the past one year was almost 1.5
times higher compare to male current smokers (15.8%, 95%CI: 8.9, 26.5 vs 9.5%, 95%CI: 8.2,
10.9) with no significant difference. A comparison across income levels did not show any
significant difference although the proportion was lower among those from Quintiles 4 income
group (7.9%, 95%CI: 5.8, 10.8). The study also revealed that current smokers from younger age
groups and those who were not married were less likely to visit a healthcare provider in the past
one year (i.e. 2.9% , 95%CI: 1.2, 7.1 for 15-19 year old,; compared to 19.9%, 95%CI: 14.3, 27.0
for 55-59 years old); No significant difference was observed among respondents who were not
married (95%CI: 4.8, 8.2) or married (95%CI: 9.6, 13.2) regarding visits to health care providers in
the past 12 months.
NATIONAL HEALTH AND MORBIDITY SURVEY 2015 MINISTRY OF HEALTH MALAYSIA
89
Non-Communicable Diseases, Risk Factors & Other Health Problems Volume II
3.4.3.3 Current smokers advised to quit smoking by healthcare provider
Approximately three quarter (75.4%, 95%CI: 68.6, 81.1) of current smokers who visited healthcare
services in the past 12 months had been advised to quit smoking by healthcare providers. The
proportion was higher in the rural setting (78.3%, 95%CI: 68.0, 86.0) as compared to the urban
settings (73.9%, 95%CI: 64.8, 81.3) with no significant difference. Male current smokers had
higher proportion of being advised by healthcare providers (76.1%, 95%CI: 69.2, 81.9) compared
to female current smokers (60.3%, 95%CI: 29.4, 84.8). By age group, the young smokers aged 18-
19 year old had the highest proportion of being advised to quit (90.2%, 95%CI: 50.5, 98.8). By
state, the highest prevalence of current smokers advised to quit was reported in Terengganu
(92.9%, 95%CI: 58.8, 99.2), followed by Negeri Sembilan at 89.4% (95%CI: 69.1, 97.0) and Perak
[88.4%, 95%CI: 60.3, 97.5].
3.4.4 Awareness of anti-smoking campaign
3.4.4.1 Noticing anti-cigarette smoking information during the last 30 days in newspaper or
magazine
Almost 70% (69.6%, 95%CI: 68.2, 71.0) of respondents had noticed anti-smoking information in
newspapers or magazines during the last 30 days. The prevalence was almost similar in urban
(70.3%; 95%CI: 68.6, 71.9) and rural areas (67.4%; 95%CI: 64.8, 69.8). More than two thirds of
male (70.6%, 95%CI: 68.8, 72.3) and female respondents (68.5% 95%CI: 66.8, 70.1) were aware
of the anti-smoking information in newspaper or magazines. The 40-44 years old age group had
the highest prevalence (74.3%; 95%CI: 71.3, 77.0) of awareness in the anti-smoking information
from the newspapers or magazines and was significantly higher compared to those from older age
group [70-74 years, 56.3%, 95%CI: 49.89, 62.56; 75+years, 47.5%, 95%CI: 42.0, 53.1]. The study
also revealed a positive linear relationship between awareness of anti-smoking information in
printed media and education attainment.
3.4.4.2 Noticing anti-cigarette smoking information during the last 30 days on television
The prevalence of the respondents noticing anti-smoking information on television during the last
one month was 76.3% (95%CI: 75.0, 78.0). The prevalence was similar between respondents from
urban (76.0%, 95%CI: 74.4, 77.6) and rural areas (77.2%, 95%CI: 75.2, 78.9). Comparable
prevalence for the male and female respondents were (75.9%, 95%CI: 74.2, 77.4) and 76.8%,
95%CI: 75.2, 78.2) respectively. By age group, the prevalence were lower among older age group
[70-74 years old, 63.0%, 95%CI: 56.4, 69.2] compared to those aged 15-19 years [76.9%, 95%CI:
74.4, 79.3] and 20-24 years [76.1%, 95%CI: 73.0, 78.8]. Respondents with higher education
attainment and government employees were reported to have higher awareness of anti-smoking
information on television.
NATIONAL HEALTH AND MORBIDITY SURVEY 2015 MINISTRY OF HEALTH MALAYSIA
90
Non-Communicable Diseases, Risk Factors & Other Health Problems Volume II
3.4.4.3 Current smokers who noticed health warning on cigarette package during the last 30
days
Majority (86.0%, 95%CI: 84.3, 87.6) of current smokers reported noticed health warning messages
on cigarette packages during the last 30 days. The proportion was slightly higher among
respondents from urban areas compared to those from rural areas (87.2%; 95%CI: 85.2, 88.8 vs
83.1%; 95%CI: 79.7, 85.9) with no significant difference. By state, more than 90% of current
smokers from Melaka (92.8%, 95%CI: 85.5, 96.6), Sarawak (92.2%, 95%CI: 87.9, 95.1) and
Kelantan (90.5%, 95%CI: 84.6, 94.3) had noticed health warnings on cigarette packages. Linear
increment of awareness of health warning on cigarette packages was observed in this study,
whereby 76.5% (95%CI: 68.9, 82.7) of current smokers without formal education noticed health
warning on cigarettes package compared to 88.9% (95%CI: 85.8, 91.5) among those with tertiary
education.
3.4.4.4 Current smokers who considered quitting because of health warnings
Among the current smokers, 59.5% (CI: 57.0, 61.8) had contemplated quitting smoking because of
the warning messages on cigarette packages during the last 30 days. The prevalence of
considering quitting smoking was slightly lower among urban areas at 57.6% (95%CI: 54.5, 60.5)
compared to their counterparts from rural areas (64.3%, 95%CI: 60.5, 67.8). More than two thirds
(70.3%, 95%CI: 62.4, 77.1) of current smokers from Kelantan who noticed health warnings
considered quitting smoking, followed by those current smokers from Sabah and WP Labuan
(69.1%, 95%CI: 62.2, 75.2) and Sarawak (64.2%, 95%CI: 55.2, 72.3). The lowest was reported in
Negeri Sembilan (32.8%, 95%CI: 265.4, 41.2). The significant difference in proportion of current
smokers who considered quitting smoking was also observed among ethnicity, in which other
Bumiputras (69.7%, 95%CI: 63.6, 75.2) reported considered quitting smoking compared to Malays
(59.9%, 95%CI: 57.0, 62.6) and Chinese (47.4, 95%CI: 40.9, 54.0). In addition, higher prevalence
of government (62.6%, 95%CI: 56.2, 68.7) and private employees (60.6%, 95%CI: 56.9, 64.2) who
were current smokers also expressed consideration to quit smoking after noticing of health
warnings on cigarette packages compared to self-employed (56.8%, 95%CI: 53.1, 60.5) and
unpaid worker/home maker (51.8%, 95%CI: 35.8, 67.5) with no significant differences.
3.4.5 Awareness of cigarette advertising and promotion
3.4.5.1 Noticing cigarette advertising during the last 30 days in stores
About 30% [ 29.6% (95% CI : 27.9, 31.3)] of Malaysians aged 15 years and above noticed
cigarettes advertising in stores during the last 30 days, the prevalence was highest in Johor at
40.5% (95% CI 33.1, 48.4) followed by Kelantan at 37.7% (95%CI: 31.0, 44.9). The lowest
prevalence was in Negeri Sembilan (5.2%, 95%CI: 3.6, 7.5).By strata, similar prevalence were
observed from urban and rural areas (29.6%, 95% CI: 27.5, 31.7 vs 29.6%, 95%CI: 26.7, 32.6). By
ethnicity, higher prevalence was observed for other Bumiputras, 37.6% (95%CI: 34.2, 41.1) as
compared to Malays, 26.4% (95%CI: 24.9, 32.3) and Chinese 25.8% (95%CI: 21.2, 31.0). By
education level, the highest proportion of noticing cigarettes advertising during the last 30 days
was among respondents with tertiary education at 31.2% (95%CI: 28.7, 32.3), followed by those
with secondary school attainment at 30.6% (95%CI: 28.5, 32.8). The highest prevalence of
noticing cigarette advertising was found among those who were not married at 30.4% (95%CI:
28.2, 32.7) and government employees at 34.4% (95%CI: 31.1, 37.6).
NATIONAL HEALTH AND MORBIDITY SURVEY 2015 MINISTRY OF HEALTH MALAYSIA
91
Non-Communicable Diseases, Risk Factors & Other Health Problems Volume II
3.4.5.2 Noticing cigarette promotion during the last 30 days
Small and insignificant prevalence of noticing cigarette promotion by various approaches
were as follows:-
i. Free sample 1.6% (95%CI: 1.3 - 1.9)
ii. Sales price 1.4% (95%CI: 1.2 - 1.6)
iii. Coupon 0.4% (95%CI: 0.3 - 0.5)
iv Free gift/discounts on other product 0.5% (95%CI: 0.4 - 0.7)
v. Clothing/items with brand name or logo 3.6% (95%CI: 3.1 - 4.2)
vii Promotion on cigarettes through mail 0.5% (95%CI: 0.3 - 0.6)
3.5 Conclusion
The overall prevalence of current smokers aged 15 years and above had reduced slightly from
23.1% in 2011 to 22.8% in 2015. It was also observed that the prevalence of male current smokers
had also reduced slightly from 43.9% in 2011 to 43.0% in the current survey. Nonetheless, the
prevalence among females had increased from 1.0% in 2011 to 1.4% in 2015. It was noticed that
all three states (Malacca, Johore and Penang) with Smokefree City projects consistently had lower
smoking prevalence than the national level. The prevalence of smokeless tobacco product use
had increased sharply from 0.7% to 10.9% in 2015. This might be due to the rise in popularity of
electronic cigarettes. It is essential that tobacco control activities in Malaysia be strengthen if we
are to achieve the target for WHO Global NCD Target by 2025.
3.6 Recommendations
The National Strategic Plan on Tobacco Control 2015-2020 has been approved recently. Several
key areas have been recognised as the main foci activities based on MPOWER strategies.
Prevention programmes should improve the target towards youths and females. Smoking
cessation services must be strengthened by enhancing access to smoking cessation services and
pharmacotherapy. A centralised national quit line would be beneficial to increase the efficacy of
cessation programme. The prevalence of noticing cigarette products at point of sale is getting
higher; therefore a policy towards tobacco product display ban at point of sale would be ideal. The
current survey showed that states with Smokefree City Projects had lower smoking prevalence;
hence, this programme should be expanded to many cities and states. With focused tobacco
control strategies, the smoking prevalence can be reduced further to achieve a true smokefree
Malaysia.
NATIONAL HEALTH AND MORBIDITY SURVEY 2015 MINISTRY OF HEALTH MALAYSIA
92
Non-Communicable Diseases, Risk Factors & Other Health Problems Volume II
3.7 References
1. Disease Control Division, Ministry of Health: Clinical Practice Guidelines. Treatment of
Tobacco smoking and dependence 2002. 2003. http://www.google.com.my/url(Accessed
on 15 August 2015)
2. Yusoff AF, Kaur G, Omar MA, Mustafa AN: Malaysian burden of disease and injury study
2005. Malaysia: Institute for Public Health, National Institute of Health.
3. Institute for Public Health (2012). Second Malaysia Burden of Disease and injury study,
Institute for Public Health, Kuala Lumpur.
4. Quit Smoking Asia .www.quitspeed.com/category/quit-smoking-asia/page/3/ (Accessed on
15 August 2015)
5. Malaysia Global School-based Student Health Survey 2012 Factsheet
http://www.who.int/chp/gshs/ Malaysia_2012_ GSHS_FS_ national.pdf? August 2015)
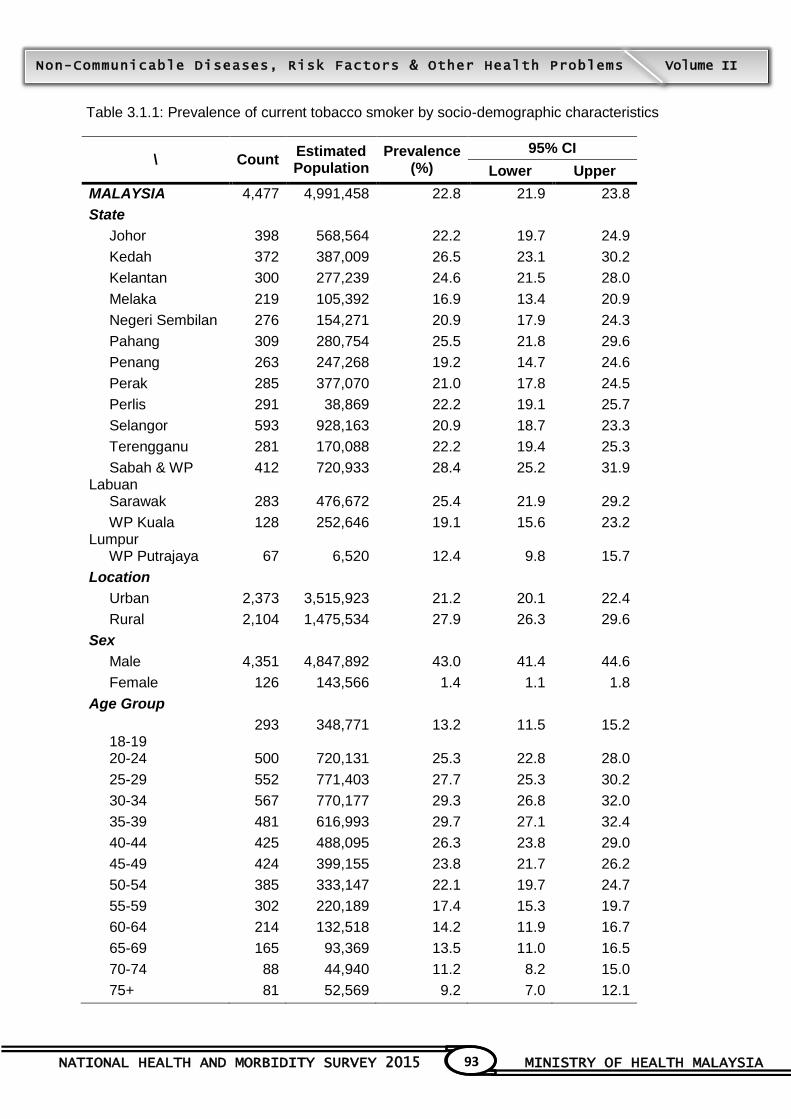
NATIONAL HEALTH AND MORBIDITY SURVEY 2015 MINISTRY OF HEALTH MALAYSIA
93
Non-Communicable Diseases, Risk Factors & Other Health Problems Volume II
Table 3.1.1: Prevalence of current tobacco smoker by socio-demographic characteristics
\ Count Estimated Population
Prevalence (%)
95% CI
Lower Upper
MALAYSIA 4,477 4,991,458 22.8 21.9 23.8
State
Johor 398 568,564 22.2 19.7 24.9
Kedah 372 387,009 26.5 23.1 30.2
Kelantan 300 277,239 24.6 21.5 28.0
Melaka 219 105,392 16.9 13.4 20.9
Negeri Sembilan 276 154,271 20.9 17.9 24.3
Pahang 309 280,754 25.5 21.8 29.6
Penang 263 247,268 19.2 14.7 24.6
Perak 285 377,070 21.0 17.8 24.5
Perlis 291 38,869 22.2 19.1 25.7
Selangor 593 928,163 20.9 18.7 23.3
Terengganu 281 170,088 22.2 19.4 25.3
Sabah & WP Labuan
412 720,933 28.4 25.2 31.9
Sarawak 283 476,672 25.4 21.9 29.2
WP Kuala Lumpur
128 252,646 19.1 15.6 23.2
WP Putrajaya 67 6,520 12.4 9.8 15.7
Location
Urban 2,373 3,515,923 21.2 20.1 22.4
Rural 2,104 1,475,534 27.9 26.3 29.6
Sex
Male 4,351 4,847,892 43.0 41.4 44.6
Female 126 143,566 1.4 1.1 1.8
Age Group
18-19
293 348,771 13.2 11.5 15.2
20-24 500 720,131 25.3 22.8 28.0
25-29 552 771,403 27.7 25.3 30.2
30-34 567 770,177 29.3 26.8 32.0
35-39 481 616,993 29.7 27.1 32.4
40-44 425 488,095 26.3 23.8 29.0
45-49 424 399,155 23.8 21.7 26.2
50-54 385 333,147 22.1 19.7 24.7
55-59 302 220,189 17.4 15.3 19.7
60-64 214 132,518 14.2 11.9 16.7
65-69 165 93,369 13.5 11.0 16.5
70-74 88 44,940 11.2 8.2 15.0
75+ 81 52,569 9.2 7.0 12.1
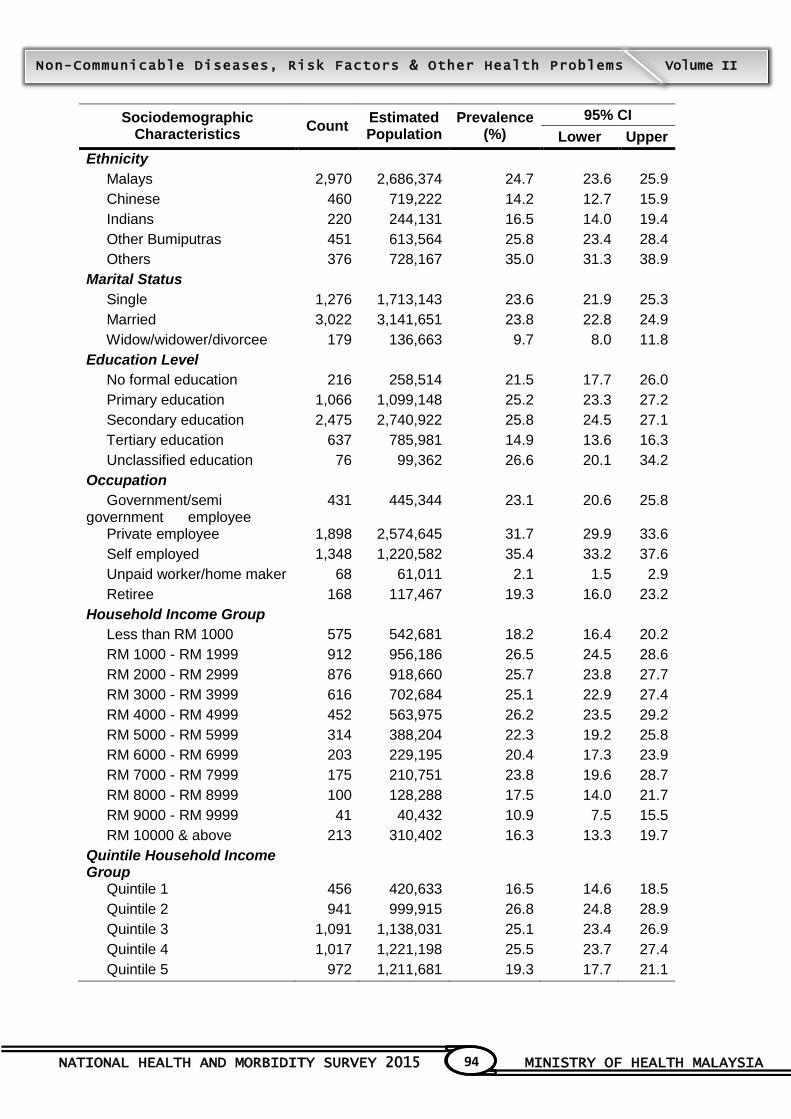
NATIONAL HEALTH AND MORBIDITY SURVEY 2015 MINISTRY OF HEALTH MALAYSIA
94
Non-Communicable Diseases, Risk Factors & Other Health Problems Volume II
Sociodemographic Characteristics
Count Estimated Population
Prevalence (%)
95% CI
Lower Upper
Ethnicity
Malays 2,970 2,686,374 24.7 23.6 25.9
Chinese 460 719,222 14.2 12.7 15.9
Indians 220 244,131 16.5 14.0 19.4
Other Bumiputras 451 613,564 25.8 23.4 28.4
Others 376 728,167 35.0 31.3 38.9
Marital Status
Single 1,276 1,713,143 23.6 21.9 25.3
Married 3,022 3,141,651 23.8 22.8 24.9
Widow/widower/divorcee 179 136,663 9.7 8.0 11.8
Education Level
No formal education 216 258,514 21.5 17.7 26.0
Primary education 1,066 1,099,148 25.2 23.3 27.2
Secondary education 2,475 2,740,922 25.8 24.5 27.1
Tertiary education 637 785,981 14.9 13.6 16.3
Unclassified education 76 99,362 26.6 20.1 34.2
Occupation
Government/semi government employee
431 445,344 23.1 20.6 25.8
Private employee 1,898 2,574,645 31.7 29.9 33.6
Self employed 1,348 1,220,582 35.4 33.2 37.6
Unpaid worker/home maker 68 61,011 2.1 1.5 2.9
Retiree 168 117,467 19.3 16.0 23.2
Household Income Group
Less than RM 1000 575 542,681 18.2 16.4 20.2
RM 1000 - RM 1999 912 956,186 26.5 24.5 28.6
RM 2000 - RM 2999 876 918,660 25.7 23.8 27.7
RM 3000 - RM 3999 616 702,684 25.1 22.9 27.4
RM 4000 - RM 4999 452 563,975 26.2 23.5 29.2
RM 5000 - RM 5999 314 388,204 22.3 19.2 25.8
RM 6000 - RM 6999 203 229,195 20.4 17.3 23.9
RM 7000 - RM 7999 175 210,751 23.8 19.6 28.7
RM 8000 - RM 8999 100 128,288 17.5 14.0 21.7
RM 9000 - RM 9999 41 40,432 10.9 7.5 15.5
RM 10000 & above 213 310,402 16.3 13.3 19.7
Quintile Household Income Group
Quintile 1 456 420,633 16.5 14.6 18.5
Quintile 2 941 999,915 26.8 24.8 28.9
Quintile 3 1,091 1,138,031 25.1 23.4 26.9
Quintile 4 1,017 1,221,198 25.5 23.7 27.4
Quintile 5 972 1,211,681 19.3 17.7 21.1

NATIONAL HEALTH AND MORBIDITY SURVEY 2015 MINISTRY OF HEALTH MALAYSIA
95
Non-Communicable Diseases, Risk Factors & Other Health Problems Volume II
Table 3.1.2: Current smokers of any smoked tobacco product by socio-demographic
characteristics
Sociodemographic Characteristics
Count Estimated Population
Prevalence (%)
95% CI
Lower Upper
MALAYSIA 4,418 4,935,109 22.6 21.6 23.5
State
Johor 392 562,050 21.9 19.4 24.6
Kedah 363 377,232 25.8 22.7 29.3
Kelantan 300 277,239 24.6 21.5 28.0
Melaka 210 101,038 16.2 12.7 20.3
Negeri Sembilan 271 152,013 20.6 17.6 23.9
Pahang 307 279,034 25.4 21.7 29.4
Penang 258 240,162 18.6 14.6 23.4
Perak 284 375,743 20.9 17.8 24.4
Perlis 286 37,976 21.7 18.8 25.0
Selangor 588 923,381 20.8 18.6 23.2
Terengganu 281 170,088 22.2 19.4 25.3
Sabah & WP Labuan
406 714,348 28.1 25.0 31.5
Sarawak 278 465,723 24.8 21.3 28.7
WP Kuala Lumpur 128 252,646 19.1 15.6 23.2
WP Putrajaya 66 6,438 12.3 9.7 15.5
Location
Urban 2,340 3,470,309 20.9 19.8 22.1
Rural 2,078 1,464,800 27.7 26.1 29.4
Sex
Male 4,298 4,799,768 42.5 41.0 44.1
Female 120 135,341 1.3 1.0 1.7
Age Group
18-19 286 343,814 13.1 11.3 15.0
20-24 494 711,101 25.0 22.5 27.7
25-29 546 760,790 27.3 25.0 29.8
30-34 560 763,547 29.1 26.5 31.7
35-39 476 609,679 29.4 26.8 32.0
40-44 420 484,490 26.1 23.6 28.8
45-49 419 396,523 23.7 21.5 26.0
50-54 383 331,385 22.0 19.5 24.6
55-59 298 217,035 17.2 15.1 19.4
60-64 212 130,977 14.0 11.8 16.6
65-69 161 90,483 13.1 10.6 16.0
70-74 84 42,979 10.7 7.7 14.5
75+ 79 52,307 9.2 6.9 12.0
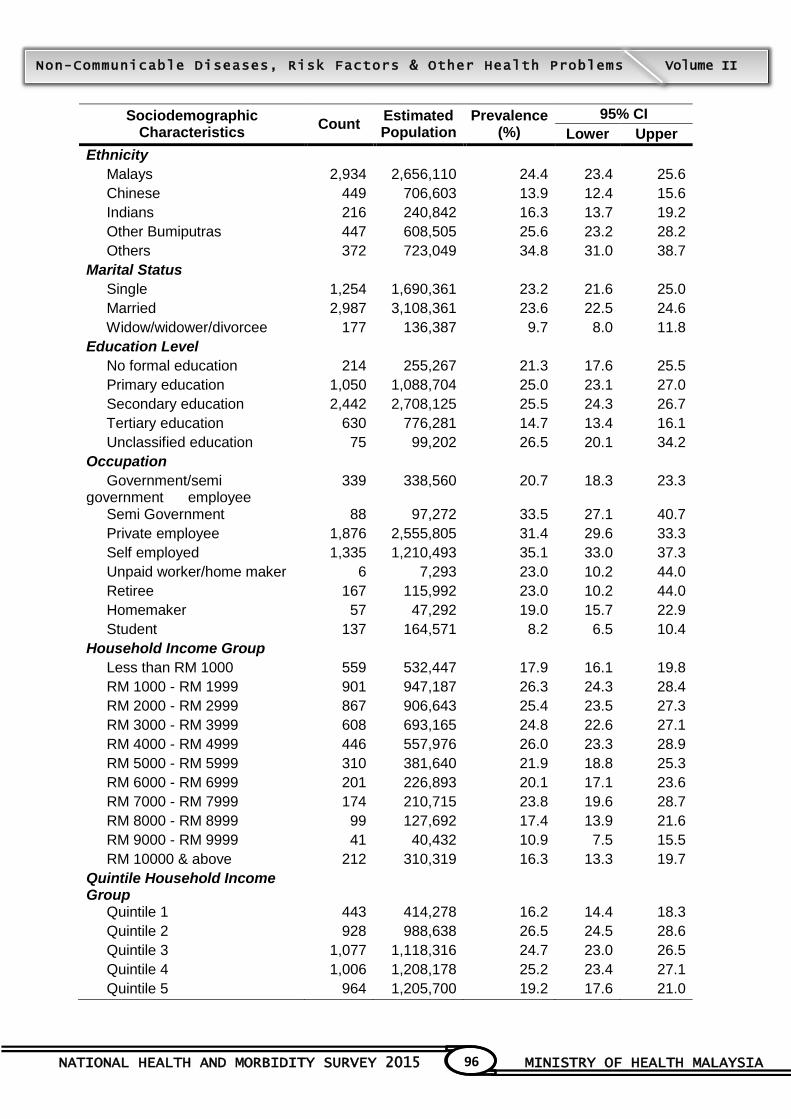
NATIONAL HEALTH AND MORBIDITY SURVEY 2015 MINISTRY OF HEALTH MALAYSIA
96
Non-Communicable Diseases, Risk Factors & Other Health Problems Volume II
Sociodemographic Characteristics
Count Estimated Population
Prevalence (%)
95% CI
Lower Upper
Ethnicity
Malays 2,934 2,656,110 24.4 23.4 25.6
Chinese 449 706,603 13.9 12.4 15.6
Indians 216 240,842 16.3 13.7 19.2
Other Bumiputras 447 608,505 25.6 23.2 28.2
Others 372 723,049 34.8 31.0 38.7
Marital Status
Single 1,254 1,690,361 23.2 21.6 25.0
Married 2,987 3,108,361 23.6 22.5 24.6
Widow/widower/divorcee 177 136,387 9.7 8.0 11.8
Education Level
No formal education 214 255,267 21.3 17.6 25.5
Primary education 1,050 1,088,704 25.0 23.1 27.0
Secondary education 2,442 2,708,125 25.5 24.3 26.7
Tertiary education 630 776,281 14.7 13.4 16.1
Unclassified education 75 99,202 26.5 20.1 34.2
Occupation
Government/semi government employee
339 338,560 20.7 18.3 23.3
Semi Government 88 97,272 33.5 27.1 40.7
Private employee 1,876 2,555,805 31.4 29.6 33.3
Self employed 1,335 1,210,493 35.1 33.0 37.3
Unpaid worker/home maker 6 7,293 23.0 10.2 44.0
Retiree 167 115,992 23.0 10.2 44.0
Homemaker 57 47,292 19.0 15.7 22.9
Student 137 164,571 8.2 6.5 10.4
Household Income Group
Less than RM 1000 559 532,447 17.9 16.1 19.8
RM 1000 - RM 1999 901 947,187 26.3 24.3 28.4
RM 2000 - RM 2999 867 906,643 25.4 23.5 27.3
RM 3000 - RM 3999 608 693,165 24.8 22.6 27.1
RM 4000 - RM 4999 446 557,976 26.0 23.3 28.9
RM 5000 - RM 5999 310 381,640 21.9 18.8 25.3
RM 6000 - RM 6999 201 226,893 20.1 17.1 23.6
RM 7000 - RM 7999 174 210,715 23.8 19.6 28.7
RM 8000 - RM 8999 99 127,692 17.4 13.9 21.6
RM 9000 - RM 9999 41 40,432 10.9 7.5 15.5
RM 10000 & above 212 310,319 16.3 13.3 19.7
Quintile Household Income Group
Quintile 1 443 414,278 16.2 14.4 18.3
Quintile 2 928 988,638 26.5 24.5 28.6
Quintile 3 1,077 1,118,316 24.7 23.0 26.5
Quintile 4 1,006 1,208,178 25.2 23.4 27.1
Quintile 5 964 1,205,700 19.2 17.6 21.0
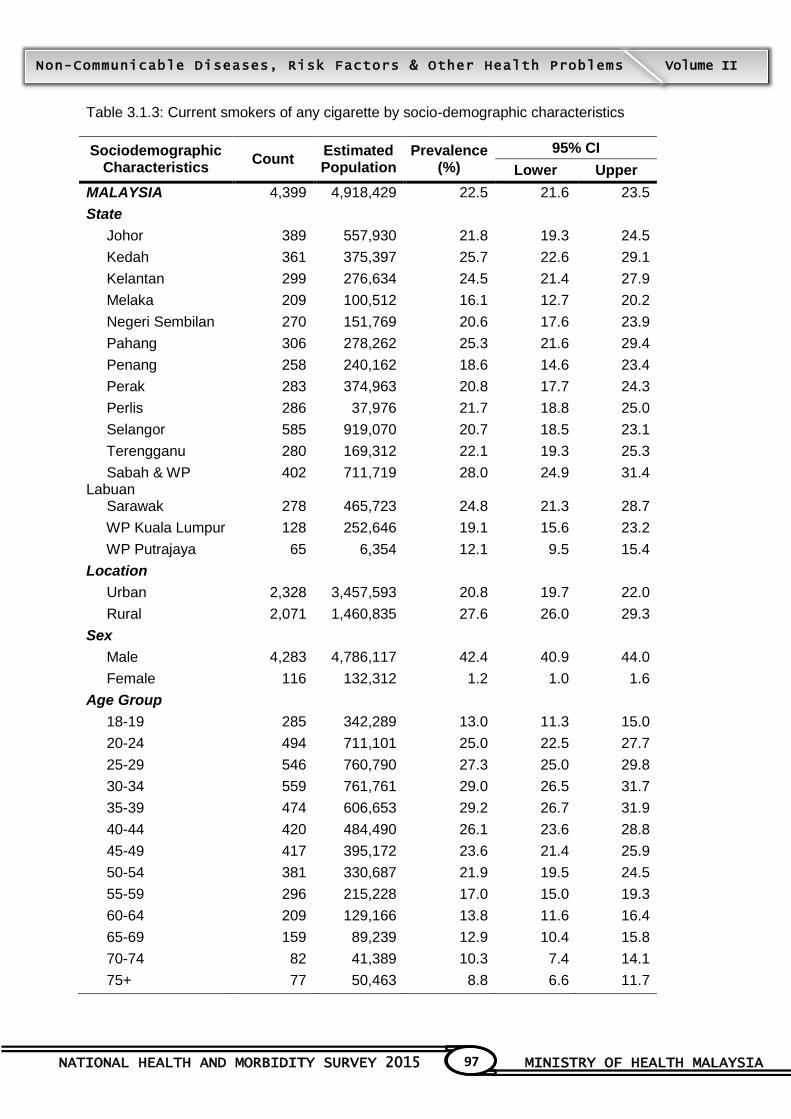
NATIONAL HEALTH AND MORBIDITY SURVEY 2015 MINISTRY OF HEALTH MALAYSIA
97
Non-Communicable Diseases, Risk Factors & Other Health Problems Volume II
Table 3.1.3: Current smokers of any cigarette by socio-demographic characteristics
Sociodemographic Characteristics
Count Estimated Population
Prevalence (%)
95% CI
Lower Upper
MALAYSIA 4,399 4,918,429 22.5 21.6 23.5
State
Johor 389 557,930 21.8 19.3 24.5
Kedah 361 375,397 25.7 22.6 29.1
Kelantan 299 276,634 24.5 21.4 27.9
Melaka 209 100,512 16.1 12.7 20.2
Negeri Sembilan 270 151,769 20.6 17.6 23.9
Pahang 306 278,262 25.3 21.6 29.4
Penang 258 240,162 18.6 14.6 23.4
Perak 283 374,963 20.8 17.7 24.3
Perlis 286 37,976 21.7 18.8 25.0
Selangor 585 919,070 20.7 18.5 23.1
Terengganu 280 169,312 22.1 19.3 25.3
Sabah & WP Labuan
402 711,719 28.0 24.9 31.4
Sarawak 278 465,723 24.8 21.3 28.7
WP Kuala Lumpur 128 252,646 19.1 15.6 23.2
WP Putrajaya 65 6,354 12.1 9.5 15.4
Location
Urban 2,328 3,457,593 20.8 19.7 22.0
Rural 2,071 1,460,835 27.6 26.0 29.3
Sex
Male 4,283 4,786,117 42.4 40.9 44.0
Female 116 132,312 1.2 1.0 1.6
Age Group
18-19 285 342,289 13.0 11.3 15.0
20-24 494 711,101 25.0 22.5 27.7
25-29 546 760,790 27.3 25.0 29.8
30-34 559 761,761 29.0 26.5 31.7
35-39 474 606,653 29.2 26.7 31.9
40-44 420 484,490 26.1 23.6 28.8
45-49 417 395,172 23.6 21.4 25.9
50-54 381 330,687 21.9 19.5 24.5
55-59 296 215,228 17.0 15.0 19.3
60-64 209 129,166 13.8 11.6 16.4
65-69 159 89,239 12.9 10.4 15.8
70-74 82 41,389 10.3 7.4 14.1
75+ 77 50,463 8.8 6.6 11.7

NATIONAL HEALTH AND MORBIDITY SURVEY 2015 MINISTRY OF HEALTH MALAYSIA
98
Non-Communicable Diseases, Risk Factors & Other Health Problems Volume II
ociodemographic Characteristics
Count Estimated Population
Prevalence (%)
95% CI
Lower Upper
Ethnicity
Malays 2,922 2,646,368 24.4 23.3 25.5
Chinese 448 705,324 13.9 12.4 15.6
Indians 214 237,812 16.1 13.6 18.9
Other Bumiputras 443 605,876 25.5 23.1 28.1
Others 372 723,049 34.8 31.0 38.7
Marital Status
Single 1,253 1,688,836 23.2 21.6 24.9
Married 2,971 3,095,040 23.5 22.4 24.5
Widow/widower/divorcee 175 134,552 9.6 7.9 11.7
Education Level
No formal education 210 252,344 21.0 17.3 25.3
Primary education 1,046 1,085,096 24.9 23.0 26.9
Secondary education 2,435 2,701,448 25.4 24.2 26.7
Tertiary education 626 772,807 14.6 13.3 16.0
Unclassified education 75 99,202 26.5 20.1 34.2
Occupation
Government/semi government employee
427 435,832 22.6 20.2 25.3
Private employee 1,869 2,549,296 31.4 29.6 33.2
Self employed 1,329 1,205,052 34.9 32.8 37.2
Unpaid worker/home maker 61 53,479 1.8 1.3 2.6
Retiree 166 114,992 18.9 15.6 22.7
Household Income Group
Less than RM 1000 554 528,940 17.8 16.0 19.7
RM 1000 - RM 1999 898 943,700 26.2 24.2 28.3
RM 2000 - RM 2999 862 903,072 25.3 23.4 27.3
RM 3000 - RM 3999 606 691,412 24.7 22.5 27.0
RM 4000 - RM 4999 444 555,483 25.9 23.1 28.8
RM 5000 - RM 5999 310 381,640 21.9 18.8 25.3
RM 6000 - RM 6999 201 226,893 20.1 17.1 23.6
RM 7000 - RM 7999 173 208,929 23.6 19.4 28.5
RM 8000 - RM 8999 99 127,692 17.4 13.9 21.6
RM 9000 - RM 9999 41 40,432 10.9 7.5 15.5
RM 10000 & above 211 310,236 16.2 13.3 19.7
Quintile Household Income Group
Quintile 1 439 411,546 16.1 14.3 18.2
Quintile 2 924 984,375 26.4 24.4 28.4
Quintile 3 1,070 1,112,992 24.6 22.9 26.3
Quintile 4 1,004 1,205,684 25.2 23.4 27.1
Quintile 5 962 1,203,831 19.2 17.6 21.0
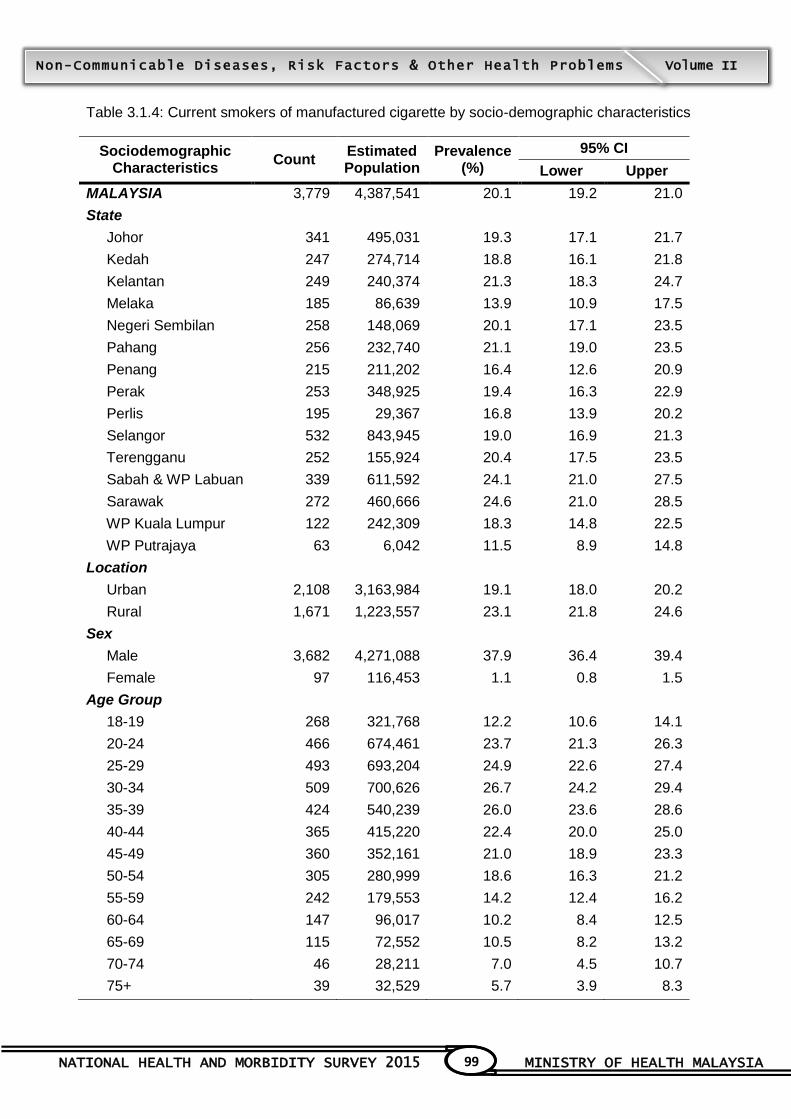
NATIONAL HEALTH AND MORBIDITY SURVEY 2015 MINISTRY OF HEALTH MALAYSIA
99
Non-Communicable Diseases, Risk Factors & Other Health Problems Volume II
Table 3.1.4: Current smokers of manufactured cigarette by socio-demographic characteristics
Sociodemographic Characteristics
Count Estimated Population
Prevalence (%)
95% CI
Lower Upper
MALAYSIA 3,779 4,387,541 20.1 19.2 21.0
State
Johor 341 495,031 19.3 17.1 21.7
Kedah 247 274,714 18.8 16.1 21.8
Kelantan 249 240,374 21.3 18.3 24.7
Melaka 185 86,639 13.9 10.9 17.5
Negeri Sembilan 258 148,069 20.1 17.1 23.5
Pahang 256 232,740 21.1 19.0 23.5
Penang 215 211,202 16.4 12.6 20.9
Perak 253 348,925 19.4 16.3 22.9
Perlis 195 29,367 16.8 13.9 20.2
Selangor 532 843,945 19.0 16.9 21.3
Terengganu 252 155,924 20.4 17.5 23.5
Sabah & WP Labuan 339 611,592 24.1 21.0 27.5
Sarawak 272 460,666 24.6 21.0 28.5
WP Kuala Lumpur 122 242,309 18.3 14.8 22.5
WP Putrajaya 63 6,042 11.5 8.9 14.8
Location
Urban 2,108 3,163,984 19.1 18.0 20.2
Rural 1,671 1,223,557 23.1 21.8 24.6
Sex
Male 3,682 4,271,088 37.9 36.4 39.4
Female 97 116,453 1.1 0.8 1.5
Age Group
18-19 268 321,768 12.2 10.6 14.1
20-24 466 674,461 23.7 21.3 26.3
25-29 493 693,204 24.9 22.6 27.4
30-34 509 700,626 26.7 24.2 29.4
35-39 424 540,239 26.0 23.6 28.6
40-44 365 415,220 22.4 20.0 25.0
45-49 360 352,161 21.0 18.9 23.3
50-54 305 280,999 18.6 16.3 21.2
55-59 242 179,553 14.2 12.4 16.2
60-64 147 96,017 10.2 8.4 12.5
65-69 115 72,552 10.5 8.2 13.2
70-74 46 28,211 7.0 4.5 10.7
75+ 39 32,529 5.7 3.9 8.3
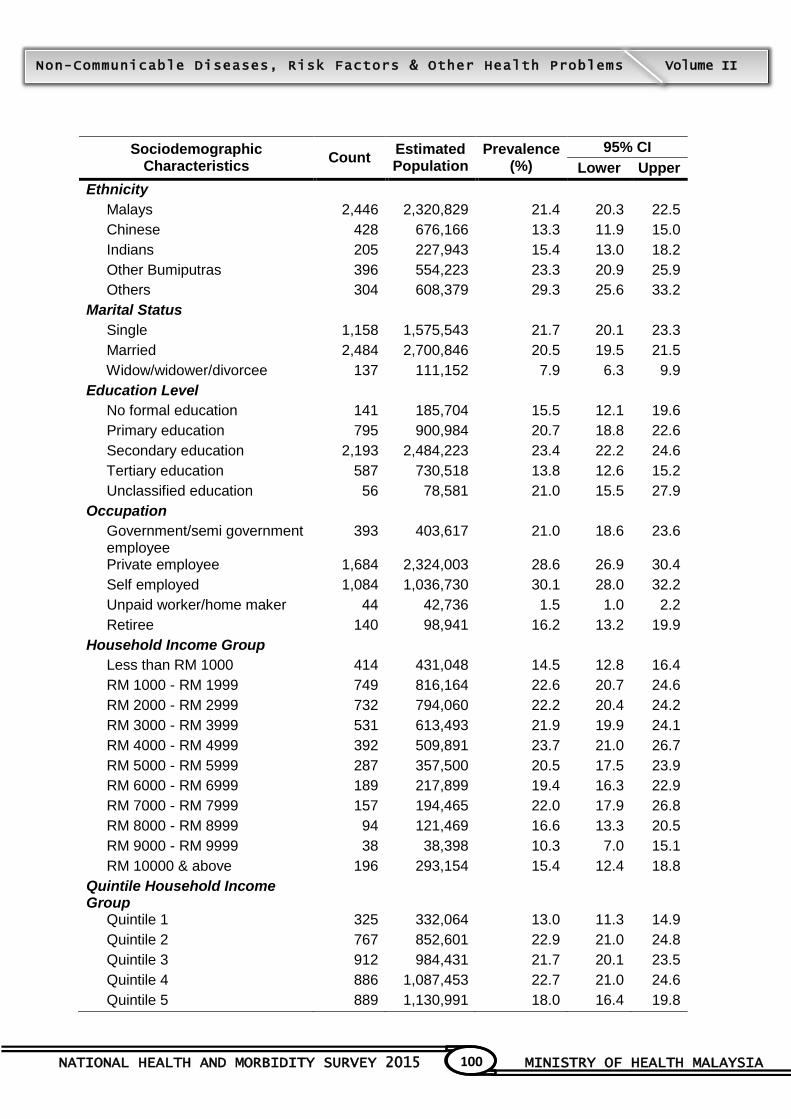
NATIONAL HEALTH AND MORBIDITY SURVEY 2015 MINISTRY OF HEALTH MALAYSIA
100
Non-Communicable Diseases, Risk Factors & Other Health Problems Volume II
Sociodemographic Characteristics
Count Estimated Population
Prevalence (%)
95% CI
Lower Upper
Ethnicity
Malays 2,446 2,320,829 21.4 20.3 22.5
Chinese 428 676,166 13.3 11.9 15.0
Indians 205 227,943 15.4 13.0 18.2
Other Bumiputras 396 554,223 23.3 20.9 25.9
Others 304 608,379 29.3 25.6 33.2
Marital Status
Single 1,158 1,575,543 21.7 20.1 23.3
Married 2,484 2,700,846 20.5 19.5 21.5
Widow/widower/divorcee 137 111,152 7.9 6.3 9.9
Education Level
No formal education 141 185,704 15.5 12.1 19.6
Primary education 795 900,984 20.7 18.8 22.6
Secondary education 2,193 2,484,223 23.4 22.2 24.6
Tertiary education 587 730,518 13.8 12.6 15.2
Unclassified education 56 78,581 21.0 15.5 27.9
Occupation
Government/semi government employee
393 403,617 21.0 18.6 23.6
Private employee 1,684 2,324,003 28.6 26.9 30.4
Self employed 1,084 1,036,730 30.1 28.0 32.2
Unpaid worker/home maker 44 42,736 1.5 1.0 2.2
Retiree 140 98,941 16.2 13.2 19.9
Household Income Group
Less than RM 1000 414 431,048 14.5 12.8 16.4
RM 1000 - RM 1999 749 816,164 22.6 20.7 24.6
RM 2000 - RM 2999 732 794,060 22.2 20.4 24.2
RM 3000 - RM 3999 531 613,493 21.9 19.9 24.1
RM 4000 - RM 4999 392 509,891 23.7 21.0 26.7
RM 5000 - RM 5999 287 357,500 20.5 17.5 23.9
RM 6000 - RM 6999 189 217,899 19.4 16.3 22.9
RM 7000 - RM 7999 157 194,465 22.0 17.9 26.8
RM 8000 - RM 8999 94 121,469 16.6 13.3 20.5
RM 9000 - RM 9999 38 38,398 10.3 7.0 15.1
RM 10000 & above 196 293,154 15.4 12.4 18.8
Quintile Household Income Group
Quintile 1 325 332,064 13.0 11.3 14.9
Quintile 2 767 852,601 22.9 21.0 24.8
Quintile 3 912 984,431 21.7 20.1 23.5
Quintile 4 886 1,087,453 22.7 21.0 24.6
Quintile 5 889 1,130,991 18.0 16.4 19.8
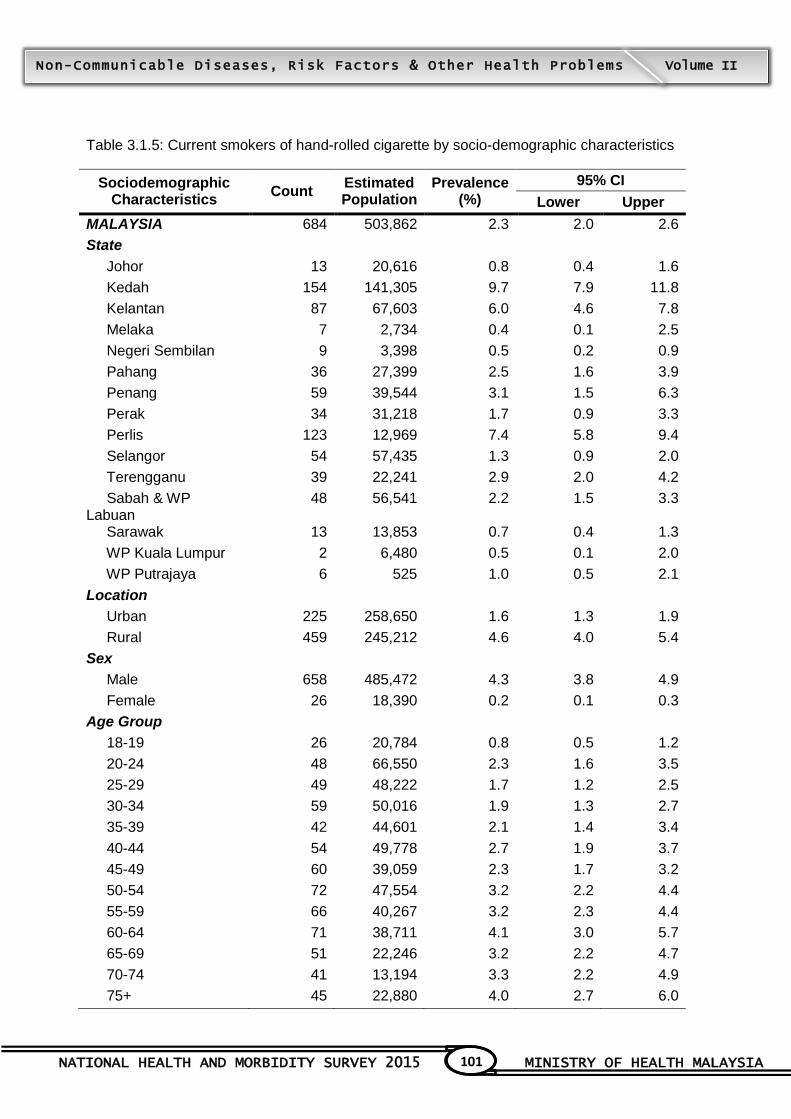
NATIONAL HEALTH AND MORBIDITY SURVEY 2015 MINISTRY OF HEALTH MALAYSIA
101
Non-Communicable Diseases, Risk Factors & Other Health Problems Volume II
Table 3.1.5: Current smokers of hand-rolled cigarette by socio-demographic characteristics
Sociodemographic Characteristics
Count Estimated Population
Prevalence (%)
95% CI
Lower Upper
MALAYSIA 684 503,862 2.3 2.0 2.6
State
Johor 13 20,616 0.8 0.4 1.6
Kedah 154 141,305 9.7 7.9 11.8
Kelantan 87 67,603 6.0 4.6 7.8
Melaka 7 2,734 0.4 0.1 2.5
Negeri Sembilan 9 3,398 0.5 0.2 0.9
Pahang 36 27,399 2.5 1.6 3.9
Penang 59 39,544 3.1 1.5 6.3
Perak 34 31,218 1.7 0.9 3.3
Perlis 123 12,969 7.4 5.8 9.4
Selangor 54 57,435 1.3 0.9 2.0
Terengganu 39 22,241 2.9 2.0 4.2
Sabah & WP Labuan
48 56,541 2.2 1.5 3.3
Sarawak 13 13,853 0.7 0.4 1.3
WP Kuala Lumpur 2 6,480 0.5 0.1 2.0
WP Putrajaya 6 525 1.0 0.5 2.1
Location
Urban 225 258,650 1.6 1.3 1.9
Rural 459 245,212 4.6 4.0 5.4
Sex
Male 658 485,472 4.3 3.8 4.9
Female 26 18,390 0.2 0.1 0.3
Age Group
18-19 26 20,784 0.8 0.5 1.2
20-24 48 66,550 2.3 1.6 3.5
25-29 49 48,222 1.7 1.2 2.5
30-34 59 50,016 1.9 1.3 2.7
35-39 42 44,601 2.1 1.4 3.4
40-44 54 49,778 2.7 1.9 3.7
45-49 60 39,059 2.3 1.7 3.2
50-54 72 47,554 3.2 2.2 4.4
55-59 66 40,267 3.2 2.3 4.4
60-64 71 38,711 4.1 3.0 5.7
65-69 51 22,246 3.2 2.2 4.7
70-74 41 13,194 3.3 2.2 4.9
75+ 45 22,880 4.0 2.7 6.0
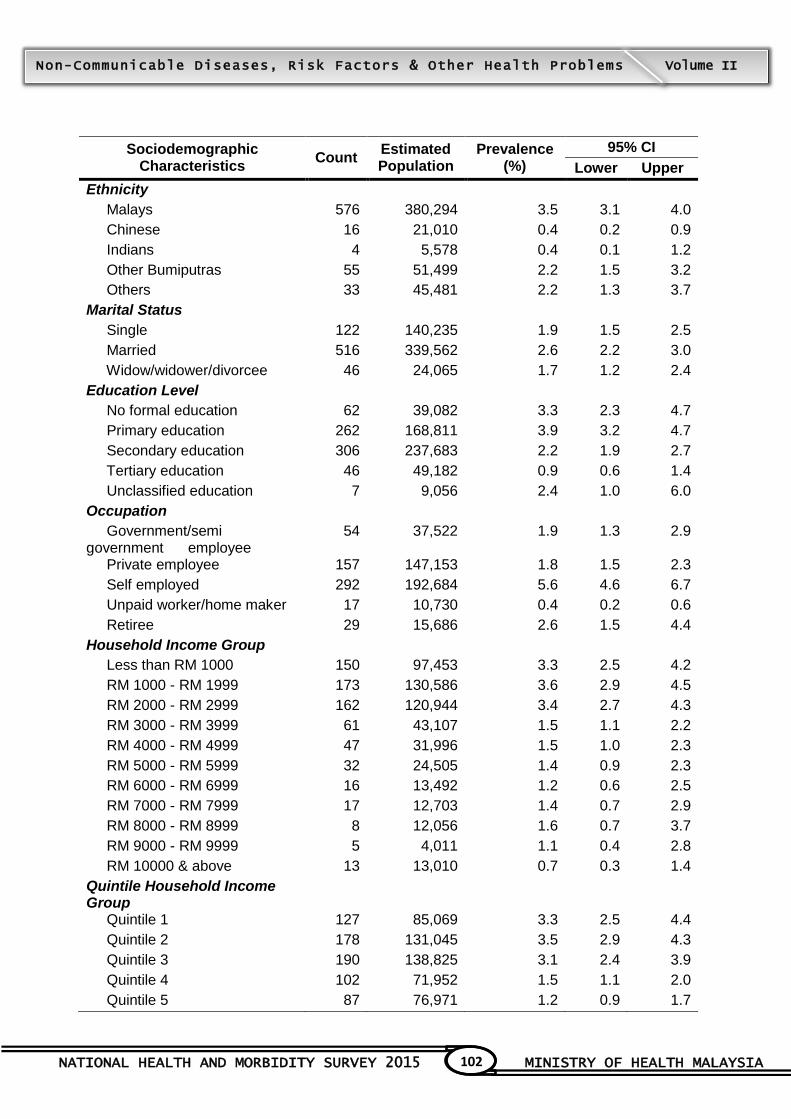
NATIONAL HEALTH AND MORBIDITY SURVEY 2015 MINISTRY OF HEALTH MALAYSIA
102
Non-Communicable Diseases, Risk Factors & Other Health Problems Volume II
Sociodemographic Characteristics
Count Estimated Population
Prevalence (%)
95% CI
Lower Upper
Ethnicity
Malays 576 380,294 3.5 3.1 4.0
Chinese 16 21,010 0.4 0.2 0.9
Indians 4 5,578 0.4 0.1 1.2
Other Bumiputras 55 51,499 2.2 1.5 3.2
Others 33 45,481 2.2 1.3 3.7
Marital Status
Single 122 140,235 1.9 1.5 2.5
Married 516 339,562 2.6 2.2 3.0
Widow/widower/divorcee 46 24,065 1.7 1.2 2.4
Education Level
No formal education 62 39,082 3.3 2.3 4.7
Primary education 262 168,811 3.9 3.2 4.7
Secondary education 306 237,683 2.2 1.9 2.7
Tertiary education 46 49,182 0.9 0.6 1.4
Unclassified education 7 9,056 2.4 1.0 6.0
Occupation
Government/semi government employee
54 37,522 1.9 1.3 2.9
Private employee 157 147,153 1.8 1.5 2.3
Self employed 292 192,684 5.6 4.6 6.7
Unpaid worker/home maker 17 10,730 0.4 0.2 0.6
Retiree 29 15,686 2.6 1.5 4.4
Household Income Group
Less than RM 1000 150 97,453 3.3 2.5 4.2
RM 1000 - RM 1999 173 130,586 3.6 2.9 4.5
RM 2000 - RM 2999 162 120,944 3.4 2.7 4.3
RM 3000 - RM 3999 61 43,107 1.5 1.1 2.2
RM 4000 - RM 4999 47 31,996 1.5 1.0 2.3
RM 5000 - RM 5999 32 24,505 1.4 0.9 2.3
RM 6000 - RM 6999 16 13,492 1.2 0.6 2.5
RM 7000 - RM 7999 17 12,703 1.4 0.7 2.9
RM 8000 - RM 8999 8 12,056 1.6 0.7 3.7
RM 9000 - RM 9999 5 4,011 1.1 0.4 2.8
RM 10000 & above 13 13,010 0.7 0.3 1.4
Quintile Household Income Group
Quintile 1 127 85,069 3.3 2.5 4.4
Quintile 2 178 131,045 3.5 2.9 4.3
Quintile 3 190 138,825 3.1 2.4 3.9
Quintile 4 102 71,952 1.5 1.1 2.0
Quintile 5 87 76,971 1.2 0.9 1.7
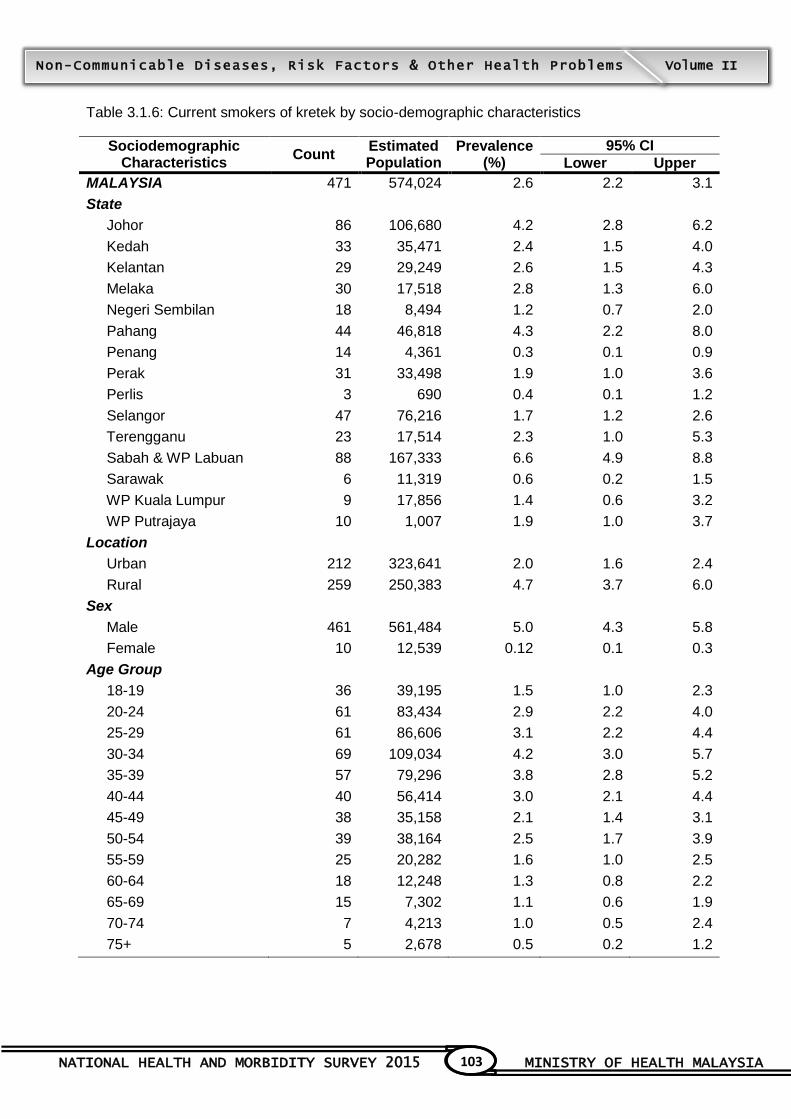
NATIONAL HEALTH AND MORBIDITY SURVEY 2015 MINISTRY OF HEALTH MALAYSIA
103
Non-Communicable Diseases, Risk Factors & Other Health Problems Volume II
Table 3.1.6: Current smokers of kretek by socio-demographic characteristics
Sociodemographic Characteristics
Count Estimated Population
Prevalence (%)
95% CI
Lower Upper
MALAYSIA 471 574,024 2.6 2.2 3.1
State
Johor 86 106,680 4.2 2.8 6.2
Kedah 33 35,471 2.4 1.5 4.0
Kelantan 29 29,249 2.6 1.5 4.3
Melaka 30 17,518 2.8 1.3 6.0
Negeri Sembilan 18 8,494 1.2 0.7 2.0
Pahang 44 46,818 4.3 2.2 8.0
Penang 14 4,361 0.3 0.1 0.9
Perak 31 33,498 1.9 1.0 3.6
Perlis 3 690 0.4 0.1 1.2
Selangor 47 76,216 1.7 1.2 2.6
Terengganu 23 17,514 2.3 1.0 5.3
Sabah & WP Labuan 88 167,333 6.6 4.9 8.8
Sarawak 6 11,319 0.6 0.2 1.5
WP Kuala Lumpur 9 17,856 1.4 0.6 3.2
WP Putrajaya 10 1,007 1.9 1.0 3.7
Location
Urban 212 323,641 2.0 1.6 2.4
Rural 259 250,383 4.7 3.7 6.0
Sex
Male 461 561,484 5.0 4.3 5.8
Female 10 12,539 0.12 0.1 0.3
Age Group
18-19 36 39,195 1.5 1.0 2.3
20-24 61 83,434 2.9 2.2 4.0
25-29 61 86,606 3.1 2.2 4.4
30-34 69 109,034 4.2 3.0 5.7
35-39 57 79,296 3.8 2.8 5.2
40-44 40 56,414 3.0 2.1 4.4
45-49 38 35,158 2.1 1.4 3.1
50-54 39 38,164 2.5 1.7 3.9
55-59 25 20,282 1.6 1.0 2.5
60-64 18 12,248 1.3 0.8 2.2
65-69 15 7,302 1.1 0.6 1.9
70-74 7 4,213 1.0 0.5 2.4
75+ 5 2,678 0.5 0.2 1.2
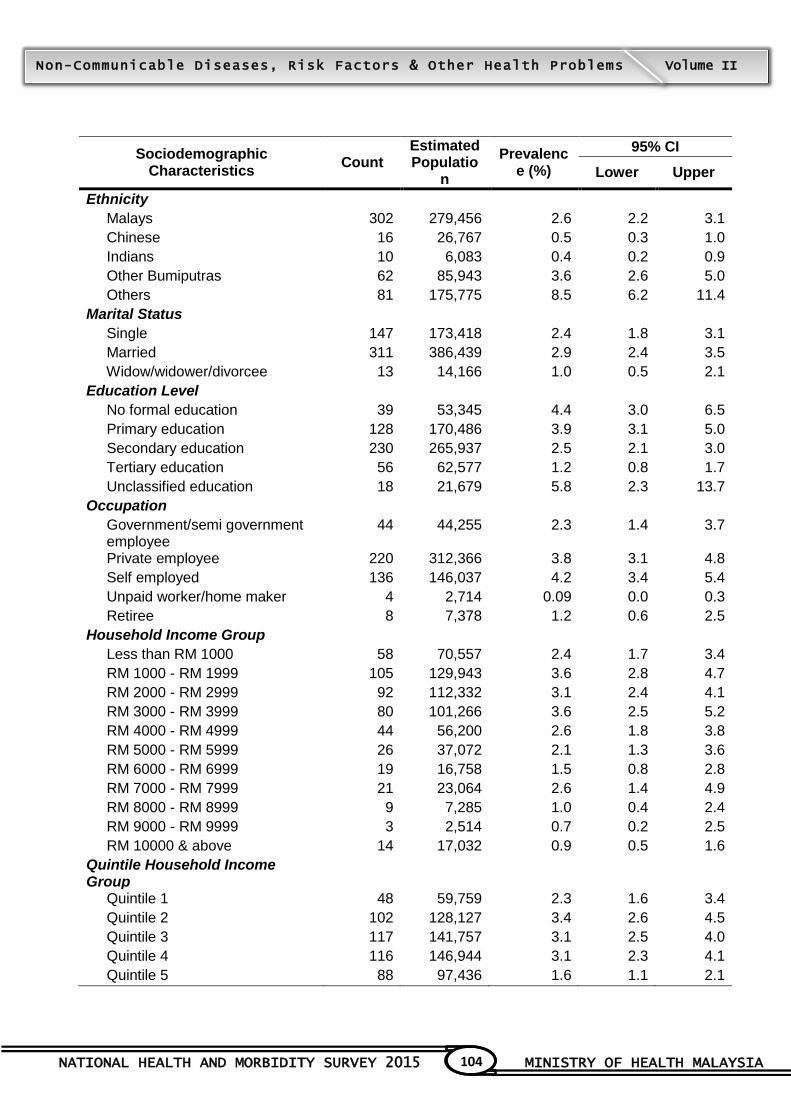
NATIONAL HEALTH AND MORBIDITY SURVEY 2015 MINISTRY OF HEALTH MALAYSIA
104
Non-Communicable Diseases, Risk Factors & Other Health Problems Volume II
Sociodemographic Characteristics
Count Estimated Populatio
n
Prevalence (%)
95% CI
Lower Upper
Ethnicity
Malays 302 279,456 2.6 2.2 3.1
Chinese 16 26,767 0.5 0.3 1.0
Indians 10 6,083 0.4 0.2 0.9
Other Bumiputras 62 85,943 3.6 2.6 5.0
Others 81 175,775 8.5 6.2 11.4
Marital Status
Single 147 173,418 2.4 1.8 3.1
Married 311 386,439 2.9 2.4 3.5
Widow/widower/divorcee 13 14,166 1.0 0.5 2.1
Education Level
No formal education 39 53,345 4.4 3.0 6.5
Primary education 128 170,486 3.9 3.1 5.0
Secondary education 230 265,937 2.5 2.1 3.0
Tertiary education 56 62,577 1.2 0.8 1.7
Unclassified education 18 21,679 5.8 2.3 13.7
Occupation
Government/semi government employee
44 44,255 2.3 1.4 3.7
Private employee 220 312,366 3.8 3.1 4.8
Self employed 136 146,037 4.2 3.4 5.4
Unpaid worker/home maker 4 2,714 0.09 0.0 0.3
Retiree 8 7,378 1.2 0.6 2.5
Household Income Group
Less than RM 1000 58 70,557 2.4 1.7 3.4
RM 1000 - RM 1999 105 129,943 3.6 2.8 4.7
RM 2000 - RM 2999 92 112,332 3.1 2.4 4.1
RM 3000 - RM 3999 80 101,266 3.6 2.5 5.2
RM 4000 - RM 4999 44 56,200 2.6 1.8 3.8
RM 5000 - RM 5999 26 37,072 2.1 1.3 3.6
RM 6000 - RM 6999 19 16,758 1.5 0.8 2.8
RM 7000 - RM 7999 21 23,064 2.6 1.4 4.9
RM 8000 - RM 8999 9 7,285 1.0 0.4 2.4
RM 9000 - RM 9999 3 2,514 0.7 0.2 2.5
RM 10000 & above 14 17,032 0.9 0.5 1.6
Quintile Household Income Group
Quintile 1 48 59,759 2.3 1.6 3.4
Quintile 2 102 128,127 3.4 2.6 4.5
Quintile 3 117 141,757 3.1 2.5 4.0
Quintile 4 116 146,944 3.1 2.3 4.1
Quintile 5 88 97,436 1.6 1.1 2.1

NATIONAL HEALTH AND MORBIDITY SURVEY 2015 MINISTRY OF HEALTH MALAYSIA
105
Non-Communicable Diseases, Risk Factors & Other Health Problems Volume II
Table 3.1.7: Current smokers of other tobacco product by socio-demographic characteristics
Sociodemographic Characteristics
Count Estimated Population
Prevalence (%)
95% CI
Lower Upper
MALAYSIA 49 51,482 0.2 0.2 0.3
State
Johor 6 7,116 0.3 0.1 0.7
Kedah 6 4,983 0.3 0.1 1.2
Kelantan 1 606 0.05 0.0 0.4
Melaka 3 1,309 0.2 0.1 0.8
Negeri Sembilan 4 1,732 0.23 0.1 0.7
Pahang 2 1,351 0.12 0.0 0.5
Penang
Perak 3 2,998 0.2 0.1 0.6
Perlis 2 710 0.4 0.1 1.9
Selangor 5 7,963 0.2 0.1 0.4
Terengganu 2 1,552 0.2 0.1 0.8
Sabah & WP Labuan 9 10,257 0.4 0.2 1.0
Sarawak 3 3,092 0.16 0.1 0.6
WP Kuala Lumpur 2 7,729 0.6 0.1 2.3
WP Putrajaya 1 83 0.16 0.0 1.1
Location
Urban 30 41,049 0.2 0.2 0.4
Rural 19 10,433 0.2 0.1 0.4
Sex
Male 42 43,420 0.4 0.3 0.6
Female 7 8,062 0.08 0.0 0.2
Age Group
18-19 2 1,880 0.07 0.0 0.4
20-24 2 2,150 0.08 0.0 0.4
25-29 4 10,880 0.4 0.1 1.1
30-34 2 2,426 0.1 0.0 0.4
35-39 5 6,464 0.3 0.1 0.8
40-44 1 1,843 0.10 0.0 0.7
45-49 4 3,524 0.2 0.1 0.6
50-54 8 8,438 0.6 0.2 1.5
55-59 7 4,190 0.3 0.1 0.8
60-64 5 2,743 0.3 0.1 0.8
65-69 2 1,244 0.18 0.0 0.8
70-74 5 3,856 1.0 0.4 2.3
75+ 2 1,845 0.3 0.1 1.5
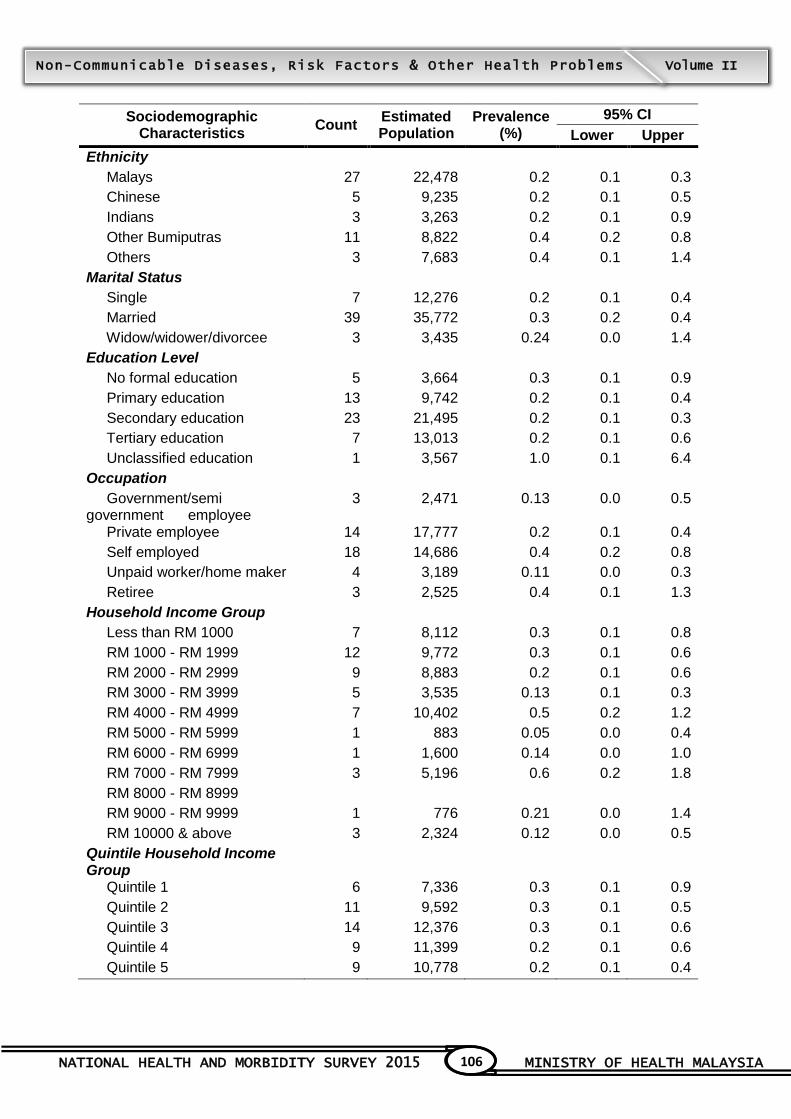
NATIONAL HEALTH AND MORBIDITY SURVEY 2015 MINISTRY OF HEALTH MALAYSIA
106
Non-Communicable Diseases, Risk Factors & Other Health Problems Volume II
Sociodemographic Characteristics
Count Estimated Population
Prevalence (%)
95% CI
Lower Upper
Ethnicity
Malays 27 22,478 0.2 0.1 0.3
Chinese 5 9,235 0.2 0.1 0.5
Indians 3 3,263 0.2 0.1 0.9
Other Bumiputras 11 8,822 0.4 0.2 0.8
Others 3 7,683 0.4 0.1 1.4
Marital Status
Single 7 12,276 0.2 0.1 0.4
Married 39 35,772 0.3 0.2 0.4
Widow/widower/divorcee 3 3,435 0.24 0.0 1.4
Education Level
No formal education 5 3,664 0.3 0.1 0.9
Primary education 13 9,742 0.2 0.1 0.4
Secondary education 23 21,495 0.2 0.1 0.3
Tertiary education 7 13,013 0.2 0.1 0.6
Unclassified education 1 3,567 1.0 0.1 6.4
Occupation
Government/semi government employee
3 2,471 0.13 0.0 0.5
Private employee 14 17,777 0.2 0.1 0.4
Self employed 18 14,686 0.4 0.2 0.8
Unpaid worker/home maker 4 3,189 0.11 0.0 0.3
Retiree 3 2,525 0.4 0.1 1.3
Household Income Group
Less than RM 1000 7 8,112 0.3 0.1 0.8
RM 1000 - RM 1999 12 9,772 0.3 0.1 0.6
RM 2000 - RM 2999 9 8,883 0.2 0.1 0.6
RM 3000 - RM 3999 5 3,535 0.13 0.1 0.3
RM 4000 - RM 4999 7 10,402 0.5 0.2 1.2
RM 5000 - RM 5999 1 883 0.05 0.0 0.4
RM 6000 - RM 6999 1 1,600 0.14 0.0 1.0
RM 7000 - RM 7999 3 5,196 0.6 0.2 1.8
RM 8000 - RM 8999
RM 9000 - RM 9999 1 776 0.21 0.0 1.4
RM 10000 & above 3 2,324 0.12 0.0 0.5
Quintile Household Income Group
Quintile 1 6 7,336 0.3 0.1 0.9
Quintile 2 11 9,592 0.3 0.1 0.5
Quintile 3 14 12,376 0.3 0.1 0.6
Quintile 4 9 11,399 0.2 0.1 0.6
Quintile 5 9 10,778 0.2 0.1 0.4

NATIONAL HEALTH AND MORBIDITY SURVEY 2015 MINISTRY OF HEALTH MALAYSIA
107
Non-Communicable Diseases, Risk Factors & Other Health Problems Volume II

NATIONAL HEALTH AND MORBIDITY SURVEY 2015 MINISTRY OF HEALTH MALAYSIA
108
Non-Communicable Diseases, Risk Factors & Other Health Problems Volume II
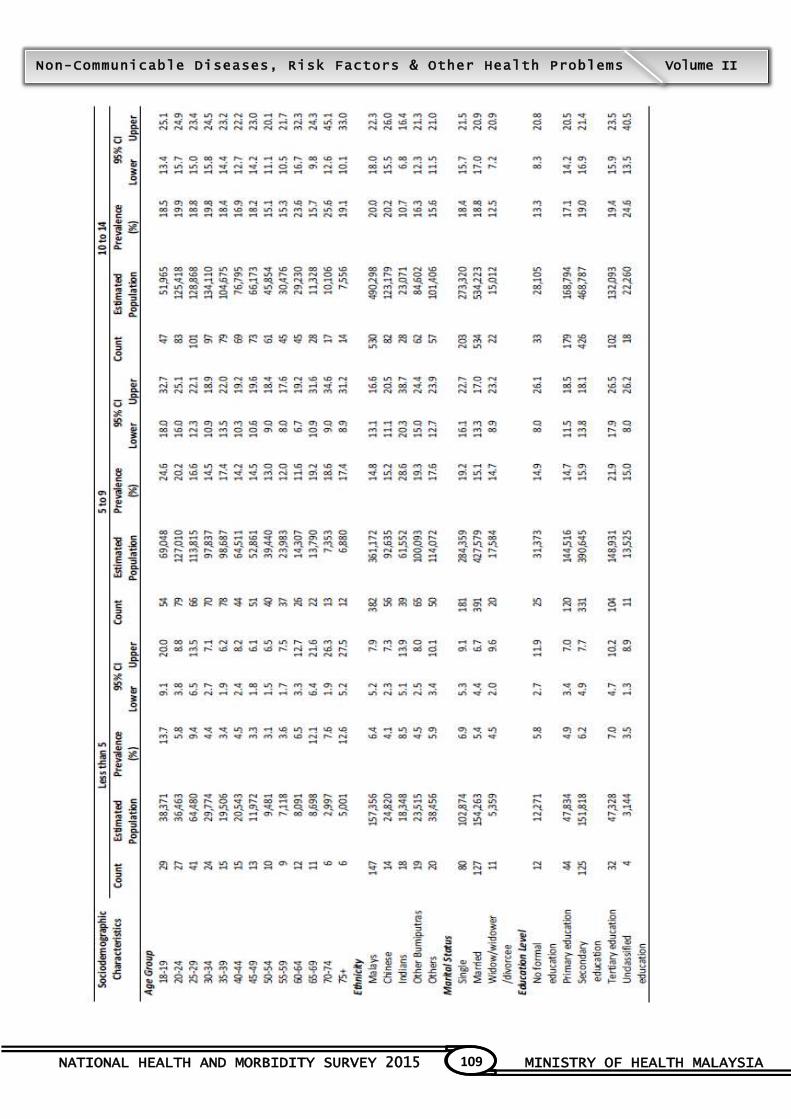
NATIONAL HEALTH AND MORBIDITY SURVEY 2015 MINISTRY OF HEALTH MALAYSIA
109
Non-Communicable Diseases, Risk Factors & Other Health Problems Volume II

NATIONAL HEALTH AND MORBIDITY SURVEY 2015 MINISTRY OF HEALTH MALAYSIA
110
Non-Communicable Diseases, Risk Factors & Other Health Problems Volume II
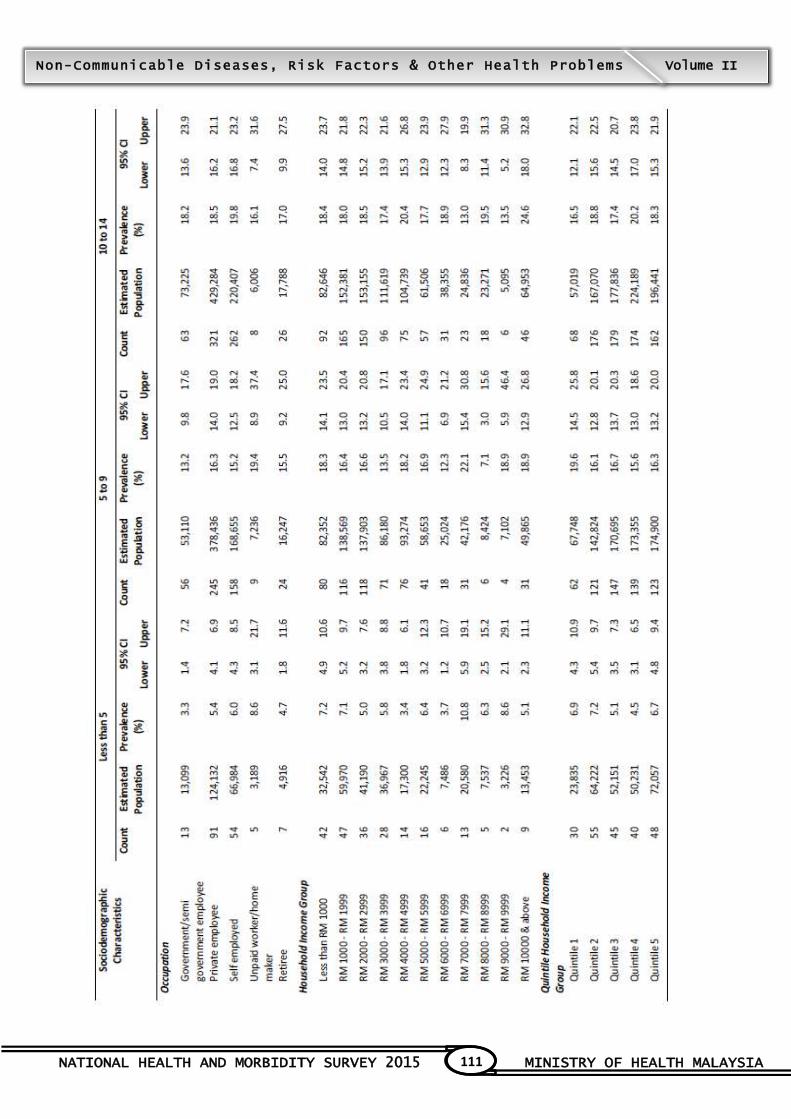
NATIONAL HEALTH AND MORBIDITY SURVEY 2015 MINISTRY OF HEALTH MALAYSIA
111
Non-Communicable Diseases, Risk Factors & Other Health Problems Volume II
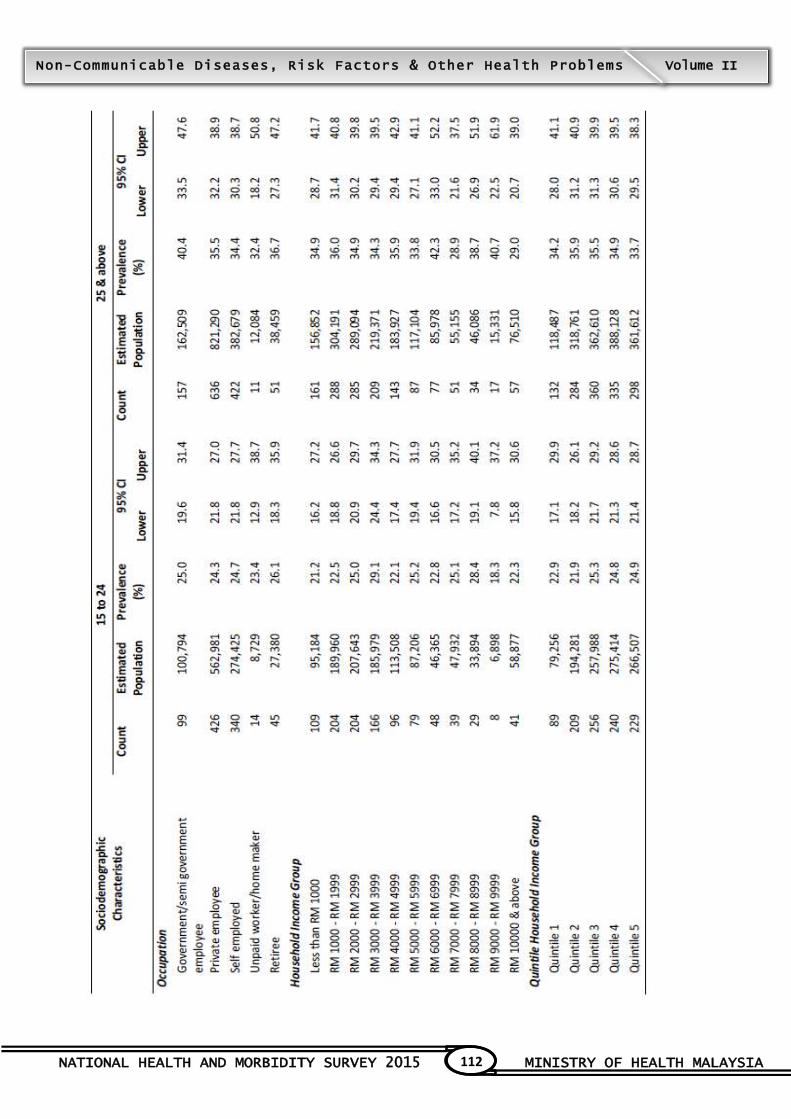
NATIONAL HEALTH AND MORBIDITY SURVEY 2015 MINISTRY OF HEALTH MALAYSIA
112
Non-Communicable Diseases, Risk Factors & Other Health Problems Volume II
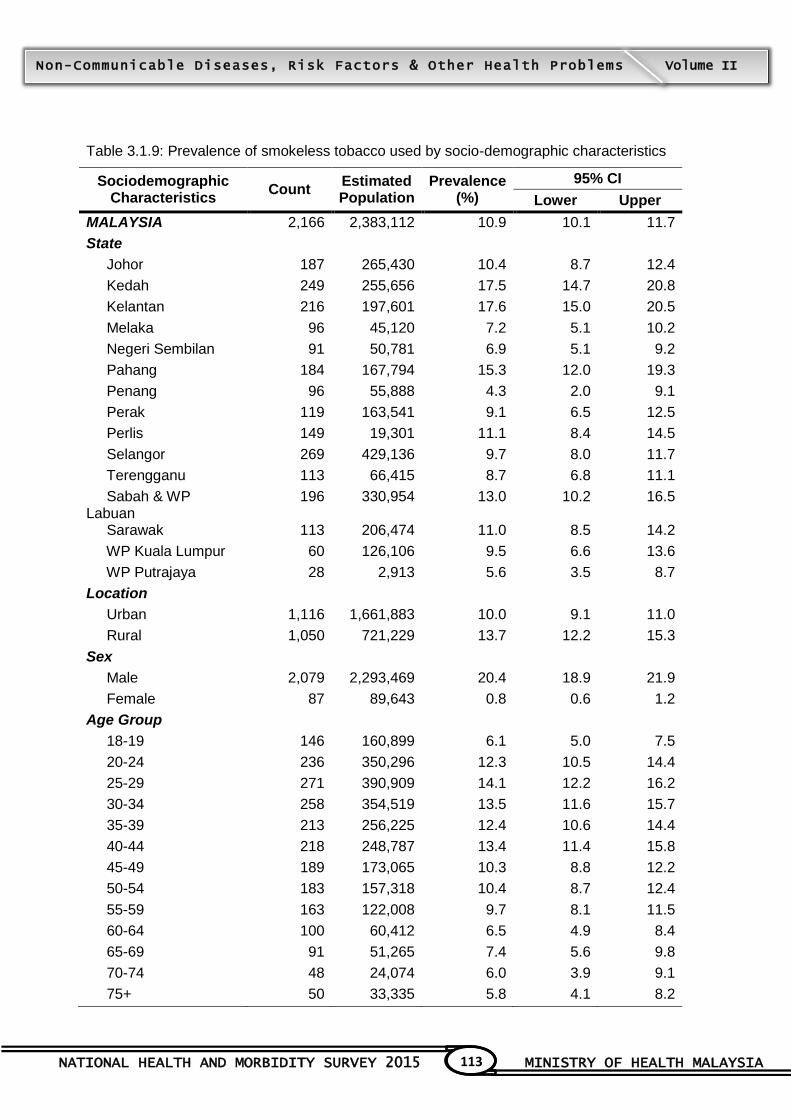
NATIONAL HEALTH AND MORBIDITY SURVEY 2015 MINISTRY OF HEALTH MALAYSIA
113
Non-Communicable Diseases, Risk Factors & Other Health Problems Volume II
Table 3.1.9: Prevalence of smokeless tobacco used by socio-demographic characteristics
Sociodemographic Characteristics
Count Estimated Population
Prevalence (%)
95% CI
Lower Upper
MALAYSIA 2,166 2,383,112 10.9 10.1 11.7
State
Johor 187 265,430 10.4 8.7 12.4
Kedah 249 255,656 17.5 14.7 20.8
Kelantan 216 197,601 17.6 15.0 20.5
Melaka 96 45,120 7.2 5.1 10.2
Negeri Sembilan 91 50,781 6.9 5.1 9.2
Pahang 184 167,794 15.3 12.0 19.3
Penang 96 55,888 4.3 2.0 9.1
Perak 119 163,541 9.1 6.5 12.5
Perlis 149 19,301 11.1 8.4 14.5
Selangor 269 429,136 9.7 8.0 11.7
Terengganu 113 66,415 8.7 6.8 11.1
Sabah & WP Labuan
196 330,954 13.0 10.2 16.5
Sarawak 113 206,474 11.0 8.5 14.2
WP Kuala Lumpur 60 126,106 9.5 6.6 13.6
WP Putrajaya 28 2,913 5.6 3.5 8.7
Location
Urban 1,116 1,661,883 10.0 9.1 11.0
Rural 1,050 721,229 13.7 12.2 15.3
Sex
Male 2,079 2,293,469 20.4 18.9 21.9
Female 87 89,643 0.8 0.6 1.2
Age Group
18-19 146 160,899 6.1 5.0 7.5
20-24 236 350,296 12.3 10.5 14.4
25-29 271 390,909 14.1 12.2 16.2
30-34 258 354,519 13.5 11.6 15.7
35-39 213 256,225 12.4 10.6 14.4
40-44 218 248,787 13.4 11.4 15.8
45-49 189 173,065 10.3 8.8 12.2
50-54 183 157,318 10.4 8.7 12.4
55-59 163 122,008 9.7 8.1 11.5
60-64 100 60,412 6.5 4.9 8.4
65-69 91 51,265 7.4 5.6 9.8
70-74 48 24,074 6.0 3.9 9.1
75+ 50 33,335 5.8 4.1 8.2
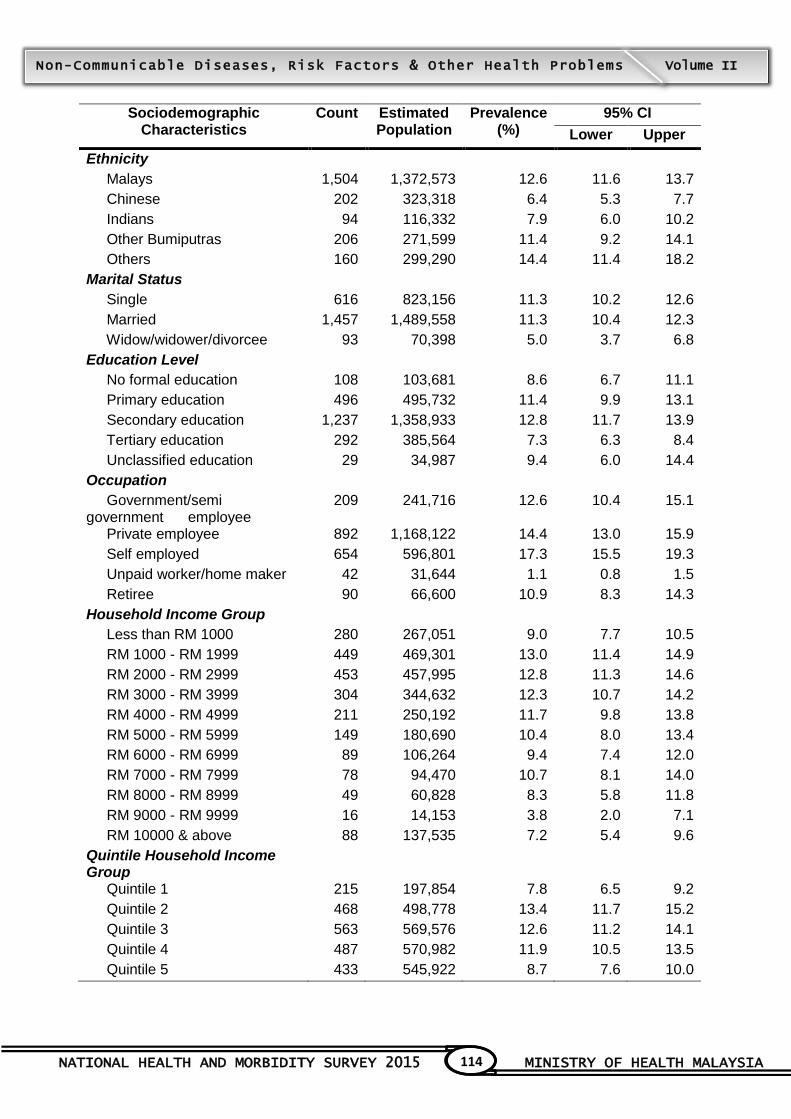
NATIONAL HEALTH AND MORBIDITY SURVEY 2015 MINISTRY OF HEALTH MALAYSIA
114
Non-Communicable Diseases, Risk Factors & Other Health Problems Volume II
Sociodemographic Characteristics
Count Estimated Population
Prevalence (%)
95% CI
Lower Upper
Ethnicity
Malays 1,504 1,372,573 12.6 11.6 13.7
Chinese 202 323,318 6.4 5.3 7.7
Indians 94 116,332 7.9 6.0 10.2
Other Bumiputras 206 271,599 11.4 9.2 14.1
Others 160 299,290 14.4 11.4 18.2
Marital Status
Single 616 823,156 11.3 10.2 12.6
Married 1,457 1,489,558 11.3 10.4 12.3
Widow/widower/divorcee 93 70,398 5.0 3.7 6.8
Education Level
No formal education 108 103,681 8.6 6.7 11.1
Primary education 496 495,732 11.4 9.9 13.1
Secondary education 1,237 1,358,933 12.8 11.7 13.9
Tertiary education 292 385,564 7.3 6.3 8.4
Unclassified education 29 34,987 9.4 6.0 14.4
Occupation
Government/semi government employee
209 241,716 12.6 10.4 15.1
Private employee 892 1,168,122 14.4 13.0 15.9
Self employed 654 596,801 17.3 15.5 19.3
Unpaid worker/home maker 42 31,644 1.1 0.8 1.5
Retiree 90 66,600 10.9 8.3 14.3
Household Income Group
Less than RM 1000 280 267,051 9.0 7.7 10.5
RM 1000 - RM 1999 449 469,301 13.0 11.4 14.9
RM 2000 - RM 2999 453 457,995 12.8 11.3 14.6
RM 3000 - RM 3999 304 344,632 12.3 10.7 14.2
RM 4000 - RM 4999 211 250,192 11.7 9.8 13.8
RM 5000 - RM 5999 149 180,690 10.4 8.0 13.4
RM 6000 - RM 6999 89 106,264 9.4 7.4 12.0
RM 7000 - RM 7999 78 94,470 10.7 8.1 14.0
RM 8000 - RM 8999 49 60,828 8.3 5.8 11.8
RM 9000 - RM 9999 16 14,153 3.8 2.0 7.1
RM 10000 & above 88 137,535 7.2 5.4 9.6
Quintile Household Income Group
Quintile 1 215 197,854 7.8 6.5 9.2
Quintile 2 468 498,778 13.4 11.7 15.2
Quintile 3 563 569,576 12.6 11.2 14.1
Quintile 4 487 570,982 11.9 10.5 13.5
Quintile 5 433 545,922 8.7 7.6 10.0
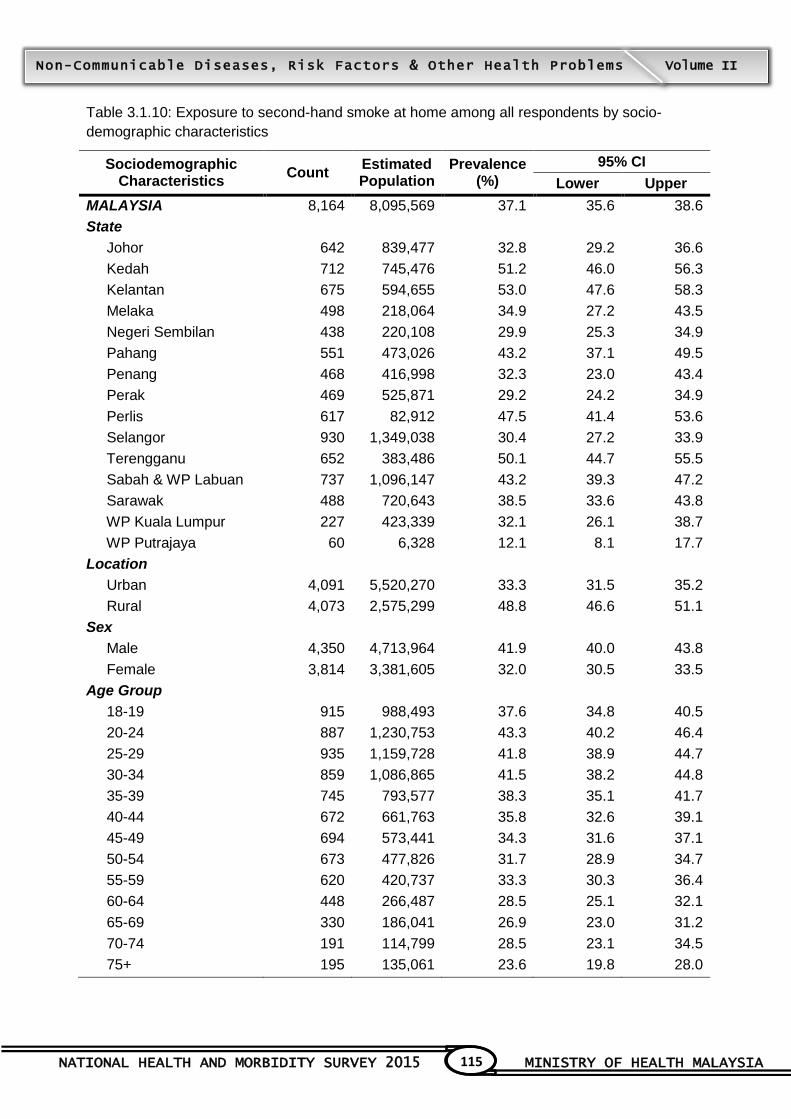
NATIONAL HEALTH AND MORBIDITY SURVEY 2015 MINISTRY OF HEALTH MALAYSIA
115
Non-Communicable Diseases, Risk Factors & Other Health Problems Volume II
Table 3.1.10: Exposure to second-hand smoke at home among all respondents by socio-
demographic characteristics
Sociodemographic Characteristics
Count Estimated Population
Prevalence (%)
95% CI
Lower Upper
MALAYSIA 8,164 8,095,569 37.1 35.6 38.6
State
Johor 642 839,477 32.8 29.2 36.6
Kedah 712 745,476 51.2 46.0 56.3
Kelantan 675 594,655 53.0 47.6 58.3
Melaka 498 218,064 34.9 27.2 43.5
Negeri Sembilan 438 220,108 29.9 25.3 34.9
Pahang 551 473,026 43.2 37.1 49.5
Penang 468 416,998 32.3 23.0 43.4
Perak 469 525,871 29.2 24.2 34.9
Perlis 617 82,912 47.5 41.4 53.6
Selangor 930 1,349,038 30.4 27.2 33.9
Terengganu 652 383,486 50.1 44.7 55.5
Sabah & WP Labuan 737 1,096,147 43.2 39.3 47.2
Sarawak 488 720,643 38.5 33.6 43.8
WP Kuala Lumpur 227 423,339 32.1 26.1 38.7
WP Putrajaya 60 6,328 12.1 8.1 17.7
Location
Urban 4,091 5,520,270 33.3 31.5 35.2
Rural 4,073 2,575,299 48.8 46.6 51.1
Sex
Male 4,350 4,713,964 41.9 40.0 43.8
Female 3,814 3,381,605 32.0 30.5 33.5
Age Group
18-19 915 988,493 37.6 34.8 40.5
20-24 887 1,230,753 43.3 40.2 46.4
25-29 935 1,159,728 41.8 38.9 44.7
30-34 859 1,086,865 41.5 38.2 44.8
35-39 745 793,577 38.3 35.1 41.7
40-44 672 661,763 35.8 32.6 39.1
45-49 694 573,441 34.3 31.6 37.1
50-54 673 477,826 31.7 28.9 34.7
55-59 620 420,737 33.3 30.3 36.4
60-64 448 266,487 28.5 25.1 32.1
65-69 330 186,041 26.9 23.0 31.2
70-74 191 114,799 28.5 23.1 34.5
75+ 195 135,061 23.6 19.8 28.0

NATIONAL HEALTH AND MORBIDITY SURVEY 2015 MINISTRY OF HEALTH MALAYSIA
116
Non-Communicable Diseases, Risk Factors & Other Health Problems Volume II
Sociodemographic Characteristics
Count Estimated Population
Prevalence (%)
95% CI
Lower Upper
Ethnicity
Malays 5,601 4,607,386 42.5 40.7 44.3
Chinese 725 1,052,020 20.8 18.4 23.4
Indians 361 370,178 25.1 21.0 29.7
Other Bumiputras 845 1,041,801 43.9 40.0 47.9
Others 632 1,024,185 49.4 44.4 54.3
Marital Status
Single 2,320 2,859,207 39.3 37.2 41.5
Married 5,298 4,831,553 36.7 35.1 38.3
Widow/widower/divorcee 546 404,809 28.9 25.9 32.1
Education Level
No formal education 570 525,079 43.9 39.7 48.2
Primary education 2,054 1,807,751 41.6 39.3 43.8
Secondary education 4,291 4,293,008 40.4 38.6 42.3
Tertiary education 1,111 1,314,443 24.9 23.0 26.9
Unclassified education 133 151,877 40.6 33.2 48.5
Occupation
Government/semi government employee
595 558,678 29.1 26.2 32.2
Private employee 2,521 3,176,659 39.2 36.9 41.5
Self employed 1,787 1,520,067 44.2 41.6 46.7
Unpaid worker/home maker 1,332 1,073,381 37.0 34.7 39.4
Retiree 219 146,218 24.0 20.3 28.3
Household Income Group
Less than RM 1000 1,176 1,017,418 34.2 31.4 37.1
RM 1000 - RM 1999 1,697 1,539,846 42.8 40.0 45.7
RM 2000 - RM 2999 1,589 1,465,349 41.1 38.2 44.1
RM 3000 - RM 3999 1,117 1,129,910 40.4 36.9 44.0
RM 4000 - RM 4999 781 881,654 41.1 37.0 45.3
RM 5000 - RM 5999 551 611,604 35.3 30.6 40.2
RM 6000 - RM 6999 382 399,246 35.4 30.0 41.1
RM 7000 - RM 7999 291 312,970 35.5 29.6 41.8
RM 8000 - RM 8999 178 201,683 27.6 21.8 34.2
RM 9000 - RM 9999 58 64,783 17.4 11.3 25.9
RM 10000 & above 344 471,108 24.7 20.3 29.7
Quintile Household Income Group
Quintile 1 939 811,639 31.8 28.8 35.0
Quintile 2 1,750 1,614,125 43.4 40.7 46.1
Quintile 3 1,977 1,805,040 39.9 37.3 42.6
Quintile 4 1,801 1,935,934 40.5 37.6 43.6
Quintile 5 1,697 1,928,832 30.8 28.2 33.5

NATIONAL HEALTH AND MORBIDITY SURVEY 2015 MINISTRY OF HEALTH MALAYSIA
117
Non-Communicable Diseases, Risk Factors & Other Health Problems Volume II
Table 3.1.11: Exposure to second-hand smoke at home among non-smokers by socio-
demographic characteristics
Sociodemographic Characteristics
Count Estimated Population
Prevalence (%)
95% CI
Lower Upper
MALAYSIA 4,731 4,365,163 25.9 24.6 27.2
State
Johor 335 415,856 20.9 18.0 24.0
Kedah 395 418,852 39.1 33.9 44.6
Kelantan 408 349,717 41.2 35.9 46.8
Melaka 323 136,099 26.2 19.3 34.5
Negeri Sembilan 230 112,366 19.3 15.6 23.6
Pahang 294 247,060 30.3 24.8 36.4
Penang 284 241,695 23.2 15.8 32.7
Perak 247 251,292 17.7 14.3 21.8
Perlis 391 52,942 38.9 32.7 45.5
Selangor 544 744,222 21.2 18.7 24.1
Terengganu 414 239,100 40.2 34.9 45.7
Sabah & WP Labuan 425 560,878 30.9 27.6 34.4
Sarawak 284 378,121 27.1 22.6 32.1
WP Kuala Lumpur 125 213,293 20.0 15.6 25.2
WP Putrajaya 32 3,668 8.0 4.6 13.5
Location
Urban 2,367 2,993,044 22.9 21.5 24.5
Rural 2,364 1,372,119 36.0 33.9 38.3
Sex
Male 1,019 1,099,831 17.1 15.6 18.8
Female 3,712 3,265,332 31.3 29.8 32.8
Age Group
18-19 688 740,571 32.5 29.7 35.3
20-24 484 654,763 30.8 27.8 34.0
25-29 511 574,426 28.6 25.9 31.5
30-34 441 519,835 28.0 25.0 31.3
35-39 397 355,942 24.5 21.5 27.7
40-44 358 298,759 21.9 19.3 24.8
45-49 373 283,602 22.3 19.7 25.1
50-54 389 249,065 21.2 18.6 24.0
55-59 373 242,936 23.3 20.6 26.1
60-64 269 156,982 19.6 16.7 22.8
65-69 196 116,471 19.5 15.7 23.9
70-74 120 78,381 22.0 16.6 28.5
75+ 132 93,428 18.0 14.5 22.1

NATIONAL HEALTH AND MORBIDITY SURVEY 2015 MINISTRY OF HEALTH MALAYSIA
118
Non-Communicable Diseases, Risk Factors & Other Health Problems Volume II
Sociodemographic Characteristics
Count Estimated Population
Prevalence (%)
95% CI
Lower Upper
Ethnicity
Malays 3,273 2,532,768 31.0 29.3 32.7
Chinese 416 575,076 13.2 11.4 15.4
Indians 214 218,389 17.7 14.3 21.7
Other Bumiputras 503 597,248 33.9 30.2 37.8
Others 325 441,683 32.7 28.3 37.5
Marital Status
Single 1,291 1,500,228 27.0 25.1 29.1
Married 3,044 2,571,861 25.6 24.3 27.0
Widow/widower/divorcee 396 293,074 23.2 20.3 26.3
Education Level
No formal education 387 307,133 32.7 28.8 36.9
Primary education 1,197 945,122 29.0 27.0 31.1
Secondary education 2,385 2,248,599 28.5 26.8 30.3
Tertiary education 691 791,798 17.6 15.9 19.5
Unclassified education 70 72,463 26.4 20.0 34.0
Occupation
Government/semi government employee
298 248,012 16.8 14.4 19.5
Private employee 1,096 1,288,740 23.3 21.4 25.3
Self employed 695 562,906 25.3 23.0 27.8
Unpaid worker/home maker 1,282 1,033,222 36.3 34.0 38.7
Retiree 97 63,919 13.0 10.1 16.6
Household Income Group
Less than RM 1000 716 579,326 23.8 21.4 26.4
RM 1000 - RM 1999 960 783,935 29.6 27.0 32.4
RM 2000 - RM 2999 893 765,654 28.9 26.2 31.9
RM 3000 - RM 3999 655 631,009 30.1 26.7 33.8
RM 4000 - RM 4999 451 476,027 30.1 26.3 34.2
RM 5000 - RM 5999 323 339,566 25.1 21.1 29.6
RM 6000 - RM 6999 224 214,378 23.9 19.6 28.9
RM 7000 - RM 7999 168 168,541 25.1 19.8 31.2
RM 8000 - RM 8999 103 108,795 18.0 13.6 23.5
RM 9000 - RM 9999 35 38,966 11.7 6.9 19.3
RM 10000 & above 203 258,967 16.2 13.1 19.9
Quintile Household Income Group
Quintile 1 580 476,981 22.4 19.9 25.2
Quintile 2 987 815,263 29.9 27.4 32.5
Quintile 3 1,114 947,559 28.0 25.6 30.6
Quintile 4 1,050 1,068,635 30.0 27.2 32.9
Quintile 5 1,000 1,056,725 20.9 18.9 23.1
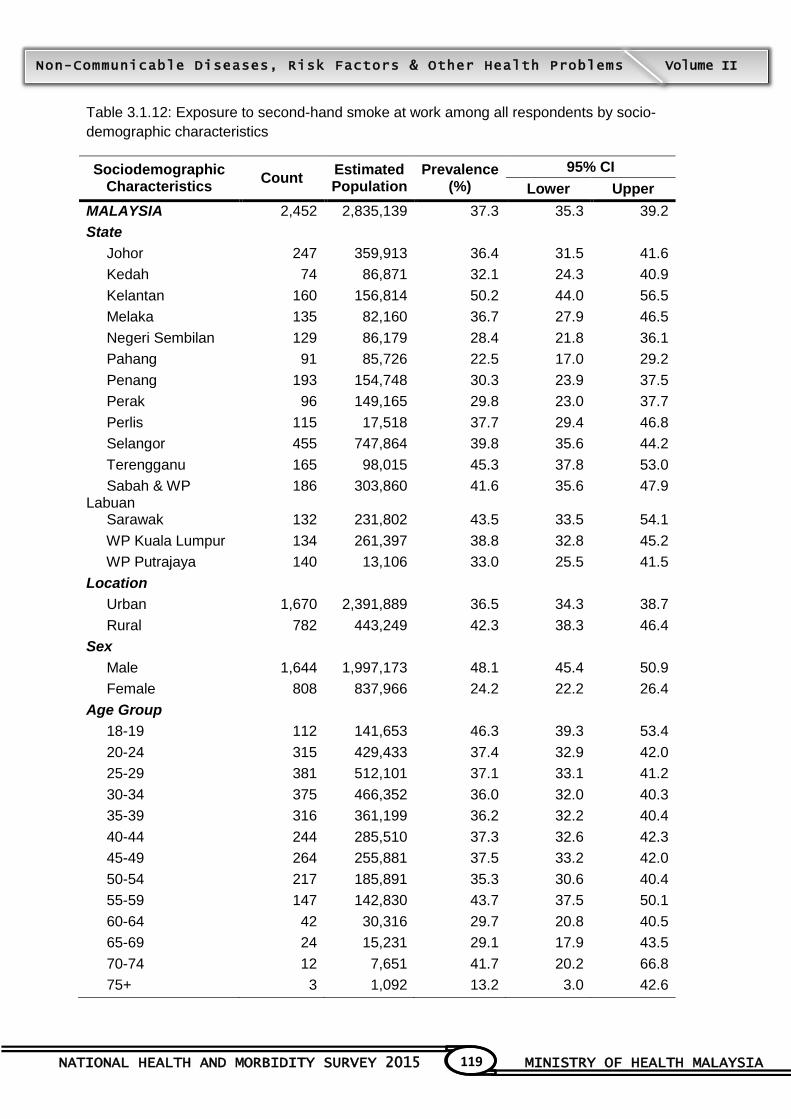
NATIONAL HEALTH AND MORBIDITY SURVEY 2015 MINISTRY OF HEALTH MALAYSIA
119
Non-Communicable Diseases, Risk Factors & Other Health Problems Volume II
Table 3.1.12: Exposure to second-hand smoke at work among all respondents by socio-
demographic characteristics
Sociodemographic Characteristics
Count Estimated Population
Prevalence (%)
95% CI
Lower Upper
MALAYSIA 2,452 2,835,139 37.3 35.3 39.2
State
Johor 247 359,913 36.4 31.5 41.6
Kedah 74 86,871 32.1 24.3 40.9
Kelantan 160 156,814 50.2 44.0 56.5
Melaka 135 82,160 36.7 27.9 46.5
Negeri Sembilan 129 86,179 28.4 21.8 36.1
Pahang 91 85,726 22.5 17.0 29.2
Penang 193 154,748 30.3 23.9 37.5
Perak 96 149,165 29.8 23.0 37.7
Perlis 115 17,518 37.7 29.4 46.8
Selangor 455 747,864 39.8 35.6 44.2
Terengganu 165 98,015 45.3 37.8 53.0
Sabah & WP Labuan
186 303,860 41.6 35.6 47.9
Sarawak 132 231,802 43.5 33.5 54.1
WP Kuala Lumpur 134 261,397 38.8 32.8 45.2
WP Putrajaya 140 13,106 33.0 25.5 41.5
Location
Urban 1,670 2,391,889 36.5 34.3 38.7
Rural 782 443,249 42.3 38.3 46.4
Sex
Male 1,644 1,997,173 48.1 45.4 50.9
Female 808 837,966 24.2 22.2 26.4
Age Group
18-19 112 141,653 46.3 39.3 53.4
20-24 315 429,433 37.4 32.9 42.0
25-29 381 512,101 37.1 33.1 41.2
30-34 375 466,352 36.0 32.0 40.3
35-39 316 361,199 36.2 32.2 40.4
40-44 244 285,510 37.3 32.6 42.3
45-49 264 255,881 37.5 33.2 42.0
50-54 217 185,891 35.3 30.6 40.4
55-59 147 142,830 43.7 37.5 50.1
60-64 42 30,316 29.7 20.8 40.5
65-69 24 15,231 29.1 17.9 43.5
70-74 12 7,651 41.7 20.2 66.8
75+ 3 1,092 13.2 3.0 42.6
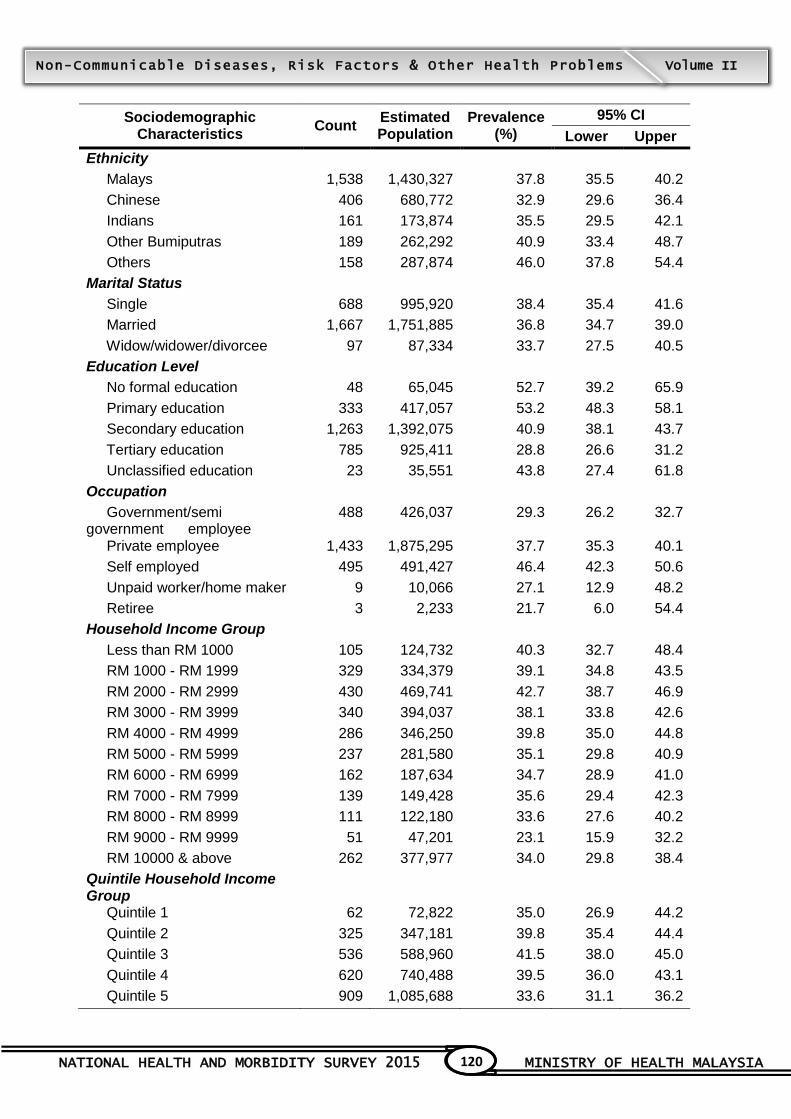
NATIONAL HEALTH AND MORBIDITY SURVEY 2015 MINISTRY OF HEALTH MALAYSIA
120
Non-Communicable Diseases, Risk Factors & Other Health Problems Volume II
Sociodemographic Characteristics
Count Estimated Population
Prevalence (%)
95% CI
Lower Upper
Ethnicity
Malays 1,538 1,430,327 37.8 35.5 40.2
Chinese 406 680,772 32.9 29.6 36.4
Indians 161 173,874 35.5 29.5 42.1
Other Bumiputras 189 262,292 40.9 33.4 48.7
Others 158 287,874 46.0 37.8 54.4
Marital Status
Single 688 995,920 38.4 35.4 41.6
Married 1,667 1,751,885 36.8 34.7 39.0
Widow/widower/divorcee 97 87,334 33.7 27.5 40.5
Education Level
No formal education 48 65,045 52.7 39.2 65.9
Primary education 333 417,057 53.2 48.3 58.1
Secondary education 1,263 1,392,075 40.9 38.1 43.7
Tertiary education 785 925,411 28.8 26.6 31.2
Unclassified education 23 35,551 43.8 27.4 61.8
Occupation
Government/semi government employee
488 426,037 29.3 26.2 32.7
Private employee 1,433 1,875,295 37.7 35.3 40.1
Self employed 495 491,427 46.4 42.3 50.6
Unpaid worker/home maker 9 10,066 27.1 12.9 48.2
Retiree 3 2,233 21.7 6.0 54.4
Household Income Group
Less than RM 1000 105 124,732 40.3 32.7 48.4
RM 1000 - RM 1999 329 334,379 39.1 34.8 43.5
RM 2000 - RM 2999 430 469,741 42.7 38.7 46.9
RM 3000 - RM 3999 340 394,037 38.1 33.8 42.6
RM 4000 - RM 4999 286 346,250 39.8 35.0 44.8
RM 5000 - RM 5999 237 281,580 35.1 29.8 40.9
RM 6000 - RM 6999 162 187,634 34.7 28.9 41.0
RM 7000 - RM 7999 139 149,428 35.6 29.4 42.3
RM 8000 - RM 8999 111 122,180 33.6 27.6 40.2
RM 9000 - RM 9999 51 47,201 23.1 15.9 32.2
RM 10000 & above 262 377,977 34.0 29.8 38.4
Quintile Household Income Group
Quintile 1 62 72,822 35.0 26.9 44.2
Quintile 2 325 347,181 39.8 35.4 44.4
Quintile 3 536 588,960 41.5 38.0 45.0
Quintile 4 620 740,488 39.5 36.0 43.1
Quintile 5 909 1,085,688 33.6 31.1 36.2
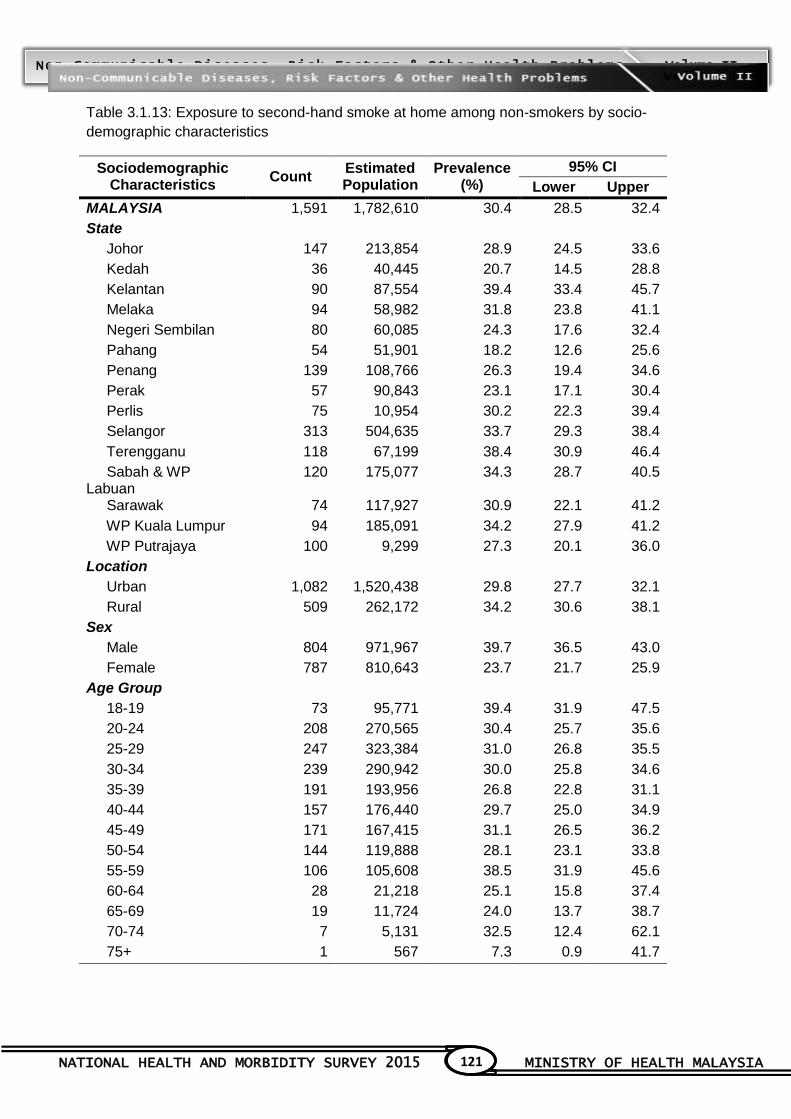
NATIONAL HEALTH AND MORBIDITY SURVEY 2015 MINISTRY OF HEALTH MALAYSIA
121
Non-Communicable Diseases, Risk Factors & Other Health Problems Volume II
Table 3.1.13: Exposure to second-hand smoke at home among non-smokers by socio-
demographic characteristics
Sociodemographic Characteristics
Count Estimated Population
Prevalence (%)
95% CI
Lower Upper
MALAYSIA 1,591 1,782,610 30.4 28.5 32.4
State
Johor 147 213,854 28.9 24.5 33.6
Kedah 36 40,445 20.7 14.5 28.8
Kelantan 90 87,554 39.4 33.4 45.7
Melaka 94 58,982 31.8 23.8 41.1
Negeri Sembilan 80 60,085 24.3 17.6 32.4
Pahang 54 51,901 18.2 12.6 25.6
Penang 139 108,766 26.3 19.4 34.6
Perak 57 90,843 23.1 17.1 30.4
Perlis 75 10,954 30.2 22.3 39.4
Selangor 313 504,635 33.7 29.3 38.4
Terengganu 118 67,199 38.4 30.9 46.4
Sabah & WP Labuan
120 175,077 34.3 28.7 40.5
Sarawak 74 117,927 30.9 22.1 41.2
WP Kuala Lumpur 94 185,091 34.2 27.9 41.2
WP Putrajaya 100 9,299 27.3 20.1 36.0
Location
Urban 1,082 1,520,438 29.8 27.7 32.1
Rural 509 262,172 34.2 30.6 38.1
Sex
Male 804 971,967 39.7 36.5 43.0
Female 787 810,643 23.7 21.7 25.9
Age Group
18-19 73 95,771 39.4 31.9 47.5
20-24 208 270,565 30.4 25.7 35.6
25-29 247 323,384 31.0 26.8 35.5
30-34 239 290,942 30.0 25.8 34.6
35-39 191 193,956 26.8 22.8 31.1
40-44 157 176,440 29.7 25.0 34.9
45-49 171 167,415 31.1 26.5 36.2
50-54 144 119,888 28.1 23.1 33.8
55-59 106 105,608 38.5 31.9 45.6
60-64 28 21,218 25.1 15.8 37.4
65-69 19 11,724 24.0 13.7 38.7
70-74 7 5,131 32.5 12.4 62.1
75+ 1 567 7.3 0.9 41.7
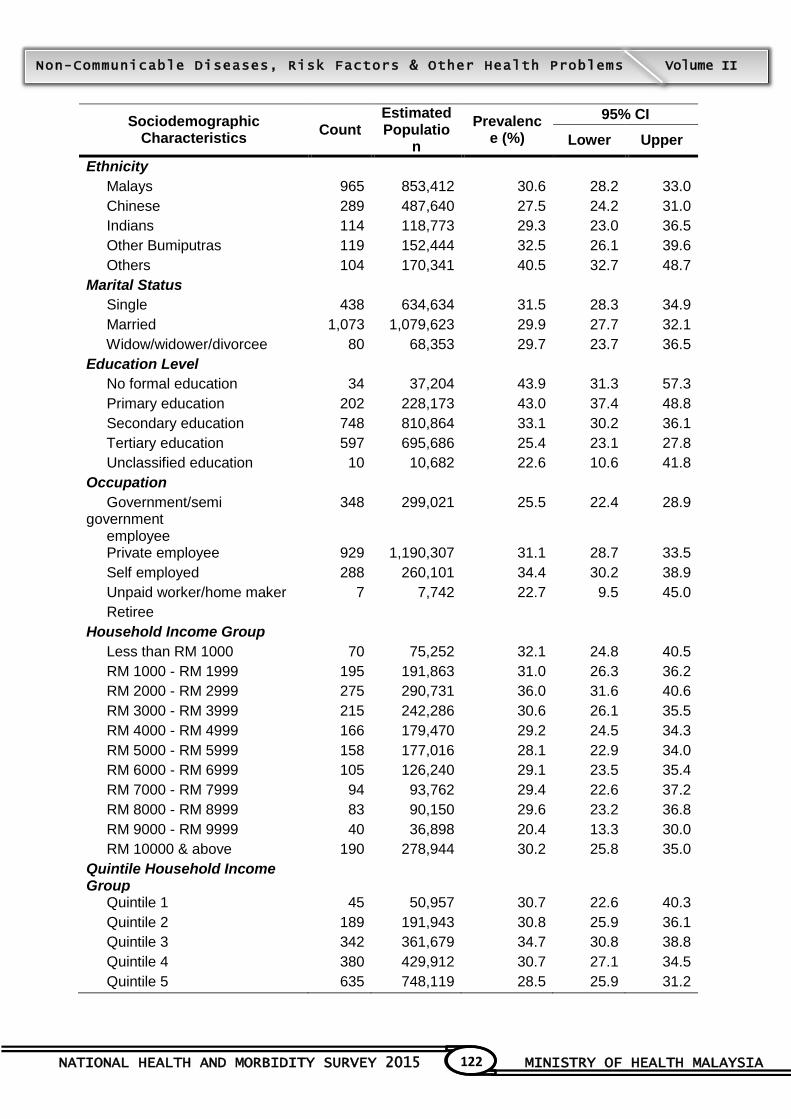
NATIONAL HEALTH AND MORBIDITY SURVEY 2015 MINISTRY OF HEALTH MALAYSIA
122
Non-Communicable Diseases, Risk Factors & Other Health Problems Volume II
Sociodemographic Characteristics
Count Estimated Populatio
n
Prevalence (%)
95% CI
Lower Upper
Ethnicity
Malays 965 853,412 30.6 28.2 33.0
Chinese 289 487,640 27.5 24.2 31.0
Indians 114 118,773 29.3 23.0 36.5
Other Bumiputras 119 152,444 32.5 26.1 39.6
Others 104 170,341 40.5 32.7 48.7
Marital Status
Single 438 634,634 31.5 28.3 34.9
Married 1,073 1,079,623 29.9 27.7 32.1
Widow/widower/divorcee 80 68,353 29.7 23.7 36.5
Education Level
No formal education 34 37,204 43.9 31.3 57.3
Primary education 202 228,173 43.0 37.4 48.8
Secondary education 748 810,864 33.1 30.2 36.1
Tertiary education 597 695,686 25.4 23.1 27.8
Unclassified education 10 10,682 22.6 10.6 41.8
Occupation
Government/semi government employee
348 299,021 25.5 22.4 28.9
Private employee 929 1,190,307 31.1 28.7 33.5
Self employed 288 260,101 34.4 30.2 38.9
Unpaid worker/home maker 7 7,742 22.7 9.5 45.0
Retiree
Household Income Group
Less than RM 1000 70 75,252 32.1 24.8 40.5
RM 1000 - RM 1999 195 191,863 31.0 26.3 36.2
RM 2000 - RM 2999 275 290,731 36.0 31.6 40.6
RM 3000 - RM 3999 215 242,286 30.6 26.1 35.5
RM 4000 - RM 4999 166 179,470 29.2 24.5 34.3
RM 5000 - RM 5999 158 177,016 28.1 22.9 34.0
RM 6000 - RM 6999 105 126,240 29.1 23.5 35.4
RM 7000 - RM 7999 94 93,762 29.4 22.6 37.2
RM 8000 - RM 8999 83 90,150 29.6 23.2 36.8
RM 9000 - RM 9999 40 36,898 20.4 13.3 30.0
RM 10000 & above 190 278,944 30.2 25.8 35.0
Quintile Household Income Group
Quintile 1 45 50,957 30.7 22.6 40.3
Quintile 2 189 191,943 30.8 25.9 36.1
Quintile 3 342 361,679 34.7 30.8 38.8
Quintile 4 380 429,912 30.7 27.1 34.5
Quintile 5 635 748,119 28.5 25.9 31.2

NATIONAL HEALTH AND MORBIDITY SURVEY 2015 MINISTRY OF HEALTH MALAYSIA
123
Non-Communicable Diseases, Risk Factors & Other Health Problems Volume II
Table 3.1.14: Current smokers who made a quit attempt in the past 12 months by socio-
demographic characteristics
Sociodemographic Characteristics
Count Estimated Population
Prevalence (%)
95% CI
Lower Upper
MALAYSIA 2,203 2,607,235 52.3 49.9 54.8
State
Johor 208 287,328 50.6 41.9 59.3
Kedah 130 135,554 35.3 28.7 42.5
Kelantan 158 149,010 53.7 46.1 61.2
Melaka 88 36,251 34.9 24.5 47.1
Negeri Sembilan 131 74,107 48.0 37.7 58.6
Pahang 148 127,474 45.4 37.0 54.0
Penang 121 104,926 42.4 27.3 59.2
Perak 126 174,026 46.7 39.0 54.5
Perlis 81 11,386 29.4 19.9 41.1
Selangor 344 535,968 57.7 52.1 63.2
Terengganu 144 89,884 52.8 43.5 62.0
Sabah & WP Labuan 249 422,249 58.6 51.4 65.4
Sarawak 171 297,514 62.4 53.7 70.4
WP Kuala Lumpur 78 158,723 62.8 53.8 71.1
WP Putrajaya 26 2,836 43.5 30.7 57.2
Location
Urban 1,195 1,852,774 52.8 49.7 55.9
Rural 1,008 754,460 51.2 47.3 55.1
Sex
Male 2,135 2,522,235 52.1 49.6 54.6
Female 68 84,999 59.2 48.3 69.3
Age Group
18-19 164 194,192 55.7 48.9 62.3
20-24 274 397,925 55.5 49.5 61.4
25-29 294 437,269 56.8 51.2 62.1
30-34 262 392,343 51.0 45.6 56.4
35-39 221 297,554 48.2 42.2 54.3
40-44 210 249,638 51.1 45.1 57.2
45-49 209 211,041 52.9 47.2 58.5
50-54 196 181,635 54.8 48.3 61.2
55-59 147 108,384 49.2 42.1 56.4
60-64 83 52,195 40.1 31.9 48.9
65-69 80 48,827 52.3 41.5 62.9
70-74 33 18,827 41.9 28.3 56.9
75+ 30 17,406 33.1 20.8 48.3
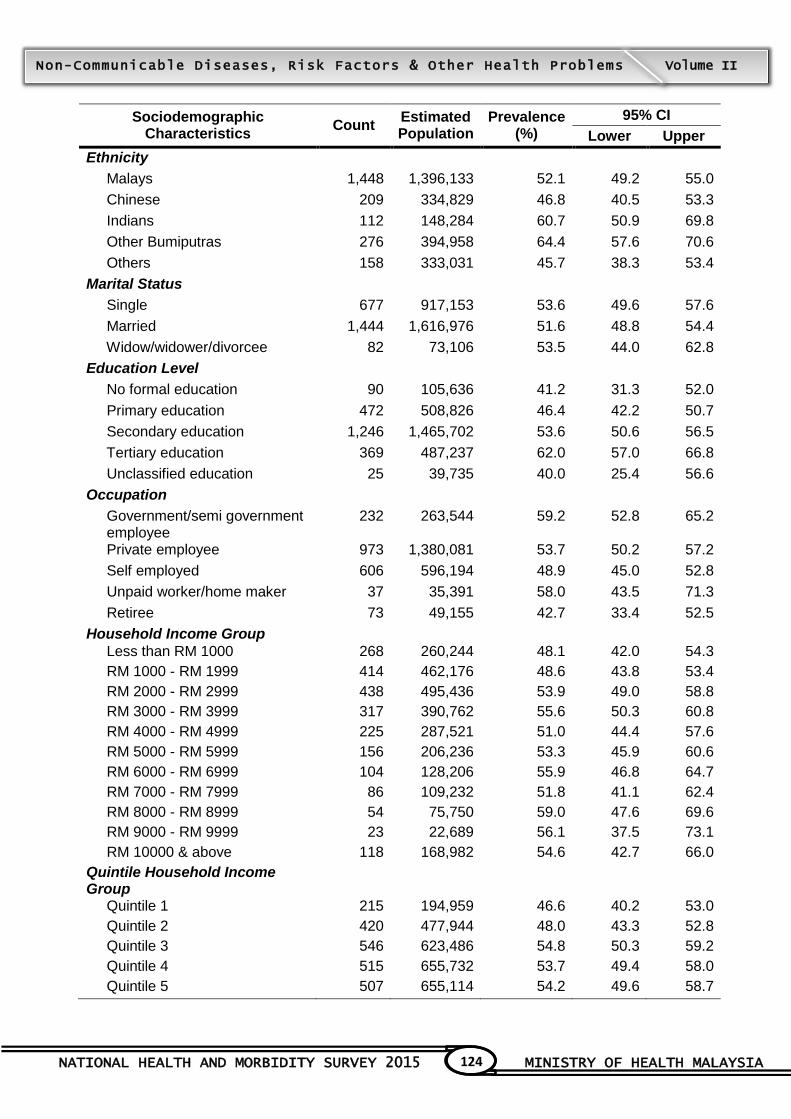
NATIONAL HEALTH AND MORBIDITY SURVEY 2015 MINISTRY OF HEALTH MALAYSIA
124
Non-Communicable Diseases, Risk Factors & Other Health Problems Volume II
Sociodemographic Characteristics
Count Estimated Population
Prevalence (%)
95% CI
Lower Upper
Ethnicity
Malays 1,448 1,396,133 52.1 49.2 55.0
Chinese 209 334,829 46.8 40.5 53.3
Indians 112 148,284 60.7 50.9 69.8
Other Bumiputras 276 394,958 64.4 57.6 70.6
Others 158 333,031 45.7 38.3 53.4
Marital Status
Single 677 917,153 53.6 49.6 57.6
Married 1,444 1,616,976 51.6 48.8 54.4
Widow/widower/divorcee 82 73,106 53.5 44.0 62.8
Education Level
No formal education 90 105,636 41.2 31.3 52.0
Primary education 472 508,826 46.4 42.2 50.7
Secondary education 1,246 1,465,702 53.6 50.6 56.5
Tertiary education 369 487,237 62.0 57.0 66.8
Unclassified education 25 39,735 40.0 25.4 56.6
Occupation
Government/semi government employee
232 263,544 59.2 52.8 65.2
Private employee 973 1,380,081 53.7 50.2 57.2
Self employed 606 596,194 48.9 45.0 52.8
Unpaid worker/home maker 37 35,391 58.0 43.5 71.3
Retiree 73 49,155 42.7 33.4 52.5
Household Income Group
Less than RM 1000 268 260,244 48.1 42.0 54.3
RM 1000 - RM 1999 414 462,176 48.6 43.8 53.4
RM 2000 - RM 2999 438 495,436 53.9 49.0 58.8
RM 3000 - RM 3999 317 390,762 55.6 50.3 60.8
RM 4000 - RM 4999 225 287,521 51.0 44.4 57.6
RM 5000 - RM 5999 156 206,236 53.3 45.9 60.6
RM 6000 - RM 6999 104 128,206 55.9 46.8 64.7
RM 7000 - RM 7999 86 109,232 51.8 41.1 62.4
RM 8000 - RM 8999 54 75,750 59.0 47.6 69.6
RM 9000 - RM 9999 23 22,689 56.1 37.5 73.1
RM 10000 & above 118 168,982 54.6 42.7 66.0
Quintile Household Income Group
Quintile 1 215 194,959 46.6 40.2 53.0
Quintile 2 420 477,944 48.0 43.3 52.8
Quintile 3 546 623,486 54.8 50.3 59.2
Quintile 4 515 655,732 53.7 49.4 58.0
Quintile 5 507 655,114 54.2 49.6 58.7
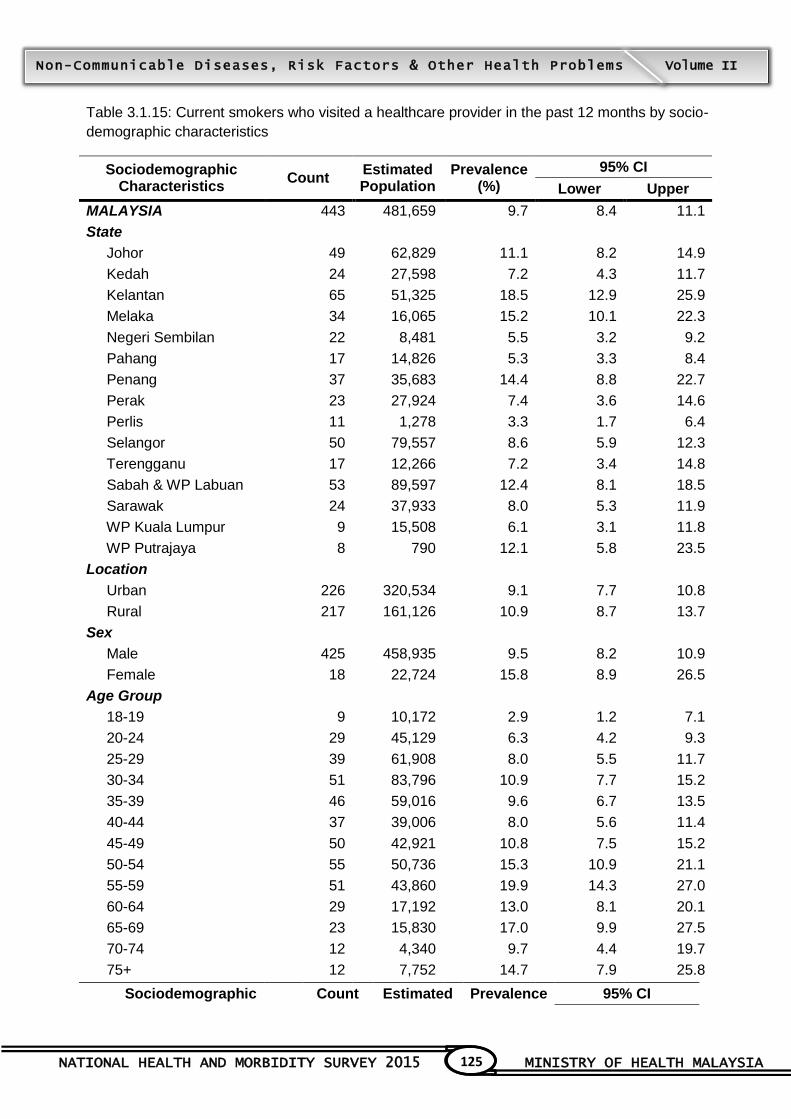
NATIONAL HEALTH AND MORBIDITY SURVEY 2015 MINISTRY OF HEALTH MALAYSIA
125
Non-Communicable Diseases, Risk Factors & Other Health Problems Volume II
Table 3.1.15: Current smokers who visited a healthcare provider in the past 12 months by socio-
demographic characteristics
Sociodemographic Characteristics
Count Estimated Population
Prevalence (%)
95% CI
Lower Upper
MALAYSIA 443 481,659 9.7 8.4 11.1
State
Johor 49 62,829 11.1 8.2 14.9
Kedah 24 27,598 7.2 4.3 11.7
Kelantan 65 51,325 18.5 12.9 25.9
Melaka 34 16,065 15.2 10.1 22.3
Negeri Sembilan 22 8,481 5.5 3.2 9.2
Pahang 17 14,826 5.3 3.3 8.4
Penang 37 35,683 14.4 8.8 22.7
Perak 23 27,924 7.4 3.6 14.6
Perlis 11 1,278 3.3 1.7 6.4
Selangor 50 79,557 8.6 5.9 12.3
Terengganu 17 12,266 7.2 3.4 14.8
Sabah & WP Labuan 53 89,597 12.4 8.1 18.5
Sarawak 24 37,933 8.0 5.3 11.9
WP Kuala Lumpur 9 15,508 6.1 3.1 11.8
WP Putrajaya 8 790 12.1 5.8 23.5
Location
Urban 226 320,534 9.1 7.7 10.8
Rural 217 161,126 10.9 8.7 13.7
Sex
Male 425 458,935 9.5 8.2 10.9
Female 18 22,724 15.8 8.9 26.5
Age Group
18-19 9 10,172 2.9 1.2 7.1
20-24 29 45,129 6.3 4.2 9.3
25-29 39 61,908 8.0 5.5 11.7
30-34 51 83,796 10.9 7.7 15.2
35-39 46 59,016 9.6 6.7 13.5
40-44 37 39,006 8.0 5.6 11.4
45-49 50 42,921 10.8 7.5 15.2
50-54 55 50,736 15.3 10.9 21.1
55-59 51 43,860 19.9 14.3 27.0
60-64 29 17,192 13.0 8.1 20.1
65-69 23 15,830 17.0 9.9 27.5
70-74 12 4,340 9.7 4.4 19.7
75+ 12 7,752 14.7 7.9 25.8
Sociodemographic Count Estimated Prevalence 95% CI
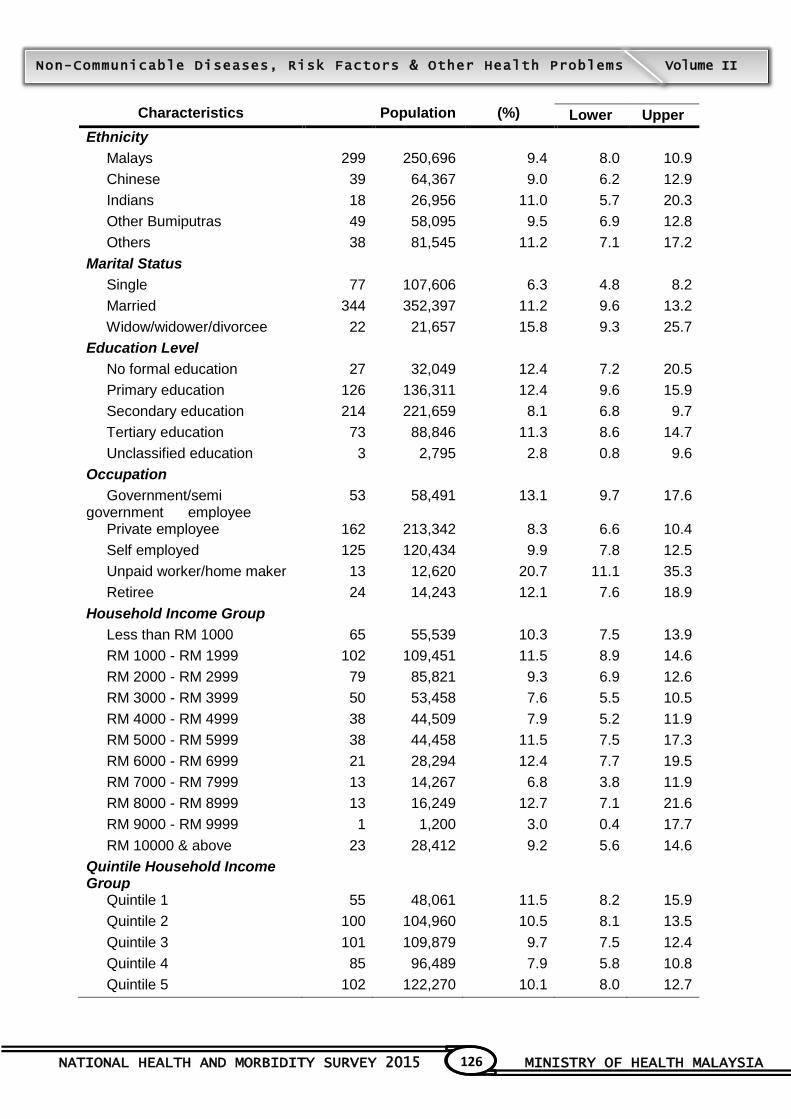
NATIONAL HEALTH AND MORBIDITY SURVEY 2015 MINISTRY OF HEALTH MALAYSIA
126
Non-Communicable Diseases, Risk Factors & Other Health Problems Volume II
Characteristics Population (%) Lower Upper
Ethnicity
Malays 299 250,696 9.4 8.0 10.9
Chinese 39 64,367 9.0 6.2 12.9
Indians 18 26,956 11.0 5.7 20.3
Other Bumiputras 49 58,095 9.5 6.9 12.8
Others 38 81,545 11.2 7.1 17.2
Marital Status
Single 77 107,606 6.3 4.8 8.2
Married 344 352,397 11.2 9.6 13.2
Widow/widower/divorcee 22 21,657 15.8 9.3 25.7
Education Level
No formal education 27 32,049 12.4 7.2 20.5
Primary education 126 136,311 12.4 9.6 15.9
Secondary education 214 221,659 8.1 6.8 9.7
Tertiary education 73 88,846 11.3 8.6 14.7
Unclassified education 3 2,795 2.8 0.8 9.6
Occupation
Government/semi government employee
53 58,491 13.1 9.7 17.6
Private employee 162 213,342 8.3 6.6 10.4
Self employed 125 120,434 9.9 7.8 12.5
Unpaid worker/home maker 13 12,620 20.7 11.1 35.3
Retiree 24 14,243 12.1 7.6 18.9
Household Income Group
Less than RM 1000 65 55,539 10.3 7.5 13.9
RM 1000 - RM 1999 102 109,451 11.5 8.9 14.6
RM 2000 - RM 2999 79 85,821 9.3 6.9 12.6
RM 3000 - RM 3999 50 53,458 7.6 5.5 10.5
RM 4000 - RM 4999 38 44,509 7.9 5.2 11.9
RM 5000 - RM 5999 38 44,458 11.5 7.5 17.3
RM 6000 - RM 6999 21 28,294 12.4 7.7 19.5
RM 7000 - RM 7999 13 14,267 6.8 3.8 11.9
RM 8000 - RM 8999 13 16,249 12.7 7.1 21.6
RM 9000 - RM 9999 1 1,200 3.0 0.4 17.7
RM 10000 & above 23 28,412 9.2 5.6 14.6
Quintile Household Income Group
Quintile 1 55 48,061 11.5 8.2 15.9
Quintile 2 100 104,960 10.5 8.1 13.5
Quintile 3 101 109,879 9.7 7.5 12.4
Quintile 4 85 96,489 7.9 5.8 10.8
Quintile 5 102 122,270 10.1 8.0 12.7

NATIONAL HEALTH AND MORBIDITY SURVEY 2015 MINISTRY OF HEALTH MALAYSIA
127
Non-Communicable Diseases, Risk Factors & Other Health Problems Volume II
Table 3.1.16: Current smokers who advised to quit smoking by a healthcare provider in the past 12
months by socio-demographic characteristics
ociodemographic Characteristics
Count Estimated Population
Prevalence (%)
95% CI
Lower Upper
MALAYSIA 346 363,105 75.4 68.6 81.1
State
Johor 37 44,721 71.2 55.5 83.0
Kedah 18 18,501 67.0 39.0 86.6
Kelantan 53 40,605 79.1 65.5 88.3
Melaka 20 11,151 69.4 44.3 86.6
Negeri Sembilan 18 7,587 89.5 69.1 97.0
Pahang 14 12,569 84.8 59.0 95.6
Penang 28 20,157 56.5 24.0 84.2
Perak 21 24,694 88.4 60.3 97.5
Perlis 9 899 70.3 31.9 92.3
Selangor 44 67,986 85.5 65.1 94.9
Terengganu 16 11,391 92.9 58.8 99.2
Sabah & WP Labuan 39 66,419 74.1 54.9 87.1
Sarawak 18 25,660 67.6 38.7 87.4
WP Kuala Lumpur 6 10,232 66.0 32.3 88.8
WP Putrajaya 5 533 67.5 28.6 91.5
Location
Urban 175 236,935 73.9 64.8 81.3
Rural 171 126,169 78.3 68.0 86.0
Sex
Male 334 349,395 76.1 69.2 81.9
Female 12 13,710 60.3 29.4 84.8
Age Group
18-19 8 9,180 90.2 50.5 98.8
20-24 19 26,671 59.1 36.9 78.2
25-29 24 38,307 61.9 44.1 77.0
30-34 37 61,038 72.8 54.5 85.7
35-39 34 42,976 72.8 53.2 86.3
40-44 29 29,197 74.9 55.3 87.8
45-49 40 36,008 83.9 68.1 92.7
50-54 47 44,414 87.5 73.3 94.7
55-59 46 37,673 85.9 62.0 95.8
60-64 24 14,713 85.6 59.6 96.0
65-69 20 14,133 89.3 65.2 97.4
70-74 8 2,662 61.3 24.6 88.5
75+ 10 6,134 79.1 42.8 95.1
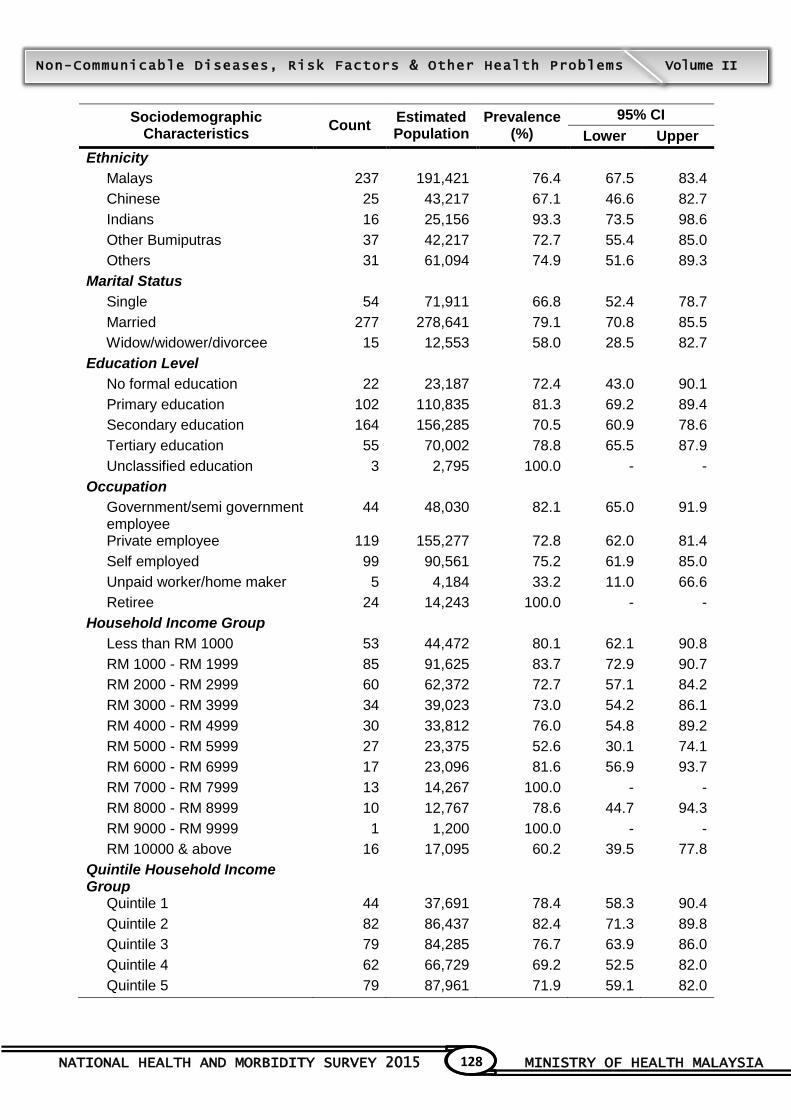
NATIONAL HEALTH AND MORBIDITY SURVEY 2015 MINISTRY OF HEALTH MALAYSIA
128
Non-Communicable Diseases, Risk Factors & Other Health Problems Volume II
Sociodemographic Characteristics
Count Estimated Population
Prevalence (%)
95% CI
Lower Upper
Ethnicity
Malays 237 191,421 76.4 67.5 83.4
Chinese 25 43,217 67.1 46.6 82.7
Indians 16 25,156 93.3 73.5 98.6
Other Bumiputras 37 42,217 72.7 55.4 85.0
Others 31 61,094 74.9 51.6 89.3
Marital Status
Single 54 71,911 66.8 52.4 78.7
Married 277 278,641 79.1 70.8 85.5
Widow/widower/divorcee 15 12,553 58.0 28.5 82.7
Education Level
No formal education 22 23,187 72.4 43.0 90.1
Primary education 102 110,835 81.3 69.2 89.4
Secondary education 164 156,285 70.5 60.9 78.6
Tertiary education 55 70,002 78.8 65.5 87.9
Unclassified education 3 2,795 100.0 - -
Occupation
Government/semi government employee
44 48,030 82.1 65.0 91.9
Private employee 119 155,277 72.8 62.0 81.4
Self employed 99 90,561 75.2 61.9 85.0
Unpaid worker/home maker 5 4,184 33.2 11.0 66.6
Retiree 24 14,243 100.0 - -
Household Income Group
Less than RM 1000 53 44,472 80.1 62.1 90.8
RM 1000 - RM 1999 85 91,625 83.7 72.9 90.7
RM 2000 - RM 2999 60 62,372 72.7 57.1 84.2
RM 3000 - RM 3999 34 39,023 73.0 54.2 86.1
RM 4000 - RM 4999 30 33,812 76.0 54.8 89.2
RM 5000 - RM 5999 27 23,375 52.6 30.1 74.1
RM 6000 - RM 6999 17 23,096 81.6 56.9 93.7
RM 7000 - RM 7999 13 14,267 100.0 - -
RM 8000 - RM 8999 10 12,767 78.6 44.7 94.3
RM 9000 - RM 9999 1 1,200 100.0 - -
RM 10000 & above 16 17,095 60.2 39.5 77.8
Quintile Household Income Group
Quintile 1 44 37,691 78.4 58.3 90.4
Quintile 2 82 86,437 82.4 71.3 89.8
Quintile 3 79 84,285 76.7 63.9 86.0
Quintile 4 62 66,729 69.2 52.5 82.0
Quintile 5 79 87,961 71.9 59.1 82.0
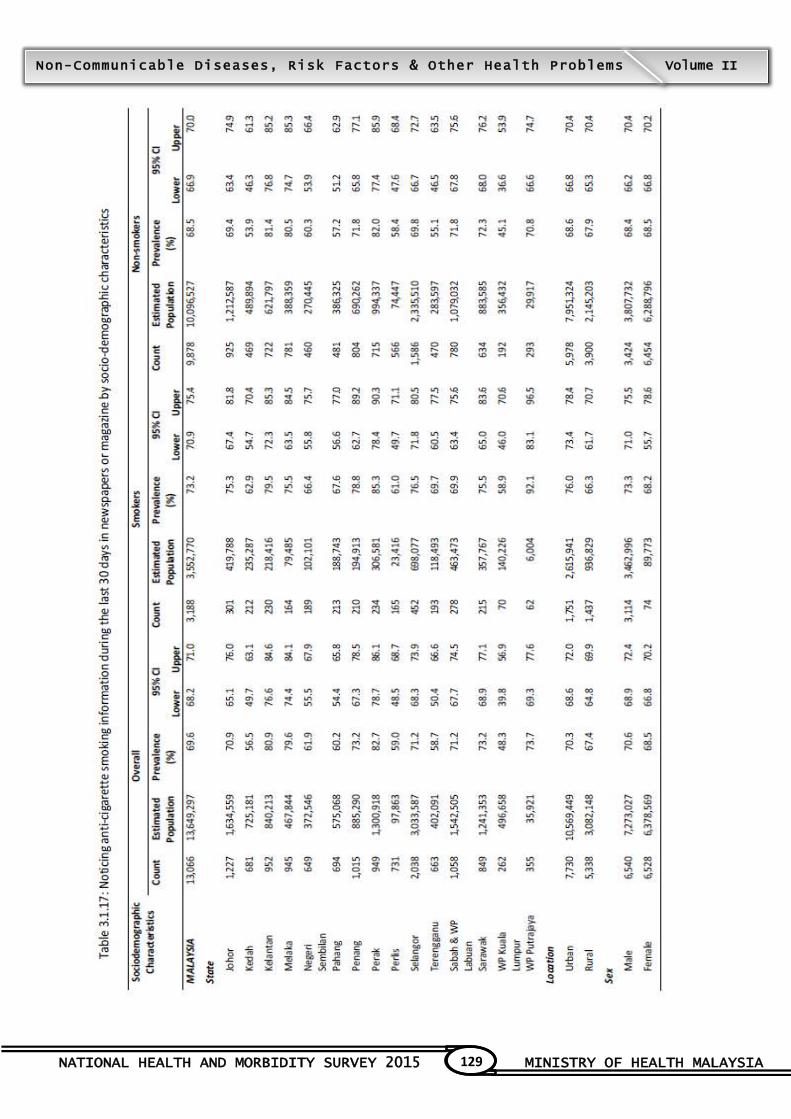
NATIONAL HEALTH AND MORBIDITY SURVEY 2015 MINISTRY OF HEALTH MALAYSIA
129
Non-Communicable Diseases, Risk Factors & Other Health Problems Volume II
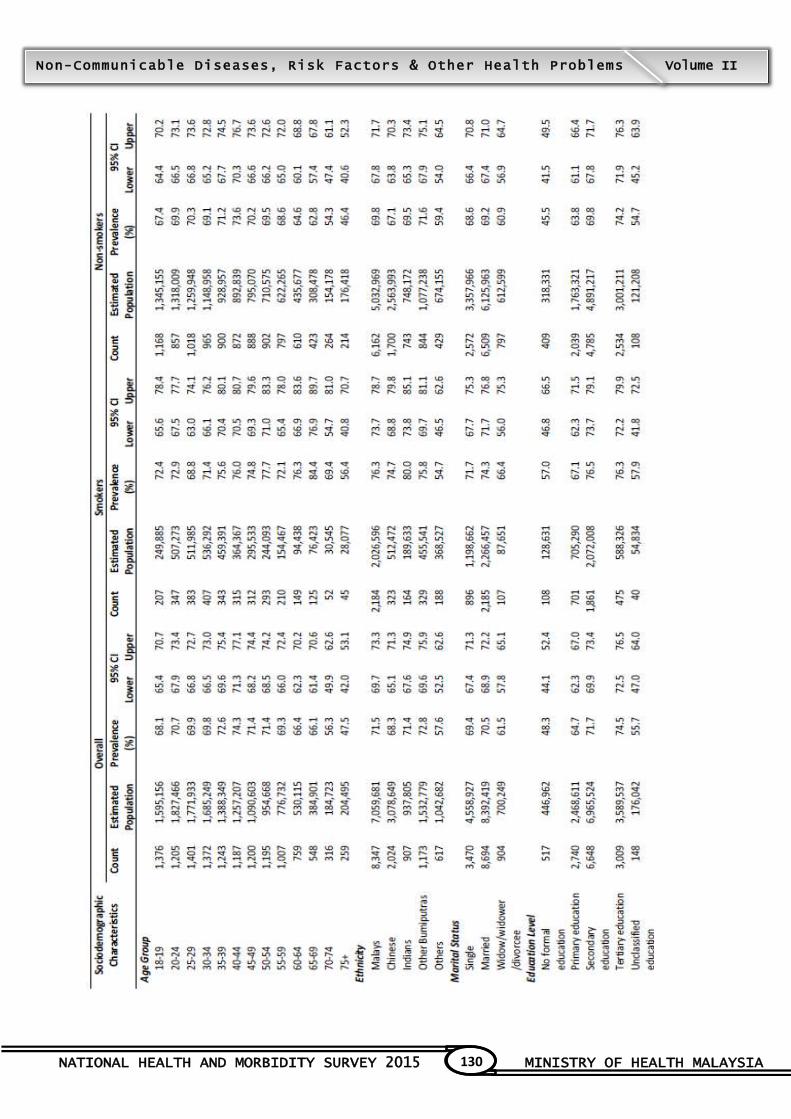
NATIONAL HEALTH AND MORBIDITY SURVEY 2015 MINISTRY OF HEALTH MALAYSIA
130
Non-Communicable Diseases, Risk Factors & Other Health Problems Volume II

NATIONAL HEALTH AND MORBIDITY SURVEY 2015 MINISTRY OF HEALTH MALAYSIA
131
Non-Communicable Diseases, Risk Factors & Other Health Problems Volume II
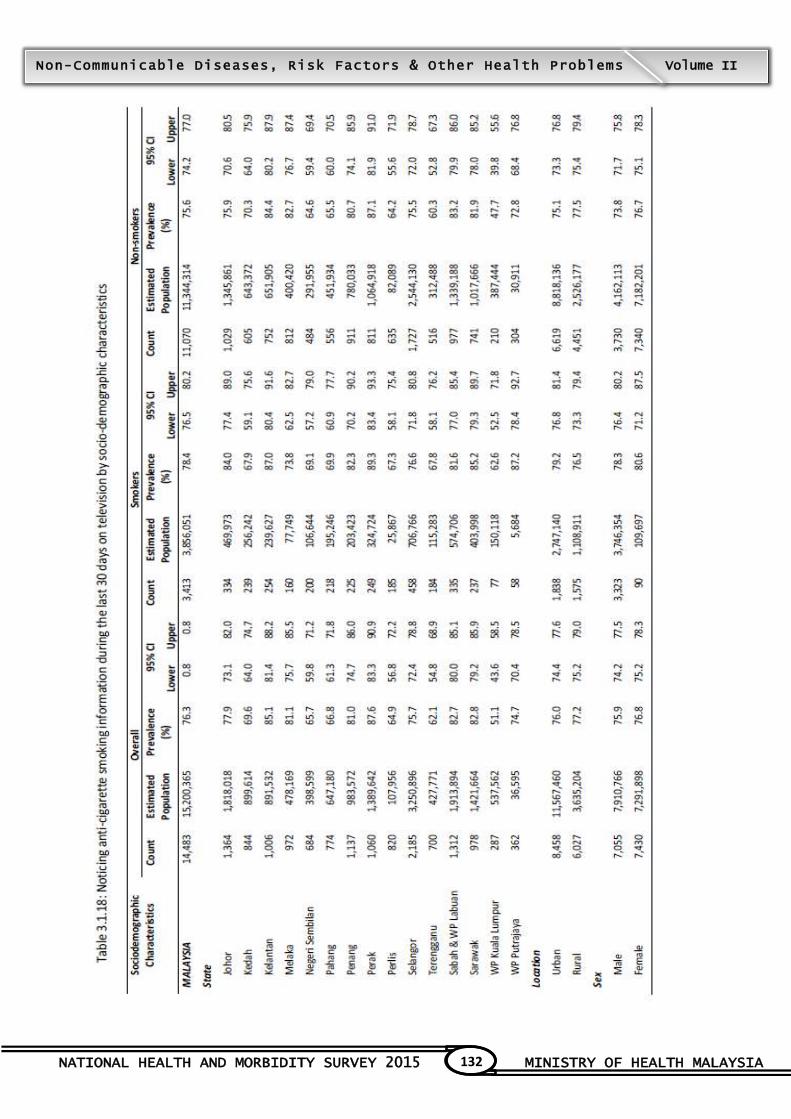
NATIONAL HEALTH AND MORBIDITY SURVEY 2015 MINISTRY OF HEALTH MALAYSIA
132
Non-Communicable Diseases, Risk Factors & Other Health Problems Volume II
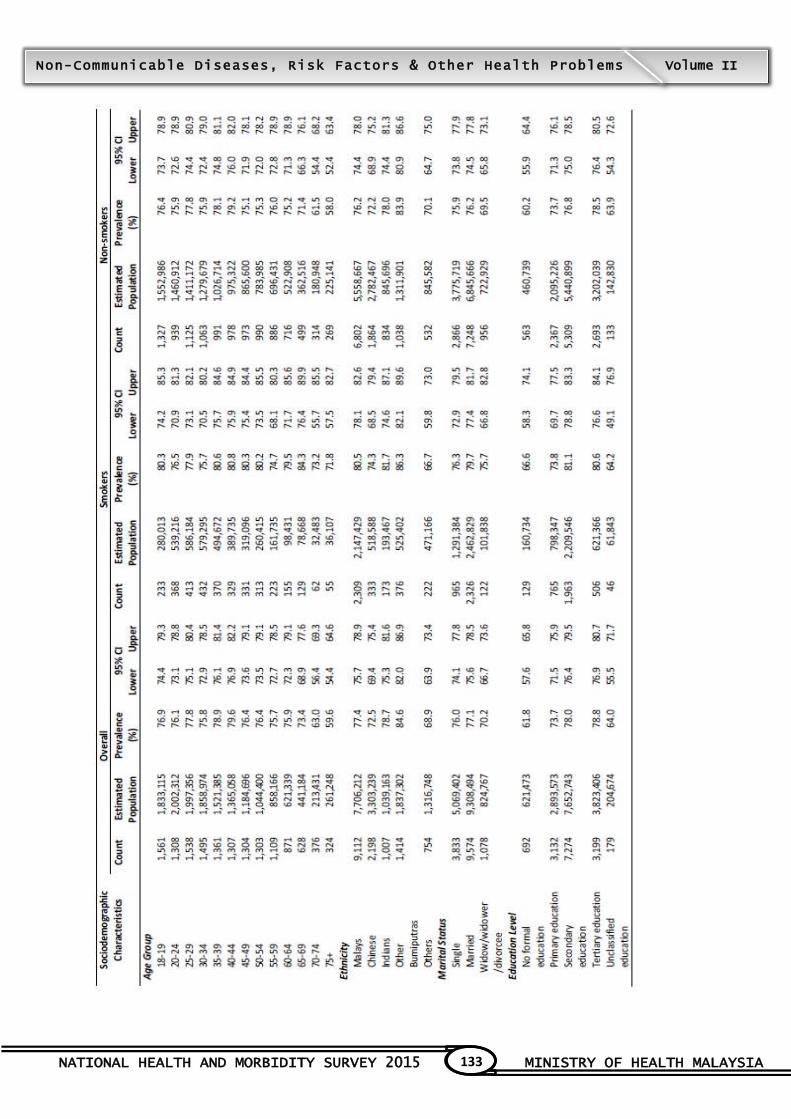
NATIONAL HEALTH AND MORBIDITY SURVEY 2015 MINISTRY OF HEALTH MALAYSIA
133
Non-Communicable Diseases, Risk Factors & Other Health Problems Volume II
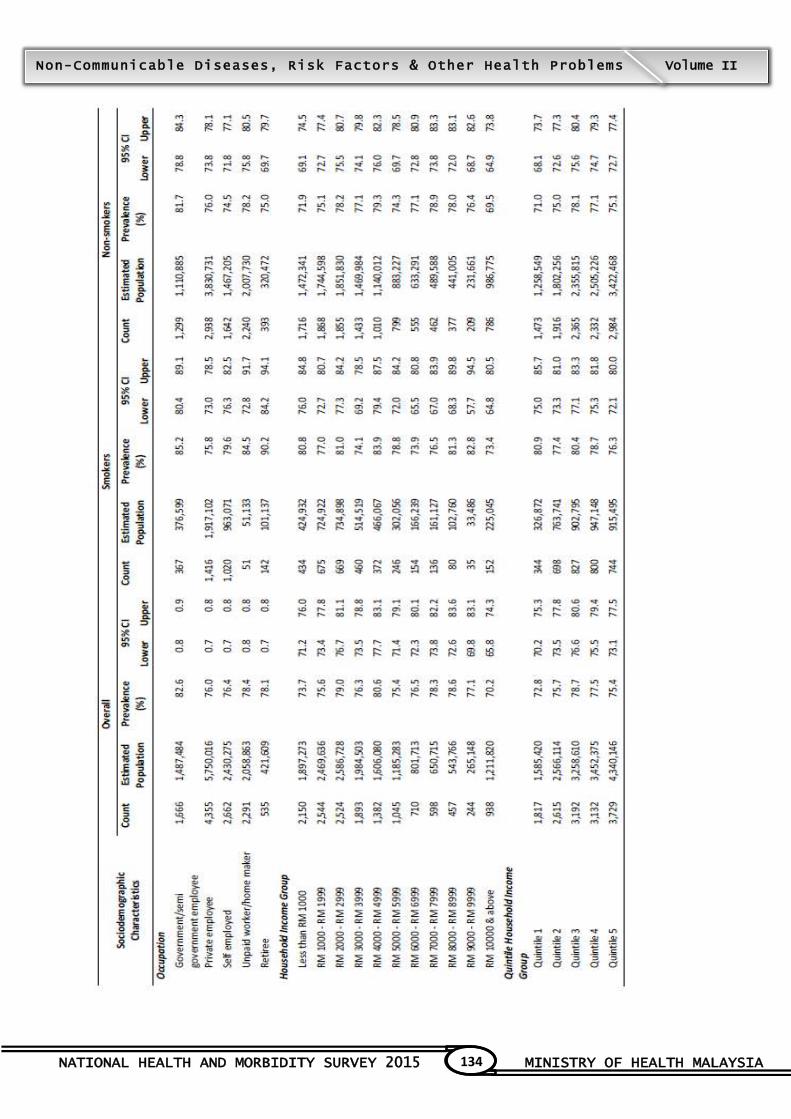
NATIONAL HEALTH AND MORBIDITY SURVEY 2015 MINISTRY OF HEALTH MALAYSIA
134
Non-Communicable Diseases, Risk Factors & Other Health Problems Volume II

NATIONAL HEALTH AND MORBIDITY SURVEY 2015 MINISTRY OF HEALTH MALAYSIA
135
Non-Communicable Diseases, Risk Factors & Other Health Problems Volume II
Table 3.1.19: Current smokers who noticed health warning on cigarette package during the last 30
days by socio-demographic characteristics
Sociodemographic Characteristics
Count Estimated Population
Prevalence (%)
95% CI
Lower Upper
MALAYSIA 3,734 4,269,838 86.0 84.3 87.5
State
Johor 354 502,650 88.6 83.3 92.3
Kedah 226 251,662 65.6 56.3 73.9
Kelantan 265 249,792 90.5 84.6 94.2
Melaka 194 97,718 92.8 85.5 96.6
Negeri Sembilan 234 127,614 82.7 71.8 90.0
Pahang 259 238,114 84.8 78.6 89.5
Penang 230 217,512 88.0 82.3 92.0
Perak 242 320,341 87.0 80.0 91.8
Perlis 205 29,428 76.3 70.9 80.9
Selangor 503 797,277 86.1 82.5 89.1
Terengganu 229 140,309 82.5 74.6 88.3
Sabah & WP Labuan 366 636,712 88.4 82.3 92.5
Sarawak 258 439,641 92.2 87.9 95.1
WP Kuala Lumpur 111 215,361 87.7 79.1 93.1
WP Putrajaya 58 5,707 87.5 71.4 95.2
Location
Urban 2,035 3,047,971 87.2 85.3 88.9
Rural 1,699 1,221,867 83.1 79.8 85.9
Sex
Male 3,641 4,151,047 86.0 84.4 87.5
Female 93 118,791 84.9 75.7 91.0
Age Group
18-19 252 307,865 88.3 82.7 92.3
20-24 429 619,562 87.2 82.5 90.7
25-29 471 666,916 86.5 82.6 89.7
30-34 483 663,511 86.3 82.0 89.7
35-39 414 543,693 88.1 84.2 91.2
40-44 361 418,969 86.7 82.4 90.0
45-49 357 339,867 85.2 80.5 88.9
50-54 328 278,944 84.3 78.1 89.0
55-59 243 185,545 84.5 78.9 88.8
60-64 161 98,789 76.1 67.0 83.4
65-69 132 79,347 86.8 79.7 91.7
70-74 57 34,332 76.5 64.3 85.4
75+ 46 32,498 62.5 47.4 75.6
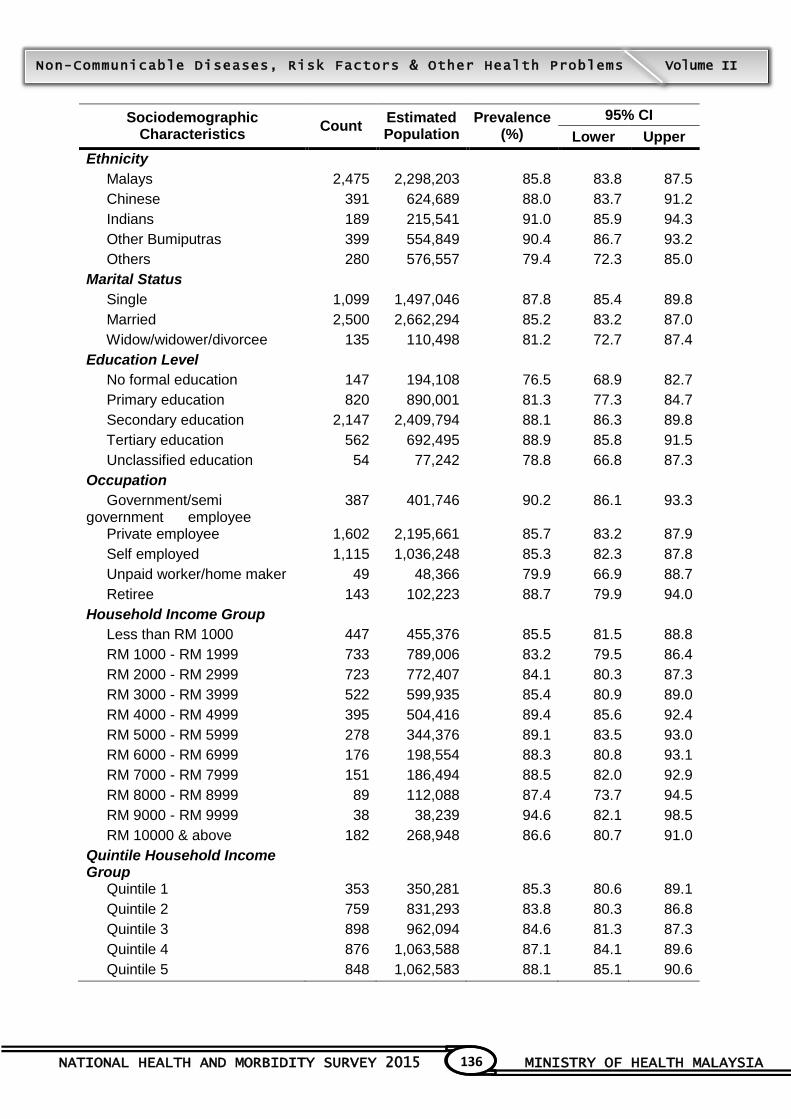
NATIONAL HEALTH AND MORBIDITY SURVEY 2015 MINISTRY OF HEALTH MALAYSIA
136
Non-Communicable Diseases, Risk Factors & Other Health Problems Volume II
Sociodemographic Characteristics
Count Estimated Population
Prevalence (%)
95% CI
Lower Upper
Ethnicity
Malays 2,475 2,298,203 85.8 83.8 87.5
Chinese 391 624,689 88.0 83.7 91.2
Indians 189 215,541 91.0 85.9 94.3
Other Bumiputras 399 554,849 90.4 86.7 93.2
Others 280 576,557 79.4 72.3 85.0
Marital Status
Single 1,099 1,497,046 87.8 85.4 89.8
Married 2,500 2,662,294 85.2 83.2 87.0
Widow/widower/divorcee 135 110,498 81.2 72.7 87.4
Education Level
No formal education 147 194,108 76.5 68.9 82.7
Primary education 820 890,001 81.3 77.3 84.7
Secondary education 2,147 2,409,794 88.1 86.3 89.8
Tertiary education 562 692,495 88.9 85.8 91.5
Unclassified education 54 77,242 78.8 66.8 87.3
Occupation
Government/semi government employee
387 401,746 90.2 86.1 93.3
Private employee 1,602 2,195,661 85.7 83.2 87.9
Self employed 1,115 1,036,248 85.3 82.3 87.8
Unpaid worker/home maker 49 48,366 79.9 66.9 88.7
Retiree 143 102,223 88.7 79.9 94.0
Household Income Group
Less than RM 1000 447 455,376 85.5 81.5 88.8
RM 1000 - RM 1999 733 789,006 83.2 79.5 86.4
RM 2000 - RM 2999 723 772,407 84.1 80.3 87.3
RM 3000 - RM 3999 522 599,935 85.4 80.9 89.0
RM 4000 - RM 4999 395 504,416 89.4 85.6 92.4
RM 5000 - RM 5999 278 344,376 89.1 83.5 93.0
RM 6000 - RM 6999 176 198,554 88.3 80.8 93.1
RM 7000 - RM 7999 151 186,494 88.5 82.0 92.9
RM 8000 - RM 8999 89 112,088 87.4 73.7 94.5
RM 9000 - RM 9999 38 38,239 94.6 82.1 98.5
RM 10000 & above 182 268,948 86.6 80.7 91.0
Quintile Household Income Group
Quintile 1 353 350,281 85.3 80.6 89.1
Quintile 2 759 831,293 83.8 80.3 86.8
Quintile 3 898 962,094 84.6 81.3 87.3
Quintile 4 876 1,063,588 87.1 84.1 89.6
Quintile 5 848 1,062,583 88.1 85.1 90.6

NATIONAL HEALTH AND MORBIDITY SURVEY 2015 MINISTRY OF HEALTH MALAYSIA
137
Non-Communicable Diseases, Risk Factors & Other Health Problems Volume II
Table 3.1.20: Current smokers who considered quitting because of the warnings during the last 30
days by socio-demographic characteristics
Sociodemographic Characteristics
Count Estimated Population
Prevalence (%)
95% CI
Lower Upper
MALAYSIA 2,118 2,539,209 59.5 57.1 61.9
State
Johor 207 291,268 57.9 49.8 65.7
Kedah 116 120,949 48.1 40.1 56.2
Kelantan 182 175,551 70.3 62.4 77.1
Melaka 112 54,301 55.6 45.5 65.3
Negeri Sembilan 81 41,842 32.8 25.4 41.2
Pahang 168 148,377 62.3 54.7 69.4
Penang 130 113,556 52.2 40.9 63.3
Perak 109 171,575 53.6 44.3 62.8
Perlis 75 10,006 34.0 25.1 44.2
Selangor 316 494,452 62.0 56.2 67.5
Terengganu 115 70,177 50.0 40.5 59.6
Sabah & WP Labuan 254 439,206 69.1 62.2 75.2
Sarawak 154 282,233 64.2 55.2 72.3
WP Kuala Lumpur 59 121,883 56.6 44.9 67.6
WP Putrajaya 40 3,832 67.1 50.3 80.5
Location
Urban 1,128 1,754,199 57.6 54.5 60.5
Rural 990 785,010 64.3 60.6 67.9
Sex
Male 2,063 2,465,074 59.4 56.9 61.8
Female 55 74,134 62.4 50.0 73.4
Age Group
18-19 159 199,146 64.7 57.2 71.5
20-24 237 377,279 60.9 55.2 66.3
25-29 261 383,906 57.6 52.1 62.9
30-34 287 418,759 63.1 57.0 68.9
35-39 245 332,141 61.2 55.4 66.7
40-44 193 228,392 54.5 48.0 60.9
45-49 188 186,121 54.8 48.4 60.9
50-54 186 161,454 57.9 50.9 64.6
55-59 139 109,959 59.4 51.4 67.0
60-64 100 64,198 65.1 55.4 73.7
65-69 75 47,450 59.8 48.1 70.5
70-74 29 18,305 53.3 34.5 71.2
75+ 19 12,099 37.2 20.9 57.1
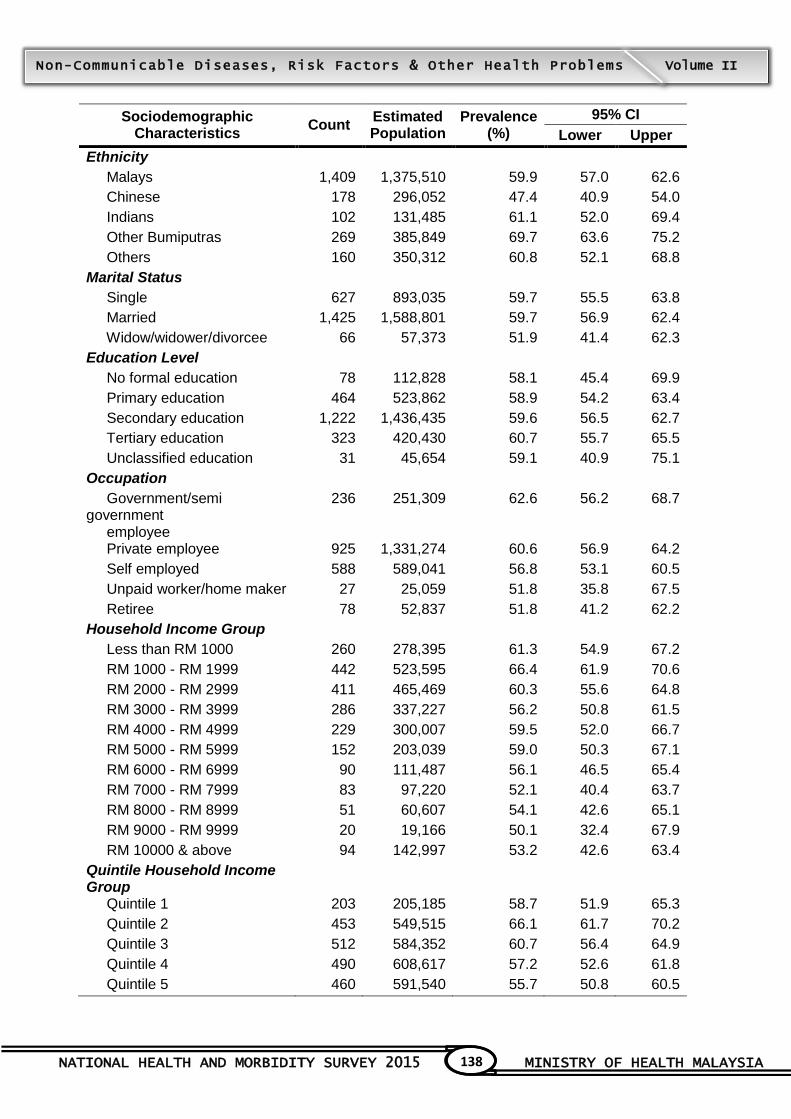
NATIONAL HEALTH AND MORBIDITY SURVEY 2015 MINISTRY OF HEALTH MALAYSIA
138
Non-Communicable Diseases, Risk Factors & Other Health Problems Volume II
Sociodemographic Characteristics
Count Estimated Population
Prevalence (%)
95% CI
Lower Upper
Ethnicity
Malays 1,409 1,375,510 59.9 57.0 62.6
Chinese 178 296,052 47.4 40.9 54.0
Indians 102 131,485 61.1 52.0 69.4
Other Bumiputras 269 385,849 69.7 63.6 75.2
Others 160 350,312 60.8 52.1 68.8
Marital Status
Single 627 893,035 59.7 55.5 63.8
Married 1,425 1,588,801 59.7 56.9 62.4
Widow/widower/divorcee 66 57,373 51.9 41.4 62.3
Education Level
No formal education 78 112,828 58.1 45.4 69.9
Primary education 464 523,862 58.9 54.2 63.4
Secondary education 1,222 1,436,435 59.6 56.5 62.7
Tertiary education 323 420,430 60.7 55.7 65.5
Unclassified education 31 45,654 59.1 40.9 75.1
Occupation
Government/semi government employee
236 251,309 62.6 56.2 68.7
Private employee 925 1,331,274 60.6 56.9 64.2
Self employed 588 589,041 56.8 53.1 60.5
Unpaid worker/home maker 27 25,059 51.8 35.8 67.5
Retiree 78 52,837 51.8 41.2 62.2
Household Income Group
Less than RM 1000 260 278,395 61.3 54.9 67.2
RM 1000 - RM 1999 442 523,595 66.4 61.9 70.6
RM 2000 - RM 2999 411 465,469 60.3 55.6 64.8
RM 3000 - RM 3999 286 337,227 56.2 50.8 61.5
RM 4000 - RM 4999 229 300,007 59.5 52.0 66.7
RM 5000 - RM 5999 152 203,039 59.0 50.3 67.1
RM 6000 - RM 6999 90 111,487 56.1 46.5 65.4
RM 7000 - RM 7999 83 97,220 52.1 40.4 63.7
RM 8000 - RM 8999 51 60,607 54.1 42.6 65.1
RM 9000 - RM 9999 20 19,166 50.1 32.4 67.9
RM 10000 & above 94 142,997 53.2 42.6 63.4
Quintile Household Income Group
Quintile 1 203 205,185 58.7 51.9 65.3
Quintile 2 453 549,515 66.1 61.7 70.2
Quintile 3 512 584,352 60.7 56.4 64.9
Quintile 4 490 608,617 57.2 52.6 61.8
Quintile 5 460 591,540 55.7 50.8 60.5
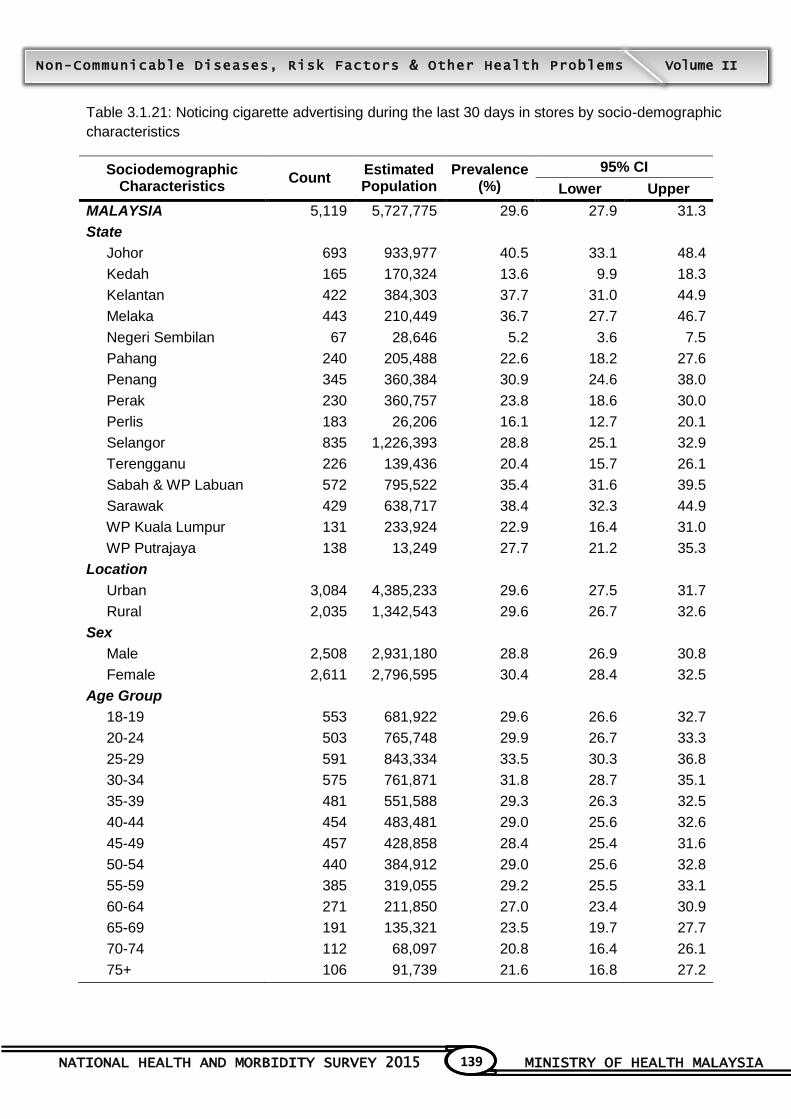
NATIONAL HEALTH AND MORBIDITY SURVEY 2015 MINISTRY OF HEALTH MALAYSIA
139
Non-Communicable Diseases, Risk Factors & Other Health Problems Volume II
Table 3.1.21: Noticing cigarette advertising during the last 30 days in stores by socio-demographic
characteristics
Sociodemographic Characteristics
Count Estimated Population
Prevalence (%)
95% CI
Lower Upper
MALAYSIA 5,119 5,727,775 29.6 27.9 31.3
State
Johor 693 933,977 40.5 33.1 48.4
Kedah 165 170,324 13.6 9.9 18.3
Kelantan 422 384,303 37.7 31.0 44.9
Melaka 443 210,449 36.7 27.7 46.7
Negeri Sembilan 67 28,646 5.2 3.6 7.5
Pahang 240 205,488 22.6 18.2 27.6
Penang 345 360,384 30.9 24.6 38.0
Perak 230 360,757 23.8 18.6 30.0
Perlis 183 26,206 16.1 12.7 20.1
Selangor 835 1,226,393 28.8 25.1 32.9
Terengganu 226 139,436 20.4 15.7 26.1
Sabah & WP Labuan 572 795,522 35.4 31.6 39.5
Sarawak 429 638,717 38.4 32.3 44.9
WP Kuala Lumpur 131 233,924 22.9 16.4 31.0
WP Putrajaya 138 13,249 27.7 21.2 35.3
Location
Urban 3,084 4,385,233 29.6 27.5 31.7
Rural 2,035 1,342,543 29.6 26.7 32.6
Sex
Male 2,508 2,931,180 28.8 26.9 30.8
Female 2,611 2,796,595 30.4 28.4 32.5
Age Group
18-19 553 681,922 29.6 26.6 32.7
20-24 503 765,748 29.9 26.7 33.3
25-29 591 843,334 33.5 30.3 36.8
30-34 575 761,871 31.8 28.7 35.1
35-39 481 551,588 29.3 26.3 32.5
40-44 454 483,481 29.0 25.6 32.6
45-49 457 428,858 28.4 25.4 31.6
50-54 440 384,912 29.0 25.6 32.8
55-59 385 319,055 29.2 25.5 33.1
60-64 271 211,850 27.0 23.4 30.9
65-69 191 135,321 23.5 19.7 27.7
70-74 112 68,097 20.8 16.4 26.1
75+ 106 91,739 21.6 16.8 27.2
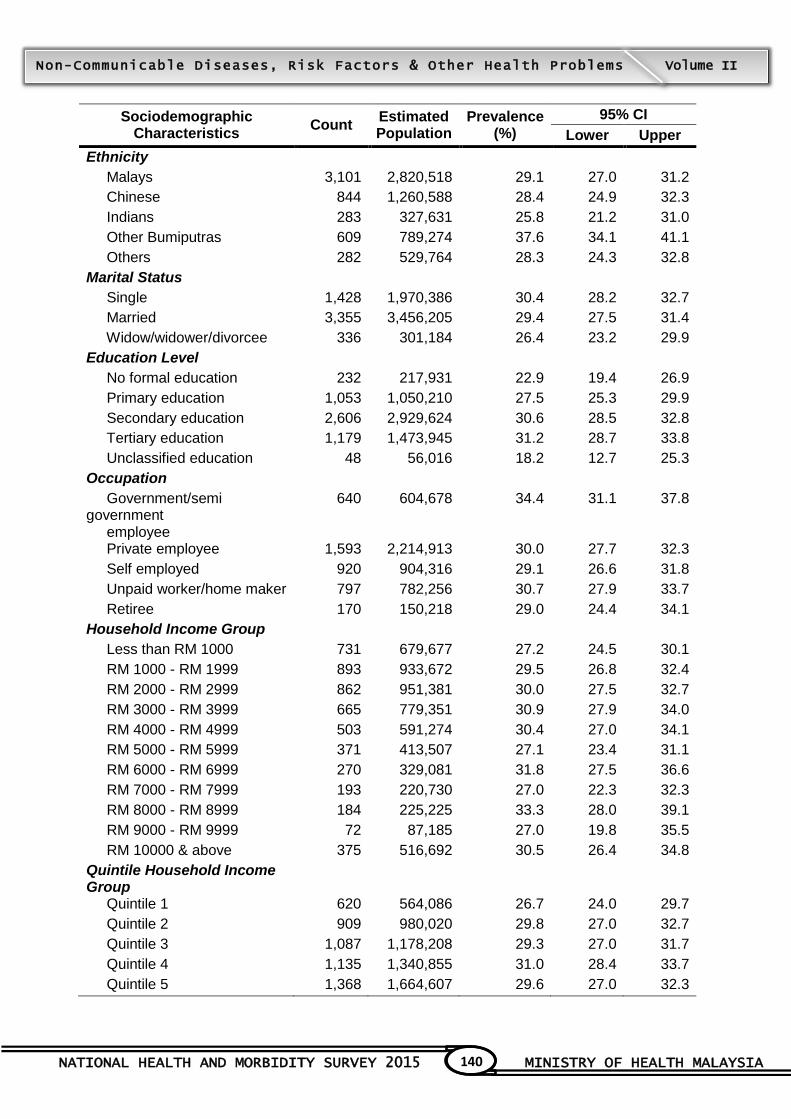
NATIONAL HEALTH AND MORBIDITY SURVEY 2015 MINISTRY OF HEALTH MALAYSIA
140
Non-Communicable Diseases, Risk Factors & Other Health Problems Volume II
Sociodemographic Characteristics
Count Estimated Population
Prevalence (%)
95% CI
Lower Upper
Ethnicity
Malays 3,101 2,820,518 29.1 27.0 31.2
Chinese 844 1,260,588 28.4 24.9 32.3
Indians 283 327,631 25.8 21.2 31.0
Other Bumiputras 609 789,274 37.6 34.1 41.1
Others 282 529,764 28.3 24.3 32.8
Marital Status
Single 1,428 1,970,386 30.4 28.2 32.7
Married 3,355 3,456,205 29.4 27.5 31.4
Widow/widower/divorcee 336 301,184 26.4 23.2 29.9
Education Level
No formal education 232 217,931 22.9 19.4 26.9
Primary education 1,053 1,050,210 27.5 25.3 29.9
Secondary education 2,606 2,929,624 30.6 28.5 32.8
Tertiary education 1,179 1,473,945 31.2 28.7 33.8
Unclassified education 48 56,016 18.2 12.7 25.3
Occupation
Government/semi government employee
640 604,678 34.4 31.1 37.8
Private employee 1,593 2,214,913 30.0 27.7 32.3
Self employed 920 904,316 29.1 26.6 31.8
Unpaid worker/home maker 797 782,256 30.7 27.9 33.7
Retiree 170 150,218 29.0 24.4 34.1
Household Income Group
Less than RM 1000 731 679,677 27.2 24.5 30.1
RM 1000 - RM 1999 893 933,672 29.5 26.8 32.4
RM 2000 - RM 2999 862 951,381 30.0 27.5 32.7
RM 3000 - RM 3999 665 779,351 30.9 27.9 34.0
RM 4000 - RM 4999 503 591,274 30.4 27.0 34.1
RM 5000 - RM 5999 371 413,507 27.1 23.4 31.1
RM 6000 - RM 6999 270 329,081 31.8 27.5 36.6
RM 7000 - RM 7999 193 220,730 27.0 22.3 32.3
RM 8000 - RM 8999 184 225,225 33.3 28.0 39.1
RM 9000 - RM 9999 72 87,185 27.0 19.8 35.5
RM 10000 & above 375 516,692 30.5 26.4 34.8
Quintile Household Income Group
Quintile 1 620 564,086 26.7 24.0 29.7
Quintile 2 909 980,020 29.8 27.0 32.7
Quintile 3 1,087 1,178,208 29.3 27.0 31.7
Quintile 4 1,135 1,340,855 31.0 28.4 33.7
Quintile 5 1,368 1,664,607 29.6 27.0 32.3
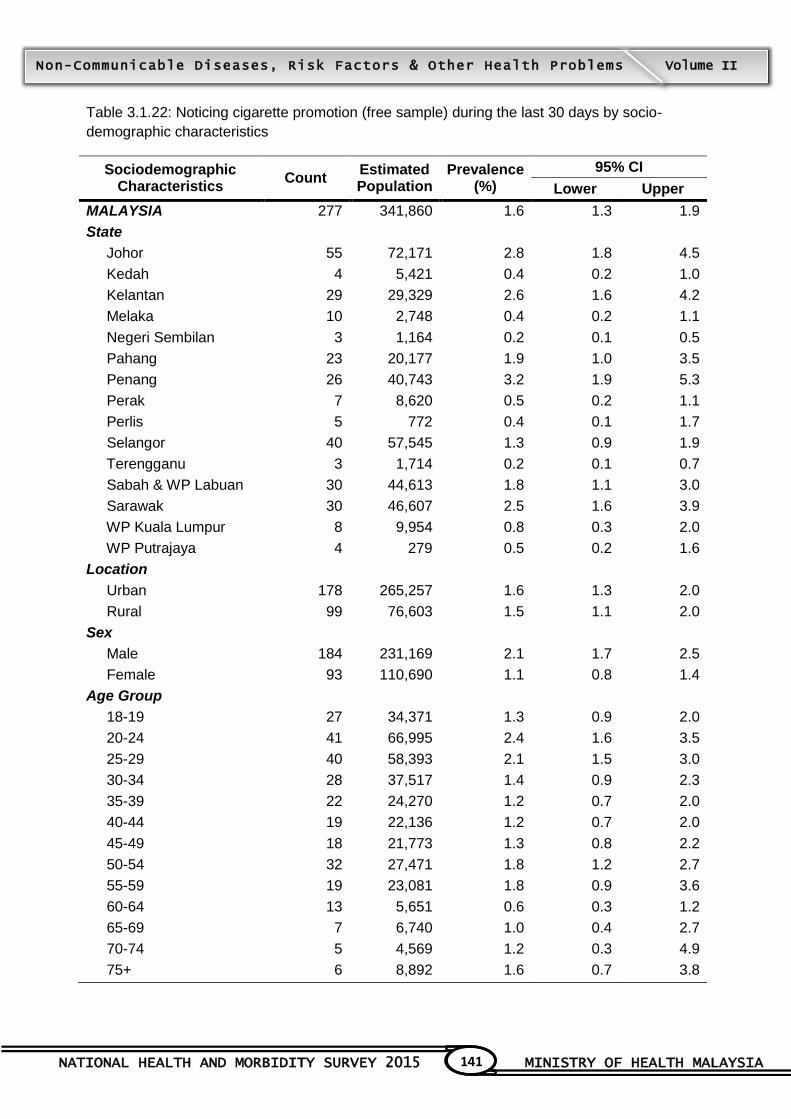
NATIONAL HEALTH AND MORBIDITY SURVEY 2015 MINISTRY OF HEALTH MALAYSIA
141
Non-Communicable Diseases, Risk Factors & Other Health Problems Volume II
Table 3.1.22: Noticing cigarette promotion (free sample) during the last 30 days by socio-
demographic characteristics
Sociodemographic Characteristics
Count Estimated Population
Prevalence (%)
95% CI
Lower Upper
MALAYSIA 277 341,860 1.6 1.3 1.9
State
Johor 55 72,171 2.8 1.8 4.5
Kedah 4 5,421 0.4 0.2 1.0
Kelantan 29 29,329 2.6 1.6 4.2
Melaka 10 2,748 0.4 0.2 1.1
Negeri Sembilan 3 1,164 0.2 0.1 0.5
Pahang 23 20,177 1.9 1.0 3.5
Penang 26 40,743 3.2 1.9 5.3
Perak 7 8,620 0.5 0.2 1.1
Perlis 5 772 0.4 0.1 1.7
Selangor 40 57,545 1.3 0.9 1.9
Terengganu 3 1,714 0.2 0.1 0.7
Sabah & WP Labuan 30 44,613 1.8 1.1 3.0
Sarawak 30 46,607 2.5 1.6 3.9
WP Kuala Lumpur 8 9,954 0.8 0.3 2.0
WP Putrajaya 4 279 0.5 0.2 1.6
Location
Urban 178 265,257 1.6 1.3 2.0
Rural 99 76,603 1.5 1.1 2.0
Sex
Male 184 231,169 2.1 1.7 2.5
Female 93 110,690 1.1 0.8 1.4
Age Group
18-19 27 34,371 1.3 0.9 2.0
20-24 41 66,995 2.4 1.6 3.5
25-29 40 58,393 2.1 1.5 3.0
30-34 28 37,517 1.4 0.9 2.3
35-39 22 24,270 1.2 0.7 2.0
40-44 19 22,136 1.2 0.7 2.0
45-49 18 21,773 1.3 0.8 2.2
50-54 32 27,471 1.8 1.2 2.7
55-59 19 23,081 1.8 0.9 3.6
60-64 13 5,651 0.6 0.3 1.2
65-69 7 6,740 1.0 0.4 2.7
70-74 5 4,569 1.2 0.3 4.9
75+ 6 8,892 1.6 0.7 3.8
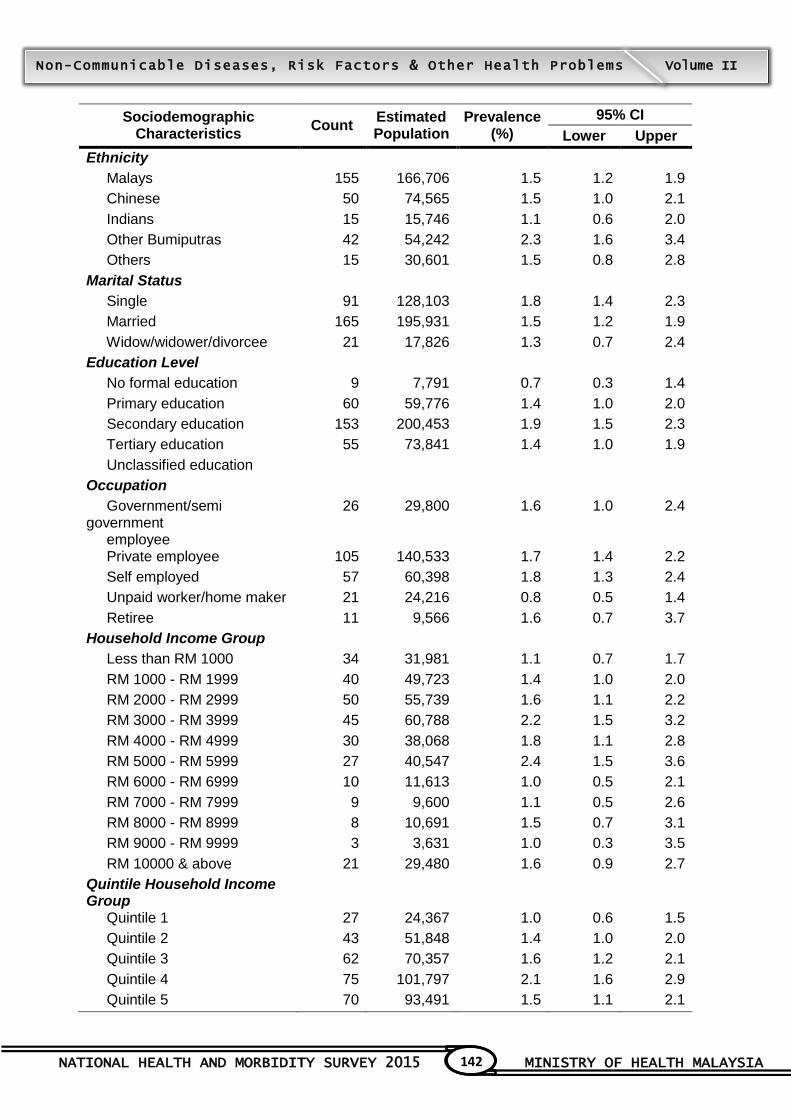
NATIONAL HEALTH AND MORBIDITY SURVEY 2015 MINISTRY OF HEALTH MALAYSIA
142
Non-Communicable Diseases, Risk Factors & Other Health Problems Volume II
Sociodemographic Characteristics
Count Estimated Population
Prevalence (%)
95% CI
Lower Upper
Ethnicity
Malays 155 166,706 1.5 1.2 1.9
Chinese 50 74,565 1.5 1.0 2.1
Indians 15 15,746 1.1 0.6 2.0
Other Bumiputras 42 54,242 2.3 1.6 3.4
Others 15 30,601 1.5 0.8 2.8
Marital Status
Single 91 128,103 1.8 1.4 2.3
Married 165 195,931 1.5 1.2 1.9
Widow/widower/divorcee 21 17,826 1.3 0.7 2.4
Education Level
No formal education 9 7,791 0.7 0.3 1.4
Primary education 60 59,776 1.4 1.0 2.0
Secondary education 153 200,453 1.9 1.5 2.3
Tertiary education 55 73,841 1.4 1.0 1.9
Unclassified education
Occupation
Government/semi government employee
26 29,800 1.6 1.0 2.4
Private employee 105 140,533 1.7 1.4 2.2
Self employed 57 60,398 1.8 1.3 2.4
Unpaid worker/home maker 21 24,216 0.8 0.5 1.4
Retiree 11 9,566 1.6 0.7 3.7
Household Income Group
Less than RM 1000 34 31,981 1.1 0.7 1.7
RM 1000 - RM 1999 40 49,723 1.4 1.0 2.0
RM 2000 - RM 2999 50 55,739 1.6 1.1 2.2
RM 3000 - RM 3999 45 60,788 2.2 1.5 3.2
RM 4000 - RM 4999 30 38,068 1.8 1.1 2.8
RM 5000 - RM 5999 27 40,547 2.4 1.5 3.6
RM 6000 - RM 6999 10 11,613 1.0 0.5 2.1
RM 7000 - RM 7999 9 9,600 1.1 0.5 2.6
RM 8000 - RM 8999 8 10,691 1.5 0.7 3.1
RM 9000 - RM 9999 3 3,631 1.0 0.3 3.5
RM 10000 & above 21 29,480 1.6 0.9 2.7
Quintile Household Income Group
Quintile 1 27 24,367 1.0 0.6 1.5
Quintile 2 43 51,848 1.4 1.0 2.0
Quintile 3 62 70,357 1.6 1.2 2.1
Quintile 4 75 101,797 2.1 1.6 2.9
Quintile 5 70 93,491 1.5 1.1 2.1

NATIONAL HEALTH AND MORBIDITY SURVEY 2015 MINISTRY OF HEALTH MALAYSIA
143
Non-Communicable Diseases, Risk Factors & Other Health Problems Volume II
Table 3.1.23: Noticing cigarette promotion (cigarette at sales prices) during the last 30 days by
socio-demographic characteristics
Sociodemographic Characteristics
Count Estimated Population
Prevalence (%)
95% CI
Lower Upper
MALAYSIA 232 299,205 1.4 1.2 1.6
State
Johor 49 64,136 2.5 1.7 3.8
Kedah 7 7,137 0.5 0.2 1.2
Kelantan 14 12,617 1.1 0.6 2.0
Melaka 8 1,946 0.3 0.1 1.0
Negeri Sembilan 7 4,396 0.6 0.2 1.6
Pahang 3 1,720 0.2 0.1 0.5
Penang 14 20,423 1.6 0.8 3.0
Perak 8 7,834 0.4 0.2 1.0
Perlis 5 822 0.5 0.1 1.7
Selangor 33 49,127 1.1 0.8 1.7
Terengganu 2 1,853 0.2 0.1 1.0
Sabah & WP Labuan 36 61,601 2.5 1.6 3.7
Sarawak 32 49,484 2.7 1.8 4.0
WP Kuala Lumpur 10 15,751 1.2 0.5 3.0
WP Putrajaya 4 360 0.7 0.2 2.0
Location
Urban 132 206,357 1.3 1.0 1.6
Rural 100 92,848 1.8 1.3 2.4
Sex
Male 149 207,830 1.9 1.5 2.3
Female 83 91,375 0.9 0.7 1.1
Age Group
18-19 25 30,142 1.2 0.7 1.8
20-24 34 59,322 2.1 1.4 3.1
25-29 33 49,634 1.8 1.2 2.7
30-34 25 38,021 1.5 0.9 2.4
35-39 14 14,857 0.7 0.4 1.3
40-44 20 28,340 1.5 0.9 2.6
45-49 15 18,009 1.1 0.6 1.9
50-54 25 24,558 1.6 0.9 2.9
55-59 19 17,842 1.4 0.8 2.5
60-64 9 6,393 0.7 0.3 1.6
65-69 8 5,834 0.9 0.3 2.3
70-74 1 319 0.1 0.0 0.6
75+ 4 5,933 1.1 0.3 3.2
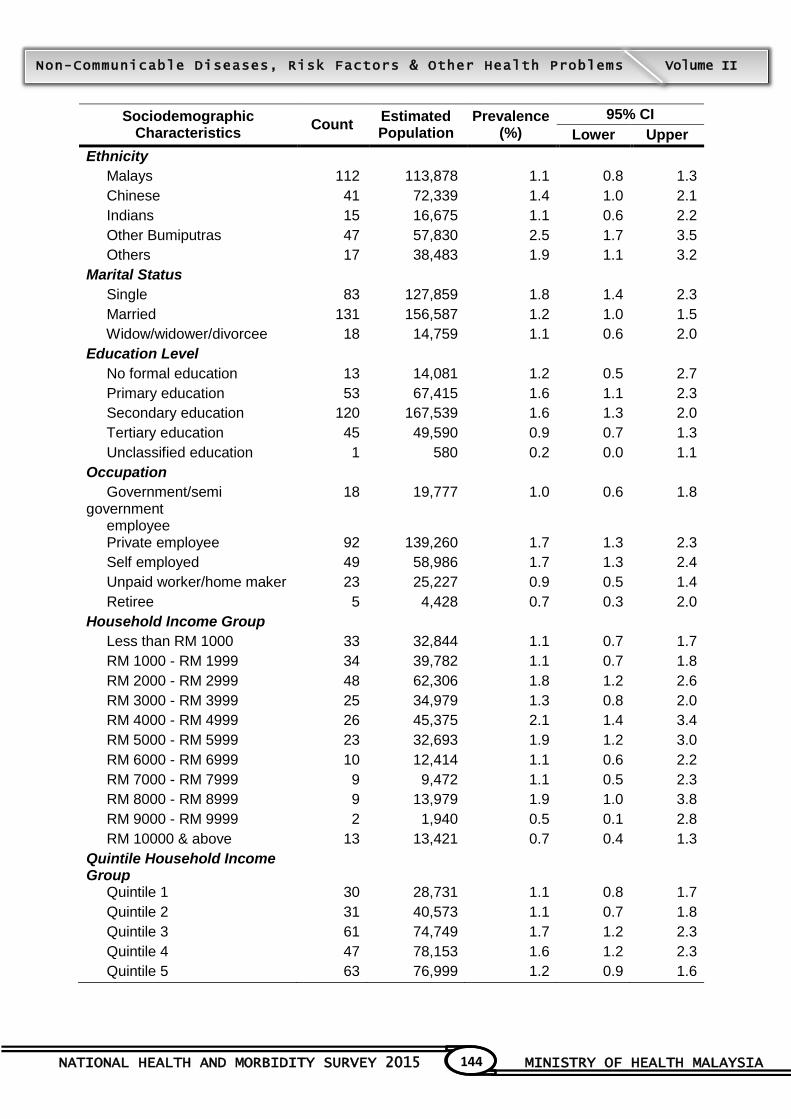
NATIONAL HEALTH AND MORBIDITY SURVEY 2015 MINISTRY OF HEALTH MALAYSIA
144
Non-Communicable Diseases, Risk Factors & Other Health Problems Volume II
Sociodemographic Characteristics
Count Estimated Population
Prevalence (%)
95% CI
Lower Upper
Ethnicity
Malays 112 113,878 1.1 0.8 1.3
Chinese 41 72,339 1.4 1.0 2.1
Indians 15 16,675 1.1 0.6 2.2
Other Bumiputras 47 57,830 2.5 1.7 3.5
Others 17 38,483 1.9 1.1 3.2
Marital Status
Single 83 127,859 1.8 1.4 2.3
Married 131 156,587 1.2 1.0 1.5
Widow/widower/divorcee 18 14,759 1.1 0.6 2.0
Education Level
No formal education 13 14,081 1.2 0.5 2.7
Primary education 53 67,415 1.6 1.1 2.3
Secondary education 120 167,539 1.6 1.3 2.0
Tertiary education 45 49,590 0.9 0.7 1.3
Unclassified education 1 580 0.2 0.0 1.1
Occupation
Government/semi government employee
18 19,777 1.0 0.6 1.8
Private employee 92 139,260 1.7 1.3 2.3
Self employed 49 58,986 1.7 1.3 2.4
Unpaid worker/home maker 23 25,227 0.9 0.5 1.4
Retiree 5 4,428 0.7 0.3 2.0
Household Income Group
Less than RM 1000 33 32,844 1.1 0.7 1.7
RM 1000 - RM 1999 34 39,782 1.1 0.7 1.8
RM 2000 - RM 2999 48 62,306 1.8 1.2 2.6
RM 3000 - RM 3999 25 34,979 1.3 0.8 2.0
RM 4000 - RM 4999 26 45,375 2.1 1.4 3.4
RM 5000 - RM 5999 23 32,693 1.9 1.2 3.0
RM 6000 - RM 6999 10 12,414 1.1 0.6 2.2
RM 7000 - RM 7999 9 9,472 1.1 0.5 2.3
RM 8000 - RM 8999 9 13,979 1.9 1.0 3.8
RM 9000 - RM 9999 2 1,940 0.5 0.1 2.8
RM 10000 & above 13 13,421 0.7 0.4 1.3
Quintile Household Income Group
Quintile 1 30 28,731 1.1 0.8 1.7
Quintile 2 31 40,573 1.1 0.7 1.8
Quintile 3 61 74,749 1.7 1.2 2.3
Quintile 4 47 78,153 1.6 1.2 2.3
Quintile 5 63 76,999 1.2 0.9 1.6
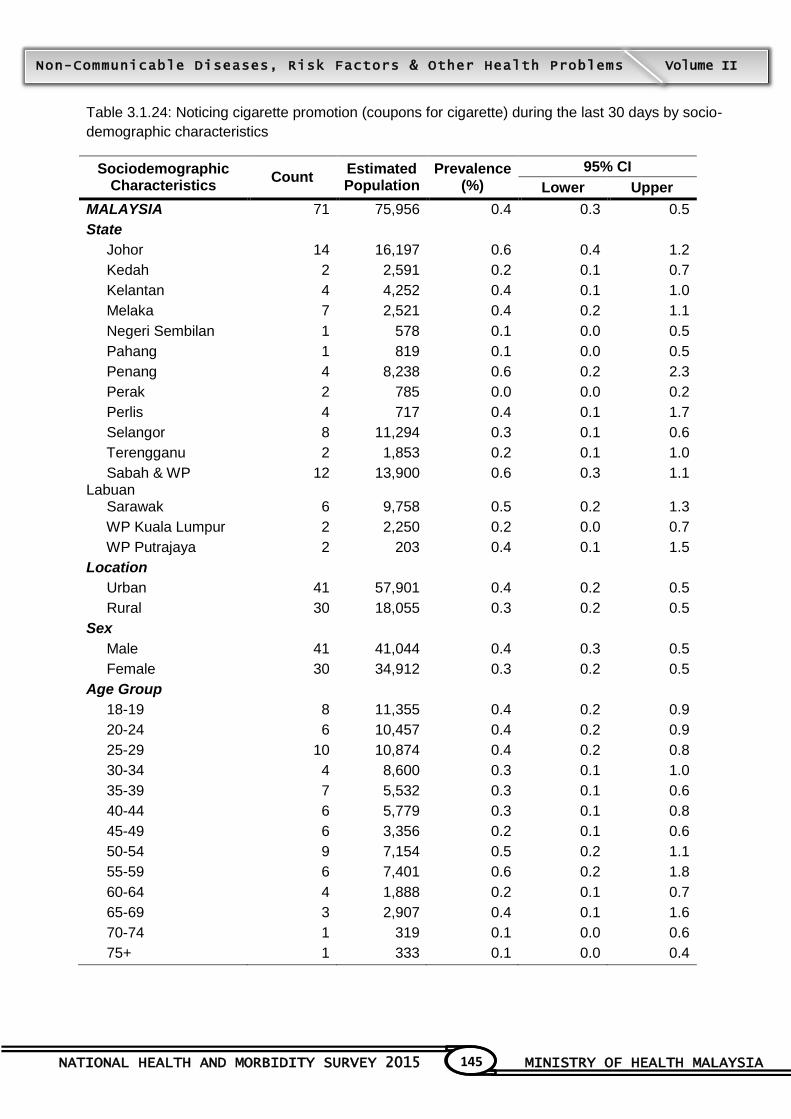
NATIONAL HEALTH AND MORBIDITY SURVEY 2015 MINISTRY OF HEALTH MALAYSIA
145
Non-Communicable Diseases, Risk Factors & Other Health Problems Volume II
Table 3.1.24: Noticing cigarette promotion (coupons for cigarette) during the last 30 days by socio-
demographic characteristics
Sociodemographic Characteristics
Count Estimated Population
Prevalence (%)
95% CI
Lower Upper
MALAYSIA 71 75,956 0.4 0.3 0.5
State
Johor 14 16,197 0.6 0.4 1.2
Kedah 2 2,591 0.2 0.1 0.7
Kelantan 4 4,252 0.4 0.1 1.0
Melaka 7 2,521 0.4 0.2 1.1
Negeri Sembilan 1 578 0.1 0.0 0.5
Pahang 1 819 0.1 0.0 0.5
Penang 4 8,238 0.6 0.2 2.3
Perak 2 785 0.0 0.0 0.2
Perlis 4 717 0.4 0.1 1.7
Selangor 8 11,294 0.3 0.1 0.6
Terengganu 2 1,853 0.2 0.1 1.0
Sabah & WP Labuan
12 13,900 0.6 0.3 1.1
Sarawak 6 9,758 0.5 0.2 1.3
WP Kuala Lumpur 2 2,250 0.2 0.0 0.7
WP Putrajaya 2 203 0.4 0.1 1.5
Location
Urban 41 57,901 0.4 0.2 0.5
Rural 30 18,055 0.3 0.2 0.5
Sex
Male 41 41,044 0.4 0.3 0.5
Female 30 34,912 0.3 0.2 0.5
Age Group
18-19 8 11,355 0.4 0.2 0.9
20-24 6 10,457 0.4 0.2 0.9
25-29 10 10,874 0.4 0.2 0.8
30-34 4 8,600 0.3 0.1 1.0
35-39 7 5,532 0.3 0.1 0.6
40-44 6 5,779 0.3 0.1 0.8
45-49 6 3,356 0.2 0.1 0.6
50-54 9 7,154 0.5 0.2 1.1
55-59 6 7,401 0.6 0.2 1.8
60-64 4 1,888 0.2 0.1 0.7
65-69 3 2,907 0.4 0.1 1.6
70-74 1 319 0.1 0.0 0.6
75+ 1 333 0.1 0.0 0.4
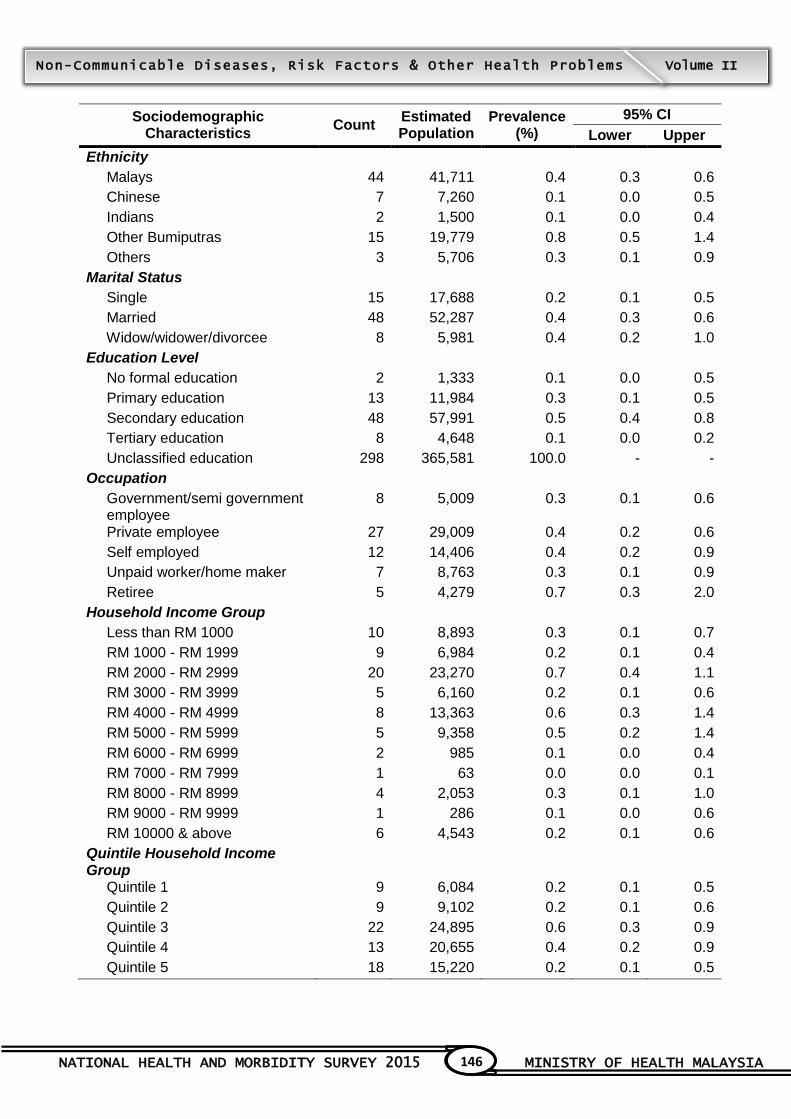
NATIONAL HEALTH AND MORBIDITY SURVEY 2015 MINISTRY OF HEALTH MALAYSIA
146
Non-Communicable Diseases, Risk Factors & Other Health Problems Volume II
Sociodemographic Characteristics
Count Estimated Population
Prevalence (%)
95% CI
Lower Upper
Ethnicity
Malays 44 41,711 0.4 0.3 0.6
Chinese 7 7,260 0.1 0.0 0.5
Indians 2 1,500 0.1 0.0 0.4
Other Bumiputras 15 19,779 0.8 0.5 1.4
Others 3 5,706 0.3 0.1 0.9
Marital Status
Single 15 17,688 0.2 0.1 0.5
Married 48 52,287 0.4 0.3 0.6
Widow/widower/divorcee 8 5,981 0.4 0.2 1.0
Education Level
No formal education 2 1,333 0.1 0.0 0.5
Primary education 13 11,984 0.3 0.1 0.5
Secondary education 48 57,991 0.5 0.4 0.8
Tertiary education 8 4,648 0.1 0.0 0.2
Unclassified education 298 365,581 100.0 - -
Occupation
Government/semi government employee
8 5,009 0.3 0.1 0.6
Private employee 27 29,009 0.4 0.2 0.6
Self employed 12 14,406 0.4 0.2 0.9
Unpaid worker/home maker 7 8,763 0.3 0.1 0.9
Retiree 5 4,279 0.7 0.3 2.0
Household Income Group
Less than RM 1000 10 8,893 0.3 0.1 0.7
RM 1000 - RM 1999 9 6,984 0.2 0.1 0.4
RM 2000 - RM 2999 20 23,270 0.7 0.4 1.1
RM 3000 - RM 3999 5 6,160 0.2 0.1 0.6
RM 4000 - RM 4999 8 13,363 0.6 0.3 1.4
RM 5000 - RM 5999 5 9,358 0.5 0.2 1.4
RM 6000 - RM 6999 2 985 0.1 0.0 0.4
RM 7000 - RM 7999 1 63 0.0 0.0 0.1
RM 8000 - RM 8999 4 2,053 0.3 0.1 1.0
RM 9000 - RM 9999 1 286 0.1 0.0 0.6
RM 10000 & above 6 4,543 0.2 0.1 0.6
Quintile Household Income Group
Quintile 1 9 6,084 0.2 0.1 0.5
Quintile 2 9 9,102 0.2 0.1 0.6
Quintile 3 22 24,895 0.6 0.3 0.9
Quintile 4 13 20,655 0.4 0.2 0.9
Quintile 5 18 15,220 0.2 0.1 0.5
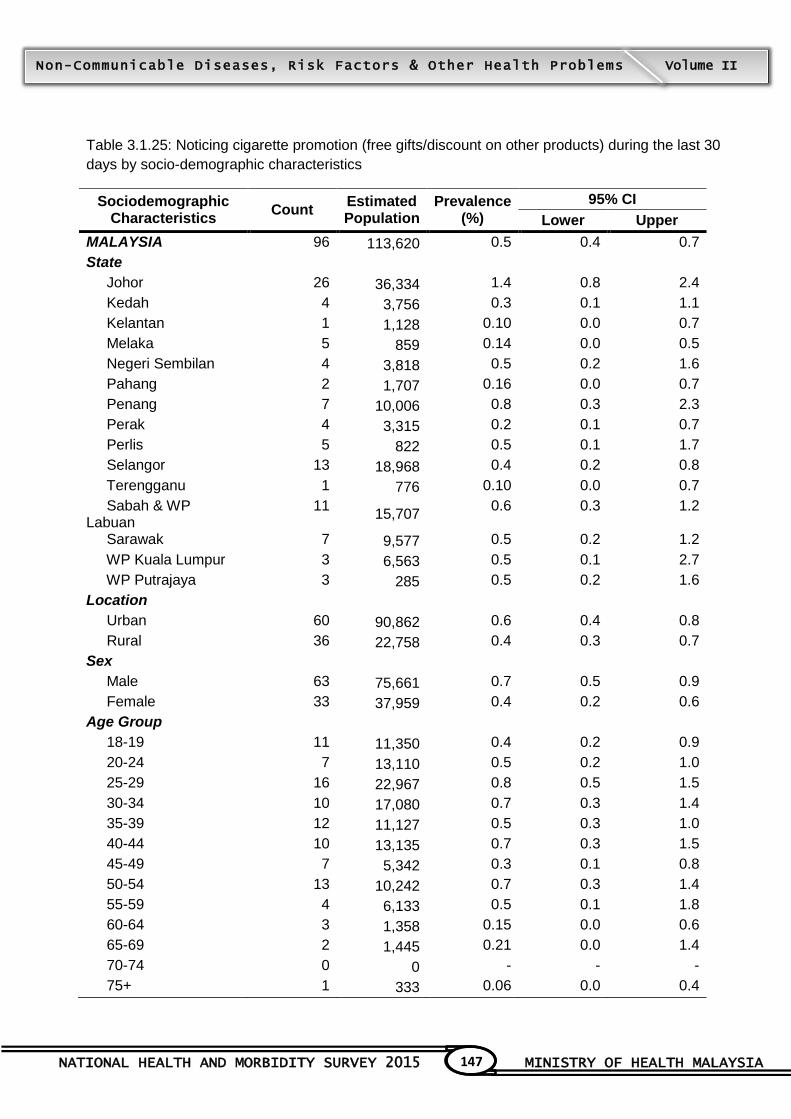
NATIONAL HEALTH AND MORBIDITY SURVEY 2015 MINISTRY OF HEALTH MALAYSIA
147
Non-Communicable Diseases, Risk Factors & Other Health Problems Volume II
Table 3.1.25: Noticing cigarette promotion (free gifts/discount on other products) during the last 30
days by socio-demographic characteristics
Sociodemographic Characteristics
Count Estimated Population
Prevalence (%)
95% CI
Lower Upper
MALAYSIA 96 113,620 0.5 0.4 0.7
State
Johor 26 36,334 1.4 0.8 2.4
Kedah 4 3,756 0.3 0.1 1.1
Kelantan 1 1,128 0.10 0.0 0.7
Melaka 5 859 0.14 0.0 0.5
Negeri Sembilan 4 3,818 0.5 0.2 1.6
Pahang 2 1,707 0.16 0.0 0.7
Penang 7 10,006 0.8 0.3 2.3
Perak 4 3,315 0.2 0.1 0.7
Perlis 5 822 0.5 0.1 1.7
Selangor 13 18,968 0.4 0.2 0.8
Terengganu 1 776 0.10 0.0 0.7
Sabah & WP Labuan
11 15,707
0.6 0.3 1.2
Sarawak 7 9,577 0.5 0.2 1.2
WP Kuala Lumpur 3 6,563 0.5 0.1 2.7
WP Putrajaya 3 285 0.5 0.2 1.6
Location
Urban 60 90,862 0.6 0.4 0.8
Rural 36 22,758 0.4 0.3 0.7
Sex
Male 63 75,661 0.7 0.5 0.9
Female 33 37,959 0.4 0.2 0.6
Age Group
18-19 11 11,350 0.4 0.2 0.9
20-24 7 13,110 0.5 0.2 1.0
25-29 16 22,967 0.8 0.5 1.5
30-34 10 17,080 0.7 0.3 1.4
35-39 12 11,127 0.5 0.3 1.0
40-44 10 13,135 0.7 0.3 1.5
45-49 7 5,342 0.3 0.1 0.8
50-54 13 10,242 0.7 0.3 1.4
55-59 4 6,133 0.5 0.1 1.8
60-64 3 1,358 0.15 0.0 0.6
65-69 2 1,445 0.21 0.0 1.4
70-74 0 0 - - -
75+ 1 333 0.06 0.0 0.4
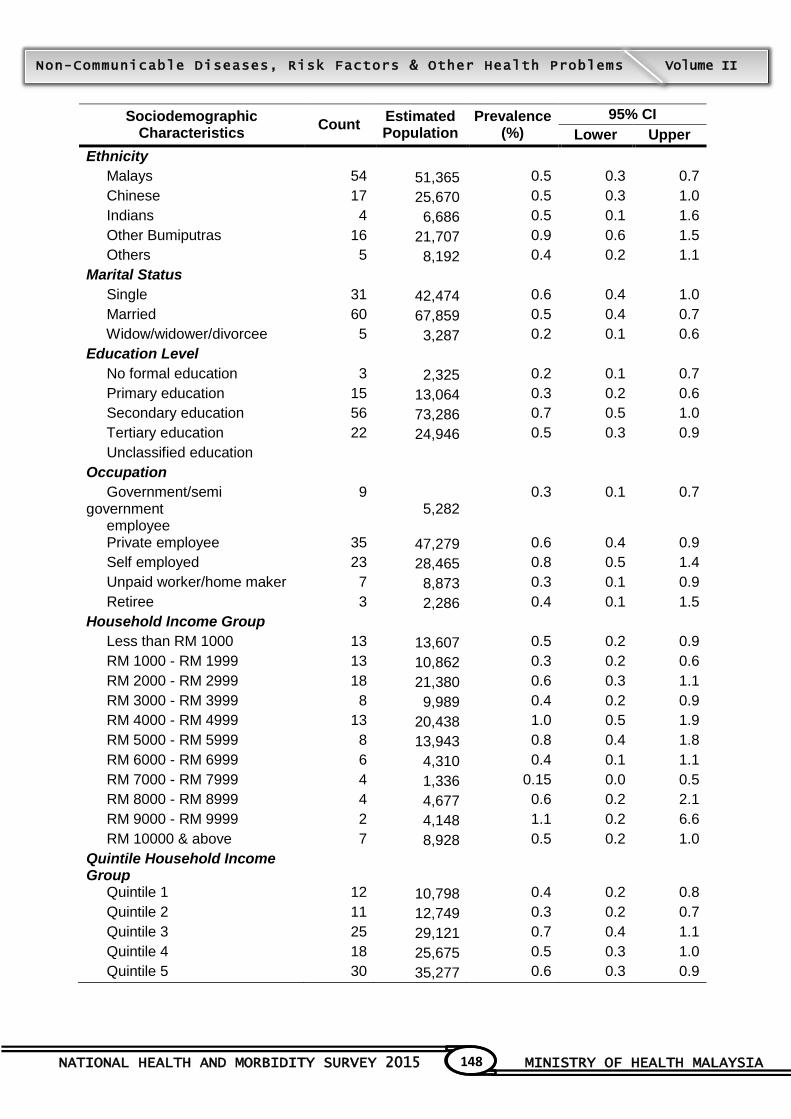
NATIONAL HEALTH AND MORBIDITY SURVEY 2015 MINISTRY OF HEALTH MALAYSIA
148
Non-Communicable Diseases, Risk Factors & Other Health Problems Volume II
Sociodemographic Characteristics
Count Estimated Population
Prevalence (%)
95% CI
Lower Upper
Ethnicity
Malays 54 51,365 0.5 0.3 0.7
Chinese 17 25,670 0.5 0.3 1.0
Indians 4 6,686 0.5 0.1 1.6
Other Bumiputras 16 21,707 0.9 0.6 1.5
Others 5 8,192 0.4 0.2 1.1
Marital Status
Single 31 42,474 0.6 0.4 1.0
Married 60 67,859 0.5 0.4 0.7
Widow/widower/divorcee 5 3,287 0.2 0.1 0.6
Education Level
No formal education 3 2,325 0.2 0.1 0.7
Primary education 15 13,064 0.3 0.2 0.6
Secondary education 56 73,286 0.7 0.5 1.0
Tertiary education 22 24,946 0.5 0.3 0.9
Unclassified education
Occupation
Government/semi government employee
9 5,282
0.3 0.1 0.7
Private employee 35 47,279 0.6 0.4 0.9
Self employed 23 28,465 0.8 0.5 1.4
Unpaid worker/home maker 7 8,873 0.3 0.1 0.9
Retiree 3 2,286 0.4 0.1 1.5
Household Income Group
Less than RM 1000 13 13,607 0.5 0.2 0.9
RM 1000 - RM 1999 13 10,862 0.3 0.2 0.6
RM 2000 - RM 2999 18 21,380 0.6 0.3 1.1
RM 3000 - RM 3999 8 9,989 0.4 0.2 0.9
RM 4000 - RM 4999 13 20,438 1.0 0.5 1.9
RM 5000 - RM 5999 8 13,943 0.8 0.4 1.8
RM 6000 - RM 6999 6 4,310 0.4 0.1 1.1
RM 7000 - RM 7999 4 1,336 0.15 0.0 0.5
RM 8000 - RM 8999 4 4,677 0.6 0.2 2.1
RM 9000 - RM 9999 2 4,148 1.1 0.2 6.6
RM 10000 & above 7 8,928 0.5 0.2 1.0
Quintile Household Income Group
Quintile 1 12 10,798 0.4 0.2 0.8
Quintile 2 11 12,749 0.3 0.2 0.7
Quintile 3 25 29,121 0.7 0.4 1.1
Quintile 4 18 25,675 0.5 0.3 1.0
Quintile 5 30 35,277 0.6 0.3 0.9
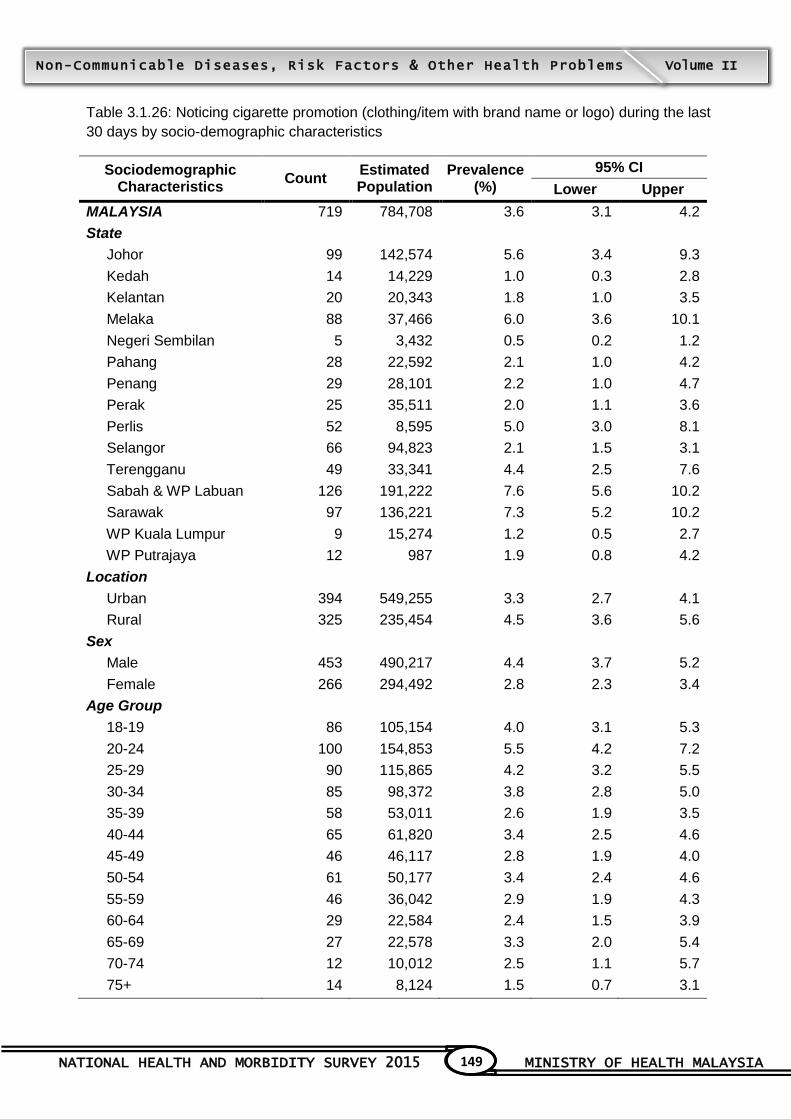
NATIONAL HEALTH AND MORBIDITY SURVEY 2015 MINISTRY OF HEALTH MALAYSIA
149
Non-Communicable Diseases, Risk Factors & Other Health Problems Volume II
Table 3.1.26: Noticing cigarette promotion (clothing/item with brand name or logo) during the last
30 days by socio-demographic characteristics
Sociodemographic Characteristics
Count Estimated Population
Prevalence (%)
95% CI
Lower Upper
MALAYSIA 719 784,708 3.6 3.1 4.2
State
Johor 99 142,574 5.6 3.4 9.3
Kedah 14 14,229 1.0 0.3 2.8
Kelantan 20 20,343 1.8 1.0 3.5
Melaka 88 37,466 6.0 3.6 10.1
Negeri Sembilan 5 3,432 0.5 0.2 1.2
Pahang 28 22,592 2.1 1.0 4.2
Penang 29 28,101 2.2 1.0 4.7
Perak 25 35,511 2.0 1.1 3.6
Perlis 52 8,595 5.0 3.0 8.1
Selangor 66 94,823 2.1 1.5 3.1
Terengganu 49 33,341 4.4 2.5 7.6
Sabah & WP Labuan 126 191,222 7.6 5.6 10.2
Sarawak 97 136,221 7.3 5.2 10.2
WP Kuala Lumpur 9 15,274 1.2 0.5 2.7
WP Putrajaya 12 987 1.9 0.8 4.2
Location
Urban 394 549,255 3.3 2.7 4.1
Rural 325 235,454 4.5 3.6 5.6
Sex
Male 453 490,217 4.4 3.7 5.2
Female 266 294,492 2.8 2.3 3.4
Age Group
18-19 86 105,154 4.0 3.1 5.3
20-24 100 154,853 5.5 4.2 7.2
25-29 90 115,865 4.2 3.2 5.5
30-34 85 98,372 3.8 2.8 5.0
35-39 58 53,011 2.6 1.9 3.5
40-44 65 61,820 3.4 2.5 4.6
45-49 46 46,117 2.8 1.9 4.0
50-54 61 50,177 3.4 2.4 4.6
55-59 46 36,042 2.9 1.9 4.3
60-64 29 22,584 2.4 1.5 3.9
65-69 27 22,578 3.3 2.0 5.4
70-74 12 10,012 2.5 1.1 5.7
75+ 14 8,124 1.5 0.7 3.1
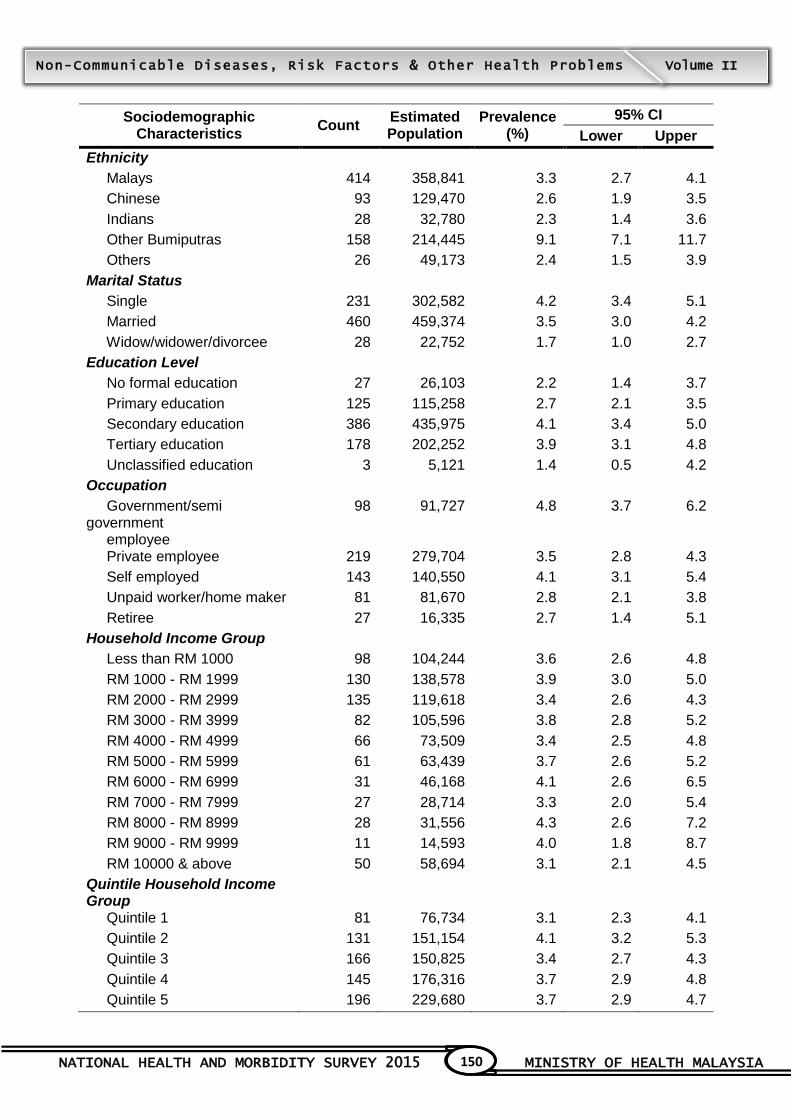
NATIONAL HEALTH AND MORBIDITY SURVEY 2015 MINISTRY OF HEALTH MALAYSIA
150
Non-Communicable Diseases, Risk Factors & Other Health Problems Volume II
Sociodemographic Characteristics
Count Estimated Population
Prevalence (%)
95% CI
Lower Upper
Ethnicity
Malays 414 358,841 3.3 2.7 4.1
Chinese 93 129,470 2.6 1.9 3.5
Indians 28 32,780 2.3 1.4 3.6
Other Bumiputras 158 214,445 9.1 7.1 11.7
Others 26 49,173 2.4 1.5 3.9
Marital Status
Single 231 302,582 4.2 3.4 5.1
Married 460 459,374 3.5 3.0 4.2
Widow/widower/divorcee 28 22,752 1.7 1.0 2.7
Education Level
No formal education 27 26,103 2.2 1.4 3.7
Primary education 125 115,258 2.7 2.1 3.5
Secondary education 386 435,975 4.1 3.4 5.0
Tertiary education 178 202,252 3.9 3.1 4.8
Unclassified education 3 5,121 1.4 0.5 4.2
Occupation
Government/semi government employee
98 91,727 4.8 3.7 6.2
Private employee 219 279,704 3.5 2.8 4.3
Self employed 143 140,550 4.1 3.1 5.4
Unpaid worker/home maker 81 81,670 2.8 2.1 3.8
Retiree 27 16,335 2.7 1.4 5.1
Household Income Group
Less than RM 1000 98 104,244 3.6 2.6 4.8
RM 1000 - RM 1999 130 138,578 3.9 3.0 5.0
RM 2000 - RM 2999 135 119,618 3.4 2.6 4.3
RM 3000 - RM 3999 82 105,596 3.8 2.8 5.2
RM 4000 - RM 4999 66 73,509 3.4 2.5 4.8
RM 5000 - RM 5999 61 63,439 3.7 2.6 5.2
RM 6000 - RM 6999 31 46,168 4.1 2.6 6.5
RM 7000 - RM 7999 27 28,714 3.3 2.0 5.4
RM 8000 - RM 8999 28 31,556 4.3 2.6 7.2
RM 9000 - RM 9999 11 14,593 4.0 1.8 8.7
RM 10000 & above 50 58,694 3.1 2.1 4.5
Quintile Household Income Group
Quintile 1 81 76,734 3.1 2.3 4.1
Quintile 2 131 151,154 4.1 3.2 5.3
Quintile 3 166 150,825 3.4 2.7 4.3
Quintile 4 145 176,316 3.7 2.9 4.8
Quintile 5 196 229,680 3.7 2.9 4.7

NATIONAL HEALTH AND MORBIDITY SURVEY 2015 MINISTRY OF HEALTH MALAYSIA
151
Non-Communicable Diseases, Risk Factors & Other Health Problems Volume II
Table 3.1.27: Noticing cigarette promotion (mail promoting cigarette) during the last 30 days by
socio-demographic characteristics
Sociodemographic Characteristics
Count Estimated Population
Prevalence (%)
95% CI
Lower Upper
MALAYSIA 77 100,019 0.5 0.3 0.6
State
Johor 13 15,904 0.6 0.3 1.2
Kedah 5 6,794 0.5 0.1 2.0
Kelantan 2 2,848 0.3 0.1 1.0
Melaka 6 3,881 0.6 0.2 1.7
Negeri Sembilan 1 578 0.08 0.0 0.5
Pahang 4 2,139 0.20 0.1 0.9
Penang 2 7,995 0.6 0.2 2.3
Perak 4 6,461 0.4 0.1 1.0
Perlis 5 908 0.5 0.2 1.7
Selangor 11 17,322 0.4 0.2 0.9
Terengganu 2 2,656 0.3 0.1 1.5
Sabah & WP Labuan 7 11,077 0.4 0.2 1.0
Sarawak 7 13,639 0.7 0.3 1.6
WP Kuala Lumpur 5 7,606 0.6 0.2 1.7
WP Putrajaya 3 210 0.4 0.1 1.3
Location
Urban 54 84,544 0.5 0.4 0.7
Rural 23 15,475 0.3 0.2 0.5
Sex
Male 49 59,710 0.5 0.4 0.8
Female 28 40,309 0.4 0.3 0.6
Age Group
18-19 5 7,014 0.3 0.1 0.7
20-24 11 20,746 0.7 0.4 1.4
25-29 9 14,148 0.5 0.2 1.1
30-34 8 14,755 0.6 0.3 1.3
35-39 10 9,693 0.5 0.2 1.1
40-44 7 7,726 0.4 0.2 1.0
45-49 2 1,693 0.10 0.0 0.4
50-54 6 8,183 0.5 0.2 1.3
55-59 10 10,068 0.8 0.3 1.9
60-64 4 1,806 0.2 0.1 0.7
65-69 4 2,314 0.3 0.1 1.4
70-74
75+ 1 1,875 0.34 0.1 2.4
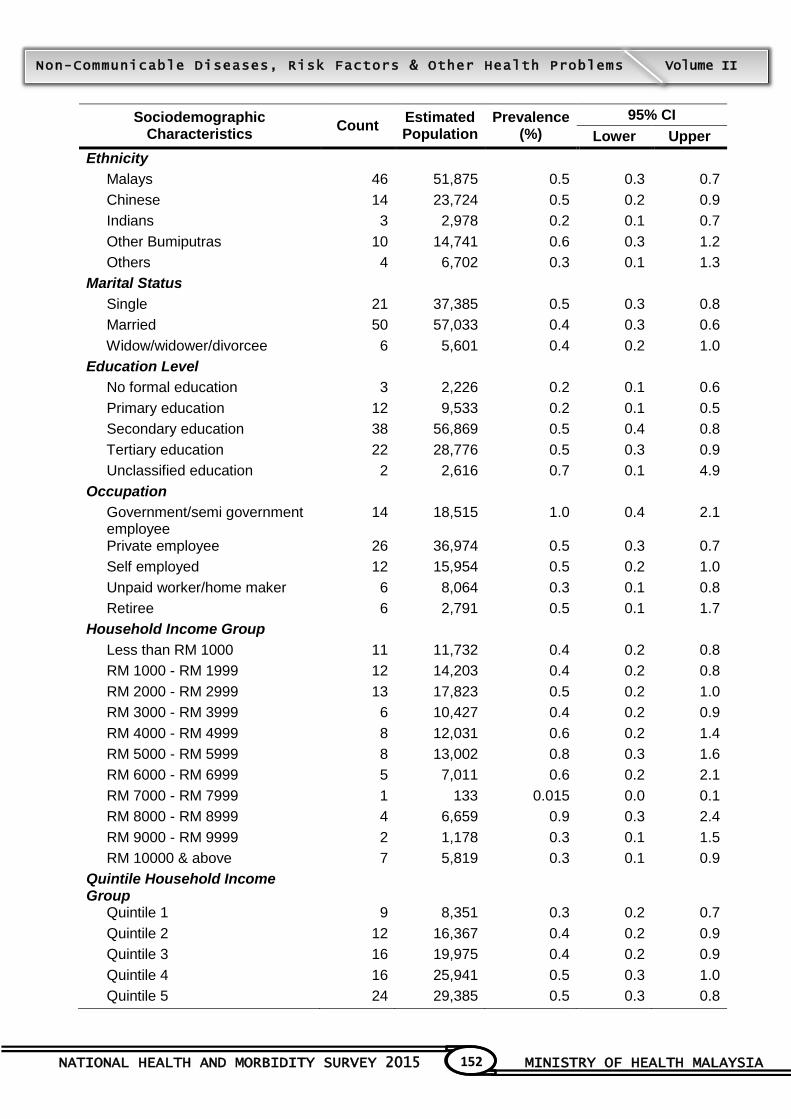
NATIONAL HEALTH AND MORBIDITY SURVEY 2015 MINISTRY OF HEALTH MALAYSIA
152
Non-Communicable Diseases, Risk Factors & Other Health Problems Volume II
Sociodemographic Characteristics
Count Estimated Population
Prevalence (%)
95% CI
Lower Upper
Ethnicity
Malays 46 51,875 0.5 0.3 0.7
Chinese 14 23,724 0.5 0.2 0.9
Indians 3 2,978 0.2 0.1 0.7
Other Bumiputras 10 14,741 0.6 0.3 1.2
Others 4 6,702 0.3 0.1 1.3
Marital Status
Single 21 37,385 0.5 0.3 0.8
Married 50 57,033 0.4 0.3 0.6
Widow/widower/divorcee 6 5,601 0.4 0.2 1.0
Education Level
No formal education 3 2,226 0.2 0.1 0.6
Primary education 12 9,533 0.2 0.1 0.5
Secondary education 38 56,869 0.5 0.4 0.8
Tertiary education 22 28,776 0.5 0.3 0.9
Unclassified education 2 2,616 0.7 0.1 4.9
Occupation
Government/semi government employee
14 18,515 1.0 0.4 2.1
Private employee 26 36,974 0.5 0.3 0.7
Self employed 12 15,954 0.5 0.2 1.0
Unpaid worker/home maker 6 8,064 0.3 0.1 0.8
Retiree 6 2,791 0.5 0.1 1.7
Household Income Group
Less than RM 1000 11 11,732 0.4 0.2 0.8
RM 1000 - RM 1999 12 14,203 0.4 0.2 0.8
RM 2000 - RM 2999 13 17,823 0.5 0.2 1.0
RM 3000 - RM 3999 6 10,427 0.4 0.2 0.9
RM 4000 - RM 4999 8 12,031 0.6 0.2 1.4
RM 5000 - RM 5999 8 13,002 0.8 0.3 1.6
RM 6000 - RM 6999 5 7,011 0.6 0.2 2.1
RM 7000 - RM 7999 1 133 0.015 0.0 0.1
RM 8000 - RM 8999 4 6,659 0.9 0.3 2.4
RM 9000 - RM 9999 2 1,178 0.3 0.1 1.5
RM 10000 & above 7 5,819 0.3 0.1 0.9
Quintile Household Income Group
Quintile 1 9 8,351 0.3 0.2 0.7
Quintile 2 12 16,367 0.4 0.2 0.9
Quintile 3 16 19,975 0.4 0.2 0.9
Quintile 4 16 25,941 0.5 0.3 1.0
Quintile 5 24 29,385 0.5 0.3 0.8


NATIONAL HEALTH AND MORBIDITY SURVEY 2015 MINISTRY OF HEALTH MALAYSIA
154
Non-Communicable Diseases, Risk Factors & Other Health Problems Volume II
4. ALCOHOL CONSUMPTION
Contributors to this section: Hamizatul Akmal Abd Hamid, Rozanim Kamarudin, Norsiah Ali, Mohd
Hatta Abd Mutalip, Shubash Shander a/l Ganapathy, Nur Liana Ab Majid, Jane Ling Miaw Yn,
Wan Shakira Rodzlan Hasani
4.1 Background
Globally, harmful use of alcohol causes approximately 3.3 million deaths every year and 5.1% of
the global burden of diseases attributable to alcohol use1. The public health objective on alcohol of
the World Health Organization (WHO) is to reduce the health burden caused by the harmful use of
alcohol and thereby to save lives, reduce disease and prevent injuries1. The negative health
outcomes of alcohol use include morbidity, mortality and disability. This does not only affect the
individual, but the society and nation as a whole.
The prevalence of alcohol use in Malaysia was still lower than other countries in the Western
Pacific Region. There was no significant change to the pattern of drinking except for a slight
increase in the prevalence of current drinker from 11.1% in 2006 to 11.6% in 20112,3. Though the
prevalence was considered low, the National Health and Morbidity Survey 2011 noted among the
current drinkers, the proportion who reported engaging in binge drinking was 50.2 %3.
WHO Global Action Plan for the Prevention and Control of NCDs, 2013-2020 represents a global
commitment to reduce modifiable risk factors for NCDs4. Harmful use of alcohol is one of the
NCDs risk factors and has been identified as an indicator for progress monitoring. Along with the
Global Action Plan 2013-2020, Malaysia aims to achieve a 10% relative reduction in the harmful
use of alcohol by 2020. In this context, one of the indicators set by WHO to monitor the harmful
use of alcohol is the prevalence of heavy episodic drinking (HED) among adolescents and adults
as appropriate within the national context. HED is defined as consumption of at least 60 gram (6
standard drinks) or more of pure alcohol on at least one occasion weekly. The prevalence of HED
for 18 years old and above in NHMS 2011 was 1.2%.
4.2 Objectives
4.2.1 General objective
To determine the prevalence of alcohol consumption in Malaysia amongst 13
years old and above
4.2.2 Specific Objectives
a. To determine the national prevalence of :
i. Lifetime abstainers
ii. Ex-drinkers
b. To determine the national prevalence of alcohol use by socio-demographic subgroups.
i. Ever drinker
ii. Current drinker (past 12 months)

NATIONAL HEALTH AND MORBIDITY SURVEY 2015 MINISTRY OF HEALTH MALAYSIA
155
Non-Communicable Diseases, Risk Factors & Other Health Problems Volume II
c. To identify the proportion of binge drinking among the current drinkers (≥18 years old)
by gender, ethnicity and location
d. To identify the proportion of heavy episodic drinking among the current drinkers (≥18
years old)
e. To determine types of drinkers (≥18 years old) by their risk to alcohol-related harm (low risk, risky and probable dependence)
4.3 Target Population, Study Instrument And Definitions
Data on alcohol was obtained from adult respondent 13 years and above through validated self-
administered Alcohol Use Disorder Identification Test (AUDIT) questionnaires. A screening
question was asked to all respondents to determine those who have ever consumed alcohol.
AUDIT, a bi-lingual 10 items scale questionnaire with an additional 2 questions, will then be given
to the respondent who answered „yes‟ to have ever consumed alcohol in their lifetime.
Alcohol drink in this context encompassed any drink containing ethanol irrespective of
concentration and inclusive of those consumed for medical purposes such as alcoholic tonic. For
the purposed of analysis in this survey, the respondents were categorised into several categories.
Lifetime abstainers were defined as those respondents who had never consumed alcohol in their
lifetime while respondents who had history of consuming alcohol were defined as ever drinkers.
Current drinkers were respondents who still consumed alcohol for the past twelve (12) months
prior to the survey. Additionally, ex-drinkers were respondents who had claimed did not drink
alcohol for the past twelve (12) months.
Binge drinking was defined as consumption of 6 and more of standard drink per-sitting and heavy
episodic drinking was defined as consumption of 6 and more standard drink per-sitting on at least
one occasion weekly. Low risk drinker was a respondent who consumed alcohol according to
AUDIT cut-off point set by WHO and with AUDIT score of between 0 and 7. Risky drinker on the
other hand was a respondent who consumed alcohol in excess of low risk guideline and with
AUDIT score of between 8 and 19. Probable Alcohol Dependence was a respondent who
consumed alcohol beyond the low risk guideline and with AUDIT score of 20 or more.
4.4 Findings
4.4.1 Prevalence of Alcohol Consumption (13 years old and above)
The response rate for this module was 99.8% (n=22,452). A total of 65.2% (n=1368) ever drinkers
responded to the AUDIT questionnaire. The prevalence of lifetime abstainer was 86.5% (95% Cl:
85.1, 87.8), past year abstinence was 88.0% (95% Cl: 86.7, 89.2) and ever consume alcohol was
13.5% (95% Cl: 12.2, 14.9). Meanwhile the prevalence of current drinker among the 13 years old
and above was 7.7% (95% Cl: 6.8, 8.7) and ex- drinker was 1.5% (95% Cl: 1.2, 1.8).
NATIONAL HEALTH AND MORBIDITY SURVEY 2015 MINISTRY OF HEALTH MALAYSIA
156
Non-Communicable Diseases, Risk Factors & Other Health Problems Volume II
Among the current drinkers , the consumption prevalence was highest among urban residents
(8.3%, 95% Cl: 7.2,9.5), males (11.1%, 95% Cl: 9.9,12.4), other Bumiputras (19.9%, 95% Cl:
16.4,23.9), those between 25-29 years old (10.9%, 95% Cl: 8.7, 13.6), singles (9.3%, 95% Cl:
7.8,10.9), those with tertiary education (10.9%, 95% Cl: 9.1,13.1), those working in private sectors
(11.8%, 95% Cl: 10.2,13.6), those with household incomes of RM6000- 6999 (12.0%, 95% Cl:
8.5,16.6) and RM 7000-7999 (12.0%, 95% Cl: 8.7,16.5) and quintile income group Q5 (10.3%,
95% Cl: 8.5,12.4)(Table 4.1.1).
4.4.2 Prevalence of Alcohol Consumption among Adolescents (below 18 years)
The prevalence of ever consumed alcohol and current drinker among adolescents were 5.5%
(95% CI: 4.2, 7.1) and 3.0% (95% CI: 2.1, 4.1) respectively. Among those ever consumed alcohol,
the highest prevalence was among males (6.3%) and rural dwellers (7.3%). The proportion of
binge drinking among current drinkers was 54.4% (95% CI: 40.3, 67.8). Further analysis cannot be
done due to the small sample size of this age group.
4.4.3 Prevalence of Alcohol Consumption (18 years and above)
The prevalence of lifetime abstainer was 85.5% (95% Cl: 83.9, 86.9), past year abstinence was
87.0% (95 % CI: 85.6, 88.3) and ever consume alcohol was 14.5% (95% Cl: 13.1, 16.1). The
prevalence of current drinker among 18 years and above was 8.4% (95% Cl: 7.4, 9.5) and ex-
drinker was 1.5% (95% Cl: 1.2, 1.9).
Among the current drinkers, the consumption prevalence was highest in urban areas (9.0%, 95%
Cl: 7.8,10.3), males (12.1%, 95% Cl: 10.8, 13.7), other Bumiputras (21.6%, 95% Cl: 17.6, 26.3),
age group between 25-29 years old (10.9%, 95% Cl: 8.7, 13.6), singles (12.2%, 95% Cl: 10.2,
14.4), those with tertiary education (10.9%, 95% Cl: 9.1, 13.1), those working in private sector
(11.8%, 95% Cl: 10.2, 13.6), those with household income of RM7000 - 7999 (13.1%, 95% Cl: 9.3,
18.1) and quintile income group Q5 (11.2%, 95% Cl: 9.3, 13.4)(Table 4.1.2).
4.4.4 Prevalence of Binge Drinker (18 years and above)
The prevalence of binge drinking for 18 years and above was 5.0%, (95% CI: 4.3, 5.8) and its
proportion among the current drinkers was 59.4%, (95% CI: 54.8, 63.8). While the prevalence of
heavy episodic drinking for 18 years old and above was (0.9%, 95% CI: 0.7, 1.2), its proportion
among the current drinkers was 10.8%, (95% CI: 8.4, 13.7). Current drinkers aged 18 years old
and above who practiced binge drinking were more common in rural areas (69.6%, 95% CI: 59.4,
78.1), higher among males (64.0%, 95% CI: 58.9, 68.7), Malays (87.0%, 95% CI: 66.9, 95.7) and
those between 20-24 years old (65.4%, 95% CI: 54.7, 74.7) and 25-29 years old (65.4%, 95% CI:
54.4, 74.9)(Table 4.1.3).
4.4.5 Risk related to pattern of drinking
Most of the current drinkers aged 18 years and above were low risk drinkers (69.8%, 95% CI:
65.3, 73.9), followed by risky drinkers (28.4%, 95% CI: 24.4, 32.8) and probable dependence
(1.8%, 95% CI: 1.1, 3.0)(Table 4.1.4).
NATIONAL HEALTH AND MORBIDITY SURVEY 2015 MINISTRY OF HEALTH MALAYSIA
157
Non-Communicable Diseases, Risk Factors & Other Health Problems Volume II
4.5 Conclusion
Findings from NHMS 2015 showed a reduction in the prevalence of current drinkers in Malaysia as
compared to findings from NHMS 2011. However the prevalence of both binge drinking and heavy
episodic drinking were increased among the current drinkers. Identifying the groups at risk is an
essential step towards enabling intervention and education for the targeted groups. Health
education should continue to stress on the harms of binge drinking and harmful use of alcohol.
Collaboration with multiple agencies and support from the various ministries, the private sectors,
non-governmental bodies and community is necessary towards reversing this alarming trend and
safeguarding for the Malaysian society as a whole from the harms of alcohol.
4.6 References
1. World Health Organization (WHO). Global Status Report on Alcohol and Health. 2014.
http://www.who.int/substance_abuse/publications/global_alcohol_report/msb_gsr_2014_1.pdf?ua
=1. Accessed on 21 Sept. 2015.
2. Institute for Public Health (IPH) 2008. The Third National Health and Morbidity Survey (NHMS
III) 2006, Alcohol. Ministry of Health Malaysia.
3. Institute for Public Health (IPH) 2011. National Health and Morbidity Survey 2011(NHMS 2011).
Vol. II: Non-Communicable Diseases; 2011: 188 Pages.
4. WHO Global Action Plan For the Prevention and Control of Noncommunicable Diseases 2-2013-
2020. 2013. http://apps.who.int/iris/bitstream/10665/94384/1/9789241506236_eng.pdf?ua=1
Accessed on 21 Sept. 2015.
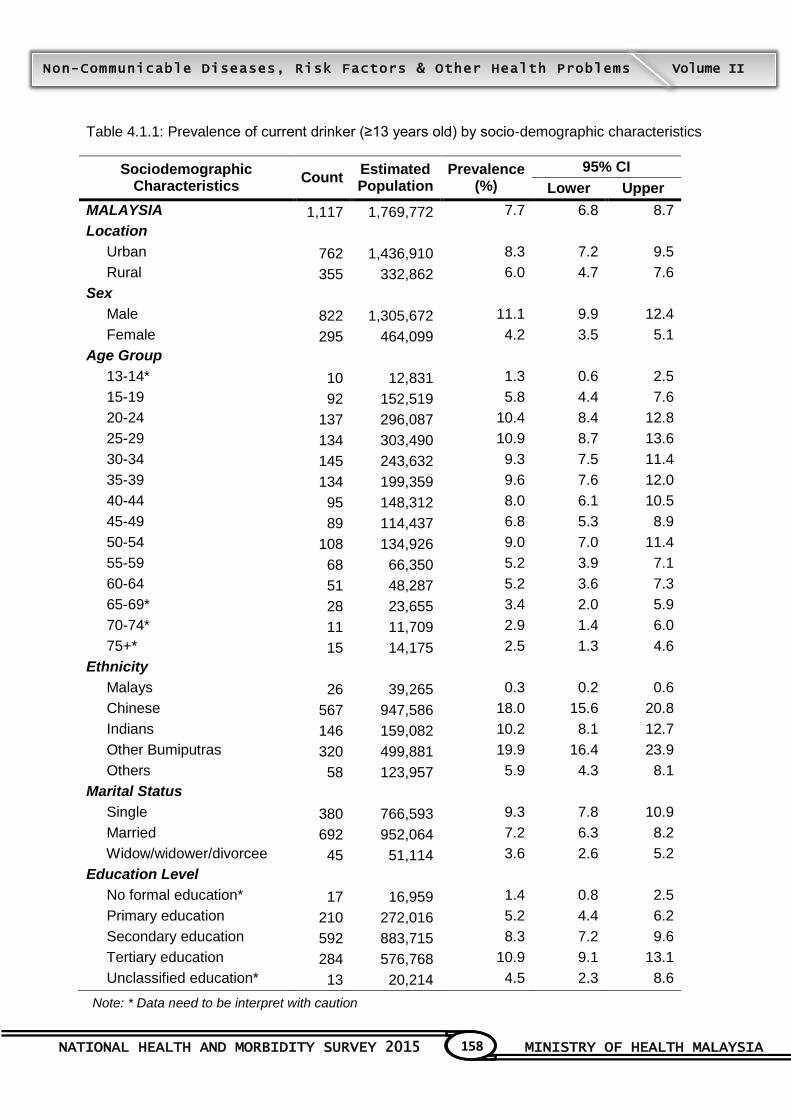
NATIONAL HEALTH AND MORBIDITY SURVEY 2015 MINISTRY OF HEALTH MALAYSIA
158
Non-Communicable Diseases, Risk Factors & Other Health Problems Volume II
Table 4.1.1: Prevalence of current drinker (≥13 years old) by socio-demographic characteristics
Sociodemographic Characteristics
Count Estimated Population
Prevalence (%)
95% CI
Lower Upper
MALAYSIA 1,117 1,769,772 7.7 6.8 8.7
Location
Urban 762 1,436,910 8.3 7.2 9.5
Rural 355 332,862 6.0 4.7 7.6
Sex
Male 822 1,305,672 11.1 9.9 12.4
Female 295 464,099 4.2 3.5 5.1
Age Group
13-14* 10 12,831 1.3 0.6 2.5
15-19 92 152,519 5.8 4.4 7.6
20-24 137 296,087 10.4 8.4 12.8
25-29 134 303,490 10.9 8.7 13.6
30-34 145 243,632 9.3 7.5 11.4
35-39 134 199,359 9.6 7.6 12.0
40-44 95 148,312 8.0 6.1 10.5
45-49 89 114,437 6.8 5.3 8.9
50-54 108 134,926 9.0 7.0 11.4
55-59 68 66,350 5.2 3.9 7.1
60-64 51 48,287 5.2 3.6 7.3
65-69* 28 23,655 3.4 2.0 5.9
70-74* 11 11,709 2.9 1.4 6.0
75+* 15 14,175 2.5 1.3 4.6
Ethnicity
Malays 26 39,265 0.3 0.2 0.6
Chinese 567 947,586 18.0 15.6 20.8
Indians 146 159,082 10.2 8.1 12.7
Other Bumiputras 320 499,881 19.9 16.4 23.9
Others 58 123,957 5.9 4.3 8.1
Marital Status
Single 380 766,593 9.3 7.8 10.9
Married 692 952,064 7.2 6.3 8.2
Widow/widower/divorcee 45 51,114 3.6 2.6 5.2
Education Level
No formal education* 17 16,959 1.4 0.8 2.5
Primary education 210 272,016 5.2 4.4 6.2
Secondary education 592 883,715 8.3 7.2 9.6
Tertiary education 284 576,768 10.9 9.1 13.1
Unclassified education* 13 20,214 4.5 2.3 8.6
Note: * Data need to be interpret with caution

NATIONAL HEALTH AND MORBIDITY SURVEY 2015 MINISTRY OF HEALTH MALAYSIA
159
Non-Communicable Diseases, Risk Factors & Other Health Problems Volume II
Sociodemographic Characteristics
Count Estimated Population
Prevalence (%)
95% CI
Lower Upper
Occupation
Government/semi government employee
61 95,247 4.9 3.5 7.0
Private employee 515 955,604 11.8 10.2 13.6
Self employed 265 312,054 9.0 7.5 10.9
Unpaid worker/home maker 79 100,264 3.5 2.5 4.7
Retiree 33 35,800 5.9 3.9 8.9
Income Group
Less than RM 1000 129 173,448 5.6 4.4 7.1
RM 1000 - RM 1999 150 227,470 6.0 4.9 7.4
RM 2000 - RM 2999 153 216,632 5.8 4.2 7.8
RM 3000 - RM 3999 152 253,041 8.6 6.7 11.0
RM 4000 - RM 4999 103 150,366 6.6 4.8 9.1
RM 5000 - RM 5999 91 184,768 10.2 7.6 13.7
RM 6000 - RM 6999 77 139,314 12.0 8.5 16.6
RM 7000 - RM 7999 74 111,478 12.0 8.7 16.5
RM 8000 - RM 8999* 33 47,150 6.1 3.5 10.6
RM 9000 - RM 9999* 18 31,921 8.3 4.5 14.6
RM 10000 & above 137 234,184 11.7 8.8 15.5
Quintile Income Group
Quintile 1 112 151,369 5.7 4.4 7.4
Quintile 2 161 241,711 6.2 5.0 7.7
Quintile 3 209 319,731 6.7 5.2 8.6
Quintile 4 243 384,700 7.6 6.2 9.4
Quintile 5 392 672,260 10.3 8.5 12.4
Note: * Data need to be interpret with caution
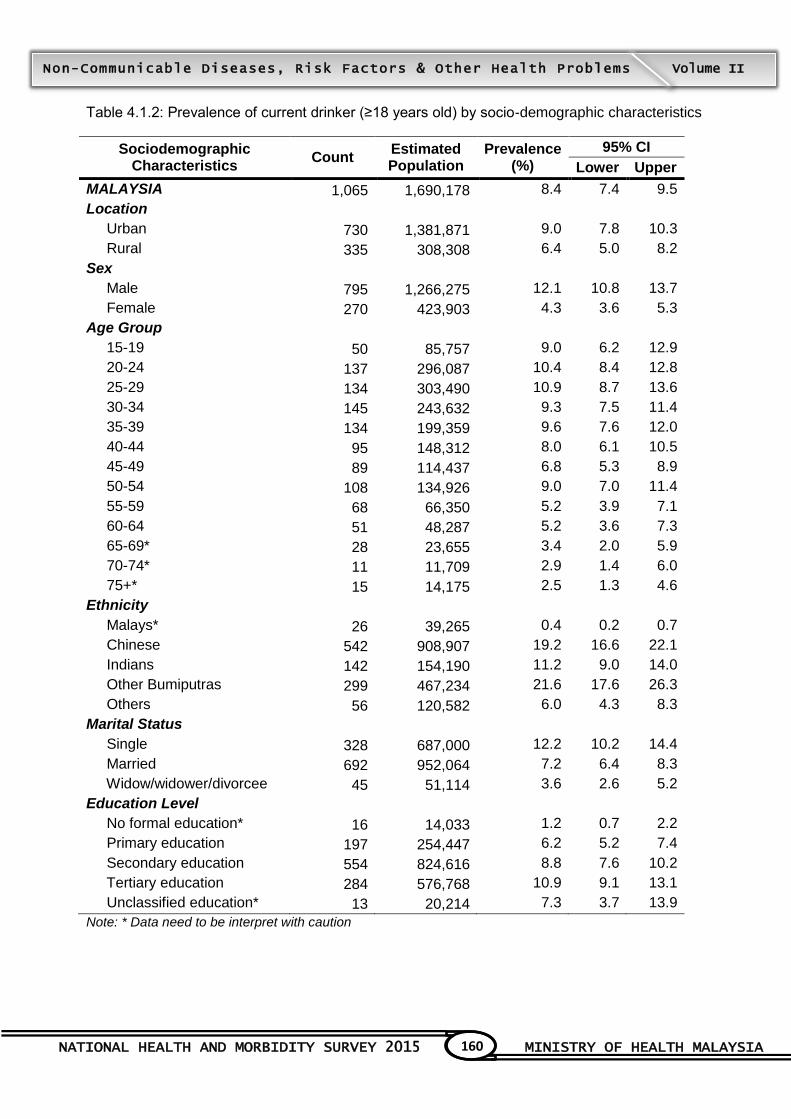
NATIONAL HEALTH AND MORBIDITY SURVEY 2015 MINISTRY OF HEALTH MALAYSIA
160
Non-Communicable Diseases, Risk Factors & Other Health Problems Volume II
Table 4.1.2: Prevalence of current drinker (≥18 years old) by socio-demographic characteristics
Sociodemographic Characteristics
Count Estimated Population
Prevalence (%)
95% CI
Lower Upper
MALAYSIA 1,065 1,690,178 8.4 7.4 9.5
Location
Urban 730 1,381,871 9.0 7.8 10.3
Rural 335 308,308 6.4 5.0 8.2
Sex
Male 795 1,266,275 12.1 10.8 13.7
Female 270 423,903 4.3 3.6 5.3
Age Group
15-19 50 85,757 9.0 6.2 12.9
20-24 137 296,087 10.4 8.4 12.8
25-29 134 303,490 10.9 8.7 13.6
30-34 145 243,632 9.3 7.5 11.4
35-39 134 199,359 9.6 7.6 12.0
40-44 95 148,312 8.0 6.1 10.5
45-49 89 114,437 6.8 5.3 8.9
50-54 108 134,926 9.0 7.0 11.4
55-59 68 66,350 5.2 3.9 7.1
60-64 51 48,287 5.2 3.6 7.3
65-69* 28 23,655 3.4 2.0 5.9
70-74* 11 11,709 2.9 1.4 6.0
75+* 15 14,175 2.5 1.3 4.6
Ethnicity
Malays* 26 39,265 0.4 0.2 0.7
Chinese 542 908,907 19.2 16.6 22.1
Indians 142 154,190 11.2 9.0 14.0
Other Bumiputras 299 467,234 21.6 17.6 26.3
Others 56 120,582 6.0 4.3 8.3
Marital Status
Single 328 687,000 12.2 10.2 14.4
Married 692 952,064 7.2 6.4 8.3
Widow/widower/divorcee 45 51,114 3.6 2.6 5.2
Education Level
No formal education* 16 14,033 1.2 0.7 2.2
Primary education 197 254,447 6.2 5.2 7.4
Secondary education 554 824,616 8.8 7.6 10.2
Tertiary education 284 576,768 10.9 9.1 13.1
Unclassified education* 13 20,214 7.3 3.7 13.9
Note: * Data need to be interpret with caution

NATIONAL HEALTH AND MORBIDITY SURVEY 2015 MINISTRY OF HEALTH MALAYSIA
161
Non-Communicable Diseases, Risk Factors & Other Health Problems Volume II
Sociodemographic Characteristics
Count Estimated Population
Prevalence (%)
95% CI
Lower Upper
Occupation
Government/semi government employee
61 95,247 5.0 3.5 7.0
Private employee 511 947,964 11.8 10.2 13.7
Self employed 264 310,401 9.1 7.6 12.0
Unpaid worker/home maker 77 97,504 3.4 2.5 4.6
Retiree 33 35,800 5.9 3.9 8.9
Income Group
Less than RM 1000 119 159,596 5.8 4.6 7.5
RM 1000 - RM 1999 139 208,077 6.3 5.0 7.8
RM 2000 - RM 2999 143 205,870 6.3 4.6 8.7
RM 3000 - RM 3999 145 240,463 9.2 7.2 11.9
RM 4000 - RM 4999 102 148,590 7.5 5.4 10.2
RM 5000 - RM 5999 89 182,801 11.5 8.5 15.4
RM 6000 - RM 6999 75 134,619 12.8 9.1 17.9
RM 7000 - RM 7999 71 106,886 13.1 9.3 18.1
RM 8000 - RM 8999* 32 45,496 6.6 3.8 11.4
RM 9000 - RM 9999* 18 31,921 9.0 4.9 15.8
RM 10000 & above 132 225,861 12.6 9.6 16.4
Quintile Income Group
Quintile 1 105 142,294 6.1 4.6 7.9
Quintile 2 147 217,541 6.3 5.1 7.9
Quintile 3 198 306,331 7.4 5.7 9.5
Quintile 4 235 371,999 8.4 6.8 10.4
Quintile 5 380 652,013 11.2 9.3 13.4
Note: * Data need to be interpret with caution
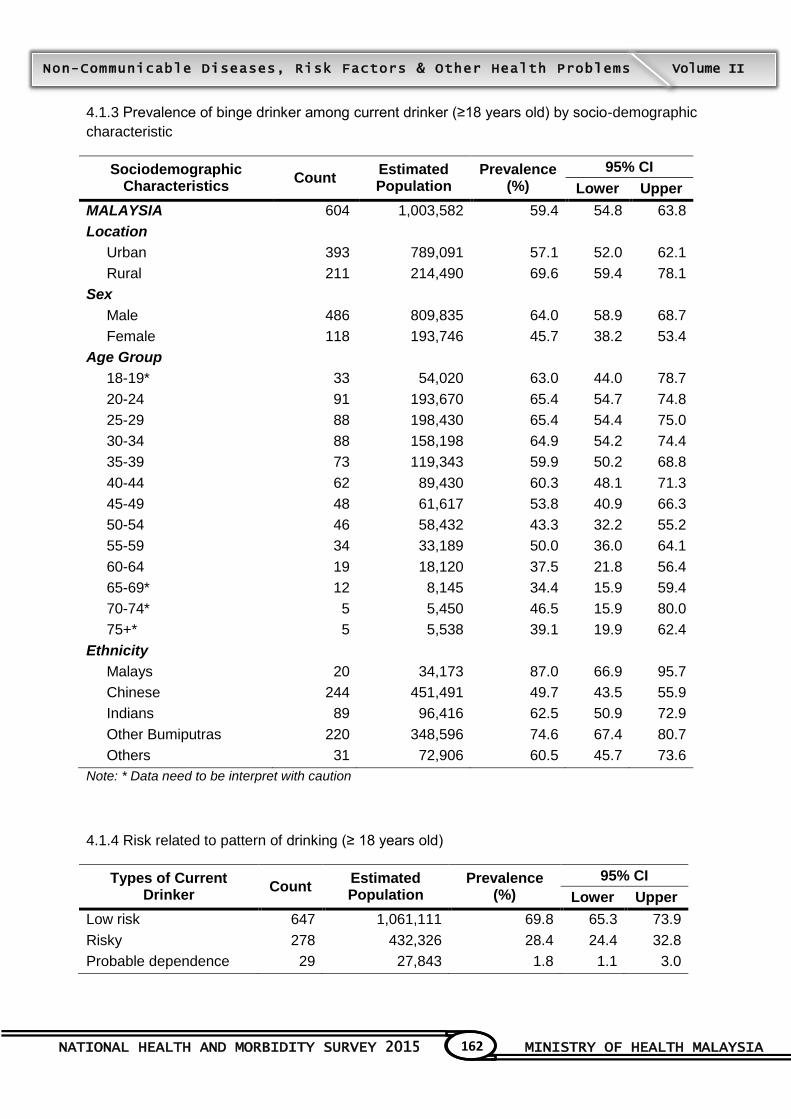
NATIONAL HEALTH AND MORBIDITY SURVEY 2015 MINISTRY OF HEALTH MALAYSIA
162
Non-Communicable Diseases, Risk Factors & Other Health Problems Volume II
4.1.3 Prevalence of binge drinker among current drinker (≥18 years old) by socio-demographic
characteristic
Sociodemographic Characteristics
Count Estimated Population
Prevalence (%)
95% CI
Lower Upper
MALAYSIA 604 1,003,582 59.4 54.8 63.8
Location
Urban 393 789,091 57.1 52.0 62.1
Rural 211 214,490 69.6 59.4 78.1
Sex
Male 486 809,835 64.0 58.9 68.7
Female 118 193,746 45.7 38.2 53.4
Age Group
18-19* 33 54,020 63.0 44.0 78.7
20-24 91 193,670 65.4 54.7 74.8
25-29 88 198,430 65.4 54.4 75.0
30-34 88 158,198 64.9 54.2 74.4
35-39 73 119,343 59.9 50.2 68.8
40-44 62 89,430 60.3 48.1 71.3
45-49 48 61,617 53.8 40.9 66.3
50-54 46 58,432 43.3 32.2 55.2
55-59 34 33,189 50.0 36.0 64.1
60-64 19 18,120 37.5 21.8 56.4
65-69* 12 8,145 34.4 15.9 59.4
70-74* 5 5,450 46.5 15.9 80.0
75+* 5 5,538 39.1 19.9 62.4
Ethnicity
Malays 20 34,173 87.0 66.9 95.7
Chinese 244 451,491 49.7 43.5 55.9
Indians 89 96,416 62.5 50.9 72.9
Other Bumiputras 220 348,596 74.6 67.4 80.7
Others 31 72,906 60.5 45.7 73.6
Note: * Data need to be interpret with caution
4.1.4 Risk related to pattern of drinking (≥ 18 years old)
Types of Current Drinker
Count Estimated Population
Prevalence (%)
95% CI
Lower Upper
Low risk 647 1,061,111 69.8 65.3 73.9
Risky 278 432,326 28.4 24.4 32.8
Probable dependence 29 27,843 1.8 1.1 3.0

TOPIC 5

NATIONAL HEALTH AND MORBIDITY SURVEY 2015 MINISTRY OF HEALTH MALAYSIA
164
Non-Communicable Diseases, Risk Factors & Other Health Problems Volume II
5. PHYSICAL ACTIVITY
Contributors to this section: Azahadi Omar, Khoo Yi Yi, Chan Ying Ying, Cheong Siew Man, Azli
Baharudin, Chandrika Jeevenathan, Lim Kuang Kuay
5.1 Background
The World Health Organization (WHO) defines physical activity as any bodily movement produced
by skeletal muscles that requires energy expenditure. This includes activities undertaken while
working, playing, carrying out household chores, travelling and engaging in recreational pursuits.
Physical inactivity has been identified as the fourth leading risk factor for global mortality (6% of
deaths globally), after high blood pressure (13%), tobacco use (9%) and high blood glucose (6%).
Insufficient physical activity is on the rise in many countries, adding to the burden of non-
communicable diseases (NCDs) and affecting general health worldwide. People who are
insufficiently active have a 20% to 30% increased risk of death compared to people who are
sufficiently active.
5.2 Objectives
5.2.1 General Objective
To determine the prevalence of physical activity in Malaysian adults.
5.2.2 Specific Objectives
To determine the prevalence of overall physical activity by socio-demographic
characteristics.
To determine the prevalence of different levels of physical activity [„HEPA active‟ (health-
enhancing physical activity; a highly active category), „minimally active‟ and „inactive‟] by
socio-demographic characteristics.
5.3 Target Population, Study Instrument And Definitions
Data on physical activity was obtained from adult respondents aged 16 years and above through
face-to-face interviews by trained research assistants using the short version of International
Physical Activity Questionnaire (IPAQ). The IPAQ short form asks about three specific types of
activity which include walking, moderate-intensity activities and vigorous intensity activities;
frequency (measured in days per week) and duration (time per day) are collected separately for
each specific type of activity.
Computation of physical activity level requires summation of the duration (in minutes) and
frequency (days) of walking, moderate-intensity and vigorous-intensity activities. Another measure
of volume of activity can be computed by weighting each type of activity by its energy
requirements defined in METS (METs are multiples of the resting metabolic rate) to yield a score
in MET-minutes.
NATIONAL HEALTH AND MORBIDITY SURVEY 2015 MINISTRY OF HEALTH MALAYSIA
165
Non-Communicable Diseases, Risk Factors & Other Health Problems Volume II
There are three levels of physical activity which are categorised as:
5.3.1 Inactive (CATEGORY 1)
This is the lowest level of physical activity. Those individuals who do not meet criteria for
Categories 2 or 3 are considered „insufficiently active‟.
5.3.2 Minimally Active (CATEGORY 2)
The minimum pattern of activity to be classified as „sufficiently active‟ is any one of the
following 3 criteria:
a) 3 or more days of vigorous activity of at least 20 minutes per day OR
b) 5 or more days of moderate-intensity activity or walking of at least 30 minutes per day OR
c) 5 or more days of any combination of walking, moderate-intensity or vigorous intensity
activities achieving a minimum of at least 600 MET-min/week.
5.3.3 HEPA active (CATEGORY 3)
A separate category labelled „HEPA‟ level, which is a more active category can be computed
for people who exceed the minimum public health physical activity recommendations. The two
criteria for classification as „HEPA active‟ are:
a) vigorous-intensity activity on at least 3 days achieving a minimum of at least 1500 MET-
minutes/week OR
b) 7 or more days of any combination of walking, moderate-intensity or vigorous intensity
activities achieving a minimum of at least 3000 MET-minutes/week
5.4 Findings
The overall prevalence of physically active adults was 66.5% (95% CI: 65.6, 67.6). Males [71.1%
(95% CI: 69.7, 72.4] were significantly more active than females [61.7 (95% CI: 60.3, 63.2]. The
level of physical activity increased in adults from the age group of 16-19 years to 40-44 years,
whereby the latter was the most physically active group among all age groups. However, the level
of physical activity gradually decreased with increasing age and this was most apparent in the
elderly. The rural population [71.3% (95% CI: 69.6, 73.0)] reported a significantly higher level of
physical activity compared to the urban population [65.0% (95% CI: 63.7, 66.3)]. The highest
prevalence of physical activity was observed among 'Other ethnics group' [76.5% (95% CI: 73.2,
79.5)], followed by Other Bumiputras [69.0% (95% CI: 65.8, 72.1)], Malays [66.8% (95% CI: 65.5,
68.1)], Indians [66.7% (95% CI: 63.1, 70.1)] and Chinese [60.7% (95% CI: 58.3, 63.1)]. Single
[65.9% (95% CI: 64.0, 67.7)] or married [68.2% (95% CI: 66.9, 69.5)] adults were significantly
more active compared to widow/ widower/ divorcee [53.7% (95% CI: 50.5, 56.8)]. With regards to
the level of education, adults with primary [67.3% (95% CI: 65.4, 69.2)], secondary [68.5% (95%
CI: 67.0, 69.9)] or tertiary education [64.5% (95% CI: 62.6, 66.4)] were found to be more physically
active than those with no formal education [58.3% (95% CI: 54.4, 62.1)]. Self-employed adults
[76.9% (95% CI: 74.9, 78.9)] displayed a significantly higher level of physical activity compared to
those from other occupational categories. The state of Penang [74.5% (95% CI: 70.3, 78.3)]
reported the highest prevalence of physical activity, followed by Kelantan [74.2% (95% CI: 70.6,
77.6)] and Pahang [74.0% (95% CI: 70.6, 77.1)] (Table 5.1.1).
NATIONAL HEALTH AND MORBIDITY SURVEY 2015 MINISTRY OF HEALTH MALAYSIA
166
Non-Communicable Diseases, Risk Factors & Other Health Problems Volume II
Out of 66.5% of physically active adults, 25.4% were HEPA active and 41.1% were minimally
active. Among the HEPA active adults, those who were males, from the rural population, of
'Others' ethnic group and self-employed were significantly more active than their respective
counterparts (Table 5.1.2).
5.5 Conclusion
The prevalence of physical activity among Malaysian adults was relatively high, with a slight
increase from NHMS 2011. However, a majority of adults were only minimally active. Programmes
to promote a better understanding of HEPA that benefits health and functional capacity without
undue harm or risk are recommended, especially among females and those from the urban
population.
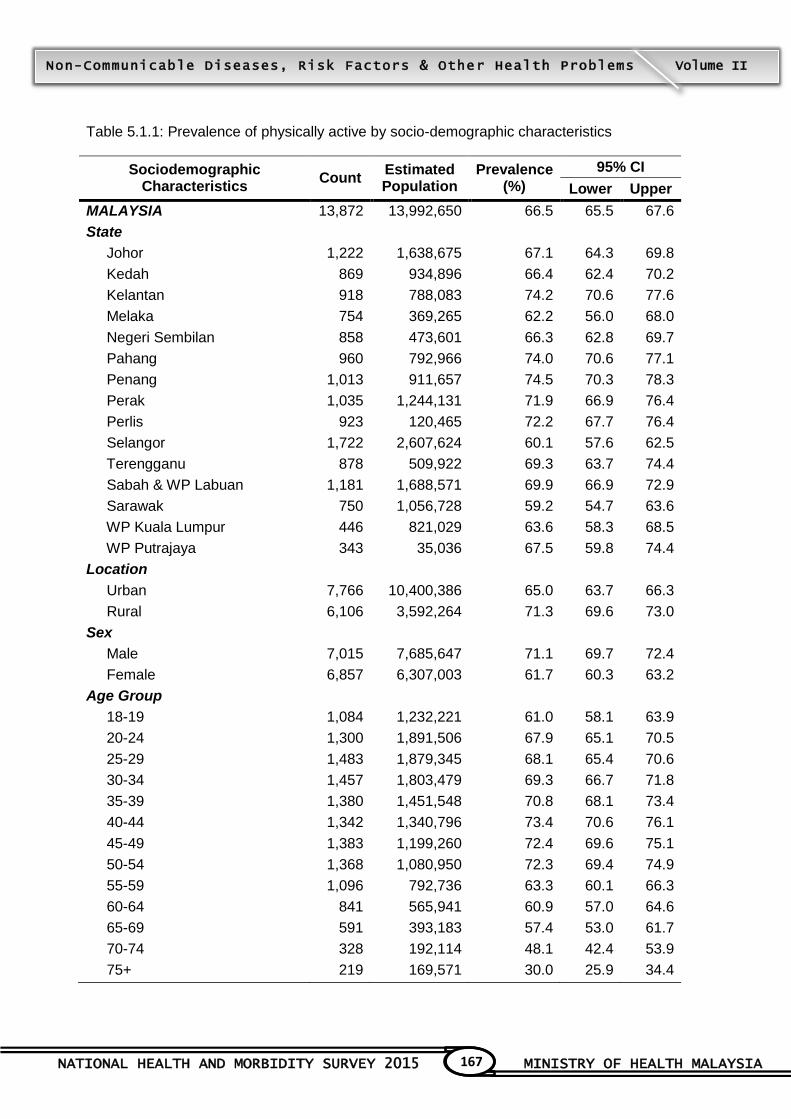
NATIONAL HEALTH AND MORBIDITY SURVEY 2015 MINISTRY OF HEALTH MALAYSIA
167
Non-Communicable Diseases, Risk Factors & Other Health Problems Volume II
Table 5.1.1: Prevalence of physically active by socio-demographic characteristics
Sociodemographic Characteristics
Count Estimated Population
Prevalence (%)
95% CI
Lower Upper
MALAYSIA 13,872 13,992,650 66.5 65.5 67.6
State
Johor 1,222 1,638,675 67.1 64.3 69.8
Kedah 869 934,896 66.4 62.4 70.2
Kelantan 918 788,083 74.2 70.6 77.6
Melaka 754 369,265 62.2 56.0 68.0
Negeri Sembilan 858 473,601 66.3 62.8 69.7
Pahang 960 792,966 74.0 70.6 77.1
Penang 1,013 911,657 74.5 70.3 78.3
Perak 1,035 1,244,131 71.9 66.9 76.4
Perlis 923 120,465 72.2 67.7 76.4
Selangor 1,722 2,607,624 60.1 57.6 62.5
Terengganu 878 509,922 69.3 63.7 74.4
Sabah & WP Labuan 1,181 1,688,571 69.9 66.9 72.9
Sarawak 750 1,056,728 59.2 54.7 63.6
WP Kuala Lumpur 446 821,029 63.6 58.3 68.5
WP Putrajaya 343 35,036 67.5 59.8 74.4
Location
Urban 7,766 10,400,386 65.0 63.7 66.3
Rural 6,106 3,592,264 71.3 69.6 73.0
Sex
Male 7,015 7,685,647 71.1 69.7 72.4
Female 6,857 6,307,003 61.7 60.3 63.2
Age Group
18-19 1,084 1,232,221 61.0 58.1 63.9
20-24 1,300 1,891,506 67.9 65.1 70.5
25-29 1,483 1,879,345 68.1 65.4 70.6
30-34 1,457 1,803,479 69.3 66.7 71.8
35-39 1,380 1,451,548 70.8 68.1 73.4
40-44 1,342 1,340,796 73.4 70.6 76.1
45-49 1,383 1,199,260 72.4 69.6 75.1
50-54 1,368 1,080,950 72.3 69.4 74.9
55-59 1,096 792,736 63.3 60.1 66.3
60-64 841 565,941 60.9 57.0 64.6
65-69 591 393,183 57.4 53.0 61.7
70-74 328 192,114 48.1 42.4 53.9
75+ 219 169,571 30.0 25.9 34.4
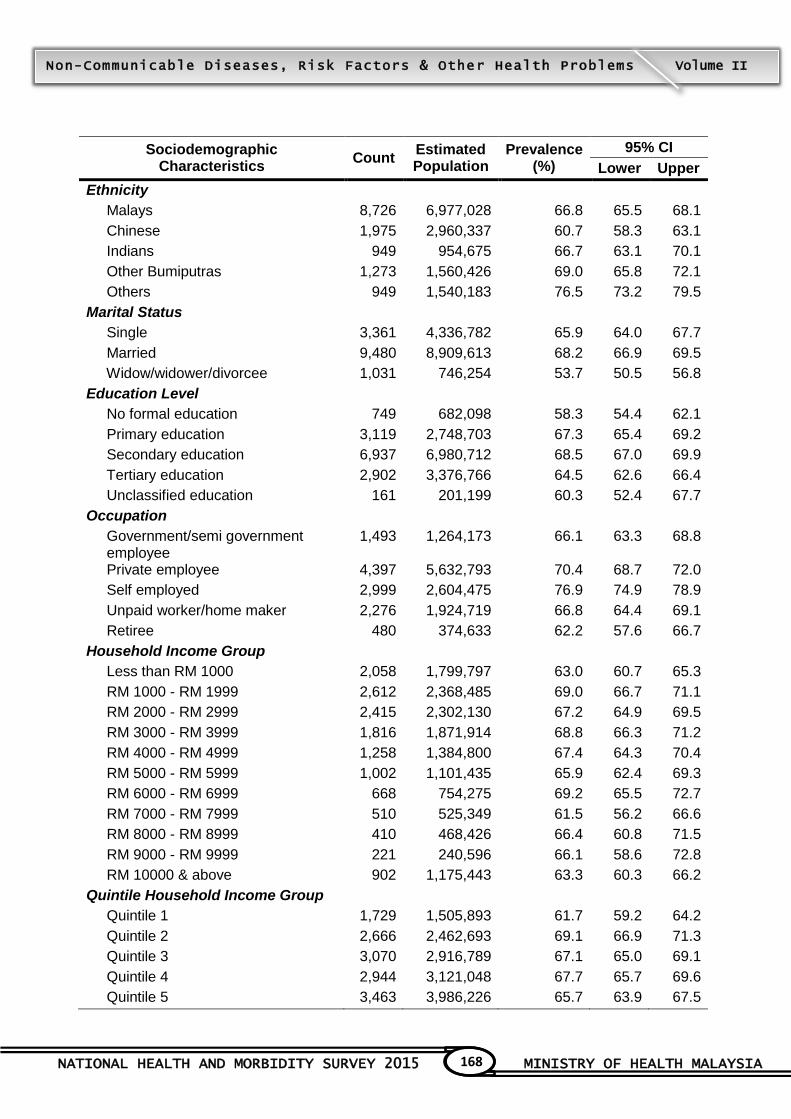
NATIONAL HEALTH AND MORBIDITY SURVEY 2015 MINISTRY OF HEALTH MALAYSIA
168
Non-Communicable Diseases, Risk Factors & Other Health Problems Volume II
Sociodemographic Characteristics
Count Estimated Population
Prevalence (%)
95% CI
Lower Upper
Ethnicity
Malays 8,726 6,977,028 66.8 65.5 68.1
Chinese 1,975 2,960,337 60.7 58.3 63.1
Indians 949 954,675 66.7 63.1 70.1
Other Bumiputras 1,273 1,560,426 69.0 65.8 72.1
Others 949 1,540,183 76.5 73.2 79.5
Marital Status
Single 3,361 4,336,782 65.9 64.0 67.7
Married 9,480 8,909,613 68.2 66.9 69.5
Widow/widower/divorcee 1,031 746,254 53.7 50.5 56.8
Education Level
No formal education 749 682,098 58.3 54.4 62.1
Primary education 3,119 2,748,703 67.3 65.4 69.2
Secondary education 6,937 6,980,712 68.5 67.0 69.9
Tertiary education 2,902 3,376,766 64.5 62.6 66.4
Unclassified education 161 201,199 60.3 52.4 67.7
Occupation
Government/semi government employee
1,493 1,264,173 66.1 63.3 68.8
Private employee 4,397 5,632,793 70.4 68.7 72.0
Self employed 2,999 2,604,475 76.9 74.9 78.9
Unpaid worker/home maker 2,276 1,924,719 66.8 64.4 69.1
Retiree 480 374,633 62.2 57.6 66.7
Household Income Group
Less than RM 1000 2,058 1,799,797 63.0 60.7 65.3
RM 1000 - RM 1999 2,612 2,368,485 69.0 66.7 71.1
RM 2000 - RM 2999 2,415 2,302,130 67.2 64.9 69.5
RM 3000 - RM 3999 1,816 1,871,914 68.8 66.3 71.2
RM 4000 - RM 4999 1,258 1,384,800 67.4 64.3 70.4
RM 5000 - RM 5999 1,002 1,101,435 65.9 62.4 69.3
RM 6000 - RM 6999 668 754,275 69.2 65.5 72.7
RM 7000 - RM 7999 510 525,349 61.5 56.2 66.6
RM 8000 - RM 8999 410 468,426 66.4 60.8 71.5
RM 9000 - RM 9999 221 240,596 66.1 58.6 72.8
RM 10000 & above 902 1,175,443 63.3 60.3 66.2
Quintile Household Income Group
Quintile 1 1,729 1,505,893 61.7 59.2 64.2
Quintile 2 2,666 2,462,693 69.1 66.9 71.3
Quintile 3 3,070 2,916,789 67.1 65.0 69.1
Quintile 4 2,944 3,121,048 67.7 65.7 69.6
Quintile 5 3,463 3,986,226 65.7 63.9 67.5
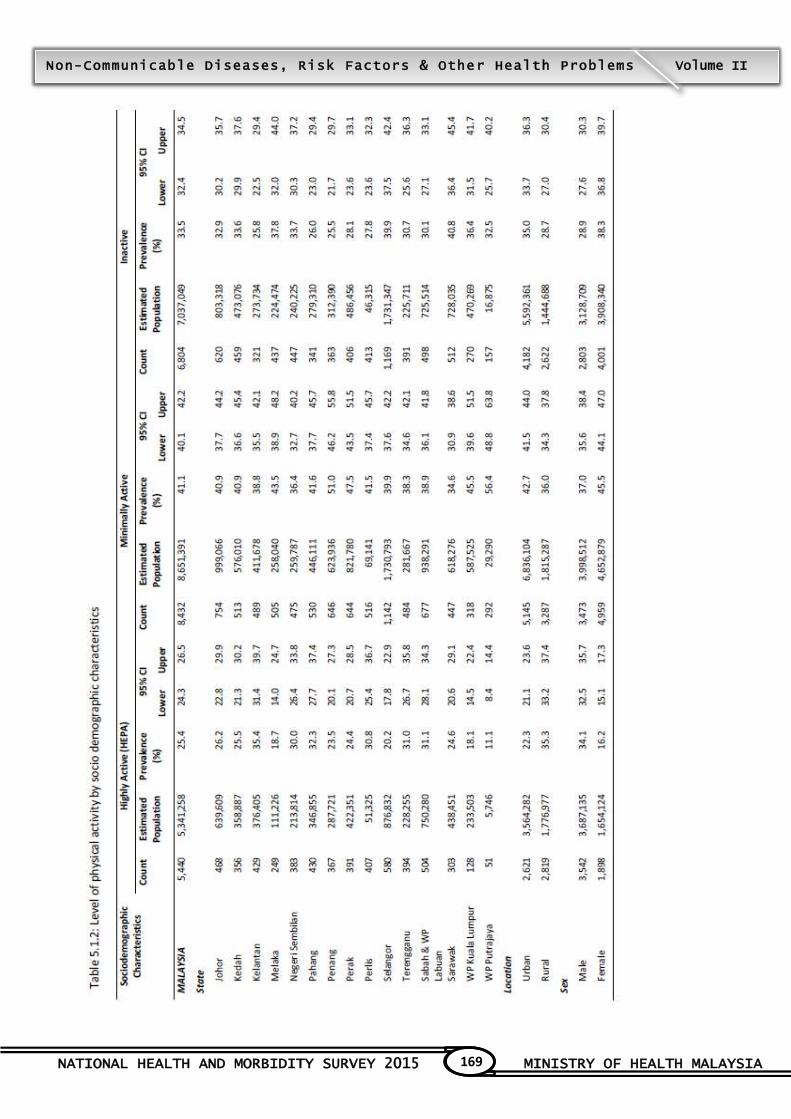
NATIONAL HEALTH AND MORBIDITY SURVEY 2015 MINISTRY OF HEALTH MALAYSIA
169
Non-Communicable Diseases, Risk Factors & Other Health Problems Volume II

NATIONAL HEALTH AND MORBIDITY SURVEY 2015 MINISTRY OF HEALTH MALAYSIA
170
Non-Communicable Diseases, Risk Factors & Other Health Problems Volume II
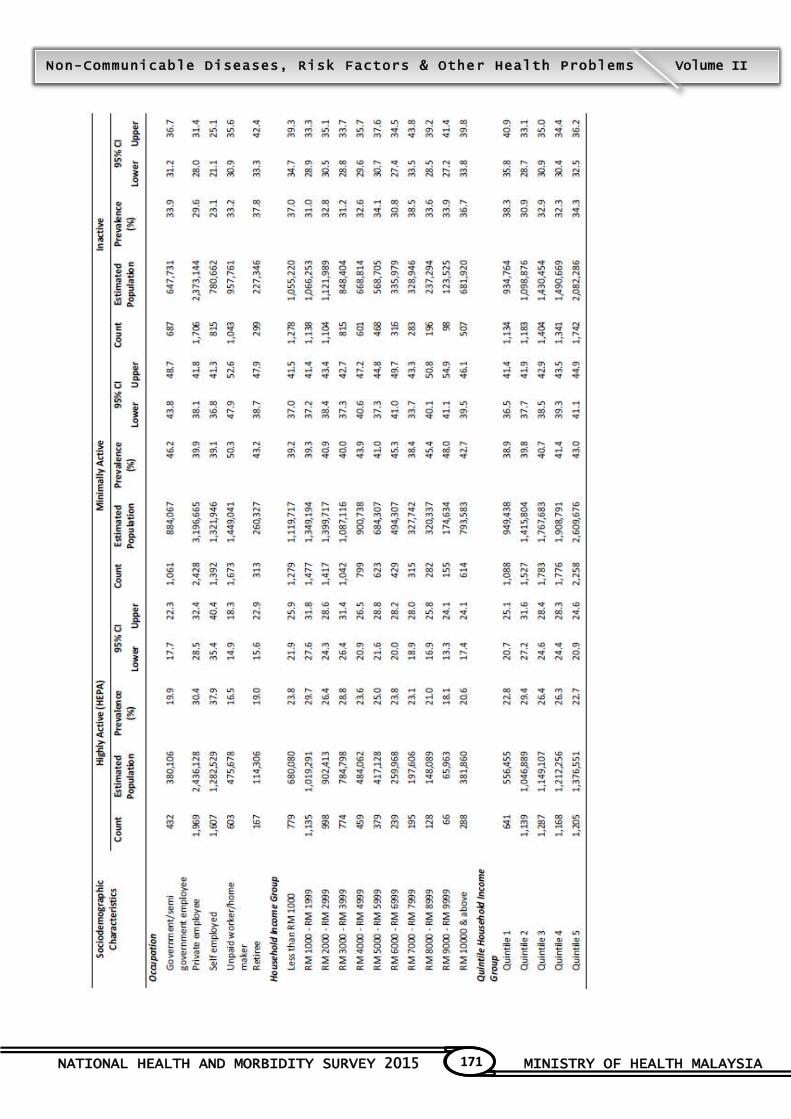
NATIONAL HEALTH AND MORBIDITY SURVEY 2015 MINISTRY OF HEALTH MALAYSIA
171
Non-Communicable Diseases, Risk Factors & Other Health Problems Volume II

TOPIC 6

NATIONAL HEALTH AND MORBIDITY SURVEY 2015 MINISTRY OF HEALTH MALAYSIA
173
Non-Communicable Diseases, Risk Factors & Other Health Problems Volume II
6. DIETARY PRACTICE
Contributors to this section: Nor Azian Mohd Zaki, Fatimah Othman, Nur Shahida Abd Aziz,
Cheong Siew Man, Azli Baharudin, Mohamad Hasnan Ahmad, Rashidah Ambak, Noor Safiza
Mohd Nor, Rusidah Selamat, Norlida Zulkafly
6.1 Background
Adequate intake of fruit and vegetable is essential for a good health. The various components of
nutrients, antioxidants and plant bioactive compounds have shown to lower the incidence of
diabetes, cardiovascular diseases and obesity.
Previous NHMS 2011 findings had shown that only 7.5% of Malaysian adult consumed adequate
five servings of fruits and/or vegetables daily based on the World Health Organization (WHO)
recommendation. It is recommended to consume plain water adequately as it is the core chemical
constituent in the human body. Finding from Malaysian Adult Nutrition Survey (MANS, 2003) had
shown that the average consumption of plain water by Malaysian adult was 1.5 liters or 6 glasses
per day. Based on those findings, Malaysian adults were still at risk for inadequate fruits and
vegetables as well as plain water intake. Therefore, there is a need to monitor the trend of fruits,
vegetables and plain water intake to raise the public‟s awareness of healthy dietary practices in
preventing chronic diseases.
6.2 Objectives
6.2.1 General Objective
To determine the adequacy of fruit, vegetable and plain water intake among Malaysian
adults
6.2.2 Specific objectives
a. To determine adequacy of fruit intake among Malaysian adults
b. To determine adequacy of vegetable intake among Malaysian adults
c. To determine adequacy of plain water intake among Malaysian adults
6.3 Target Population, Study Instrument And Definitions
Data on dietary practice was gathered from Malaysian adult respondents aged 18 years and
above. Respondents were asked on the quantity of fruit and vegetable they consumed in the
previous week. They were also asked on the daily consumption of plain water in glass unit using
validated questionnaires.
Adequate intake was defined as consuming at least 5 servings of fruits and vegetables per day,
with at least 2 servings of fruits per day, ≥ 3 servings of vegetable per day and ≥ 6 glasses of plain
water per day (WHO, 2003 & Malaysian Dietary Guidelines, 2010).
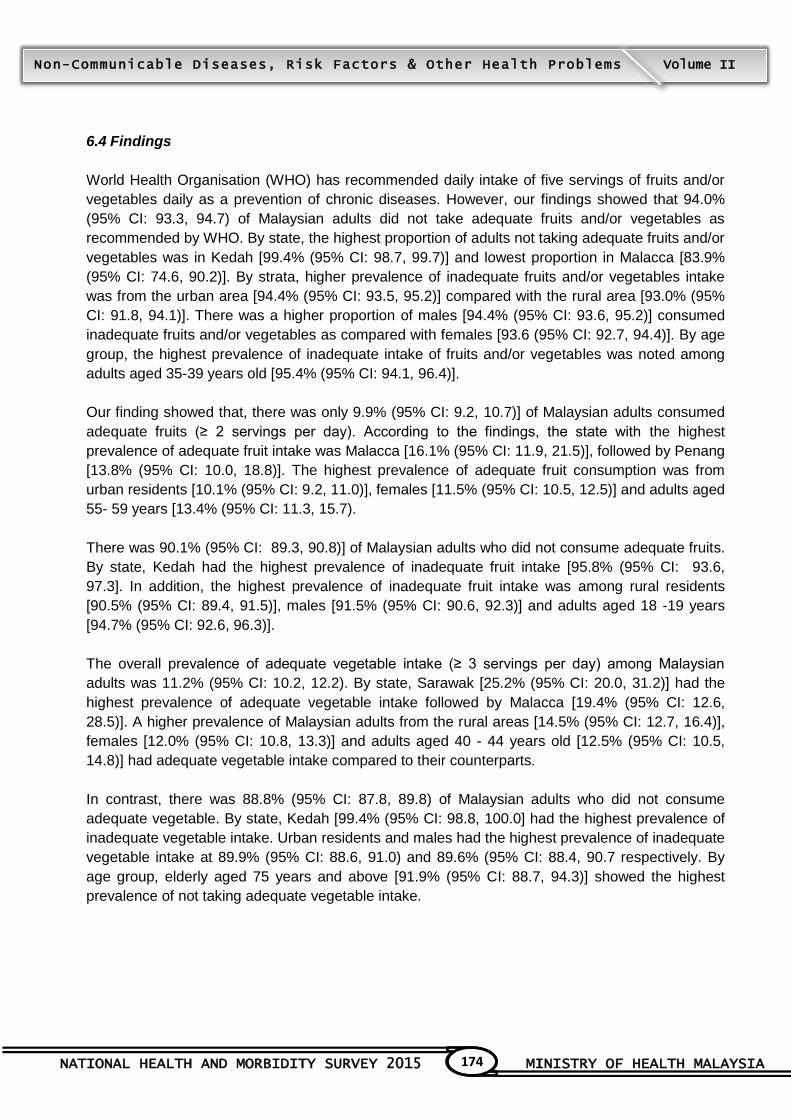
NATIONAL HEALTH AND MORBIDITY SURVEY 2015 MINISTRY OF HEALTH MALAYSIA
174
Non-Communicable Diseases, Risk Factors & Other Health Problems Volume II
6.4 Findings
World Health Organisation (WHO) has recommended daily intake of five servings of fruits and/or
vegetables daily as a prevention of chronic diseases. However, our findings showed that 94.0%
(95% CI: 93.3, 94.7) of Malaysian adults did not take adequate fruits and/or vegetables as
recommended by WHO. By state, the highest proportion of adults not taking adequate fruits and/or
vegetables was in Kedah [99.4% (95% CI: 98.7, 99.7)] and lowest proportion in Malacca [83.9%
(95% CI: 74.6, 90.2)]. By strata, higher prevalence of inadequate fruits and/or vegetables intake
was from the urban area [94.4% (95% CI: 93.5, 95.2)] compared with the rural area [93.0% (95%
CI: 91.8, 94.1)]. There was a higher proportion of males [94.4% (95% CI: 93.6, 95.2)] consumed
inadequate fruits and/or vegetables as compared with females [93.6 (95% CI: 92.7, 94.4)]. By age
group, the highest prevalence of inadequate intake of fruits and/or vegetables was noted among
adults aged 35-39 years old [95.4% (95% CI: 94.1, 96.4)].
Our finding showed that, there was only 9.9% (95% CI: 9.2, 10.7)] of Malaysian adults consumed
adequate fruits (≥ 2 servings per day). According to the findings, the state with the highest
prevalence of adequate fruit intake was Malacca [16.1% (95% CI: 11.9, 21.5)], followed by Penang
[13.8% (95% CI: 10.0, 18.8)]. The highest prevalence of adequate fruit consumption was from
urban residents [10.1% (95% CI: 9.2, 11.0)], females [11.5% (95% CI: 10.5, 12.5)] and adults aged
55- 59 years [13.4% (95% CI: 11.3, 15.7).
There was 90.1% (95% CI: 89.3, 90.8)] of Malaysian adults who did not consume adequate fruits.
By state, Kedah had the highest prevalence of inadequate fruit intake [95.8% (95% CI: 93.6,
97.3]. In addition, the highest prevalence of inadequate fruit intake was among rural residents
[90.5% (95% CI: 89.4, 91.5)], males [91.5% (95% CI: 90.6, 92.3)] and adults aged 18 -19 years
[94.7% (95% CI: 92.6, 96.3)].
The overall prevalence of adequate vegetable intake (≥ 3 servings per day) among Malaysian
adults was 11.2% (95% CI: 10.2, 12.2). By state, Sarawak [25.2% (95% CI: 20.0, 31.2)] had the
highest prevalence of adequate vegetable intake followed by Malacca [19.4% (95% CI: 12.6,
28.5)]. A higher prevalence of Malaysian adults from the rural areas [14.5% (95% CI: 12.7, 16.4)],
females [12.0% (95% CI: 10.8, 13.3)] and adults aged 40 - 44 years old [12.5% (95% CI: 10.5,
14.8)] had adequate vegetable intake compared to their counterparts.
In contrast, there was 88.8% (95% CI: 87.8, 89.8) of Malaysian adults who did not consume
adequate vegetable. By state, Kedah [99.4% (95% CI: 98.8, 100.0] had the highest prevalence of
inadequate vegetable intake. Urban residents and males had the highest prevalence of inadequate
vegetable intake at 89.9% (95% CI: 88.6, 91.0) and 89.6% (95% CI: 88.4, 90.7 respectively. By
age group, elderly aged 75 years and above [91.9% (95% CI: 88.7, 94.3)] showed the highest
prevalence of not taking adequate vegetable intake.
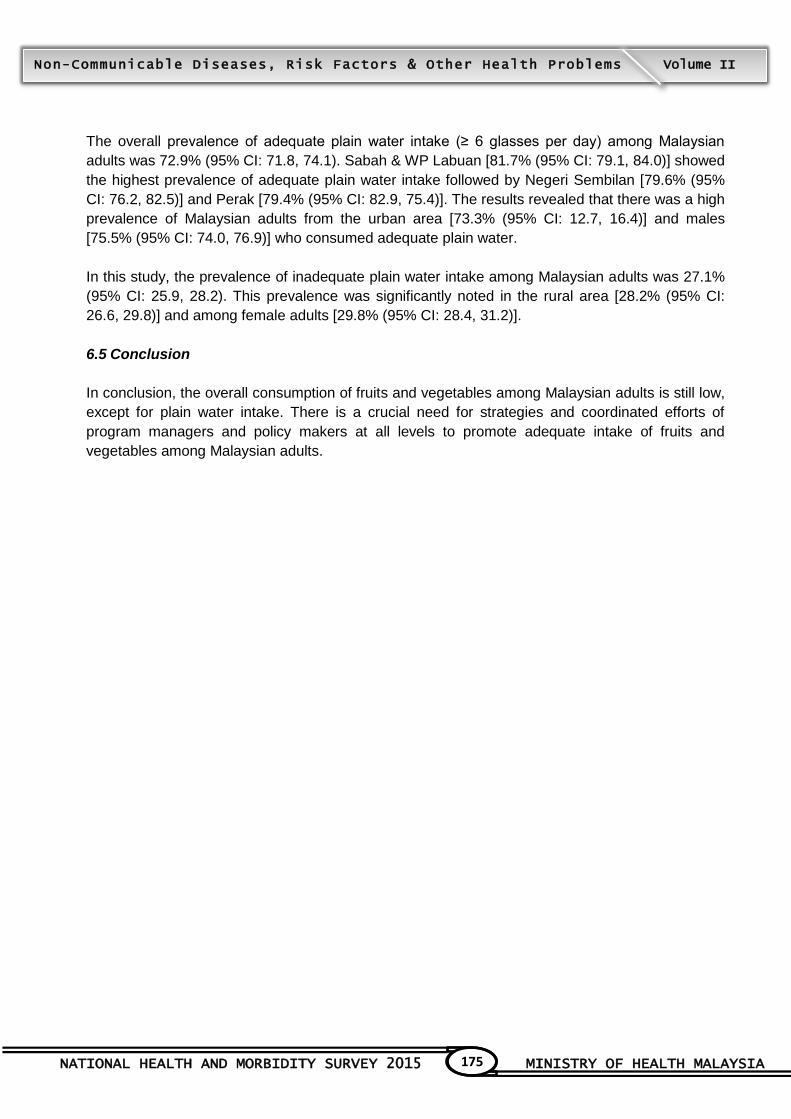
NATIONAL HEALTH AND MORBIDITY SURVEY 2015 MINISTRY OF HEALTH MALAYSIA
175
Non-Communicable Diseases, Risk Factors & Other Health Problems Volume II
The overall prevalence of adequate plain water intake (≥ 6 glasses per day) among Malaysian
adults was 72.9% (95% CI: 71.8, 74.1). Sabah & WP Labuan [81.7% (95% CI: 79.1, 84.0)] showed
the highest prevalence of adequate plain water intake followed by Negeri Sembilan [79.6% (95%
CI: 76.2, 82.5)] and Perak [79.4% (95% CI: 82.9, 75.4)]. The results revealed that there was a high
prevalence of Malaysian adults from the urban area [73.3% (95% CI: 12.7, 16.4)] and males
[75.5% (95% CI: 74.0, 76.9)] who consumed adequate plain water.
In this study, the prevalence of inadequate plain water intake among Malaysian adults was 27.1%
(95% CI: 25.9, 28.2). This prevalence was significantly noted in the rural area [28.2% (95% CI:
26.6, 29.8)] and among female adults [29.8% (95% CI: 28.4, 31.2)].
6.5 Conclusion
In conclusion, the overall consumption of fruits and vegetables among Malaysian adults is still low,
except for plain water intake. There is a crucial need for strategies and coordinated efforts of
program managers and policy makers at all levels to promote adequate intake of fruits and
vegetables among Malaysian adults.
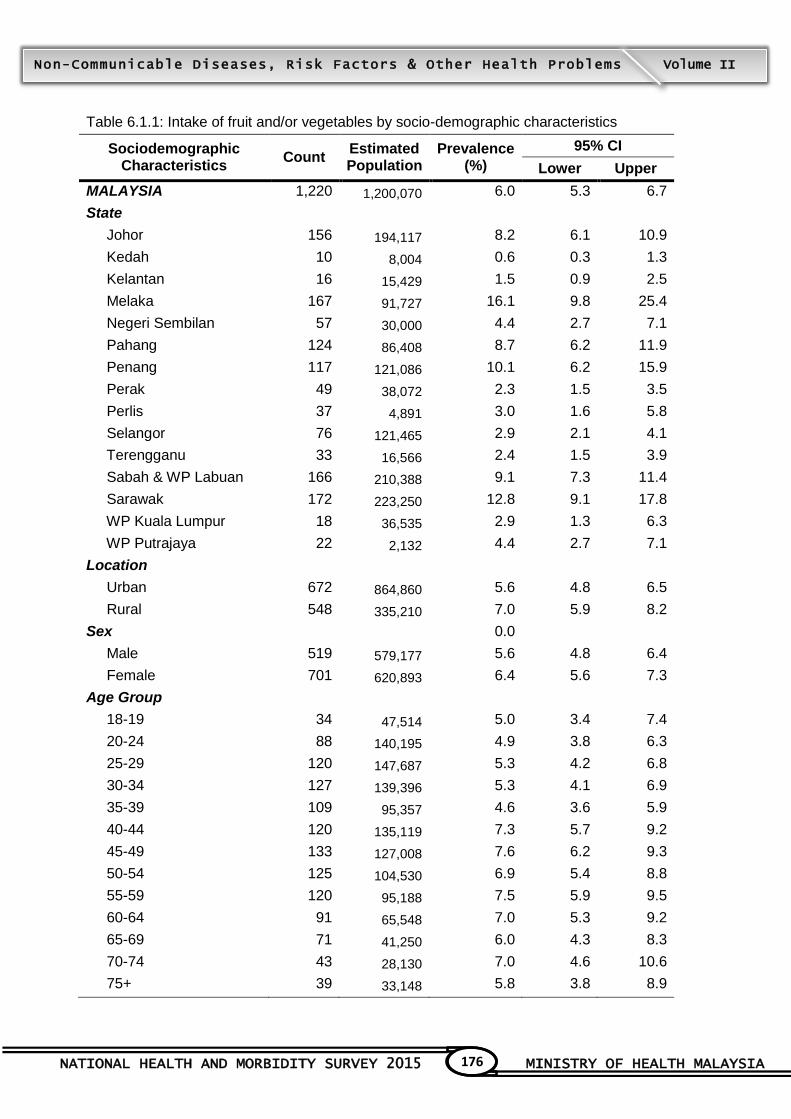
NATIONAL HEALTH AND MORBIDITY SURVEY 2015 MINISTRY OF HEALTH MALAYSIA
176
Non-Communicable Diseases, Risk Factors & Other Health Problems Volume II
Table 6.1.1: Intake of fruit and/or vegetables by socio-demographic characteristics
Sociodemographic Characteristics
Count Estimated Population
Prevalence (%)
95% CI
Lower Upper
MALAYSIA 1,220 1,200,070 6.0 5.3 6.7
State
Johor 156 194,117 8.2 6.1 10.9
Kedah 10 8,004 0.6 0.3 1.3
Kelantan 16 15,429 1.5 0.9 2.5
Melaka 167 91,727 16.1 9.8 25.4
Negeri Sembilan 57 30,000 4.4 2.7 7.1
Pahang 124 86,408 8.7 6.2 11.9
Penang 117 121,086 10.1 6.2 15.9
Perak 49 38,072 2.3 1.5 3.5
Perlis 37 4,891 3.0 1.6 5.8
Selangor 76 121,465 2.9 2.1 4.1
Terengganu 33 16,566 2.4 1.5 3.9
Sabah & WP Labuan 166 210,388 9.1 7.3 11.4
Sarawak 172 223,250 12.8 9.1 17.8
WP Kuala Lumpur 18 36,535 2.9 1.3 6.3
WP Putrajaya 22 2,132 4.4 2.7 7.1
Location
Urban 672 864,860 5.6 4.8 6.5
Rural 548 335,210 7.0 5.9 8.2
Sex
0.0
Male 519 579,177 5.6 4.8 6.4
Female 701 620,893 6.4 5.6 7.3
Age Group
18-19 34 47,514 5.0 3.4 7.4
20-24 88 140,195 4.9 3.8 6.3
25-29 120 147,687 5.3 4.2 6.8
30-34 127 139,396 5.3 4.1 6.9
35-39 109 95,357 4.6 3.6 5.9
40-44 120 135,119 7.3 5.7 9.2
45-49 133 127,008 7.6 6.2 9.3
50-54 125 104,530 6.9 5.4 8.8
55-59 120 95,188 7.5 5.9 9.5
60-64 91 65,548 7.0 5.3 9.2
65-69 71 41,250 6.0 4.3 8.3
70-74 43 28,130 7.0 4.6 10.6
75+ 39 33,148 5.8 3.8 8.9
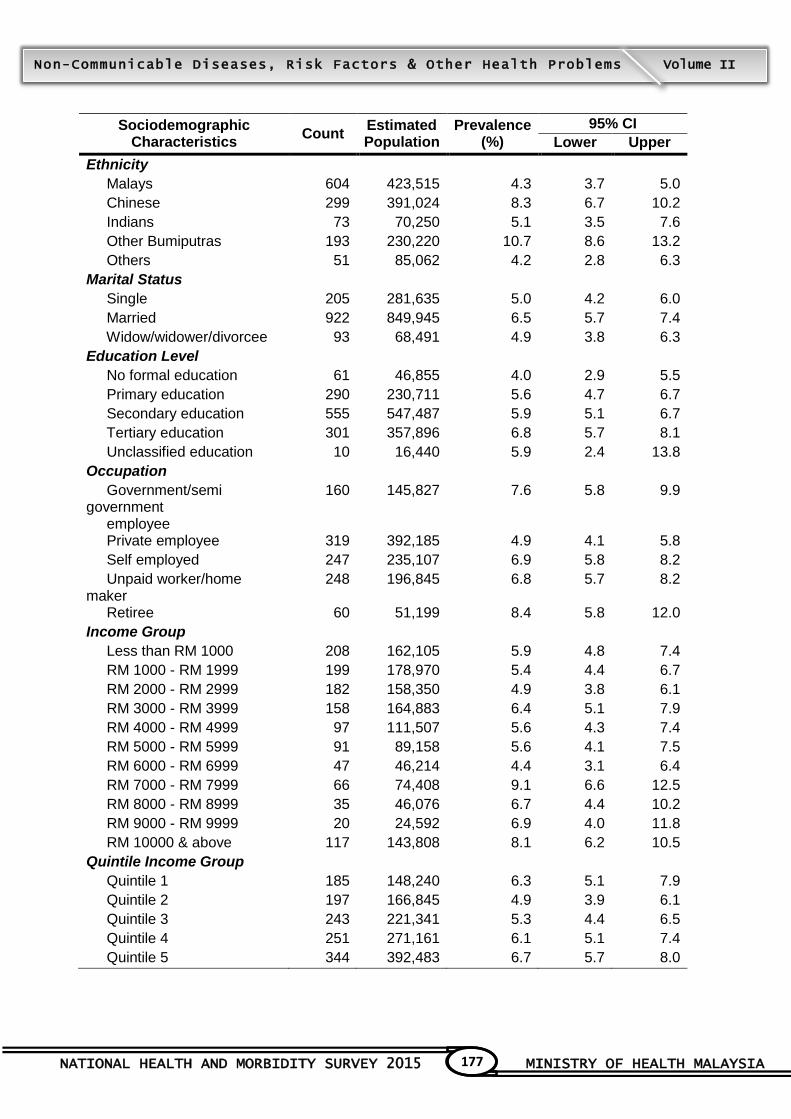
NATIONAL HEALTH AND MORBIDITY SURVEY 2015 MINISTRY OF HEALTH MALAYSIA
177
Non-Communicable Diseases, Risk Factors & Other Health Problems Volume II
Sociodemographic Characteristics
Count Estimated Population
Prevalence (%)
95% CI
Lower Upper
Ethnicity
Malays 604 423,515 4.3 3.7 5.0
Chinese 299 391,024 8.3 6.7 10.2
Indians 73 70,250 5.1 3.5 7.6
Other Bumiputras 193 230,220 10.7 8.6 13.2
Others 51 85,062 4.2 2.8 6.3
Marital Status
Single 205 281,635 5.0 4.2 6.0
Married 922 849,945 6.5 5.7 7.4
Widow/widower/divorcee 93 68,491 4.9 3.8 6.3
Education Level
No formal education 61 46,855 4.0 2.9 5.5
Primary education 290 230,711 5.6 4.7 6.7
Secondary education 555 547,487 5.9 5.1 6.7
Tertiary education 301 357,896 6.8 5.7 8.1
Unclassified education 10 16,440 5.9 2.4 13.8
Occupation
Government/semi government employee
160 145,827 7.6 5.8 9.9
Private employee 319 392,185 4.9 4.1 5.8
Self employed 247 235,107 6.9 5.8 8.2
Unpaid worker/home maker
248 196,845 6.8 5.7 8.2
Retiree 60 51,199 8.4 5.8 12.0
Income Group
Less than RM 1000 208 162,105 5.9 4.8 7.4
RM 1000 - RM 1999 199 178,970 5.4 4.4 6.7
RM 2000 - RM 2999 182 158,350 4.9 3.8 6.1
RM 3000 - RM 3999 158 164,883 6.4 5.1 7.9
RM 4000 - RM 4999 97 111,507 5.6 4.3 7.4
RM 5000 - RM 5999 91 89,158 5.6 4.1 7.5
RM 6000 - RM 6999 47 46,214 4.4 3.1 6.4
RM 7000 - RM 7999 66 74,408 9.1 6.6 12.5
RM 8000 - RM 8999 35 46,076 6.7 4.4 10.2
RM 9000 - RM 9999 20 24,592 6.9 4.0 11.8
RM 10000 & above 117 143,808 8.1 6.2 10.5
Quintile Income Group
Quintile 1 185 148,240 6.3 5.1 7.9
Quintile 2 197 166,845 4.9 3.9 6.1
Quintile 3 243 221,341 5.3 4.4 6.5
Quintile 4 251 271,161 6.1 5.1 7.4
Quintile 5 344 392,483 6.7 5.7 8.0

NATIONAL HEALTH AND MORBIDITY SURVEY 2015 MINISTRY OF HEALTH MALAYSIA
178
Non-Communicable Diseases, Risk Factors & Other Health Problems Volume II
Table 6.1.2: Adequate intake of fruits (≥ 2 servings) by socio-demographic characteristics
Sociodemographic Characteristics
Count Estimated Population
Prevalence (%)
95% CI
Lower Upper
MALAYSIA 2,064 1,998,955 9.9 9.2 10.7
State
Johor 259 311,327 13.2 11.0 15.8
Kedah 62 55,258 4.2 2.7 6.4
Kelantan 105 89,587 8.9 6.7 11.7
Melaka 176 91,343 16.1 11.9 21.5
Negeri Sembilan 108 67,209 9.9 7.0 13.8
Pahang 129 98,669 9.9 7.6 12.9
Penang 189 165,787 13.8 10.0 18.8
Perak 118 106,284 6.4 4.6 8.9
Perlis 130 15,228 9.5 7.1 12.6
Selangor 246 381,835 9.1 7.5 11.1
Terengganu 88 48,021 7.0 5.4 9.2
Sabah & WP Labuan 211 281,127 12.2 10.0 14.9
Sarawak 148 188,768 10.9 9.1 13.1
WP Kuala Lumpur 57 94,450 7.6 5.2 10.9
WP Putrajaya 38 4,060 8.4 5.1 13.4
Location
Urban 1,228 1,544,801 10.1 9.2 11.0
Rural 836 454,154 9.5 8.5 10.6
Sex
Male 858 881,250 8.5 7.7 9.4
Female 1,206 1,117,706 11.5 10.5 12.5
Age Group
18-19 44 49,833 5.3 3.7 7.4
20-24 146 224,253 7.9 6.5 9.6
25-29 213 274,149 9.9 8.4 11.6
30-34 206 229,199 8.8 7.3 10.5
35-39 168 151,034 7.3 6.0 8.8
40-44 183 208,037 11.3 9.3 13.7
45-49 216 190,866 11.4 9.7 13.4
50-54 254 200,225 13.3 11.4 15.4
55-59 209 168,452 13.4 11.3 15.7
60-64 172 117,830 12.6 10.4 15.2
65-69 117 85,218 12.4 9.8 15.6
70-74 66 39,225 9.8 7.1 13.4
75+ 70 60,635 10.7 8.0 14.1
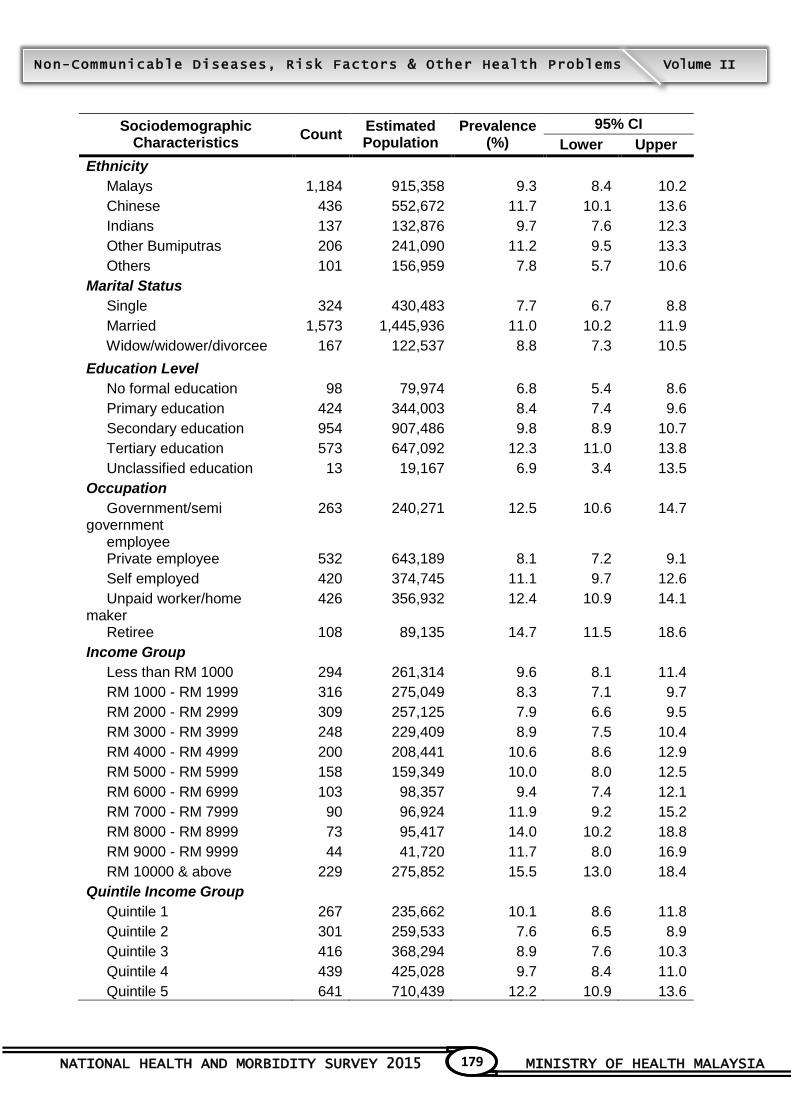
NATIONAL HEALTH AND MORBIDITY SURVEY 2015 MINISTRY OF HEALTH MALAYSIA
179
Non-Communicable Diseases, Risk Factors & Other Health Problems Volume II
Sociodemographic Characteristics
Count Estimated Population
Prevalence (%)
95% CI
Lower Upper
Ethnicity
Malays 1,184 915,358 9.3 8.4 10.2
Chinese 436 552,672 11.7 10.1 13.6
Indians 137 132,876 9.7 7.6 12.3
Other Bumiputras 206 241,090 11.2 9.5 13.3
Others 101 156,959 7.8 5.7 10.6
Marital Status
Single 324 430,483 7.7 6.7 8.8
Married 1,573 1,445,936 11.0 10.2 11.9
Widow/widower/divorcee 167 122,537 8.8 7.3 10.5
Education Level
No formal education 98 79,974 6.8 5.4 8.6
Primary education 424 344,003 8.4 7.4 9.6
Secondary education 954 907,486 9.8 8.9 10.7
Tertiary education 573 647,092 12.3 11.0 13.8
Unclassified education 13 19,167 6.9 3.4 13.5
Occupation
Government/semi government employee
263 240,271 12.5 10.6 14.7
Private employee 532 643,189 8.1 7.2 9.1
Self employed 420 374,745 11.1 9.7 12.6
Unpaid worker/home maker
426 356,932 12.4 10.9 14.1
Retiree 108 89,135 14.7 11.5 18.6
Income Group
Less than RM 1000 294 261,314 9.6 8.1 11.4
RM 1000 - RM 1999 316 275,049 8.3 7.1 9.7
RM 2000 - RM 2999 309 257,125 7.9 6.6 9.5
RM 3000 - RM 3999 248 229,409 8.9 7.5 10.4
RM 4000 - RM 4999 200 208,441 10.6 8.6 12.9
RM 5000 - RM 5999 158 159,349 10.0 8.0 12.5
RM 6000 - RM 6999 103 98,357 9.4 7.4 12.1
RM 7000 - RM 7999 90 96,924 11.9 9.2 15.2
RM 8000 - RM 8999 73 95,417 14.0 10.2 18.8
RM 9000 - RM 9999 44 41,720 11.7 8.0 16.9
RM 10000 & above 229 275,852 15.5 13.0 18.4
Quintile Income Group
Quintile 1 267 235,662 10.1 8.6 11.8
Quintile 2 301 259,533 7.6 6.5 8.9
Quintile 3 416 368,294 8.9 7.6 10.3
Quintile 4 439 425,028 9.7 8.4 11.0
Quintile 5 641 710,439 12.2 10.9 13.6
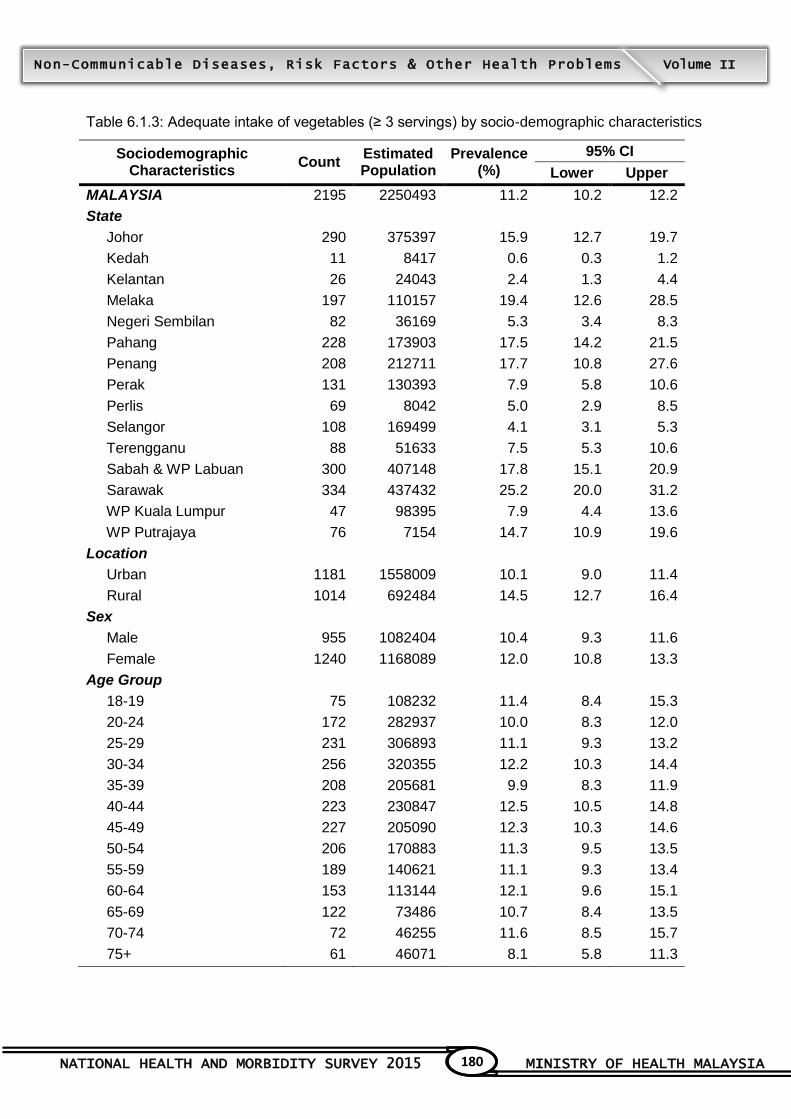
NATIONAL HEALTH AND MORBIDITY SURVEY 2015 MINISTRY OF HEALTH MALAYSIA
180
Non-Communicable Diseases, Risk Factors & Other Health Problems Volume II
Table 6.1.3: Adequate intake of vegetables (≥ 3 servings) by socio-demographic characteristics
Sociodemographic Characteristics
Count Estimated Population
Prevalence (%)
95% CI
Lower Upper
MALAYSIA 2195 2250493 11.2 10.2 12.2
State
Johor 290 375397 15.9 12.7 19.7
Kedah 11 8417 0.6 0.3 1.2
Kelantan 26 24043 2.4 1.3 4.4
Melaka 197 110157 19.4 12.6 28.5
Negeri Sembilan 82 36169 5.3 3.4 8.3
Pahang 228 173903 17.5 14.2 21.5
Penang 208 212711 17.7 10.8 27.6
Perak 131 130393 7.9 5.8 10.6
Perlis 69 8042 5.0 2.9 8.5
Selangor 108 169499 4.1 3.1 5.3
Terengganu 88 51633 7.5 5.3 10.6
Sabah & WP Labuan 300 407148 17.8 15.1 20.9
Sarawak 334 437432 25.2 20.0 31.2
WP Kuala Lumpur 47 98395 7.9 4.4 13.6
WP Putrajaya 76 7154 14.7 10.9 19.6
Location
Urban 1181 1558009 10.1 9.0 11.4
Rural 1014 692484 14.5 12.7 16.4
Sex
Male 955 1082404 10.4 9.3 11.6
Female 1240 1168089 12.0 10.8 13.3
Age Group
18-19 75 108232 11.4 8.4 15.3
20-24 172 282937 10.0 8.3 12.0
25-29 231 306893 11.1 9.3 13.2
30-34 256 320355 12.2 10.3 14.4
35-39 208 205681 9.9 8.3 11.9
40-44 223 230847 12.5 10.5 14.8
45-49 227 205090 12.3 10.3 14.6
50-54 206 170883 11.3 9.5 13.5
55-59 189 140621 11.1 9.3 13.4
60-64 153 113144 12.1 9.6 15.1
65-69 122 73486 10.7 8.4 13.5
70-74 72 46255 11.6 8.5 15.7
75+ 61 46071 8.1 5.8 11.3
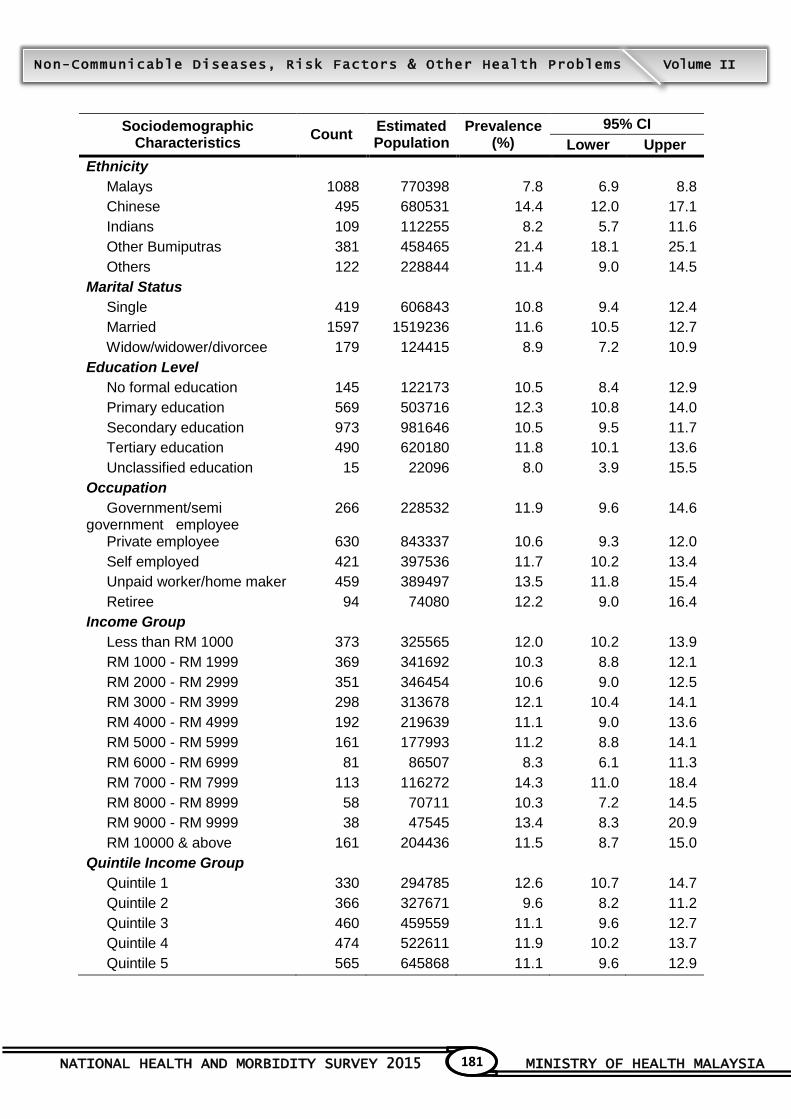
NATIONAL HEALTH AND MORBIDITY SURVEY 2015 MINISTRY OF HEALTH MALAYSIA
181
Non-Communicable Diseases, Risk Factors & Other Health Problems Volume II
Sociodemographic Characteristics
Count Estimated Population
Prevalence (%)
95% CI
Lower Upper
Ethnicity
Malays 1088 770398 7.8 6.9 8.8
Chinese 495 680531 14.4 12.0 17.1
Indians 109 112255 8.2 5.7 11.6
Other Bumiputras 381 458465 21.4 18.1 25.1
Others 122 228844 11.4 9.0 14.5
Marital Status
Single 419 606843 10.8 9.4 12.4
Married 1597 1519236 11.6 10.5 12.7
Widow/widower/divorcee 179 124415 8.9 7.2 10.9
Education Level
No formal education 145 122173 10.5 8.4 12.9
Primary education 569 503716 12.3 10.8 14.0
Secondary education 973 981646 10.5 9.5 11.7
Tertiary education 490 620180 11.8 10.1 13.6
Unclassified education 15 22096 8.0 3.9 15.5
Occupation
Government/semi government employee
266 228532 11.9 9.6 14.6
Private employee 630 843337 10.6 9.3 12.0
Self employed 421 397536 11.7 10.2 13.4
Unpaid worker/home maker 459 389497 13.5 11.8 15.4
Retiree 94 74080 12.2 9.0 16.4
Income Group
Less than RM 1000 373 325565 12.0 10.2 13.9
RM 1000 - RM 1999 369 341692 10.3 8.8 12.1
RM 2000 - RM 2999 351 346454 10.6 9.0 12.5
RM 3000 - RM 3999 298 313678 12.1 10.4 14.1
RM 4000 - RM 4999 192 219639 11.1 9.0 13.6
RM 5000 - RM 5999 161 177993 11.2 8.8 14.1
RM 6000 - RM 6999 81 86507 8.3 6.1 11.3
RM 7000 - RM 7999 113 116272 14.3 11.0 18.4
RM 8000 - RM 8999 58 70711 10.3 7.2 14.5
RM 9000 - RM 9999 38 47545 13.4 8.3 20.9
RM 10000 & above 161 204436 11.5 8.7 15.0
Quintile Income Group
Quintile 1 330 294785 12.6 10.7 14.7
Quintile 2 366 327671 9.6 8.2 11.2
Quintile 3 460 459559 11.1 9.6 12.7
Quintile 4 474 522611 11.9 10.2 13.7
Quintile 5 565 645868 11.1 9.6 12.9
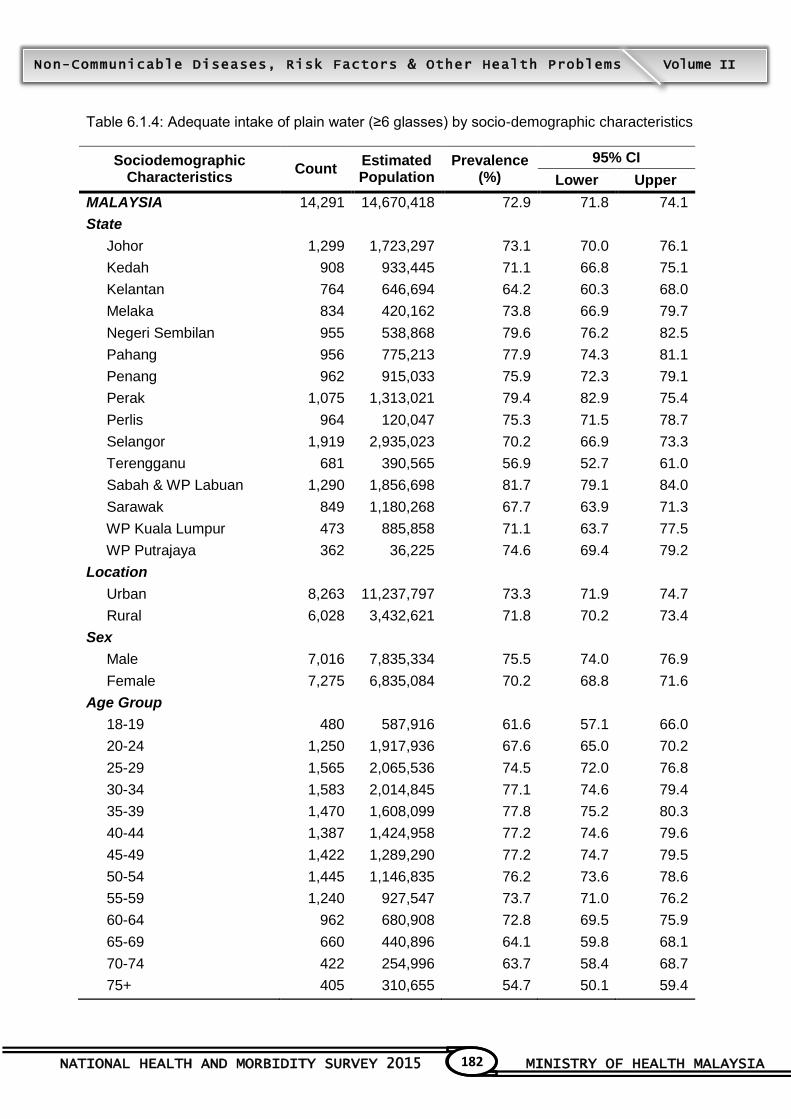
NATIONAL HEALTH AND MORBIDITY SURVEY 2015 MINISTRY OF HEALTH MALAYSIA
182
Non-Communicable Diseases, Risk Factors & Other Health Problems Volume II
Table 6.1.4: Adequate intake of plain water (≥6 glasses) by socio-demographic characteristics
Sociodemographic Characteristics
Count Estimated Population
Prevalence (%)
95% CI
Lower Upper
MALAYSIA 14,291 14,670,418 72.9 71.8 74.1
State
Johor 1,299 1,723,297 73.1 70.0 76.1
Kedah 908 933,445 71.1 66.8 75.1
Kelantan 764 646,694 64.2 60.3 68.0
Melaka 834 420,162 73.8 66.9 79.7
Negeri Sembilan 955 538,868 79.6 76.2 82.5
Pahang 956 775,213 77.9 74.3 81.1
Penang 962 915,033 75.9 72.3 79.1
Perak 1,075 1,313,021 79.4 82.9 75.4
Perlis 964 120,047 75.3 71.5 78.7
Selangor 1,919 2,935,023 70.2 66.9 73.3
Terengganu 681 390,565 56.9 52.7 61.0
Sabah & WP Labuan 1,290 1,856,698 81.7 79.1 84.0
Sarawak 849 1,180,268 67.7 63.9 71.3
WP Kuala Lumpur 473 885,858 71.1 63.7 77.5
WP Putrajaya 362 36,225 74.6 69.4 79.2
Location
Urban 8,263 11,237,797 73.3 71.9 74.7
Rural 6,028 3,432,621 71.8 70.2 73.4
Sex
Male 7,016 7,835,334 75.5 74.0 76.9
Female 7,275 6,835,084 70.2 68.8 71.6
Age Group
18-19 480 587,916 61.6 57.1 66.0
20-24 1,250 1,917,936 67.6 65.0 70.2
25-29 1,565 2,065,536 74.5 72.0 76.8
30-34 1,583 2,014,845 77.1 74.6 79.4
35-39 1,470 1,608,099 77.8 75.2 80.3
40-44 1,387 1,424,958 77.2 74.6 79.6
45-49 1,422 1,289,290 77.2 74.7 79.5
50-54 1,445 1,146,835 76.2 73.6 78.6
55-59 1,240 927,547 73.7 71.0 76.2
60-64 962 680,908 72.8 69.5 75.9
65-69 660 440,896 64.1 59.8 68.1
70-74 422 254,996 63.7 58.4 68.7
75+ 405 310,655 54.7 50.1 59.4
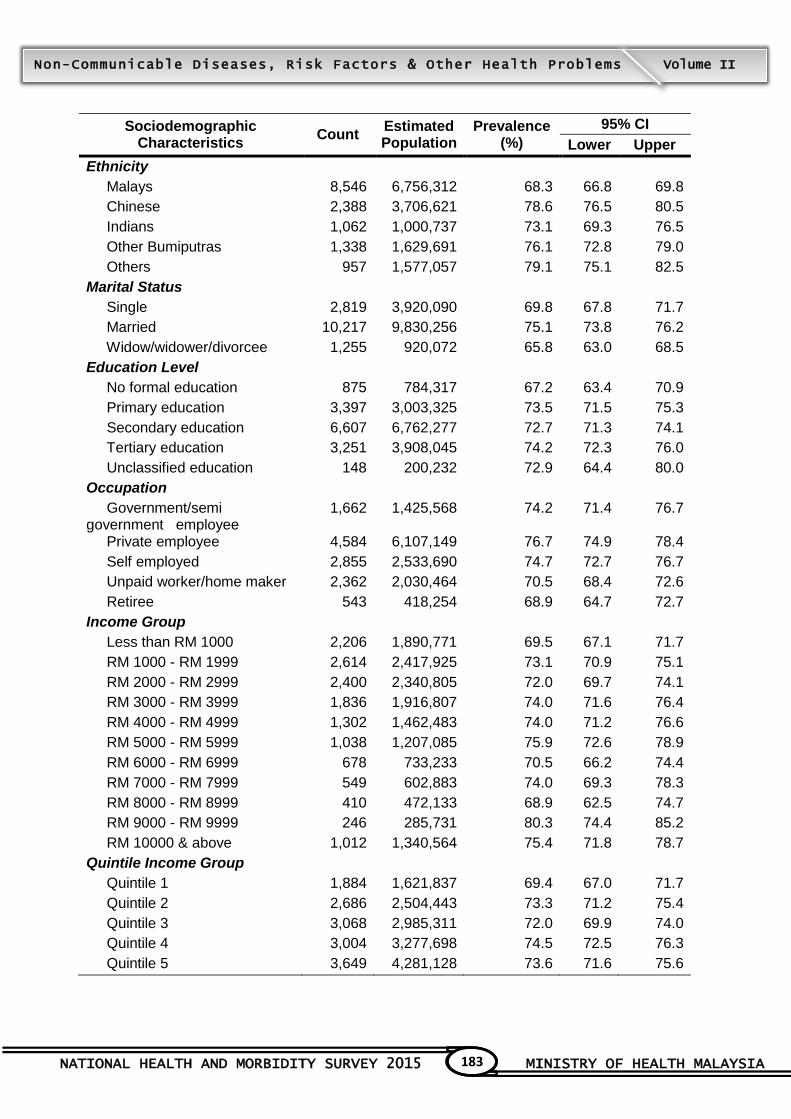
NATIONAL HEALTH AND MORBIDITY SURVEY 2015 MINISTRY OF HEALTH MALAYSIA
183
Non-Communicable Diseases, Risk Factors & Other Health Problems Volume II
Sociodemographic Characteristics
Count Estimated Population
Prevalence (%)
95% CI
Lower Upper
Ethnicity
Malays 8,546 6,756,312 68.3 66.8 69.8
Chinese 2,388 3,706,621 78.6 76.5 80.5
Indians 1,062 1,000,737 73.1 69.3 76.5
Other Bumiputras 1,338 1,629,691 76.1 72.8 79.0
Others 957 1,577,057 79.1 75.1 82.5
Marital Status
Single 2,819 3,920,090 69.8 67.8 71.7
Married 10,217 9,830,256 75.1 73.8 76.2
Widow/widower/divorcee 1,255 920,072 65.8 63.0 68.5
Education Level
No formal education 875 784,317 67.2 63.4 70.9
Primary education 3,397 3,003,325 73.5 71.5 75.3
Secondary education 6,607 6,762,277 72.7 71.3 74.1
Tertiary education 3,251 3,908,045 74.2 72.3 76.0
Unclassified education 148 200,232 72.9 64.4 80.0
Occupation
Government/semi government employee
1,662 1,425,568 74.2 71.4 76.7
Private employee 4,584 6,107,149 76.7 74.9 78.4
Self employed 2,855 2,533,690 74.7 72.7 76.7
Unpaid worker/home maker 2,362 2,030,464 70.5 68.4 72.6
Retiree 543 418,254 68.9 64.7 72.7
Income Group
Less than RM 1000 2,206 1,890,771 69.5 67.1 71.7
RM 1000 - RM 1999 2,614 2,417,925 73.1 70.9 75.1
RM 2000 - RM 2999 2,400 2,340,805 72.0 69.7 74.1
RM 3000 - RM 3999 1,836 1,916,807 74.0 71.6 76.4
RM 4000 - RM 4999 1,302 1,462,483 74.0 71.2 76.6
RM 5000 - RM 5999 1,038 1,207,085 75.9 72.6 78.9
RM 6000 - RM 6999 678 733,233 70.5 66.2 74.4
RM 7000 - RM 7999 549 602,883 74.0 69.3 78.3
RM 8000 - RM 8999 410 472,133 68.9 62.5 74.7
RM 9000 - RM 9999 246 285,731 80.3 74.4 85.2
RM 10000 & above 1,012 1,340,564 75.4 71.8 78.7
Quintile Income Group
Quintile 1 1,884 1,621,837 69.4 67.0 71.7
Quintile 2 2,686 2,504,443 73.3 71.2 75.4
Quintile 3 3,068 2,985,311 72.0 69.9 74.0
Quintile 4 3,004 3,277,698 74.5 72.5 76.3
Quintile 5 3,649 4,281,128 73.6 71.6 75.6


TOPIC 7

NATIONAL HEALTH AND MORBIDITY SURVEY 2015 MINISTRY OF HEALTH MALAYSIA
185
Non-Communicable Diseases, Risk Factors & Other Health Problems Volume II
7. MENTAL HEALTH PROBLEMS OF ADULTS
Contributors to this section: Noor Ani Ahmad, Mohamad Aznuddin Abd Razak, Balkish Mahadir
Naidu, S Maria Awaluddin, Chan Ying Ying, Noraida Mohd Kasim, Rahama Samad, Abd Kadir
Abu Bakar, Azriman Rosman, Lim Chong Hum, Nurashikin Ibrahim
7.1 Background
Mental health problem or psychiatric disorder is defined as disorders of psychological function that
have been systematically described among the clients of psychiatrists.1 Mental health represents a
complex and complicated public health problem, and one which has wide-ranging social and
economic implications, as well as stark consequences for physical health.2 The data from a study
of Health Survey of England (HSE) in 2012 reported that 18% of women and 12% of men had
probable mental health problem using General Health Questionnaire (GHQ-12) with cut-off point of
4.3
Worldwide, the General Health Questionnaire (GHQ) has been used extensively for assessing and
detecting mental health problems in various settings4, 5. A validity study in 1997 reported that the
12-items GHQ (GHQ-12), the shortest version, is robust and works equally well as the longer
instrument as a screening instrument for case detection. Its brevity makes it attractive for use in
busy clinical settings as well as for large-scale epidemiological settings in which study subjects
have diverse backgrounds.6 The application of a standardized measure of the GHQ-12 is useful
for clinicians and researchers in comparing the findings either clinically or particularly for
epidemiologically obtained studies.
The GHQ has now been used in about 38 languages, and over 50 validity studies have been
published. In Malaysia, GHQ12 has been validated for a few times. Prior to the NHMS 1996,
validity study at cut-off point of 2/3 (any respondent with a score of 3 and above were considered a
case) noted sensitivity and specificity of 86% and 85%, respectively.7 Another study done in 2009,
with cut-off score of 3/4 (score equal to or more than 4) noted sensitivity of 81.3%, specificity of
75.3% with positive predictive value of 62.9%.6 National Health and Morbidity Survey 1996, using
GHQ12 as the screening tool noted the prevalence of mental health disorders among adults aged
16 years and above at 10.7% (9.7-11.7).6
For this survey, permission to use this questionnaire was obtained from GL assessment
(Qualification Code: 10641).
7.2 Objectives
7.2.1 General objective
To determine the prevalence of mental health problems among Malaysian Adults
7.2.2 Specific objectives
To determine the prevalence of mental health problem among adults aged 16 years
and above.
To determine the prevalence of mental health problem by socio-demographic profiles.

NATIONAL HEALTH AND MORBIDITY SURVEY 2015 MINISTRY OF HEALTH MALAYSIA
186
Non-Communicable Diseases, Risk Factors & Other Health Problems Volume II
7.3 Target Population, Study Instrument And Definitions
Module S on Mental Health adults were targeted to household members aged 16 years and above
from the randomly selected living quarters. Illiterate respondents or those who cannot understand
either Bahasa Malaysia or English were considered as not eligible.
GHQ12 was administered as self-administered questionnaire in two choice of languages; Bahasa
Malaysia or English. There were 12 statements related to mental health with of four responses for
each statement, in a modified Likert scale which is a graduated scale of positive to negative
responses. The first two options were considered as positive responses and given a score of „0‟,
while the remainder two options were considered as negative options and scored as „1‟.
Incomplete questionnaire (did not answer all items) were considered as not valid for analysis.
For the purpose of analysis and comparison with NHMS 1996, score of 3 and above were
considered as a case or having mental health problem. However, there was a difference in the
methodology between NHMS 1996 and 2015, whereby in the year 1996, GHQ12 was
administered as either self-administered or read-out by interviewer.
7.4 Finding
Out of 29,460 respondents, 20,940 of them were 16 years and above. A total of 3,417 respondents
(16.3%) were considered not eligible to be included in the survey. Reasons for ineligibility were
either illiterate or unable to read and understand Bahasa Malaysia or English. Out of those who
were eligible, 3,161 respondents refused, resulted on response rate of 82%.
Analysis noted that, the prevalence of mental health problem among adults aged 16 years and
above in Malaysia was 29.2% (95% CI: 27.9, 30.5).
By state, the prevalence was highest in Sabah and WP Labuan [42.9% (39.3, 46.7)], followed by
WP Kuala Lumpur [39.8% (4.7, 45.2)], and Kelantan [39.1% (35.1, 43.2)]. There was no significant
difference in the prevalence by locality. By gender, the prevalence was higher among females as
compared to males, but it was not significant [30.8% (29.2, 32.5) vs 27.6% (27.3, 30.4)]. Generally,
mental health problems were higher among younger adults.
Mental health problems were found to be highest among Other Bumiputras [41.1% (37.4, 45.0)],
followed by Others [33.2% (27.8, 39.2)]. By occupation, the prevalence was lowest among
government/semi-government employees [2.6% (21.8, 27.7)]. This survey also noted that adults
from low household income families were having higher prevalence of mental health problems as
compared to higher income families.
NATIONAL HEALTH AND MORBIDITY SURVEY 2015 MINISTRY OF HEALTH MALAYSIA
187
Non-Communicable Diseases, Risk Factors & Other Health Problems Volume II
7.5 Conclusion
The prevalence of mental health problems among adults showed an increasing trend; increased
from 10.7% in 1996 to 29.2% in 2015. This survey showed that females, younger adults, other
Bumiputras, and adults from low income families, seems to be at risk of mental health problems.
7.6 References
1. Goldberg D, Williams P. GHQ: A user guide to the General Health Questionnaire. GL Assessment
Limited.
2. World Health Organization. Promoting Mental Health: Concept, Emerging evidence, Practice. 2005
3. Craig Knott. General Mental Health and Physical Health. Health Survey of England 2012: Volume 1.
The Health and Social Care Information Centre. 2013
4. Goldberg DP. The Detection of Psychiatric Illness by Questionnaire. Maudsley Monograph no. 21.
Oxford University Press, Oxford, 1972.
5. Goldberg DP, Williams PA. A User's Guide to the General Health Questionnaire. NFER-Nelson,
Windsor, 1988.
6. Goldberg DP, Gater R, Sartorius N et al. The validity of two versions of the GHQ in the WHO study
of mental illness in general health care. Psychol. Med. 1997; 27: 191–197.
7. Institute for Public Health (1996). National Health and Morbidity Survey 1996: Volume 6. Psychiatric
Morbidity in Adults. Ministry of Health Malaysia.
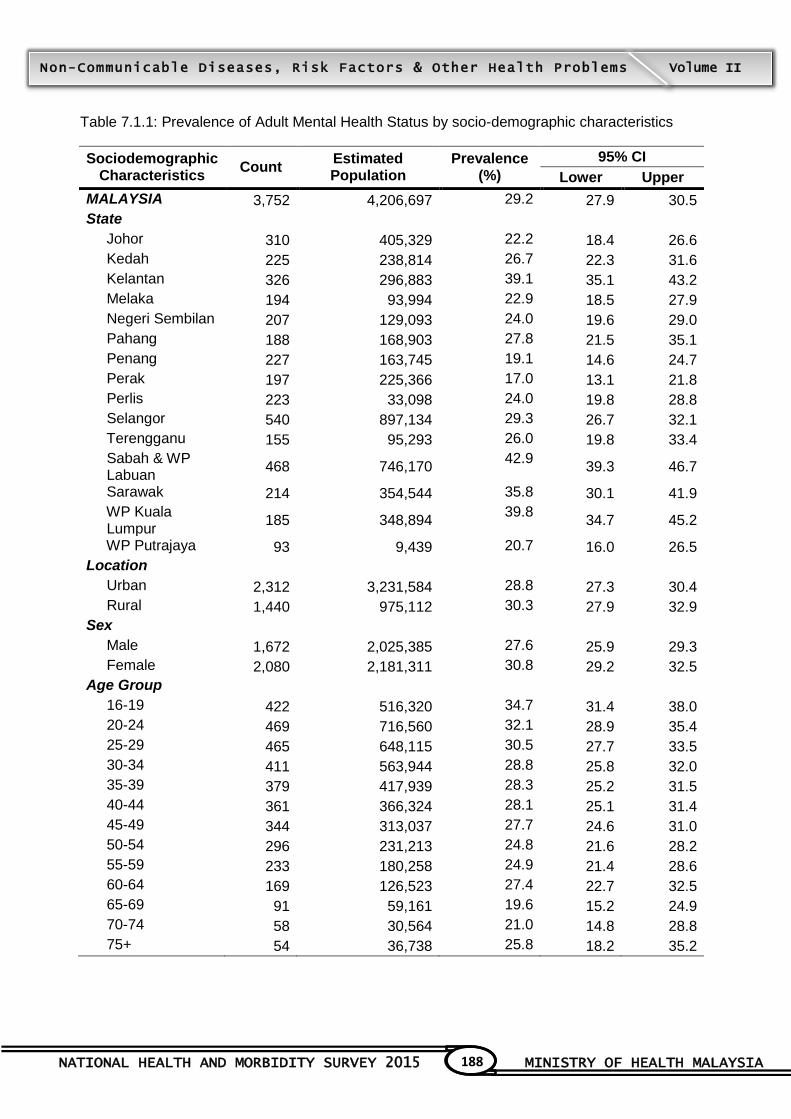
NATIONAL HEALTH AND MORBIDITY SURVEY 2015 MINISTRY OF HEALTH MALAYSIA
188
Non-Communicable Diseases, Risk Factors & Other Health Problems Volume II
Table 7.1.1: Prevalence of Adult Mental Health Status by socio-demographic characteristics
Sociodemographic Characteristics
Count Estimated Population
Prevalence (%)
95% CI
Lower Upper
MALAYSIA 3,752 4,206,697 29.2 27.9 30.5
State
Johor 310 405,329 22.2 18.4 26.6
Kedah 225 238,814 26.7 22.3 31.6
Kelantan 326 296,883 39.1 35.1 43.2
Melaka 194 93,994 22.9 18.5 27.9
Negeri Sembilan 207 129,093 24.0 19.6 29.0
Pahang 188 168,903 27.8 21.5 35.1
Penang 227 163,745 19.1 14.6 24.7
Perak 197 225,366 17.0 13.1 21.8
Perlis 223 33,098 24.0 19.8 28.8
Selangor 540 897,134 29.3 26.7 32.1
Terengganu 155 95,293 26.0 19.8 33.4
Sabah & WP Labuan
468 746,170 42.9
39.3 46.7
Sarawak 214 354,544 35.8 30.1 41.9
WP Kuala Lumpur
185 348,894 39.8
34.7 45.2
WP Putrajaya 93 9,439 20.7 16.0 26.5
Location
Urban 2,312 3,231,584 28.8 27.3 30.4
Rural 1,440 975,112 30.3 27.9 32.9
Sex
Male 1,672 2,025,385 27.6 25.9 29.3
Female 2,080 2,181,311 30.8 29.2 32.5
Age Group
16-19 422 516,320 34.7 31.4 38.0
20-24 469 716,560 32.1 28.9 35.4
25-29 465 648,115 30.5 27.7 33.5
30-34 411 563,944 28.8 25.8 32.0
35-39 379 417,939 28.3 25.2 31.5
40-44 361 366,324 28.1 25.1 31.4
45-49 344 313,037 27.7 24.6 31.0
50-54 296 231,213 24.8 21.6 28.2
55-59 233 180,258 24.9 21.4 28.6
60-64 169 126,523 27.4 22.7 32.5
65-69 91 59,161 19.6 15.2 24.9
70-74 58 30,564 21.0 14.8 28.8
75+ 54 36,738 25.8 18.2 35.2
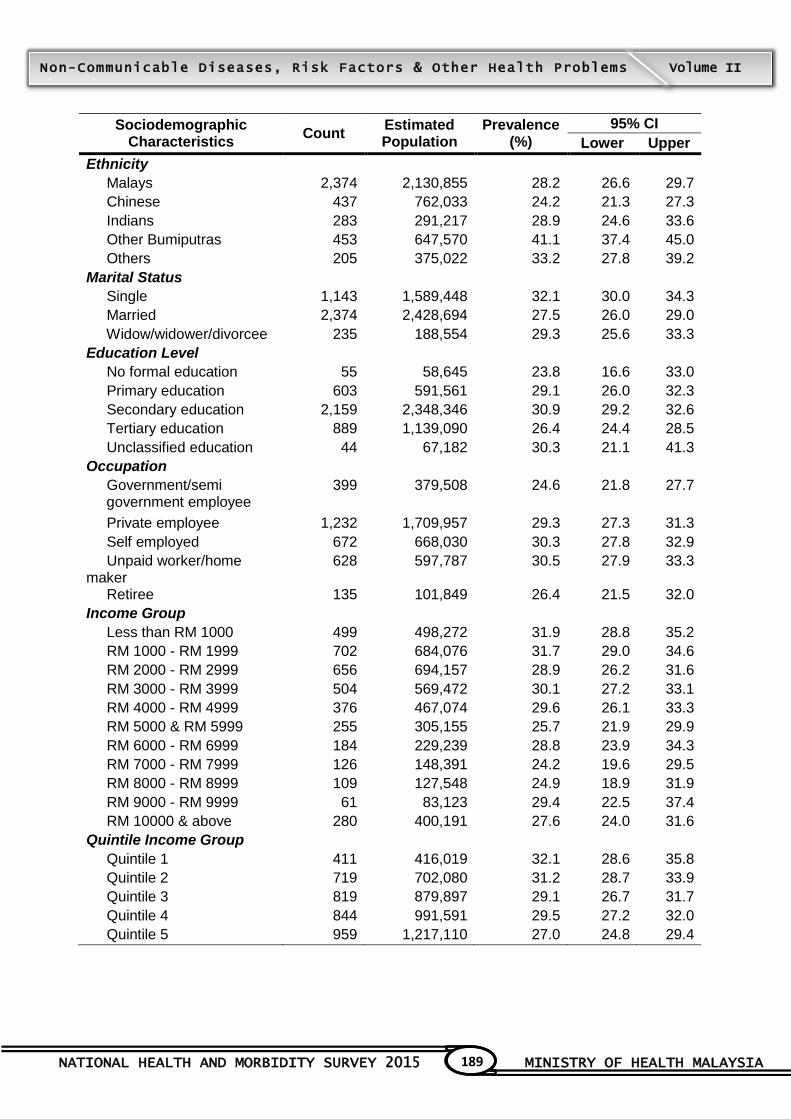
NATIONAL HEALTH AND MORBIDITY SURVEY 2015 MINISTRY OF HEALTH MALAYSIA
189
Non-Communicable Diseases, Risk Factors & Other Health Problems Volume II
Sociodemographic Characteristics
Count Estimated Population
Prevalence (%)
95% CI
Lower Upper
Ethnicity
Malays 2,374 2,130,855 28.2 26.6 29.7
Chinese 437 762,033 24.2 21.3 27.3
Indians 283 291,217 28.9 24.6 33.6
Other Bumiputras 453 647,570 41.1 37.4 45.0
Others 205 375,022 33.2 27.8 39.2
Marital Status
Single 1,143 1,589,448 32.1 30.0 34.3
Married 2,374 2,428,694 27.5 26.0 29.0
Widow/widower/divorcee 235 188,554 29.3 25.6 33.3
Education Level
No formal education 55 58,645 23.8 16.6 33.0
Primary education 603 591,561 29.1 26.0 32.3
Secondary education 2,159 2,348,346 30.9 29.2 32.6
Tertiary education 889 1,139,090 26.4 24.4 28.5
Unclassified education 44 67,182 30.3 21.1 41.3
Occupation
Government/semi government employee
399 379,508 24.6 21.8 27.7
Private employee 1,232 1,709,957 29.3 27.3 31.3
Self employed 672 668,030 30.3 27.8 32.9
Unpaid worker/home maker
628 597,787 30.5 27.9 33.3
Retiree 135 101,849 26.4 21.5 32.0
Income Group
Less than RM 1000 499 498,272 31.9 28.8 35.2
RM 1000 - RM 1999 702 684,076 31.7 29.0 34.6
RM 2000 - RM 2999 656 694,157 28.9 26.2 31.6
RM 3000 - RM 3999 504 569,472 30.1 27.2 33.1
RM 4000 - RM 4999 376 467,074 29.6 26.1 33.3
RM 5000 & RM 5999 255 305,155 25.7 21.9 29.9
RM 6000 - RM 6999 184 229,239 28.8 23.9 34.3
RM 7000 - RM 7999 126 148,391 24.2 19.6 29.5
RM 8000 - RM 8999 109 127,548 24.9 18.9 31.9
RM 9000 - RM 9999 61 83,123 29.4 22.5 37.4
RM 10000 & above 280 400,191 27.6 24.0 31.6
Quintile Income Group
Quintile 1 411 416,019 32.1 28.6 35.8
Quintile 2 719 702,080 31.2 28.7 33.9
Quintile 3 819 879,897 29.1 26.7 31.7
Quintile 4 844 991,591 29.5 27.2 32.0
Quintile 5 959 1,217,110 27.0 24.8 29.4


TOPIC 8

NATIONAL HEALTH AND MORBIDITY SURVEY 2015 MINISTRY OF HEALTH MALAYSIA
191
Non-Communicable Diseases, Risk Factors & Other Health Problems Volume II
8. MENTAL HEALTH PROBLEMS OF CHILDREN
Contributors to this section: Norhafizah Sahril, Noor Ani Ahmad, Idayu Badilla Idris, Balkish
Mahadir Naidu, Nur Ashikin Ibrahim
8.1 Background
Mental health problem or sometimes known as emotional and behavioural problems among
children is a growing public health problems among children in both developed and developing
countries. The World Health Organization (WHO) defines mental health as a state of social and
emotional wellbeing, not merely the absence of disorder1. Good mental health in childhood is
characterized by the achievement of development and emotional milestones, healthy social
development, and effective coping skills; such that mentally healthy children have a positive quality
of life and can function well at home, in school and in their communities2,3. The British Child and
Adolescents Mental Health Survey in 1999 and 2004 found that 1 in 10 children and young people
under the age of 16 years had a diagnosable mental disorder. The most common problems are
conduct disorders, attention deficit hyperactivity disorder (ADHD), emotional disorders (anxiety
and depression) and autism spectrum disorders4,5. Findings from the National Health and
Morbidity Survey (NHMS 2011) using Reporting Questionnaire for Children (RQC) had found that
the prevalence of mental health among children aged 5 to 15 years was 20.0% (95% CI: 18.8,
21.3) and it was significantly higher among boys 21.8% (95% CI: 20.1, 23.7)6 compared to girls
18.1% (95% CI: 16.4, 20.0). Mental health problems among children cause distress and can have
wide-ranging effects, including impacts on educational attainment and social relationship, as well
as affecting life chances and physical health7, 8.
8.2 Objective
8.2.1 General Objective
To determine the prevalence of mental health problems among 5 to 15 years children
in Malaysia
8.2.2 Specific objective
a. To determine the prevalence of mental health problems among children age 5 to 15
years in Malaysia
b. To determine the prevalence of emotional problem among children age 5 to 15 years
in Malaysia
c. To determine the prevalence of conduct problem among children age 5 to 15 years in
Malaysia
d. To determine the prevalence of hyperactivity problems among children age 5 to 15
years in Malaysia
e. To determine the prevalence of peer problems among children age 5 to 15 years in
Malaysia
f. To determine the prevalence of pro-social skills among children age 5 to 15 years in
Malaysia

NATIONAL HEALTH AND MORBIDITY SURVEY 2015 MINISTRY OF HEALTH MALAYSIA
192
Non-Communicable Diseases, Risk Factors & Other Health Problems Volume II
8.3 Target Population, Study Instrument And Definitions
Information on mental health among children age 5 to 15 years was obtained from their parents or
guardian. The informants reported the scores by answering the Strengths and Difficulties
Questionnaire (SDQ). The SDQ consisted of 25 items comprised of 5 scales of 5 items which were
Total Difficulties Scores, Emotional Problems Scale, Conduct Problems Scale, Hyperactivity
Problem Scales, Peer Problem Scales and Pro-Social Scales. Informants answered the
questionnaire using Likert Scale of Not True, Somewhat True and Certainly True. For each of 5
the scales, the score could be scaled up to pro-rata if at least 3 items were completed. Each
problem scores (i.e. Emotional, Conduct, Hyperactivity, Peer problem and pro Social scores)
consisted of five items with a score range of 0 – 10.
A child is considered as having mental health problems if total difficulties score was 14 or more.
Total Difficulties Scores were generated by summing scores from all the scales except the Pro-
Social scale. The resultant score ranged from 0 to 40, and it was counted as missing if one of the
four component scores was missing.
The SDQ scores for each scale were categorized as follows:
Parent completed SDQ Categories
Normal Abnormal
Total difficulties scores 0-13 14-40
Emotional problem scores 0-3 4-10
Conduct problem scores 0-2 3-10
Hyperactivity problem scores 0-5 6-10
Peer problem scores 0-2 3-10
Prosocial scores 6-10 0-5
8.4 Findings
A total of 5182 (out of total 5823 children) aged 5 to 15 years responded in this topic (response
rate: 88.9%). The overall prevalence of mental health problem among children was 12.1% (95%
CI: 11.0, 13.4). The prevalence was highest in Sarawak [16.0% (11.6, 21.8)], followed by Sabah &
WP Labuan [14.8% (11.8, 18.3)] and Johor [14.0% (10.3, 18.9)]. Children from rural area had
higher prevalence of mental health problems as compared to those from urban areas [13.0%
(11.1, 15.3) vs. 11.8% (10.4, 13.4)]. By sex, mental health problems were higher among boys than
girls [12.4% (10.8, 14.1) vs 11.9% (10.3, 13.6)].
Younger children (5-9 years) showed higher prevalence of mental health problems; 13.1% (11.4,
15.1), as compared to older children (10-15 years); 11.4% (10.0, 12.9). By ethnicity, other
Bumiputras‟ showed highest prevalence of mental health problems [16.5% (12.9, 20.8)] followed
by Chinese [14.2% (10.6, 18.9), Indians [13.8% (9.8, 19.2)] and others‟ [12.9% (7.4, 21.5). Lowest
prevalence was found among Malays; 10.4 % (9.1, 11.8).

NATIONAL HEALTH AND MORBIDITY SURVEY 2015 MINISTRY OF HEALTH MALAYSIA
193
Non-Communicable Diseases, Risk Factors & Other Health Problems Volume II
This survey also revealed that the prevalence of emotional problems among children were 15.7%
(14.2, 17.2), conduct problems; 16.7% (15.3, 18.3), hyperactivity; 4.6% (3.9, 5.5), peer problem;
32.5% (30.6, 34.4) and pro-social skill; 11.2% (9.8, 12.7).
8.5 Conclusions
This survey found that children who were at risk of mental health problems were those who were
boys, younger age group and from rural areas. Other Bumiputras showed the highest prevalence
while Malays were the lowest. It was found that the highest prevalence of mental health problems
were peer problems followed by conduct and emotional problems.
8.6 References
1. WHO: Mental health: a state of wellbeing. Geneva: World Health Organization; 2011.
www.who.int/features/factfiles/mental_health/en/
2. World Health Organization. Mental health policy and service guidance package: child
and adolescents mental health policies and plans. Geneva, Switzerland: World Health
Organization; 2005.
3. Lippman LH, Moore KA, McIntosh H. Positive indicators of child well-being: a conceptual
framework, measures, and methodological issue. Apps res qual Life 2011; 6:425-49
4. Office for National Statistics: The mental health of children and adolescents in Great Britain.
London: Office for National Statistics, 1999
5. Green H, McGinnity A, Meltzer H, ford T, Goodman R: Mental health of children and young
people in Great Britain, 2004, A survey carried out by the Officer for National Statistics behalf
of the Department of Health and Scottish Executive, Basingstoke: Palgrave Macmillan, 2005
6. NHMS report 2011
7. Sainsbury Centre for Mental Health: Childhood mental health and life chances in post-war
Britain. Insights from three national birth cohort studies.
www.centreformentalhealth.org.uk/pdfs/life_chances_summary.pdf
8. Goodman A, Joyce R, Smith JP: The long shadow cast by childhood physical and mental
health problems on adult life. Proc Natl Acad Sci 2011, 108(15):6032-6037
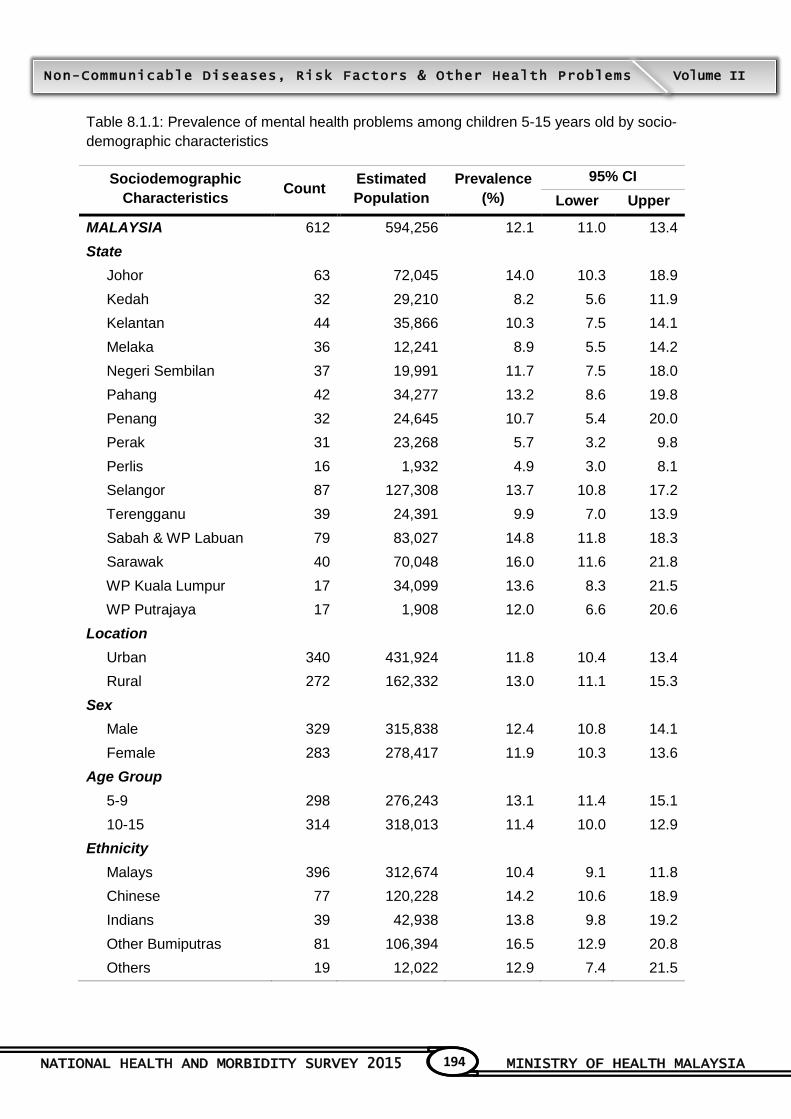
NATIONAL HEALTH AND MORBIDITY SURVEY 2015 MINISTRY OF HEALTH MALAYSIA
194
Non-Communicable Diseases, Risk Factors & Other Health Problems Volume II
Table 8.1.1: Prevalence of mental health problems among children 5-15 years old by socio-
demographic characteristics
Sociodemographic
Characteristics Count
Estimated
Population
Prevalence
(%)
95% CI
Lower Upper
MALAYSIA 612 594,256 12.1 11.0 13.4
State
Johor 63 72,045 14.0 10.3 18.9
Kedah 32 29,210 8.2 5.6 11.9
Kelantan 44 35,866 10.3 7.5 14.1
Melaka 36 12,241 8.9 5.5 14.2
Negeri Sembilan 37 19,991 11.7 7.5 18.0
Pahang 42 34,277 13.2 8.6 19.8
Penang 32 24,645 10.7 5.4 20.0
Perak 31 23,268 5.7 3.2 9.8
Perlis 16 1,932 4.9 3.0 8.1
Selangor 87 127,308 13.7 10.8 17.2
Terengganu 39 24,391 9.9 7.0 13.9
Sabah & WP Labuan 79 83,027 14.8 11.8 18.3
Sarawak 40 70,048 16.0 11.6 21.8
WP Kuala Lumpur 17 34,099 13.6 8.3 21.5
WP Putrajaya 17 1,908 12.0 6.6 20.6
Location
Urban 340 431,924 11.8 10.4 13.4
Rural 272 162,332 13.0 11.1 15.3
Sex
Male 329 315,838 12.4 10.8 14.1
Female 283 278,417 11.9 10.3 13.6
Age Group
5-9 298 276,243 13.1 11.4 15.1
10-15 314 318,013 11.4 10.0 12.9
Ethnicity
Malays 396 312,674 10.4 9.1 11.8
Chinese 77 120,228 14.2 10.6 18.9
Indians 39 42,938 13.8 9.8 19.2
Other Bumiputras 81 106,394 16.5 12.9 20.8
Others 19 12,022 12.9 7.4 21.5
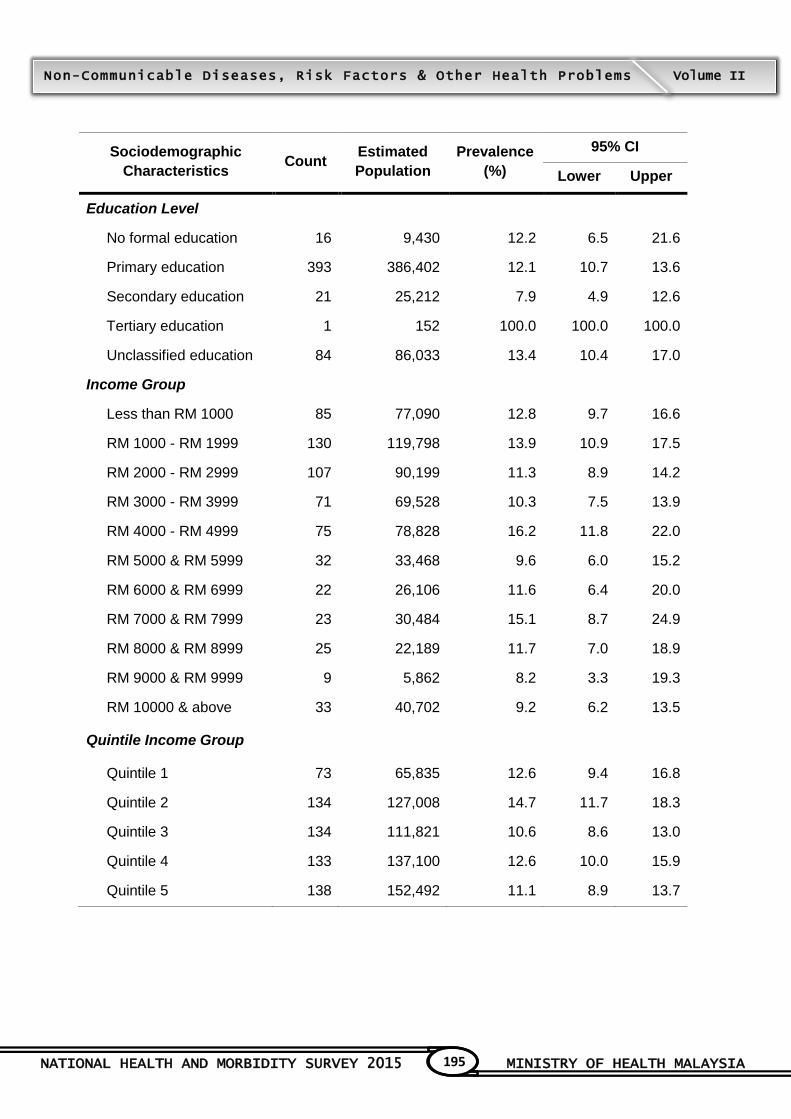
NATIONAL HEALTH AND MORBIDITY SURVEY 2015 MINISTRY OF HEALTH MALAYSIA
195
Non-Communicable Diseases, Risk Factors & Other Health Problems Volume II
Sociodemographic
Characteristics Count
Estimated
Population
Prevalence
(%)
95% CI
Lower Upper
Education Level
No formal education 16 9,430 12.2 6.5 21.6
Primary education 393 386,402 12.1 10.7 13.6
Secondary education 21 25,212 7.9 4.9 12.6
Tertiary education 1 152 100.0 100.0 100.0
Unclassified education 84 86,033 13.4 10.4 17.0
Income Group
Less than RM 1000 85 77,090 12.8 9.7 16.6
RM 1000 - RM 1999 130 119,798 13.9 10.9 17.5
RM 2000 - RM 2999 107 90,199 11.3 8.9 14.2
RM 3000 - RM 3999 71 69,528 10.3 7.5 13.9
RM 4000 - RM 4999 75 78,828 16.2 11.8 22.0
RM 5000 & RM 5999 32 33,468 9.6 6.0 15.2
RM 6000 & RM 6999 22 26,106 11.6 6.4 20.0
RM 7000 & RM 7999 23 30,484 15.1 8.7 24.9
RM 8000 & RM 8999 25 22,189 11.7 7.0 18.9
RM 9000 & RM 9999 9 5,862 8.2 3.3 19.3
RM 10000 & above 33 40,702 9.2 6.2 13.5
Quintile Income Group
Quintile 1 73 65,835 12.6 9.4 16.8
Quintile 2 134 127,008 14.7 11.7 18.3
Quintile 3 134 111,821 10.6 8.6 13.0
Quintile 4 133 137,100 12.6 10.0 15.9
Quintile 5 138 152,492 11.1 8.9 13.7
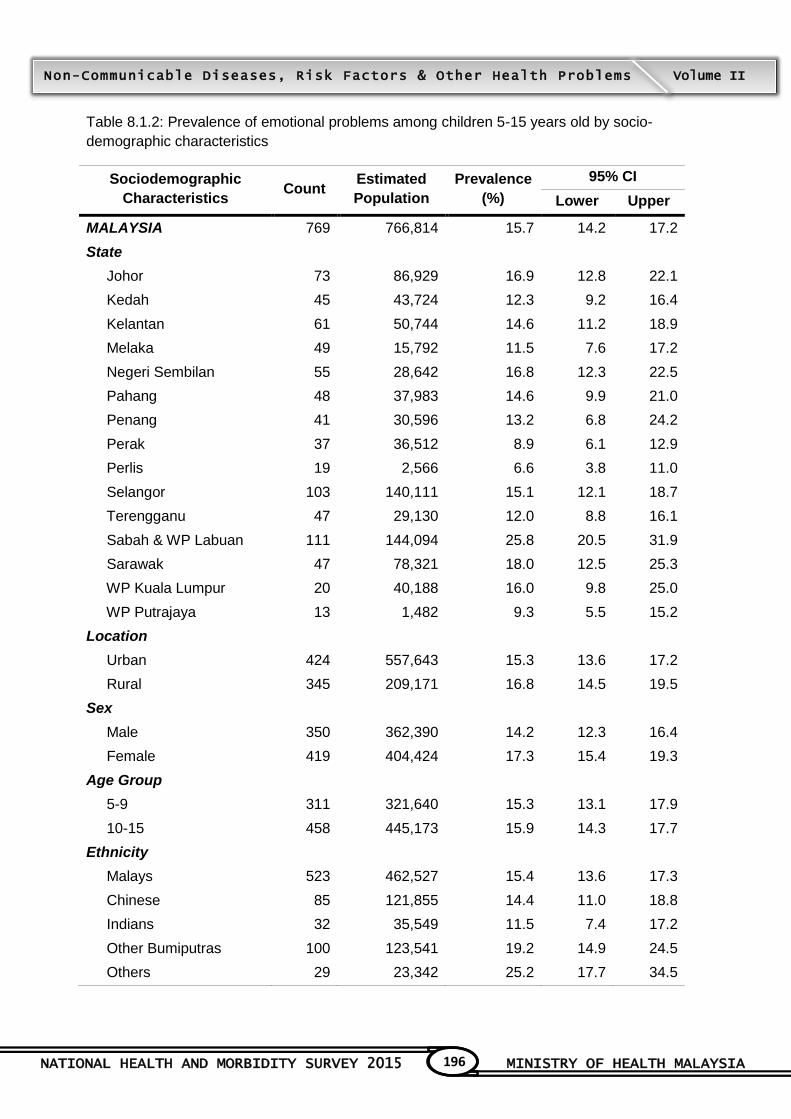
NATIONAL HEALTH AND MORBIDITY SURVEY 2015 MINISTRY OF HEALTH MALAYSIA
196
Non-Communicable Diseases, Risk Factors & Other Health Problems Volume II
Table 8.1.2: Prevalence of emotional problems among children 5-15 years old by socio-
demographic characteristics
Sociodemographic
Characteristics Count
Estimated
Population
Prevalence
(%)
95% CI
Lower Upper
MALAYSIA 769 766,814 15.7 14.2 17.2
State
Johor 73 86,929 16.9 12.8 22.1
Kedah 45 43,724 12.3 9.2 16.4
Kelantan 61 50,744 14.6 11.2 18.9
Melaka 49 15,792 11.5 7.6 17.2
Negeri Sembilan 55 28,642 16.8 12.3 22.5
Pahang 48 37,983 14.6 9.9 21.0
Penang 41 30,596 13.2 6.8 24.2
Perak 37 36,512 8.9 6.1 12.9
Perlis 19 2,566 6.6 3.8 11.0
Selangor 103 140,111 15.1 12.1 18.7
Terengganu 47 29,130 12.0 8.8 16.1
Sabah & WP Labuan 111 144,094 25.8 20.5 31.9
Sarawak 47 78,321 18.0 12.5 25.3
WP Kuala Lumpur 20 40,188 16.0 9.8 25.0
WP Putrajaya 13 1,482 9.3 5.5 15.2
Location
Urban 424 557,643 15.3 13.6 17.2
Rural 345 209,171 16.8 14.5 19.5
Sex
Male 350 362,390 14.2 12.3 16.4
Female 419 404,424 17.3 15.4 19.3
Age Group
5-9 311 321,640 15.3 13.1 17.9
10-15 458 445,173 15.9 14.3 17.7
Ethnicity
Malays 523 462,527 15.4 13.6 17.3
Chinese 85 121,855 14.4 11.0 18.8
Indians 32 35,549 11.5 7.4 17.2
Other Bumiputras 100 123,541 19.2 14.9 24.5
Others 29 23,342 25.2 17.7 34.5
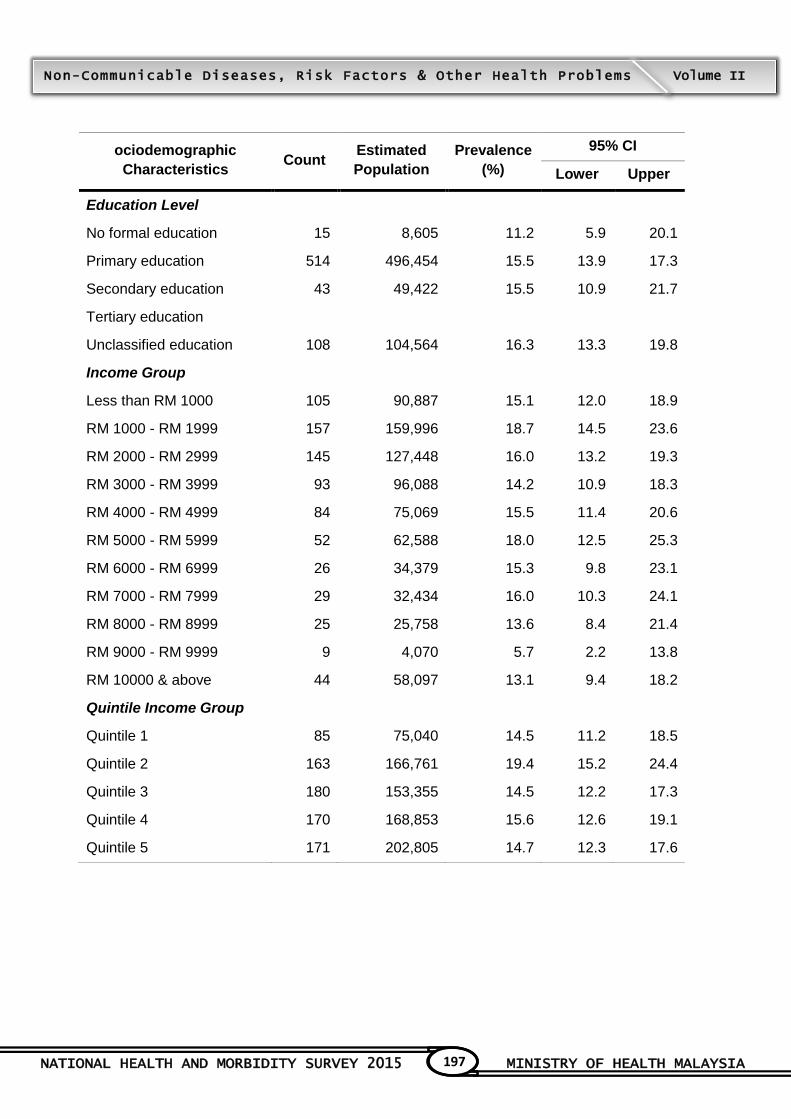
NATIONAL HEALTH AND MORBIDITY SURVEY 2015 MINISTRY OF HEALTH MALAYSIA
197
Non-Communicable Diseases, Risk Factors & Other Health Problems Volume II
ociodemographic
Characteristics Count
Estimated
Population
Prevalence
(%)
95% CI
Lower Upper
Education Level
No formal education 15 8,605 11.2 5.9 20.1
Primary education 514 496,454 15.5 13.9 17.3
Secondary education 43 49,422 15.5 10.9 21.7
Tertiary education
Unclassified education 108 104,564 16.3 13.3 19.8
Income Group
Less than RM 1000 105 90,887 15.1 12.0 18.9
RM 1000 - RM 1999 157 159,996 18.7 14.5 23.6
RM 2000 - RM 2999 145 127,448 16.0 13.2 19.3
RM 3000 - RM 3999 93 96,088 14.2 10.9 18.3
RM 4000 - RM 4999 84 75,069 15.5 11.4 20.6
RM 5000 - RM 5999 52 62,588 18.0 12.5 25.3
RM 6000 - RM 6999 26 34,379 15.3 9.8 23.1
RM 7000 - RM 7999 29 32,434 16.0 10.3 24.1
RM 8000 - RM 8999 25 25,758 13.6 8.4 21.4
RM 9000 - RM 9999 9 4,070 5.7 2.2 13.8
RM 10000 & above 44 58,097 13.1 9.4 18.2
Quintile Income Group
Quintile 1 85 75,040 14.5 11.2 18.5
Quintile 2 163 166,761 19.4 15.2 24.4
Quintile 3 180 153,355 14.5 12.2 17.3
Quintile 4 170 168,853 15.6 12.6 19.1
Quintile 5 171 202,805 14.7 12.3 17.6
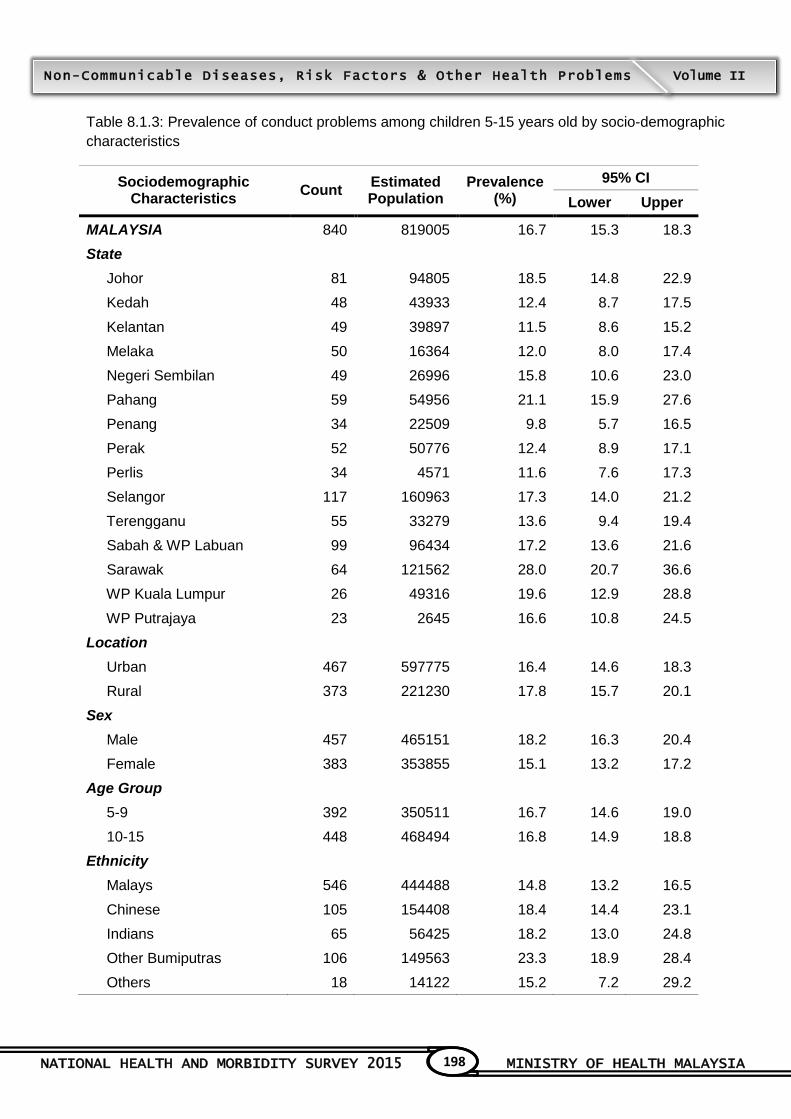
NATIONAL HEALTH AND MORBIDITY SURVEY 2015 MINISTRY OF HEALTH MALAYSIA
198
Non-Communicable Diseases, Risk Factors & Other Health Problems Volume II
Table 8.1.3: Prevalence of conduct problems among children 5-15 years old by socio-demographic
characteristics
Sociodemographic Characteristics
Count Estimated Population
Prevalence (%)
95% CI
Lower Upper
MALAYSIA 840 819005 16.7 15.3 18.3
State
Johor 81 94805 18.5 14.8 22.9
Kedah 48 43933 12.4 8.7 17.5
Kelantan 49 39897 11.5 8.6 15.2
Melaka 50 16364 12.0 8.0 17.4
Negeri Sembilan 49 26996 15.8 10.6 23.0
Pahang 59 54956 21.1 15.9 27.6
Penang 34 22509 9.8 5.7 16.5
Perak 52 50776 12.4 8.9 17.1
Perlis 34 4571 11.6 7.6 17.3
Selangor 117 160963 17.3 14.0 21.2
Terengganu 55 33279 13.6 9.4 19.4
Sabah & WP Labuan 99 96434 17.2 13.6 21.6
Sarawak 64 121562 28.0 20.7 36.6
WP Kuala Lumpur 26 49316 19.6 12.9 28.8
WP Putrajaya 23 2645 16.6 10.8 24.5
Location
Urban 467 597775 16.4 14.6 18.3
Rural 373 221230 17.8 15.7 20.1
Sex
Male 457 465151 18.2 16.3 20.4
Female 383 353855 15.1 13.2 17.2
Age Group
5-9 392 350511 16.7 14.6 19.0
10-15 448 468494 16.8 14.9 18.8
Ethnicity
Malays 546 444488 14.8 13.2 16.5
Chinese 105 154408 18.4 14.4 23.1
Indians 65 56425 18.2 13.0 24.8
Other Bumiputras 106 149563 23.3 18.9 28.4
Others 18 14122 15.2 7.2 29.2

NATIONAL HEALTH AND MORBIDITY SURVEY 2015 MINISTRY OF HEALTH MALAYSIA
199
Non-Communicable Diseases, Risk Factors & Other Health Problems Volume II
Sociodemographic Characteristics
Count Estimated Population
Prevalence (%)
95% CI
Lower Upper
Education Level
No formal education 16 9196 11.9 6.4 21.0
Primary education 548 529514 16.6 15.0 18.3
Secondary education 41 51040 16.0 11.7 21.6
Tertiary education 0.0 0.0 0.0
Unclassified education 106 105800 16.5 13.0 20.6
Income Group
Less than RM 1000 111 105131 17.5 14.0 21.7
RM 1000 - RM 1999 188 161420 18.9 15.6 22.7
RM 2000 - RM 2999 140 124042 15.5 12.3 19.5
RM 3000 - RM 3999 118 134575 19.9 15.3 25.4
RM 4000 - RM 4999 93 97891 20.2 15.4 26.0
RM 5000 & 5999 36 39360 11.3 7.6 16.5
RM6000 - 6999 32 40734 18.1 11.4 27.4
RM 7000 - 7999 36 41459 20.5 13.8 29.4
RM8000 - 8999 29 21806 11.5 7.0 18.4
RM 9000 - 9999 12 8647 12.1 5.7 23.9
RM 10000 and above 45 43939 9.9 6.7 14.5
Quintile Income Group
Quintile 1 94 90374 17.4 13.6 22.1
Quintile 2 195 171955 20.0 16.7 23.8
Quintile 3 189 167996 15.9 13.0 19.3
Quintile 4 179 197618 18.2 14.8 22.3
Quintile 5 183 191062 13.9 11.6 16.6
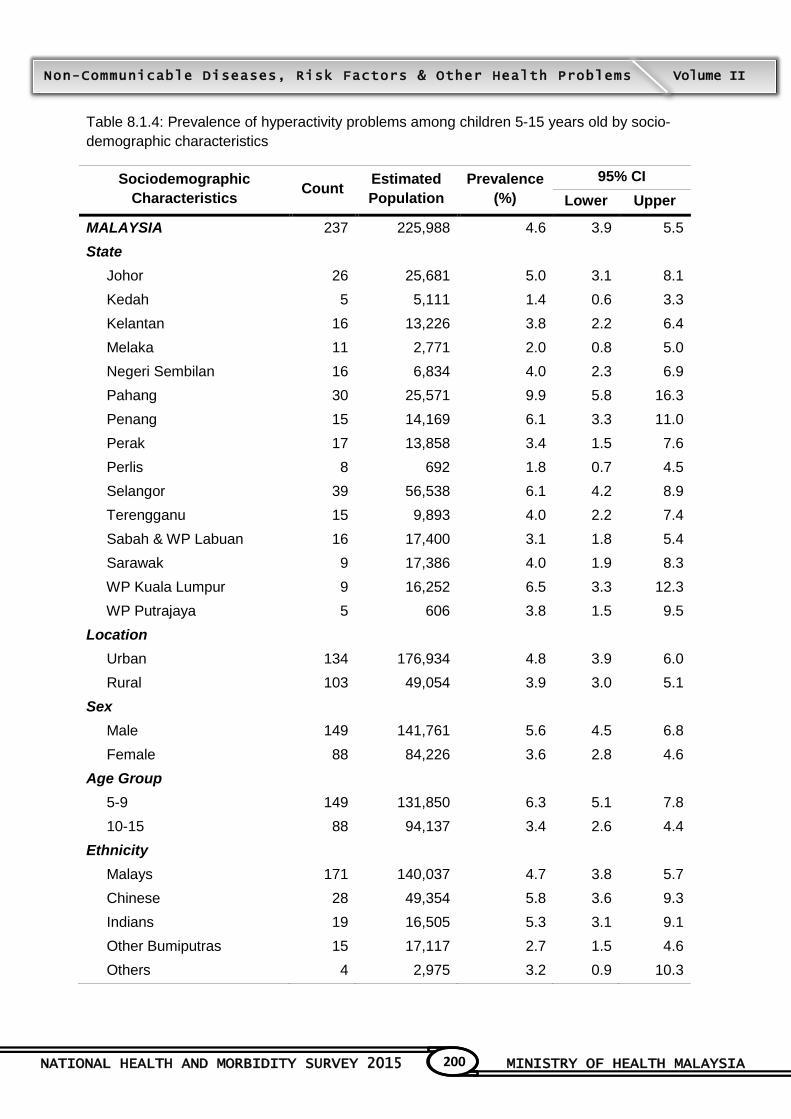
NATIONAL HEALTH AND MORBIDITY SURVEY 2015 MINISTRY OF HEALTH MALAYSIA
200
Non-Communicable Diseases, Risk Factors & Other Health Problems Volume II
Table 8.1.4: Prevalence of hyperactivity problems among children 5-15 years old by socio-
demographic characteristics
Sociodemographic
Characteristics Count
Estimated
Population
Prevalence
(%)
95% CI
Lower Upper
MALAYSIA 237 225,988 4.6 3.9 5.5
State
Johor 26 25,681 5.0 3.1 8.1
Kedah 5 5,111 1.4 0.6 3.3
Kelantan 16 13,226 3.8 2.2 6.4
Melaka 11 2,771 2.0 0.8 5.0
Negeri Sembilan 16 6,834 4.0 2.3 6.9
Pahang 30 25,571 9.9 5.8 16.3
Penang 15 14,169 6.1 3.3 11.0
Perak 17 13,858 3.4 1.5 7.6
Perlis 8 692 1.8 0.7 4.5
Selangor 39 56,538 6.1 4.2 8.9
Terengganu 15 9,893 4.0 2.2 7.4
Sabah & WP Labuan 16 17,400 3.1 1.8 5.4
Sarawak 9 17,386 4.0 1.9 8.3
WP Kuala Lumpur 9 16,252 6.5 3.3 12.3
WP Putrajaya 5 606 3.8 1.5 9.5
Location
Urban 134 176,934 4.8 3.9 6.0
Rural 103 49,054 3.9 3.0 5.1
Sex
Male 149 141,761 5.6 4.5 6.8
Female 88 84,226 3.6 2.8 4.6
Age Group
5-9 149 131,850 6.3 5.1 7.8
10-15 88 94,137 3.4 2.6 4.4
Ethnicity
Malays 171 140,037 4.7 3.8 5.7
Chinese 28 49,354 5.8 3.6 9.3
Indians 19 16,505 5.3 3.1 9.1
Other Bumiputras 15 17,117 2.7 1.5 4.6
Others 4 2,975 3.2 0.9 10.3

NATIONAL HEALTH AND MORBIDITY SURVEY 2015 MINISTRY OF HEALTH MALAYSIA
201
Non-Communicable Diseases, Risk Factors & Other Health Problems Volume II
Sociodemographic
Characteristics Count
Estimated
Population
Prevalence
(%)
95% CI
Lower Upper
Education Level
No formal education 4 3,115 4.0 1.2 12.3
Primary education 139 134,513 4.2 3.4 5.2
Secondary education 5 7,773 2.4 1.0 6.1
Tertiary education
Unclassified education 33 33,498 5.2 3.5 7.8
Income Group
Less than RM 1000 38 30,282 5.0 3.4 7.3
RM 1000 - RM 1999 37 30,915 3.6 2.4 5.4
RM 2000 - RM 2999 50 39,448 4.9 3.3 7.3
RM 3000 - RM 3999 32 31,997 4.7 2.7 8.1
RM 4000 - RM 4999 23 30,558 6.3 3.7 10.6
RM 5000 - RM 5999 11 12,497 3.6 1.7 7.6
RM 6000 - RM 6999 10 13,432 6.0 2.5 13.3
RM 7000 - RM 7999 11 11,095 5.5 2.9 10.2
RM 8000 - RM 8999 8 4,060 2.2 0.8 5.4
RM 9000 - RM 9999 4 2,676 3.8 1.2 11.0
RM 10000 & above 13 19,028 4.3 2.1 8.5
Quintile Income Group
Quintile 1 34 27,129 5.2 3.5 7.8
Quintile 2 38 31,216 3.6 2.4 5.4
Quintile 3 60 48,758 4.6 3.2 6.6
Quintile 4 51 58,447 5.4 3.6 8.0
Quintile 5 54 60,438 4.4 3.1 6.2
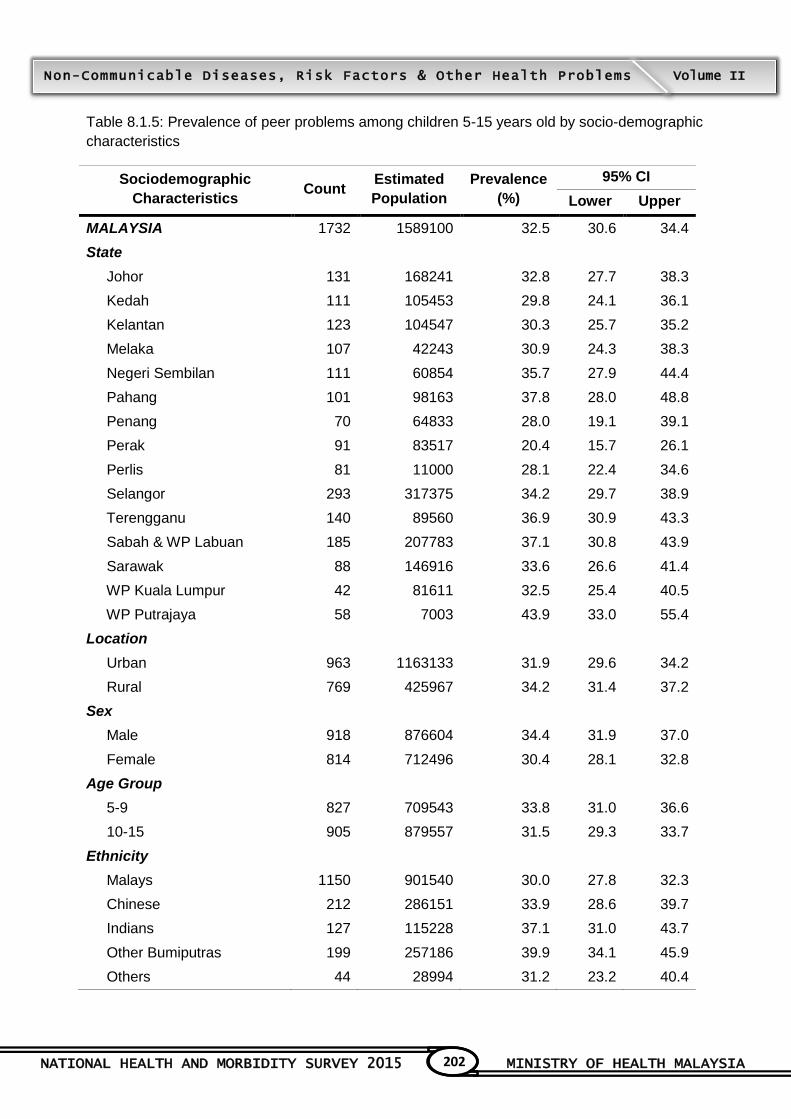
NATIONAL HEALTH AND MORBIDITY SURVEY 2015 MINISTRY OF HEALTH MALAYSIA
202
Non-Communicable Diseases, Risk Factors & Other Health Problems Volume II
Table 8.1.5: Prevalence of peer problems among children 5-15 years old by socio-demographic
characteristics
Sociodemographic
Characteristics Count
Estimated
Population
Prevalence
(%)
95% CI
Lower Upper
MALAYSIA 1732 1589100 32.5 30.6 34.4
State
Johor 131 168241 32.8 27.7 38.3
Kedah 111 105453 29.8 24.1 36.1
Kelantan 123 104547 30.3 25.7 35.2
Melaka 107 42243 30.9 24.3 38.3
Negeri Sembilan 111 60854 35.7 27.9 44.4
Pahang 101 98163 37.8 28.0 48.8
Penang 70 64833 28.0 19.1 39.1
Perak 91 83517 20.4 15.7 26.1
Perlis 81 11000 28.1 22.4 34.6
Selangor 293 317375 34.2 29.7 38.9
Terengganu 140 89560 36.9 30.9 43.3
Sabah & WP Labuan 185 207783 37.1 30.8 43.9
Sarawak 88 146916 33.6 26.6 41.4
WP Kuala Lumpur 42 81611 32.5 25.4 40.5
WP Putrajaya 58 7003 43.9 33.0 55.4
Location
Urban 963 1163133 31.9 29.6 34.2
Rural 769 425967 34.2 31.4 37.2
Sex
Male 918 876604 34.4 31.9 37.0
Female 814 712496 30.4 28.1 32.8
Age Group
5-9 827 709543 33.8 31.0 36.6
10-15 905 879557 31.5 29.3 33.7
Ethnicity
Malays 1150 901540 30.0 27.8 32.3
Chinese 212 286151 33.9 28.6 39.7
Indians 127 115228 37.1 31.0 43.7
Other Bumiputras 199 257186 39.9 34.1 45.9
Others 44 28994 31.2 23.2 40.4
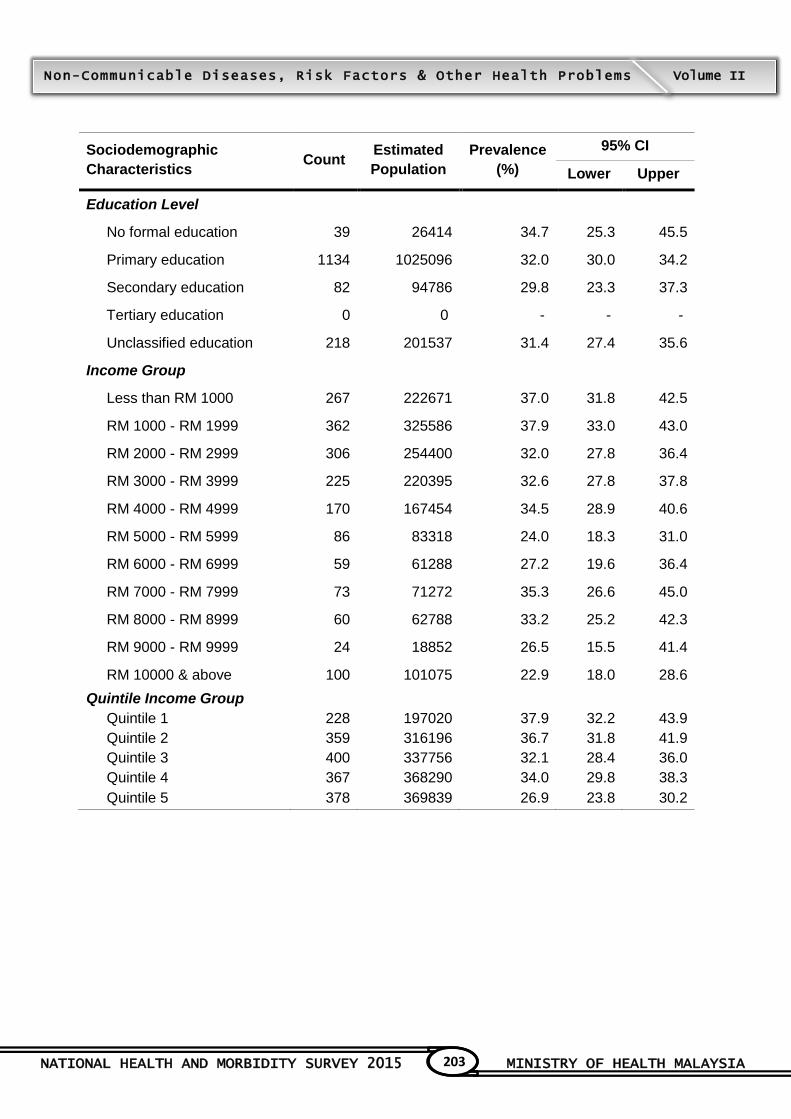
NATIONAL HEALTH AND MORBIDITY SURVEY 2015 MINISTRY OF HEALTH MALAYSIA
203
Non-Communicable Diseases, Risk Factors & Other Health Problems Volume II
Sociodemographic
Characteristics Count
Estimated
Population
Prevalence
(%)
95% CI
Lower Upper
Education Level
No formal education 39 26414 34.7 25.3 45.5
Primary education 1134 1025096 32.0 30.0 34.2
Secondary education 82 94786 29.8 23.3 37.3
Tertiary education 0 0 - - -
Unclassified education 218 201537 31.4 27.4 35.6
Income Group
Less than RM 1000 267 222671 37.0 31.8 42.5
RM 1000 - RM 1999 362 325586 37.9 33.0 43.0
RM 2000 - RM 2999 306 254400 32.0 27.8 36.4
RM 3000 - RM 3999 225 220395 32.6 27.8 37.8
RM 4000 - RM 4999 170 167454 34.5 28.9 40.6
RM 5000 - RM 5999 86 83318 24.0 18.3 31.0
RM 6000 - RM 6999 59 61288 27.2 19.6 36.4
RM 7000 - RM 7999 73 71272 35.3 26.6 45.0
RM 8000 - RM 8999 60 62788 33.2 25.2 42.3
RM 9000 - RM 9999 24 18852 26.5 15.5 41.4
RM 10000 & above 100 101075 22.9 18.0 28.6
Quintile Income Group
Quintile 1 228 197020 37.9 32.2 43.9
Quintile 2 359 316196 36.7 31.8 41.9
Quintile 3 400 337756 32.1 28.4 36.0
Quintile 4 367 368290 34.0 29.8 38.3
Quintile 5 378 369839 26.9 23.8 30.2
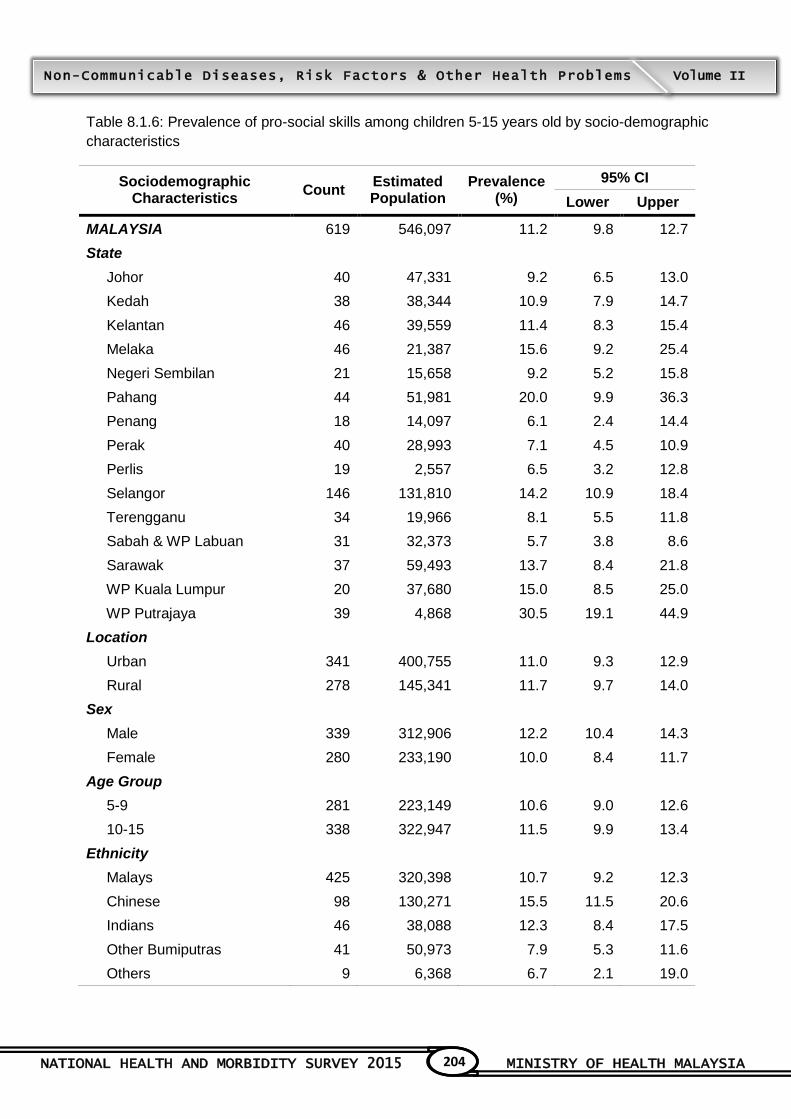
NATIONAL HEALTH AND MORBIDITY SURVEY 2015 MINISTRY OF HEALTH MALAYSIA
204
Non-Communicable Diseases, Risk Factors & Other Health Problems Volume II
Table 8.1.6: Prevalence of pro-social skills among children 5-15 years old by socio-demographic
characteristics
Sociodemographic Characteristics
Count Estimated Population
Prevalence (%)
95% CI
Lower Upper
MALAYSIA 619 546,097 11.2 9.8 12.7
State
Johor 40 47,331 9.2 6.5 13.0
Kedah 38 38,344 10.9 7.9 14.7
Kelantan 46 39,559 11.4 8.3 15.4
Melaka 46 21,387 15.6 9.2 25.4
Negeri Sembilan 21 15,658 9.2 5.2 15.8
Pahang 44 51,981 20.0 9.9 36.3
Penang 18 14,097 6.1 2.4 14.4
Perak 40 28,993 7.1 4.5 10.9
Perlis 19 2,557 6.5 3.2 12.8
Selangor 146 131,810 14.2 10.9 18.4
Terengganu 34 19,966 8.1 5.5 11.8
Sabah & WP Labuan 31 32,373 5.7 3.8 8.6
Sarawak 37 59,493 13.7 8.4 21.8
WP Kuala Lumpur 20 37,680 15.0 8.5 25.0
WP Putrajaya 39 4,868 30.5 19.1 44.9
Location
Urban 341 400,755 11.0 9.3 12.9
Rural 278 145,341 11.7 9.7 14.0
Sex
Male 339 312,906 12.2 10.4 14.3
Female 280 233,190 10.0 8.4 11.7
Age Group
5-9 281 223,149 10.6 9.0 12.6
10-15 338 322,947 11.5 9.9 13.4
Ethnicity
Malays 425 320,398 10.7 9.2 12.3
Chinese 98 130,271 15.5 11.5 20.6
Indians 46 38,088 12.3 8.4 17.5
Other Bumiputras 41 50,973 7.9 5.3 11.6
Others 9 6,368 6.7 2.1 19.0
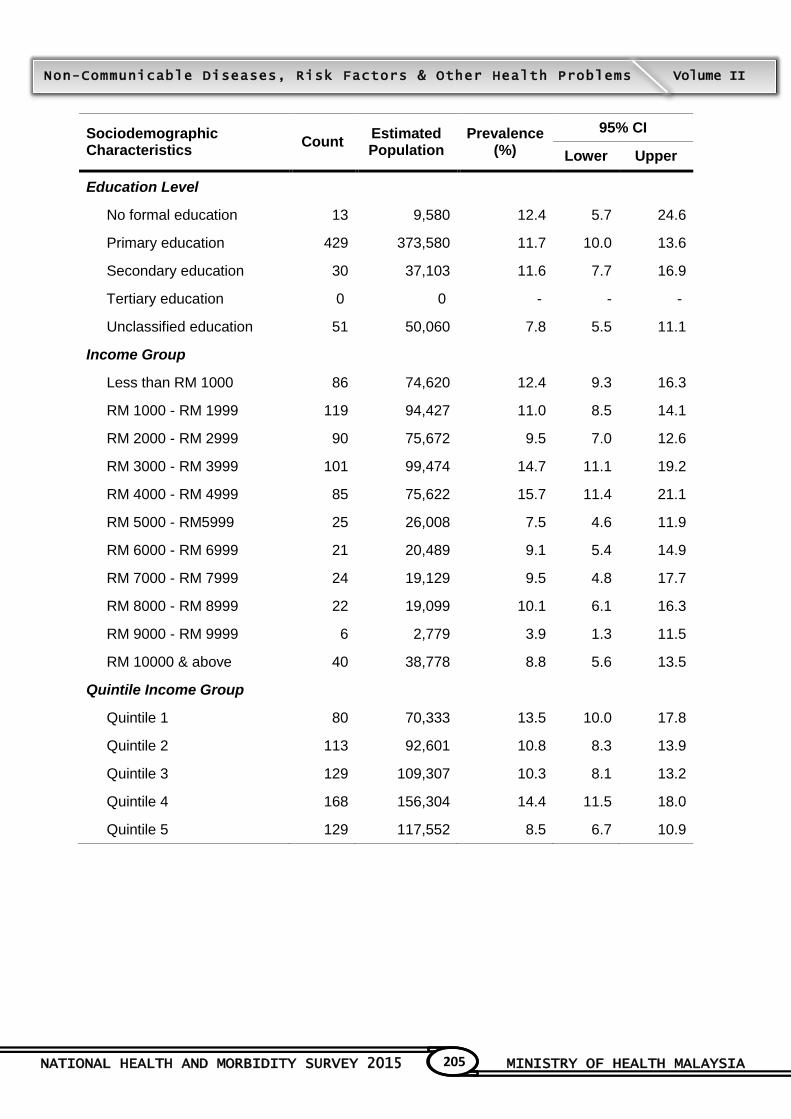
NATIONAL HEALTH AND MORBIDITY SURVEY 2015 MINISTRY OF HEALTH MALAYSIA
205
Non-Communicable Diseases, Risk Factors & Other Health Problems Volume II
Sociodemographic Characteristics
Count Estimated Population
Prevalence (%)
95% CI
Lower Upper
Education Level
No formal education 13 9,580 12.4 5.7 24.6
Primary education 429 373,580 11.7 10.0 13.6
Secondary education 30 37,103 11.6 7.7 16.9
Tertiary education 0 0 - - -
Unclassified education 51 50,060 7.8 5.5 11.1
Income Group
Less than RM 1000 86 74,620 12.4 9.3 16.3
RM 1000 - RM 1999 119 94,427 11.0 8.5 14.1
RM 2000 - RM 2999 90 75,672 9.5 7.0 12.6
RM 3000 - RM 3999 101 99,474 14.7 11.1 19.2
RM 4000 - RM 4999 85 75,622 15.7 11.4 21.1
RM 5000 - RM5999 25 26,008 7.5 4.6 11.9
RM 6000 - RM 6999 21 20,489 9.1 5.4 14.9
RM 7000 - RM 7999 24 19,129 9.5 4.8 17.7
RM 8000 - RM 8999 22 19,099 10.1 6.1 16.3
RM 9000 - RM 9999 6 2,779 3.9 1.3 11.5
RM 10000 & above 40 38,778 8.8 5.6 13.5
Quintile Income Group
Quintile 1 80 70,333 13.5 10.0 17.8
Quintile 2 113 92,601 10.8 8.3 13.9
Quintile 3 129 109,307 10.3 8.1 13.2
Quintile 4 168 156,304 14.4 11.5 18.0
Quintile 5 129 117,552 8.5 6.7 10.9


TOPIC 9

NATIONAL HEALTH AND MORBIDITY SURVEY 2015 MINISTRY OF HEALTH MALAYSIA
207
Non-Communicable Diseases, Risk Factors & Other Health Problems Volume II
9. ANAEMIA
Contributors to this section: S. Maria Awaluddin, Noor Ani Ahmad, Balkish Mahadir Naidu,
Muslimah Yusof, Rahama Samad, Noraida Mohd Kasim, Mohamad Aznuddin Abd. Razak, Chan
Ying Ying, Norhafizah Sahril, Rajini Sooryanarayana.
9.1 Background
Anaemia is a condition where there are insufficient red blood cells to meet the human
physiological needs and is usually confirmed by a haemoglobin level measurement1. The most
common cause of anaemia is iron deficiency anaemia2. The World Health Organization estimated
the prevalence of anaemia globally at 24.8% (95% CI 22.9, 26.7 %), and 1.62 billion people (95%
CI 1.50, 1.74 billion) were affected in 2008. The highest prevalence is in preschool-aged children
while the most affected group are the non-pregnant women3. Malaysia still lacks data on national
prevalence of anaemia for the general population. A study conducted among rural communities in
interior Sarawak observed the prevalence of anaemia to be 17.2% among females and 29.2%
among males4, while other studies conducted among pregnant women observed a range of
prevalence from 34.6% to 42.3%5,6. Iron deficiency anaemia was the main cause of anaemia in the
majority of cases and together with other nutritional deficiencies constituted treatable diseases that
can be prevented. Anaemia in Malaysia is considered as one of the public health challenges which
needs prompt action and should be monitored as a national health indicator.
9.2 Objectives
9.2.1 General Objective
To determine the prevalence of anaemia in Malaysia.
9.2.2 Specific objectives
To determine the overall prevalence of anaemia by socio-demographic characteristics.
To determine the prevalence of anaemia by level of severity (mild, moderate, severe).
9.3 Target Population, Study Instrument And Definitions
The target population for anaemia in this study was all respondents aged 15 years and above.
Data on anaemia were collected through haemoglobin measurement using Hemocue© point of
care testing (POCT). The Hemocue© system is one of the POCT for haemoglobin measurement
using capillary blood sample and has been shown to be stable and durable in field settings. The
haemoglobin measurement using Hemocue© POCT is adequate for population based screening.
Hemocue© POCT has been used extensively in Ministry of Health especially in the primary care
setting. A validity study on Hemocue© POCT revealed sensitivity; 79%, specificity; 97% and both
positive predictive value and negative predictive value were above 80%7. All the nurses involved in
this survey as data collectors were well-trained on the usage on Hemocue© POCT. A drop of
blood sample was collected using aseptic technique from the finger prick procedure. Respondents
who refused to give their blood sample were classified as refused and no data were collected. All
the results were recorded. Definition on anaemia cut-offs is based on Table 1 below.

NATIONAL HEALTH AND MORBIDITY SURVEY 2015 MINISTRY OF HEALTH MALAYSIA
208
Non-Communicable Diseases, Risk Factors & Other Health Problems Volume II
Table 1: Haemoglobin levels to diagnose anaemia at sea level (g/l)±
Anaemia*
Population
Non
Anaemia* Mild Moderate Severe
Children 6-59 months of
age 110 or higher 100-109 70-99 lower than 70
Children 5-11 years of
age 115 or higher 110-114 80-109 lower than 80
Children 12-14 years of
age 120 or higher 110-119 80-109 lower than 80
Non-pregnant women
(15 years of age and
above) 120 or higher 110-119 80-109 lower than 80
Pregnant women 110 or higher 100-109 70-99 lower than 70
Men (15 years of age
and above) 130 or higher 110-109 80-109 lower than 80
*Haemoglobin in grams per litre
Source: WHO. Iron deficiency anaemia: assessment, prevention, and control. A guide for programme
managers. Geneva, World Health Organization, 2001 (WHO/NHD/01.3)
9.4 Findings
Total number of respondents who responded to this topic was 5410. The overall prevalence of
anaemia in Malaysia was 24.6% (95%CI 23.5, 25.6) and with an estimated projection to 4,945,188
populations. Prevalence of mild, moderate, and severe anaemia were 15.7% (95%CI 15.0, 16.5),
7.9% (95%CI 7.4, 8.5) and 1.0% (95%CI 0.8, 1.2) respectively. By state, the highest prevalence of
anaemia were 29.7% (95%CI 26.2, 33.4) in Negeri Sembilan and 29.7% (95%CI 26.1, 33.6) in
Terengganu while the lowest was in Sarawak at 19.1% (95%CI 15.9, 22.9). By strata, the
prevalence of anaemia was 24.7% (95%CI 23.5, 26.0) in urban and 24.3% (95%CI 22.8, 25.8) in
rural settings. By gender, the prevalence of anaemia was significantly higher among females;
35.5% (95%CI 34.1, 37.0) than males; 14.3% (95%CI 13.3, 15.4). By ethnicity, Indians had the
highest prevalence of anaemia at 30.8% (95%CI 28.0, 33.8), followed by Malays at 25.9% (95%CI
24.7, 27.2) and lastly Chinese at 23.0% (95%CI 21.1, 25.2). Prevalence of anaemia was highest
among respondents with no formal education (32.3%; 95%CI: 28.9, 35.9).
9.5 Conclusion
The national prevalence of anaemia is similar with the estimated global prevalence by the World
Health Organization in 2008. Prevalence of mild anaemia contributed the most as compared to
prevalence of moderate and severe anaemia. Anaemia still remains a health challenge to the
female population, those of Indian ethnicity and those with no formal education.

NATIONAL HEALTH AND MORBIDITY SURVEY 2015 MINISTRY OF HEALTH MALAYSIA
209
Non-Communicable Diseases, Risk Factors & Other Health Problems Volume II
9.6 References
1. WHO. Haemoglobin concentrations for the diagnosis of anaemia and assessment of severity.
Vitamin and Mineral Nutrition Information System. Geneva, World Health Organization, 2011
(WHO/NMH/NHD/MNM/11.1).
2. WHO. Iron Deficiency Anaemia Assessment, Prevention, and Control. A guide for programme
managers. Geneva, World Health Organization, 2001.
3. McLean E, Cogswell M, Egli I, Wojdyla D, de Benoist B. Worldwide prevalence of anaemia,
WHO Vitamin and Mineral Nutrition Information System, 1993–2005. Public Health Nutr. 2008
May 23;12(04):444..
4. Sagin DD, Ismail G, Mohamad M, Pang EKH and Sya OT. Anaemia in Remote Interior
Communities in Sarawak, Malaysia. Southeast Asian J Trop Med Public Health (2002).33(2):
373-377.
5. Rosline H, Wan Zaidah A and Nik Hazlina NH. Anaemia And Iron Status Of Malay Women
Attending An Antenatal Clinic In Kubang Kerian,Kelantan, Malaysia. Southeast Asian J Trop
Med Public Health (2005). 36(5): 1304-1307.
6. Thirukkanesh S and Zahara AM. Compliance to Vitamin and Mineral Supplementation among
Pregnant Women in Urban and Rural Areas in Malaysia. Pakistan Journal of Nutrition (2010).
9 (8): 744-750.
7. Neufeld L, García-Guerra A, Sánchez-Francia D, Newton-Sánchez O, Ramírez-Villalobos MD,
Rivera-Dommarco J. Hemoglobin measured by Hemocue and a reference method in venous
and capillary blood: a validation study. Salud Pública México. 2002;44(3):219–27
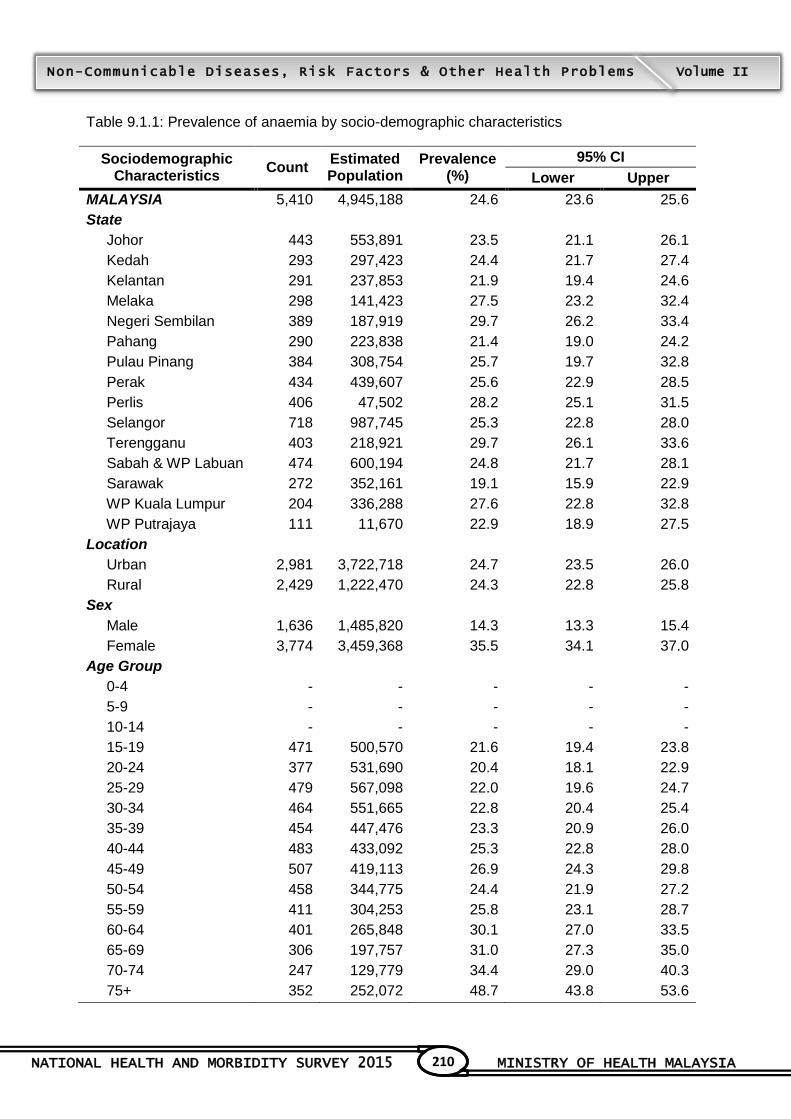
NATIONAL HEALTH AND MORBIDITY SURVEY 2015 MINISTRY OF HEALTH MALAYSIA
210
Non-Communicable Diseases, Risk Factors & Other Health Problems Volume II
Table 9.1.1: Prevalence of anaemia by socio-demographic characteristics
Sociodemographic Characteristics
Count Estimated Population
Prevalence (%)
95% CI
Lower Upper
MALAYSIA 5,410 4,945,188 24.6 23.6 25.6
State
Johor 443 553,891 23.5 21.1 26.1
Kedah 293 297,423 24.4 21.7 27.4
Kelantan 291 237,853 21.9 19.4 24.6
Melaka 298 141,423 27.5 23.2 32.4
Negeri Sembilan 389 187,919 29.7 26.2 33.4
Pahang 290 223,838 21.4 19.0 24.2
Pulau Pinang 384 308,754 25.7 19.7 32.8
Perak 434 439,607 25.6 22.9 28.5
Perlis 406 47,502 28.2 25.1 31.5
Selangor 718 987,745 25.3 22.8 28.0
Terengganu 403 218,921 29.7 26.1 33.6
Sabah & WP Labuan 474 600,194 24.8 21.7 28.1
Sarawak 272 352,161 19.1 15.9 22.9
WP Kuala Lumpur 204 336,288 27.6 22.8 32.8
WP Putrajaya 111 11,670 22.9 18.9 27.5
Location
Urban 2,981 3,722,718 24.7 23.5 26.0
Rural 2,429 1,222,470 24.3 22.8 25.8
Sex
Male 1,636 1,485,820 14.3 13.3 15.4
Female 3,774 3,459,368 35.5 34.1 37.0
Age Group
0-4 - - - - -
5-9 - - - - -
10-14 - - - - -
15-19 471 500,570 21.6 19.4 23.8
20-24 377 531,690 20.4 18.1 22.9
25-29 479 567,098 22.0 19.6 24.7
30-34 464 551,665 22.8 20.4 25.4
35-39 454 447,476 23.3 20.9 26.0
40-44 483 433,092 25.3 22.8 28.0
45-49 507 419,113 26.9 24.3 29.8
50-54 458 344,775 24.4 21.9 27.2
55-59 411 304,253 25.8 23.1 28.7
60-64 401 265,848 30.1 27.0 33.5
65-69 306 197,757 31.0 27.3 35.0
70-74 247 129,779 34.4 29.0 40.3
75+ 352 252,072 48.7 43.8 53.6

NATIONAL HEALTH AND MORBIDITY SURVEY 2015 MINISTRY OF HEALTH MALAYSIA
211
Non-Communicable Diseases, Risk Factors & Other Health Problems Volume II
Sociodemographic Characteristics
Count Estimated Population
Prevalence (%)
95% CI
Lower Upper
Ethnicity
Malays 3,431 2,604,560 25.9 24.7 27.2
Chinese 753 1,012,235 23.0 21.1 25.2
Indians 479 422,452 30.8 28.0 33.8
Other Bumiputras 483 546,247 23.5 20.5 26.8
Others 264 359,694 18.3 15.5 21.4
Marital Status
Single 1,081 1,251,795 19.2 17.7 20.7
Married 3,619 3,225,507 26.3 25.1 27.5
Widow/widower/divorcee 710 467,887 36.0 32.9 39.3
Education Level
No formal education 473 362,991 32.3 28.9 35.9
Primary education 1,400 1,042,984 25.4 23.7 27.3
Secondary education 2,448 2,328,275 23.8 22.5 25.1
Tertiary education 1,020 1,146,477 24.1 22.4 25.9
Unclassified education 66 63,418 19.3 14.3 25.6
Occupation
Government/semi government employee
501 444,813 24.4 21.8 27.2
Private employee 1,220 1,438,507 19.4 18.0 21.0
Self employed 882 713,410 22.0 20.4 23.8
Unpaid worker/home maker 1,153 997,872 36.4 34.1 38.9
Retiree 212 150,186 26.3 22.6 30.4
Income Group
Less than RM 1000 1,053 777,646 28.3 26.2 30.6
RM 1000 - RM 1999 988 820,568 24.4 22.4 26.5
RM 2000 - RM 2999 890 756,548 22.7 20.7 24.9
RM 3000 - RM 3999 666 640,694 25.2 22.9 27.7
RM 4000 - RM 4999 463 455,164 23.1 20.6 26.0
RM 5000 - RM 5999 372 398,643 25.2 22.1 28.6
RM 6000 - RM 6999 231 250,273 24.1 20.6 28.0
RM 7000 - RM 7999 195 175,019 22.0 18.2 26.3
RM 8000 - RM 8999 159 184,318 27.6 23.3 32.3
RM 9000 - RM 9999 84 97,946 27.2 20.5 35.1
RM 10000 & above 309 388,369 22.6 19.7 25.7
Quintile Income Group
Quintile 1 916 673,128 28.7 26.4 31.2
Quintile 2 1,017 848,343 24.4 22.3 26.5
Quintile 3 1,121 944,082 22.6 20.8 24.5
Quintile 4 1,110 1,101,293 25.2 23.4 27.1
Quintile 5 1,246 1,378,343 24.0 22.3 25.9
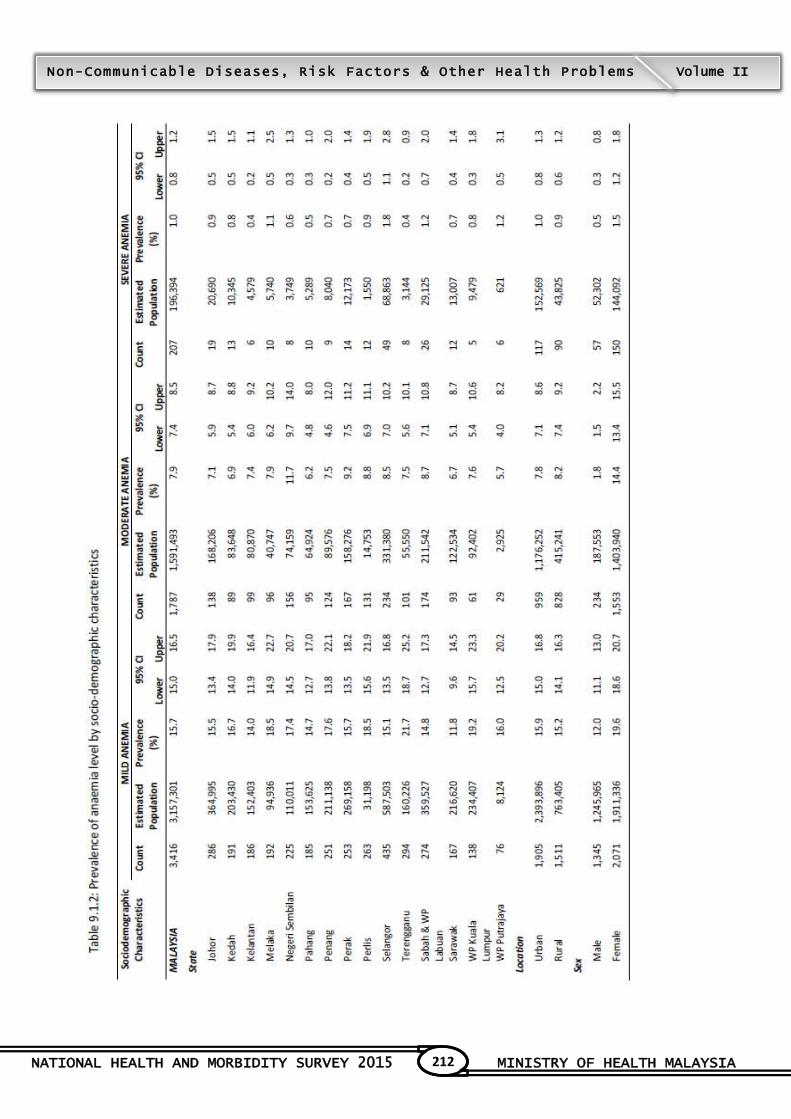
NATIONAL HEALTH AND MORBIDITY SURVEY 2015 MINISTRY OF HEALTH MALAYSIA
212
Non-Communicable Diseases, Risk Factors & Other Health Problems Volume II
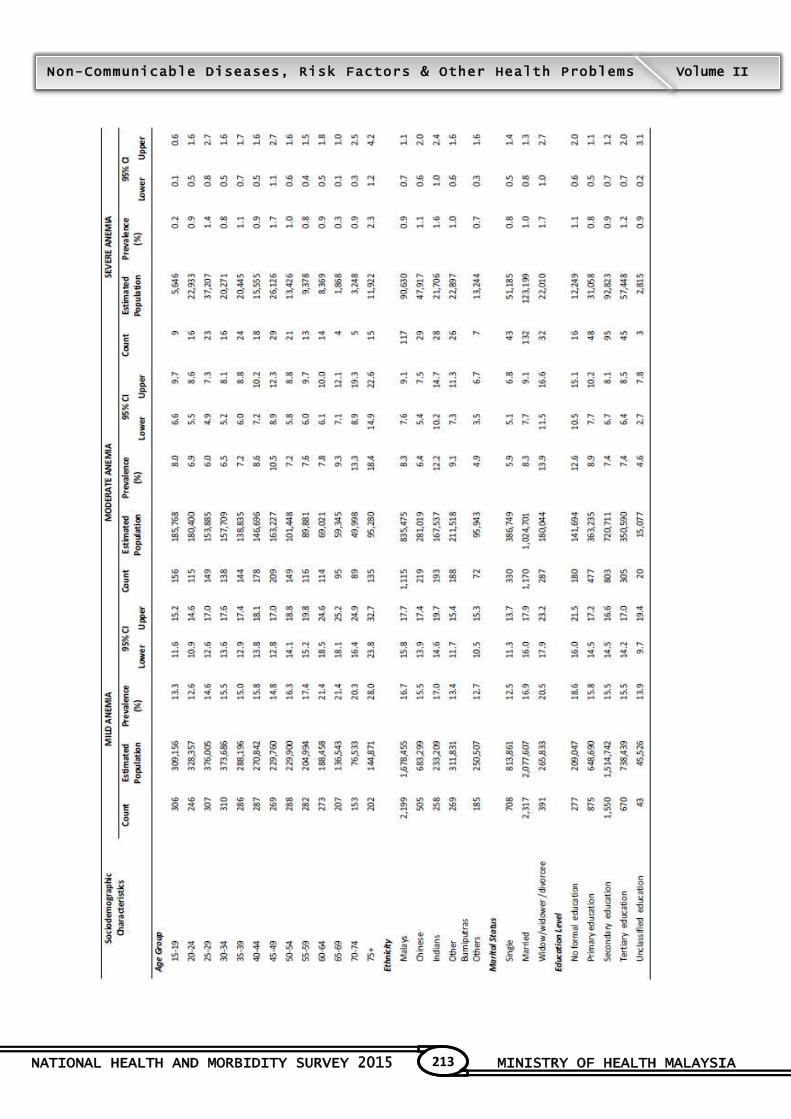
NATIONAL HEALTH AND MORBIDITY SURVEY 2015 MINISTRY OF HEALTH MALAYSIA
213
Non-Communicable Diseases, Risk Factors & Other Health Problems Volume II
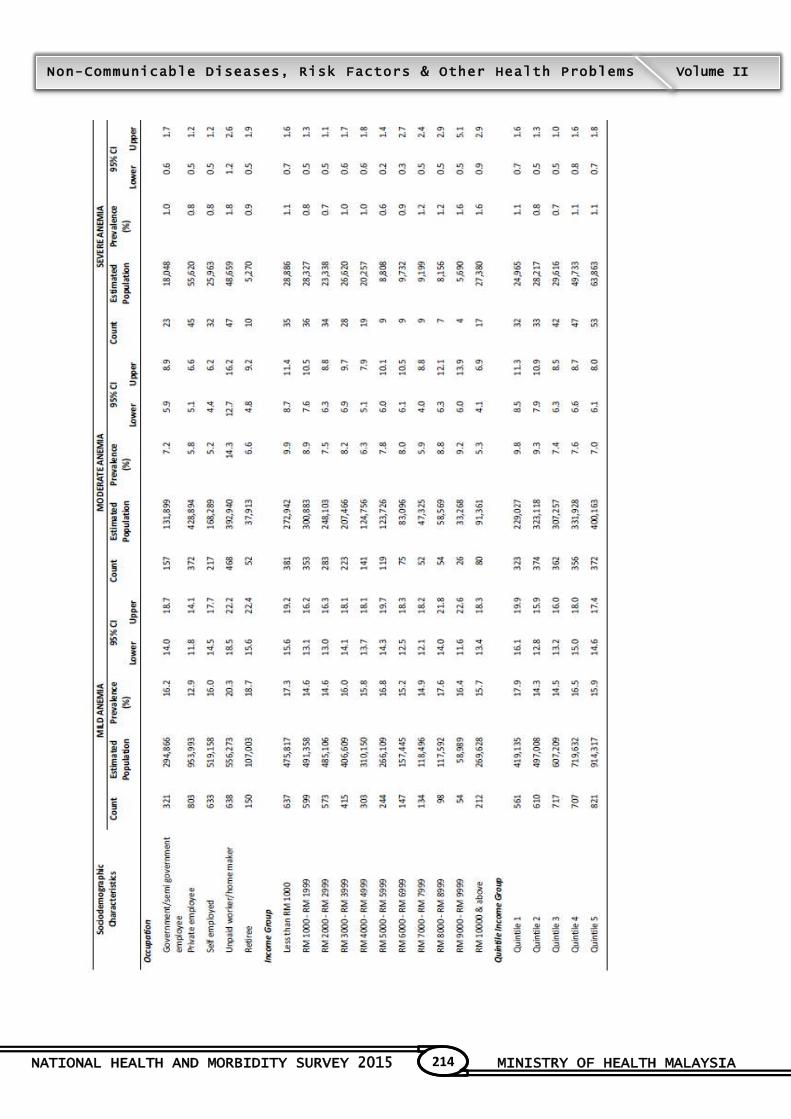
NATIONAL HEALTH AND MORBIDITY SURVEY 2015 MINISTRY OF HEALTH MALAYSIA
214
Non-Communicable Diseases, Risk Factors & Other Health Problems Volume II

TOPIC 10

NATIONAL HEALTH AND MORBIDITY SURVEY 2015 MINISTRY OF HEALTH MALAYSIA
216
Non-Communicable Diseases, Risk Factors & Other Health Problems Volume II
10 DENGUE PREVENTION BEHAVIOUR
Contributors to this section: Kamarul Zaman Salleh, Norzawati Yoep, Zanariah Zaini , Tee Guat
Hiong, Mohd Hazrin Hashim, Ahmad Nadzri Jai, Mohamad Naim Mohamad Rasidi, Sayan Pan,
Noran Naqiah Hairi
10.1 Background
Dengue is among the most important vector-borne diseases of the public health importance. It is
endemic in Malaysia with frequent epidemics in urban areas. Community participation is one of
the critical components in dengue prevention and it needs to be emphasized continuously.
10.2 Objectives
10.2.1 General Objective
To describe community‟s participation on dengue control and prevention in the general
population
10.2.2 Specific Objectives
To describe the practices of the community towards dengue prevention in the general
population
To describe the perception of the community on dengue prevention practices in the general
population
To identify the accessibility of health promotion materials for the prevention of dengue in
the general population.
10.3 Target Population, Study Instrument And Definitions
Data on dengue were obtained from adult respondents aged 18 years and above via face-to-face
interviews by trained research assistants using pre-coded questionnaires. A total of 19,924 eligible
respondents were interviewed in this survey. A set of 24 questions were asked to all adults of the
selected living quarters and all answers from respondents were recorded into e-NHMS 2015
application. The scopes of the questionnaires included components of knowledge, perception and
practice of the respondents in the dengue prevention.
Definition of Terms/Variables
i. Dengue fever
A disease characterized by a sudden onset of high grade fever and associated with
sign and symptoms of headache, myalgia retro-orbital pain, loss of appetite, and
sometimes vomiting, loose stool and abdominal pain
ii. Containers
Any objects or structures that can hold and accumulate water.
iii. Larvicide
A substance use to kill mosquito larva by putting inside the water containers.

NATIONAL HEALTH AND MORBIDITY SURVEY 2015 MINISTRY OF HEALTH MALAYSIA
217
Non-Communicable Diseases, Risk Factors & Other Health Problems Volume II
iv. Fogging
An activity of spraying anti-mosquito chemical using a specific device.
v. Gotong-royong
A special activity involving participation of the community affected with the dengue
fever to clean up and get rid of any objects or structures which can hold and
accumulate water.
vi. Mosquito biting time
Early morning (6-8am) and evening/dusk (6-8pm).
vii. Dengue health education material
Any printed material contains all the information about dengue such as flyers/
pamphlet/ booklet.
10.4 Findings
In the past 12 months prior to the survey, 62.3% (95% CI: 60.6, 63.9) of the respondents followed
the suggestion by the Ministry of Health to “search and destroy” their homes and surroundings to
eliminate mosquito breeding sites at least once a week. Terengganu recorded the highest
prevalence of 47.9% (95% CI: 41.1, 54.7) while Kelantan recorded the lowest prevalence of 24.3%
(95% CI: 20.7, 28.2). There were no significant differences in terms of ethnicity, strata, gender and
education level.
In this survey, the findings indicated that 76.0% (95% CI: 74.7, 77.2) of the respondents cleaned
the containers, changed water and disposed off unwanted containers [73.2% (95% CI: 71.7, 74.8)]
and added larvicide 12.9% (95% CI: 11.9, 13.9) to eliminate indoor breeding sites. Moreover, to
eliminate outdoor breeding sites, majority of the respondents [86.9% (95% CI: 85.9, 87.8)]
disposed off containers that could hold water around their houses.
More than half of the respondents [64.3% (95% CI: 62.3, 66.3)] stated that there were fogging
activities carried out by the Health Department/Local Authority in their neighbourhoods. The
percentages of communities carried out the search and destroy activities through gotong-royong
was 30.6% (95% CI: 28.7, 32.5). However only 58.3% (95% CI: 56.0, 60.5) involved in the
gotong-royong activity.
The percentage of knowledge on active biting time for Aedes mosquitoes among adults was
39.6% (95% CI: 37.9, 41.2). Negeri Sembilan reported having the highest prevalence with 66.2%
(95% CI: 59.5, 72.3) and Sabah (including WP Labuan) reported to have the lowest prevalence
with 26.8% (95% CI: 22.8, 31.2). There was significant difference on the prevalence of knowledge
on active Aedes mosquito biting time among urban 41.1% (95% CI: 39.1, 43.2) and rural 34.5%
(95% CI: 31.9, 37.2) dwellers.
The method used to prevent mosquito bites among adults was mostly by using insecticide aerosol
spray [72.2% (95% CI: 70.8, 73.5)]. Other method frequently used were by: 1) avoiding staying
outdoor during mosquito active biting time [24.7% (95% CI: 23.2, 26.2)], 2) using mosquito coils
[22.8% (95% CI: 21.6, 24.2)] and 3) wearing long pants and long-sleeved shirts [15.1% (95% CI:
14.0, 16.4)].
NATIONAL HEALTH AND MORBIDITY SURVEY 2015 MINISTRY OF HEALTH MALAYSIA
218
Non-Communicable Diseases, Risk Factors & Other Health Problems Volume II
Most of the respondents [83.9% (95% CI: 82.7, 84.9)] reported that they did not use larvicide. The
reasons for not using were: 1) did not have water storage containers in their houses [45.4% (95%
CI: 43.6, 47.2)], 2) did not know there was larvicide [17.9% (95% CI: 16.5, 19.5)] and, 3) did not
know where to get the larvicide [16.3% (95% CI: 15.1, 17.5)]. For those who used larvicide [16.1%
(95% CI: 15.1, 17.3)], most of them recived from the Health Department or Local Authority staff
[45.9% (95% CI: 42.6, 49.2)], bought from the supermarkets [29.2% (95% CI: 26.5, 32.0)] or got it
for free from the government health facilities [11.5% (95% CI: 9.9, 13.3)]. Most of them who used
larvicide read the instructions at the packaging before using it [85.8% (95% CI: 83.7, 87.7)] and
used the larvicide according to the instruction [87.5% (95% CI: 85.6, 89.2)].
Among those who used larvicide, 87.8% (95% CI: 86.0, 89.5) used for water storage containers at
home, 34.1% (95% CI: 31.2, 37.0) used for flower pot liners and 26.7% (95% CI: 24.0, 29.5) used
for containers for aquatic plants.
Nearly half of the respondents [46.2% (95% CI: 44.9, 47.5)] claimed that if they had fever they
would seek treatment from clinics or hospitals on second day of the fever whereas 9.2% (95% CI:
8.5, 9.9) would not seek treatment.
The prevalence of respondents who received dengue health promotion materials was 17.0% (95%
CI: 15.9, 18.2). Wilayah Persekutuan Putrajaya had the highest prevalence [38.1% (95% CI: 31.7,
44.9)] while Kedah had the lowest [7.1% (95% CI: 4.7, 10.7)]. Among those who received dengue
health promotion materials, 66.9% (95% CI: 64.1, 69.5) received flyers while 63.8% (95% CI: 61.2,
66.4) received pamphlets.
Majority of the respondents [95.8% (95% CI: 95.2, 96.2)] knew that dengue can cause death. A
total of, 71.5% (95% CI: 69.9, 73.0) respondents would seek medical treatment immediately if they
had fever, 56.0% (95% CI: 54.4, 57.6) would carry out search and destroy activities at their houses
when they knew that their neighbours were infected with dengue fever.
Almost half of the respondents [47.8% (95% CI: 45.3, 50.4)] stated to use covered garbage
containers to dispose their garbage and 36.6% (95% CI: 34.3, 39.0) reported disposed off their
garbage in allocated areas provided. Majority of the respondents 83.3% (95% CI: 81.7, 84.7)
reported that cleanliness outside their premises was their responsibilities.
On the action to be taken if there was abandoned garbage around their house 65.4% (95% CI:
63.6, 67.2) of the respondents would clean it themselves, followed by reporting to local authorities
[23.3% (95% CI: 21.7, 24.9)]. More than 90% [93.1% (95% CI: 92.4, 93.8)] of the respondents
believed there was a relationship between domestic waste garbage and dengue infection.
NATIONAL HEALTH AND MORBIDITY SURVEY 2015 MINISTRY OF HEALTH MALAYSIA
219
Non-Communicable Diseases, Risk Factors & Other Health Problems Volume II
10.5 Conclusion
In general, respondents perceived that dengue fever is a threat that may lead to death. However,
the respondents did not get treatment immediately after they had fever. Additionally, participation
in search and destroy activities (gotong-royong) and usage of larvicide were poor among
respondents. More than half of the respondents eliminated dengue breeding sites inside and
outside their houses. More than half of the respondents noticed fogging activities carried out by the
Health Department/Local Authority in their neighbourhoods. Majority of the respondents were
aware that it is their responsibilities to clean domestic waste outside their houses. Majority of the
respondents believed there was an association between waste disposal and dengue infection.
Only a small proportion of the respondents received dengue health education materials.

NATIONAL HEALTH AND MORBIDITY SURVEY 2015 MINISTRY OF HEALTH MALAYSIA
220
Non-Communicable Diseases, Risk Factors & Other Health Problems Volume II
Table 10.1.1: Prevalence of adults who did not check their home at least once a week to eliminate
mosquito breading site (aged≥ 18 years old) by socio-demographic
Sociodemographic Characteristics
Count Estimated Population
Prevalence (%)
95% CI
Lower Upper
MALAYSIA 7,176 7,562,376 37.7 36.1 39.4
State
Johor 667 926,200 39.2 34.6 44.0
Kedah 393 444,057 33.8 25.8 42.9
Kelantan 268 241,327 24.3 20.8 28.3
Melaka 274 156,327 27.5 20.3 36.2
Negeri Sembilan 436 260,637 39.0 32.9 45.4
Pahang 470 417,948 42.1 36.2 48.3
Pulau Pinang 609 547,937 45.6 37.9 53.6
Perak 411 523,802 32.0 26.2 38.3
Perlis 537 74,129 46.3 39.3 53.5
Selangor 1,034 1,617,119 38.9 35.2 42.8
Terengganu 561 327,698 47.9 41.1 54.7
Sabah & WP Labuan 455 665,643 29.1 25.5 33.0
Sarawak 570 808,180 46.6 41.2 52.1
WP Kuala Lumpur 300 532,250 43.0 36.6 49.5
WP Putrajaya 191 19,120 39.5 32.9 46.5
Location
Urban 4,206 5,789,902 37.9 36.0 39.9
Rural 2,970 1,772,473 37.2 34.6 39.8
Sex
Male 3,670 4,106,661 39.8 37.8 41.8
Female 3,506 3,455,715 35.6 33.9 37.4
Age Group
18-19 393 482,040 50.8 46.1 55.6
20-24 894 1,272,498 45.4 42.2 48.6
25-29 924 1,202,795 43.7 40.6 46.9
30-34 815 1,013,601 38.9 35.8 42.1
35-39 652 713,380 34.5 31.2 37.9
40-44 563 601,853 32.6 29.6 35.8
45-49 562 512,220 30.7 27.9 33.6
50-54 550 450,724 30.0 27.2 33.0
55-59 475 366,342 29.0 26.2 32.1
60-64 402 280,483 30.0 26.5 33.7
65-69 342 231,718 33.5 29.1 38.3
70-74 248 168,168 42.2 36.2 48.4
75+ 356 266,554 47.8 43.0 52.7

NATIONAL HEALTH AND MORBIDITY SURVEY 2015 MINISTRY OF HEALTH MALAYSIA
221
Non-Communicable Diseases, Risk Factors & Other Health Problems Volume II
Sociodemographic Characteristics
Count Estimated Population
Prevalence (%)
95% CI
Lower Upper
Ethnicity
Malays 4,379 3,666,082 37.2 35.3 39.1
Chinese 1,229 1,840,406 39.1 35.8 42.6
Indians 473 461,436 33.9 29.6 38.4
Other Bumiputras 633 826,207 38.4 34.4 42.7
Others 462 768,245 39.2 33.6 45.0
Marital Status
Single 1,947 2,602,300 46.7 44.0 49.4
Married 4,490 4,423,971 33.8 32.1 35.6
Widow/widower/divorcee 739 536,105 38.5 35.1 42.1
Education Level
No formal education 525 466,728 40.6 36.3 45.0
Primary education 1,696 1,523,083 37.5 35.0 40.1
Secondary education 3,180 3,362,533 36.2 34.4 38.1
Tertiary education 1,676 2,085,726 39.7 37.2 42.2
Unclassified education 93 119,500 43.4 34.1 53.1
Occupation
Government/semi government employee
755 678,055 35.3 32.2 38.5
Private employee 2,472 3,253,282 41.1 38.8 43.4
Self employed 1,279 1,154,585 34.1 31.6 36.7
Unpaid worker/home maker 903 839,035 29.2 27.0 31.6
Retiree 208 176,098 29.0 24.9 33.4
Income Group
Less than RM 1000 1,129 1,024,199 37.7 34.8 40.7
RM 1000 - RM 1999 1,283 1,215,772 36.9 34.3 39.6
RM 2000 - RM 2999 1,199 1,265,301 38.9 36.0 42.0
RM 3000 - RM 3999 938 972,539 37.8 34.9 40.7
RM 4000 - RM 4999 606 695,048 35.3 31.8 38.9
RM 5000 - RM 5999 541 607,781 38.3 34.3 42.6
RM 6000 - RM 6999 339 370,165 35.6 30.6 41.0
RM 7000 - RM 7999 299 340,336 42.3 36.4 48.4
RM 8000 - RM 8999 200 232,435 34.2 28.5 40.3
RM 9000 - RM 9999 123 140,766 40.6 33.3 48.3
RM10000 & above 519 698,033 39.2 35.2 43.3
Quintile Income Group
Quintile 1 970 880,943 37.8 34.7 41.0
Quintile 2 1,312 1,256,108 36.9 34.3 39.6
Quintile 3 1,522 1,586,827 38.4 35.7 41.1
Quintile 4 1,472 1,614,067 36.8 34.3 39.3
Quintile 5 1,900 2,224,432 38.4 36.0 40.9

NATIONAL HEALTH AND MORBIDITY SURVEY 2015 MINISTRY OF HEALTH MALAYSIA
222
Non-Communicable Diseases, Risk Factors & Other Health Problems Volume II
Table 10.1.2: Methods used to eliminate indoor mosquito breeding sites among adults (aged≥ 18 years old)
Method to eliminate mosquito breeding site
Count Estimated Population
Prevalence (%)
95% CI
Lower Upper
Clean container and change water 14,919 15,103,521 76.0 74.7 77.2
Add larvicide 2,809 2,562,498 12.9 11.9 14.0
Dispose of unwanted container 14,514 14,555,273 73.2 71.7 74.8
Others 820 875,372 4.4 3.9 5.0
Table 10.1.3: Methods used to eliminate outdoor mosquito breeding sites among adults (aged≥ 18 years old)
Method to eliminate mosquito breeding site
Count Estimated Population
Prevalence (%)
95% CI
Lower Upper
Dispose of containers that can hold water
17,172 17,288,305 86.9 85.9 87.8
Close tightly water container with lid
7,180 7,516,535 37.8 36.1 39.5
Add larvicide 2,710 2,512,305 12.6 11.7 13.7
Stop using containers that can hold water
7,822 7,954,120 40.0 38.2 41.8
Organize family search and destroy activities
5,066 5,236,562 26.3 24.9 27.8
Clean rain gutters 2,693 2,783,525 14.0 13.0 15.1
Trim overgrown branch that cover rain gutters
2,763 2,615,100 13.1 12.1 14.3
Others 547 574,779 2.9 2.5 3.4
Table 10.1.4: Prevalence of knowledge of active biting time for Aedes mosquitoes among adults (aged ≥18 years old)
Active biting time Count Estimated Population
Prevalence (%)
95% CI
Lower Upper
Early morning 1,119 1,124,564 5.7 5.2 6.3
Noon 64 85,191 0.4 0.3 0.6
Evening/dusk 9,086 9,323,560 47.6 46.0 49.1
Early morning & evening /dusk 8,012 7,750,537 39.6 37.9 41.2
Midnight 1,059 1,314,549 6.7 6.0 7.5
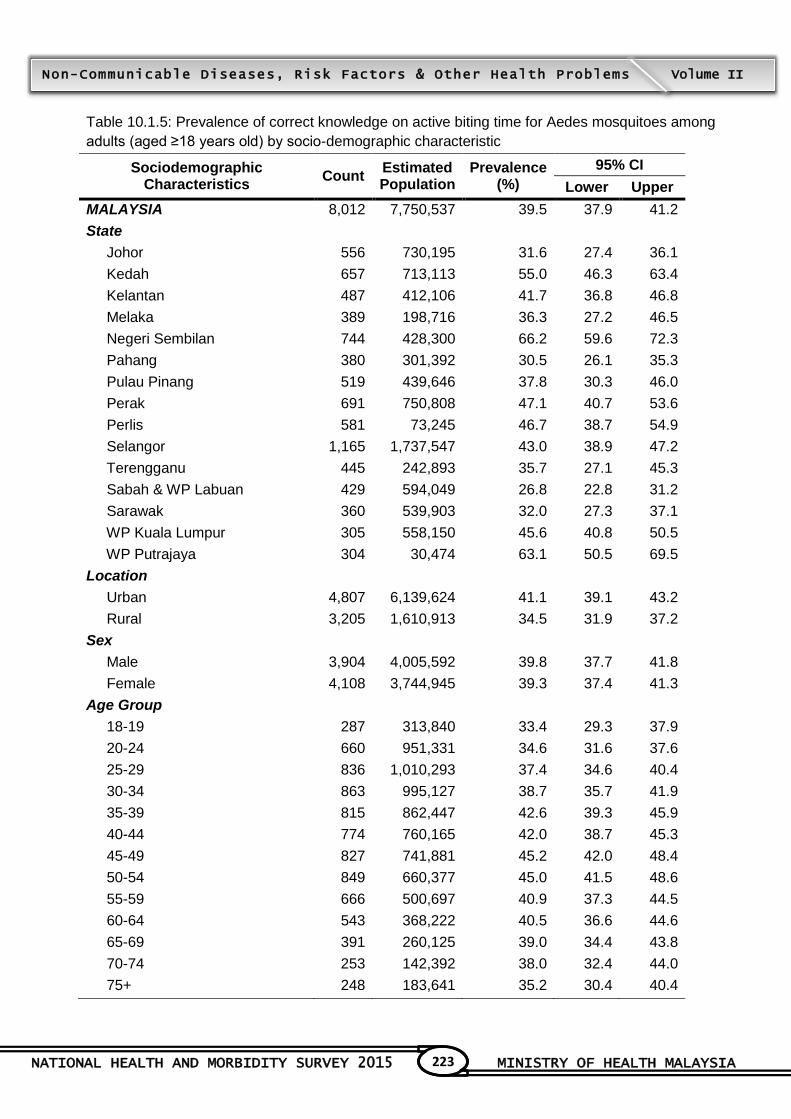
NATIONAL HEALTH AND MORBIDITY SURVEY 2015 MINISTRY OF HEALTH MALAYSIA
223
Non-Communicable Diseases, Risk Factors & Other Health Problems Volume II
Table 10.1.5: Prevalence of correct knowledge on active biting time for Aedes mosquitoes among
adults (aged ≥18 years old) by socio-demographic characteristic
Sociodemographic Characteristics
Count Estimated Population
Prevalence (%)
95% CI
Lower Upper
MALAYSIA 8,012 7,750,537 39.5 37.9 41.2
State
Johor 556 730,195 31.6 27.4 36.1
Kedah 657 713,113 55.0 46.3 63.4
Kelantan 487 412,106 41.7 36.8 46.8
Melaka 389 198,716 36.3 27.2 46.5
Negeri Sembilan 744 428,300 66.2 59.6 72.3
Pahang 380 301,392 30.5 26.1 35.3
Pulau Pinang 519 439,646 37.8 30.3 46.0
Perak 691 750,808 47.1 40.7 53.6
Perlis 581 73,245 46.7 38.7 54.9
Selangor 1,165 1,737,547 43.0 38.9 47.2
Terengganu 445 242,893 35.7 27.1 45.3
Sabah & WP Labuan 429 594,049 26.8 22.8 31.2
Sarawak 360 539,903 32.0 27.3 37.1
WP Kuala Lumpur 305 558,150 45.6 40.8 50.5
WP Putrajaya 304 30,474 63.1 50.5 69.5
Location
Urban 4,807 6,139,624 41.1 39.1 43.2
Rural 3,205 1,610,913 34.5 31.9 37.2
Sex
Male 3,904 4,005,592 39.8 37.7 41.8
Female 4,108 3,744,945 39.3 37.4 41.3
Age Group
18-19 287 313,840 33.4 29.3 37.9
20-24 660 951,331 34.6 31.6 37.6
25-29 836 1,010,293 37.4 34.6 40.4
30-34 863 995,127 38.7 35.7 41.9
35-39 815 862,447 42.6 39.3 45.9
40-44 774 760,165 42.0 38.7 45.3
45-49 827 741,881 45.2 42.0 48.4
50-54 849 660,377 45.0 41.5 48.6
55-59 666 500,697 40.9 37.3 44.5
60-64 543 368,222 40.5 36.6 44.6
65-69 391 260,125 39.0 34.4 43.8
70-74 253 142,392 38.0 32.4 44.0
75+ 248 183,641 35.2 30.4 40.4
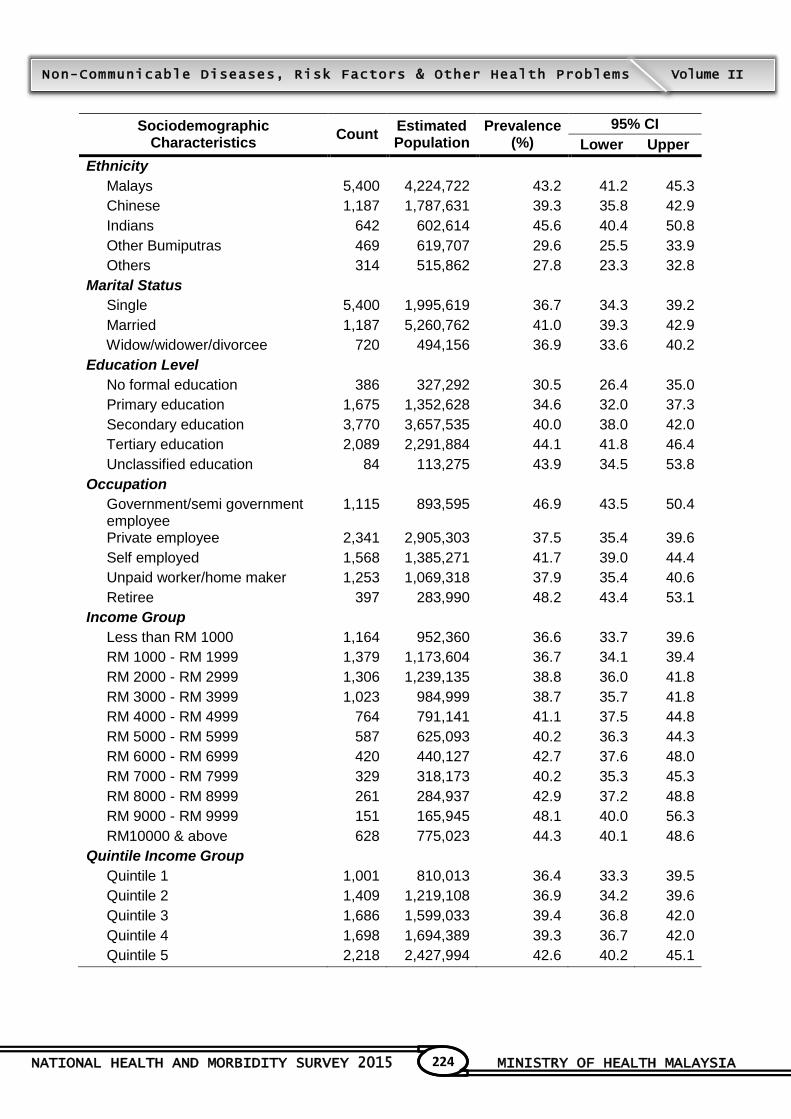
NATIONAL HEALTH AND MORBIDITY SURVEY 2015 MINISTRY OF HEALTH MALAYSIA
224
Non-Communicable Diseases, Risk Factors & Other Health Problems Volume II
Sociodemographic Characteristics
Count Estimated Population
Prevalence (%)
95% CI
Lower Upper
Ethnicity
Malays 5,400 4,224,722 43.2 41.2 45.3
Chinese 1,187 1,787,631 39.3 35.8 42.9
Indians 642 602,614 45.6 40.4 50.8
Other Bumiputras 469 619,707 29.6 25.5 33.9
Others 314 515,862 27.8 23.3 32.8
Marital Status
Single 5,400 1,995,619 36.7 34.3 39.2
Married 1,187 5,260,762 41.0 39.3 42.9
Widow/widower/divorcee 720 494,156 36.9 33.6 40.2
Education Level
No formal education 386 327,292 30.5 26.4 35.0
Primary education 1,675 1,352,628 34.6 32.0 37.3
Secondary education 3,770 3,657,535 40.0 38.0 42.0
Tertiary education 2,089 2,291,884 44.1 41.8 46.4
Unclassified education 84 113,275 43.9 34.5 53.8
Occupation
Government/semi government employee
1,115 893,595 46.9 43.5 50.4
Private employee 2,341 2,905,303 37.5 35.4 39.6
Self employed 1,568 1,385,271 41.7 39.0 44.4
Unpaid worker/home maker 1,253 1,069,318 37.9 35.4 40.6
Retiree 397 283,990 48.2 43.4 53.1
Income Group
Less than RM 1000 1,164 952,360 36.6 33.7 39.6
RM 1000 - RM 1999 1,379 1,173,604 36.7 34.1 39.4
RM 2000 - RM 2999 1,306 1,239,135 38.8 36.0 41.8
RM 3000 - RM 3999 1,023 984,999 38.7 35.7 41.8
RM 4000 - RM 4999 764 791,141 41.1 37.5 44.8
RM 5000 - RM 5999 587 625,093 40.2 36.3 44.3
RM 6000 - RM 6999 420 440,127 42.7 37.6 48.0
RM 7000 - RM 7999 329 318,173 40.2 35.3 45.3
RM 8000 - RM 8999 261 284,937 42.9 37.2 48.8
RM 9000 - RM 9999 151 165,945 48.1 40.0 56.3
RM10000 & above 628 775,023 44.3 40.1 48.6
Quintile Income Group
Quintile 1 1,001 810,013 36.4 33.3 39.5
Quintile 2 1,409 1,219,108 36.9 34.2 39.6
Quintile 3 1,686 1,599,033 39.4 36.8 42.0
Quintile 4 1,698 1,694,389 39.3 36.7 42.0
Quintile 5 2,218 2,427,994 42.6 40.2 45.1

NATIONAL HEALTH AND MORBIDITY SURVEY 2015 MINISTRY OF HEALTH MALAYSIA
225
Non-Communicable Diseases, Risk Factors & Other Health Problems Volume II
Table 10.1.6: Prevalence of preventive measure taken to prevent mosquito bites among adults
(aged≥ 18 years old)
Preventive measure Count Estimated Population
Prevalence (%)
95% CI
Lower Upper
Use repellent 2,036 2,304,789 11.5 10.6 12.6
Use insecticide aerosol spray 14,158 14,429,689 72.2 70.8 73.5
Use hand losyen 927 1,177,340 5.9 5.2 6.7
Wear long pants and long -sleeved shirts
2,655 3,027,939 15.1 14.0 16.4
Avoid staying outdoor during mosquito active time
4,782 4,936,682 24.7 23.2 26.2
Use mosquito patch 1,453 1,469,529 7.4 6.6 8.2
Use mosquito screens on windows and doors
738 839,601 4.2 3.7 4.8
Eating herbs 62 54,513 0.3 0.2 0.5
Sleeping under mosquito net 2,314 1,805,724 9.0 8.3 9.8
Use mosquito coil 4,804 4,566,147 22.8 21.6 24.2
Others 998 1,067,748 5.3 4.5 6.3
Table 10.1.7: Prevalence of reasons for not using larvicide among adults (aged≥ 18 years old)
Reason for not using the larvicide Count Estimated Population
Prevalence (%)
95% CI
Lower Upper
Do not know there is larvicide 2,416 2,974,711 17.9 16.5 19.5
Do not have water storage in the house
7,409 7,528,612 45.4 43.6 47.2
Do not know how to use 1,689 1,611,640 9.7 8.9 10.6
Dangerous to health 458 427,145 2.6 2.2 3.0
Do not know where to get the larvicide
2,563 2,701,687 16.3 15.1 17.5
Difficult to find 860 826,668 5.0 4.3 5.8
Expensive 43 30,646 0.2 0.1 0.3
Others 459 489,191 2.9 2.5 3.5
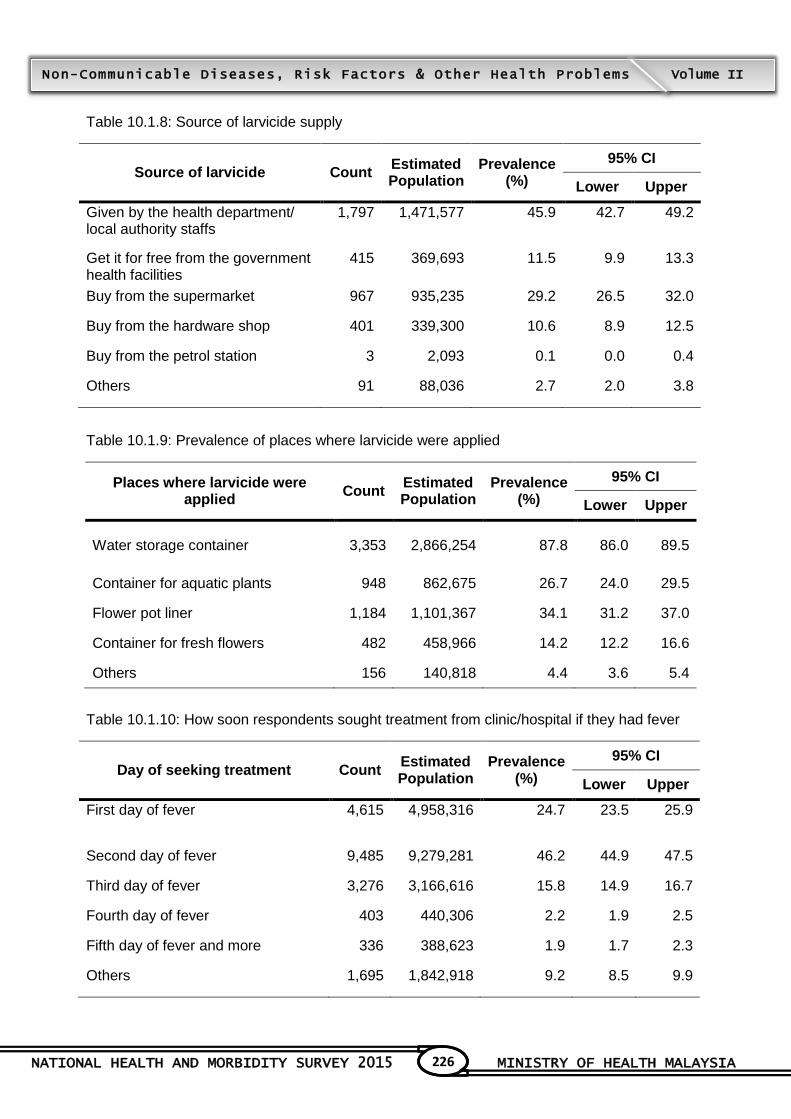
NATIONAL HEALTH AND MORBIDITY SURVEY 2015 MINISTRY OF HEALTH MALAYSIA
226
Non-Communicable Diseases, Risk Factors & Other Health Problems Volume II
Table 10.1.8: Source of larvicide supply
Source of larvicide Count Estimated Population
Prevalence (%)
95% CI
Lower Upper
Given by the health department/ local authority staffs
1,797 1,471,577 45.9 42.7 49.2
Get it for free from the government health facilities
415 369,693 11.5 9.9 13.3
Buy from the supermarket 967 935,235 29.2 26.5 32.0
Buy from the hardware shop 401 339,300 10.6 8.9 12.5
Buy from the petrol station 3 2,093 0.1 0.0 0.4
Others 91 88,036 2.7 2.0 3.8
Table 10.1.9: Prevalence of places where larvicide were applied
Places where larvicide were applied
Count Estimated Population
Prevalence (%)
95% CI
Lower Upper
Water storage container 3,353 2,866,254 87.8 86.0 89.5
Container for aquatic plants 948 862,675 26.7 24.0 29.5
Flower pot liner 1,184 1,101,367 34.1 31.2 37.0
Container for fresh flowers 482 458,966 14.2 12.2 16.6
Others 156 140,818 4.4 3.6 5.4
Table 10.1.10: How soon respondents sought treatment from clinic/hospital if they had fever
Day of seeking treatment Count Estimated Population
Prevalence (%)
95% CI
Lower Upper
First day of fever 4,615 4,958,316 24.7 23.5 25.9
Second day of fever 9,485 9,279,281 46.2 44.9 47.5
Third day of fever 3,276 3,166,616 15.8 14.9 16.7
Fourth day of fever 403 440,306 2.2 1.9 2.5
Fifth day of fever and more 336 388,623 1.9 1.7 2.3
Others 1,695 1,842,918 9.2 8.5 9.9
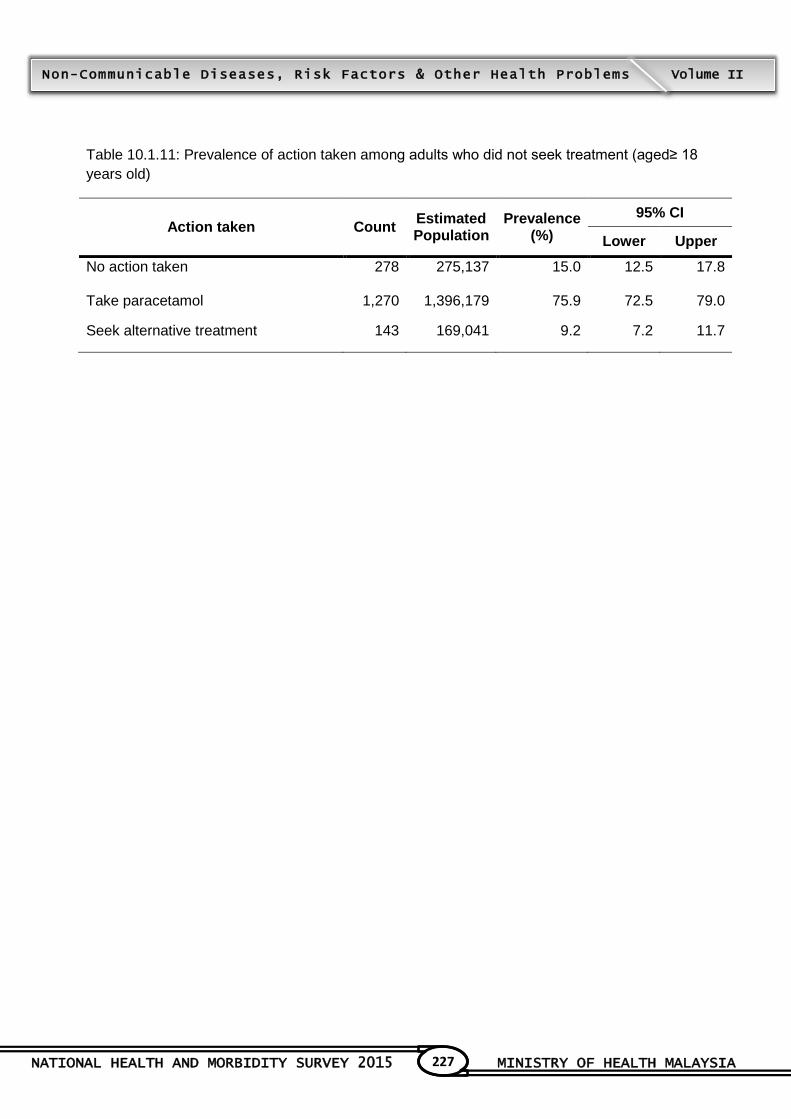
NATIONAL HEALTH AND MORBIDITY SURVEY 2015 MINISTRY OF HEALTH MALAYSIA
227
Non-Communicable Diseases, Risk Factors & Other Health Problems Volume II
Table 10.1.11: Prevalence of action taken among adults who did not seek treatment (aged≥ 18
years old)
Action taken Count Estimated Population
Prevalence (%)
95% CI
Lower Upper
No action taken 278 275,137 15.0 12.5 17.8
Take paracetamol 1,270 1,396,179 75.9 72.5 79.0
Seek alternative treatment 143 169,041 9.2 7.2 11.7

NATIONAL HEALTH AND MORBIDITY SURVEY 2015 MINISTRY OF HEALTH MALAYSIA
228
Non-Communicable Diseases, Risk Factors & Other Health Problems Volume II
Table 10.1.12: Prevalence of adults who received the health promotion material by socio-
demographic characteristics
Sociodemographic Characteristics
Count Estimated Population
Prevalence (%)
95% CI
Lower Upper
MALAYSIA 3,507 3,410,189 17.0 15.9 18.2
State
Johor 315 386,782 16.4 13.1 20.5
Kedah 98 92,972 7.1 4.7 10.7
Kelantan 417 352,219 35.0 27.8 43.0
Melaka 245 102,534 18.1 13.3 24.3
Negeri Sembilan 93 63,887 9.5 6.3 14.1
Pahang 239 182,170 18.4 14.0 23.7
Pulau Pinang 249 175,976 14.6 10.0 21.0
Perak 202 295,601 18.1 14.2 22.7
Perlis 175 22,515 14.2 9.7 20.3
Selangor 451 734,619 17.7 15.2 20.6
Terengganu 308 191,102 27.9 23.1 33.2
Sabah & WP Labuan 279 398,507 17.4 14.4 20.9
Sarawak 129 192,517 11.1 7.9 15.3
WP Kuala Lumpur 117 200,389 16.2 12.3 21.1
WP Putrajaya 190 18,399 38.1 31.7 44.9
Location
Urban 2,200 2,663,586 17.5 16.1 18.9
Rural 1,307 746,603 15.6 13.9 17.6
Sex
Male 1,634 1,722,026 16.7 15.4 18.1
Female 1,873 1,688,163 17.4 16.1 18.8
Age Group
18-19 114 128,008 13.5 11.0 16.5
20-24 326 496,058 17.6 15.5 20.0
25-29 388 475,561 17.3 15.1 19.7
30-34 382 407,076 15.7 13.5 18.1
35-39 376 383,405 18.6 16.2 21.3
40-44 350 357,832 19.4 16.9 22.1
45-49 369 306,891 18.4 16.2 20.8
50-54 370 283,501 18.9 16.5 21.5
55-59 302 213,061 16.9 14.6 19.5
60-64 214 151,007 16.2 13.3 19.6
65-69 152 98,501 14.3 11.6 17.5
70-74 100 58,586 14.7 11.3 18.9
75+ 64 50,704 9.2 6.7 12.5

NATIONAL HEALTH AND MORBIDITY SURVEY 2015 MINISTRY OF HEALTH MALAYSIA
229
Non-Communicable Diseases, Risk Factors & Other Health Problems Volume II
Sociodemographic Characteristics
Count Estimated Population
Prevalence (%)
95% CI
Lower Upper
Ethnicity
Malays 2,490 2,071,851 21.0 19.4 22.7
Chinese 389 578,590 12.3 12.3 0.9
Indians 206 194,952 14.3 11.3 17.9
Other Bumiputras 292 353,001 16.5 13.6 19.8
Others 130 211,795 10.9 8.2 14.3
Marital Status
Single 667 909,976 16.3 14.7 18.1
Married 2,580 2,312,422 17.7 16.5 19.0
Widow/widower/divorcee 260 187,791 13.5 11.5 15.8
Education Level
No formal education 140 97,980 8.5 6.8 10.7
Primary education 658 541,837 13.4 11.8 15.2
Secondary education 1,644 1,599,119 17.2 15.8 18.7
Tertiary education 1,030 1,129,013 21.5 19.7 23.4
Unclassified education 34 41,940 15.5 9.8 23.8
Occupation
Government/semi government employee
589 496,938 25.8 23.1 28.8
Private employee 1,016 1,275,966 16.1 14.6 17.8
Self employed 666 592,339 17.5 15.7 19.4
Unpaid worker/home maker 570 457,909 15.9 14.2 17.8
Retiree 154 123,234 20.3 16.8 24.4
Income Group
Less than RM 1000 420 350,709 13.0 11.3 14.9
RM 1000 - RM 1999 558 481,791 14.7 12.9 16.6
RM 2000 - RM 2999 590 562,426 17.3 15.2 19.7
RM 3000 - RM 3999 482 492,610 19.1 16.8 21.6
RM 4000 - RM 4999 327 322,285 16.3 13.8 19.2
RM 5000 - RM 5999 271 254,869 16.2 13.5 19.3
RM 6000 - RM 6999 200 221,658 21.3 17.3 26.0
RM 7000 - RM 7999 166 162,386 20.3 16.2 25.0
RM 8000 - RM 8999 140 157,971 23.1 18.6 28.4
RM 9000 - RM 9999 70 82,773 23.9 17.1 32.3
RM10000 & above 283 320,712 18.1 15.0 21.6
Quintile Income Group
Quintile 1 364 298,690 12.9 11.1 14.9
Quintile 2 555 490,080 14.4 12.7 16.4
Quintile 3 736 708,848 17.1 15.2 19.2
Quintile 4 771 770,018 17.5 15.7 19.6
Quintile 5 1,081 1,142,554 19.8 18.0 21.8
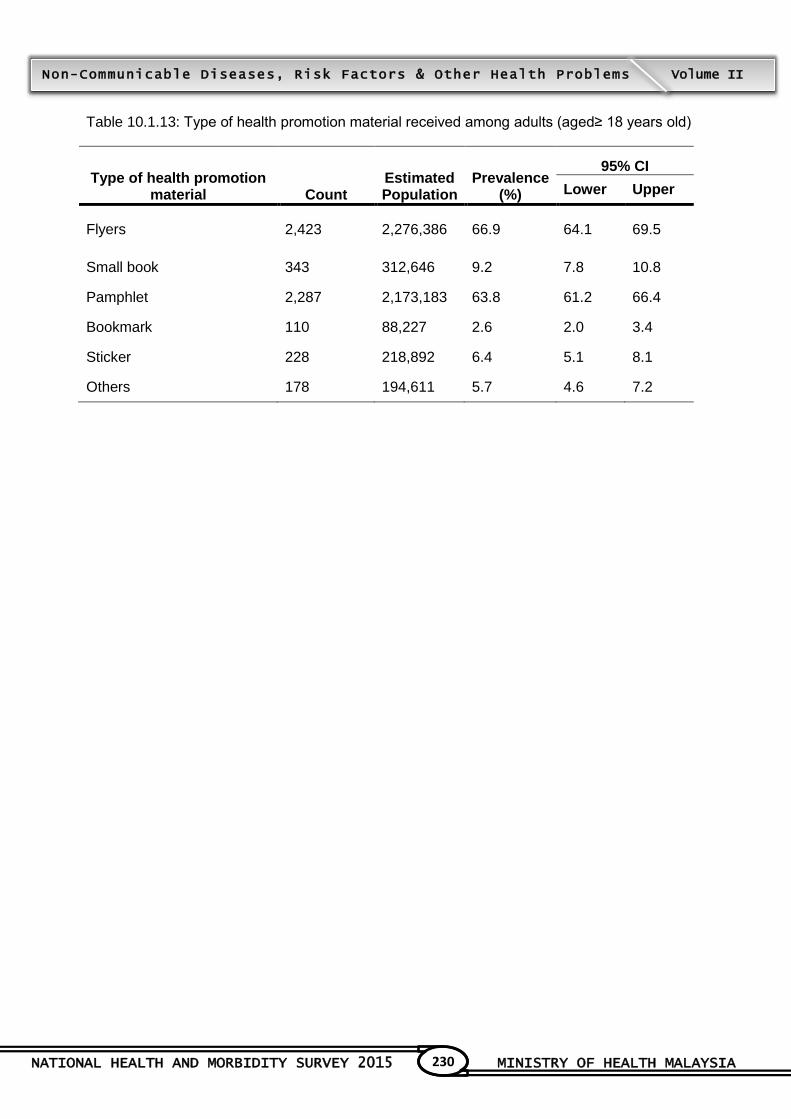
NATIONAL HEALTH AND MORBIDITY SURVEY 2015 MINISTRY OF HEALTH MALAYSIA
230
Non-Communicable Diseases, Risk Factors & Other Health Problems Volume II
Table 10.1.13: Type of health promotion material received among adults (aged≥ 18 years old)
Type of health promotion material Count
Estimated Population
Prevalence (%)
95% CI
Lower Upper
Flyers 2,423 2,276,386 66.9 64.1 69.5
Small book 343 312,646 9.2 7.8 10.8
Pamphlet 2,287 2,173,183 63.8 61.2 66.4
Bookmark 110 88,227 2.6 2.0 3.4
Sticker 228 218,892 6.4 5.1 8.1
Others 178 194,611 5.7 4.6 7.2

NATIONAL HEALTH AND MORBIDITY SURVEY 2015 MINISTRY OF HEALTH MALAYSIA
231
Non-Communicable Diseases, Risk Factors & Other Health Problems Volume II
Table 10.1.14: Prevalence of adults who knew dengue can cause death (aged≥ 18 years old) by
socio-demographic characteristics
Sociodemographic Characteristics
Count Estimated Population
Prevalence (%)
95% CI
Lower Upper
MALAYSIA 18,807 19,067,691 95.8 95.2 96.3
State
Johor 1,697 2,212,840 94.9 93.2 96.1
Kedah 1,180 1,219,874 94.7 92.2 96.4
Kelantan 1,150 981,850 97.8 96.4 98.7
Melaka 1,097 537,627 95.3 92.8 96.9
Negeri Sembilan 1,160 631,181 94.1 90.5 96.4
Pahang 1,164 941,913 96.0 94.3 97.2
Pulau Pinang 1,298 1,143,978 96.1 92.9 97.9
Perak 1,287 1,552,832 94.9 92.8 96.4
Perlis 1,164 142,803 89.9 86.1 92.8
Selangor 2,614 3,959,189 95.9 94.4 97.1
Terengganu 1,158 668,077 97.4 95.8 98.4
Sabah & WP Labuan 1,536 2,196,828 97.2 95.9 98.1
Sarawak 1,170 1,649,622 95.0 92.0 96.9
WP Kuala Lumpur 657 1,181,337 96.4 93.3 98.1
WP Putrajaya 475 47,739 98.6 96.7 99.4
Location
Urban 10,897 14,557,385 95.9 95.3 96.5
Rural 7,910 4,510,306 95.2 94.1 96.1
Sex
Male 8,903 9,814,069 95.8 95.1 96.4
Female 9,904 9,253,622 95.8 95.0 96.4
Age Group
18-19 756 897,139 95.2 93.1 96.8
20-24 1,791 2,663,931 94.9 93.2 96.2
25-29 2,034 2,603,694 95.5 94.2 96.6
30-34 1,986 2,465,934 95.3 93.8 96.5
35-39 1,820 1,982,992 97.0 96.0 97.8
40-44 1,701 1,754,695 95.8 94.1 97.0
45-49 1,783 1,604,564 96.5 95.1 97.5
50-54 1,814 1,444,529 96.4 95.1 97.3
55-59 1,605 1,213,276 96.2 94.8 97.2
60-64 1,270 895,013 96.2 94.5 97.4
65-69 951 657,681 96.8 95.0 98.0
70-74 635 376,252 95.6 92.3 97.6
75+ 661 507,990 92.9 90.2 94.9
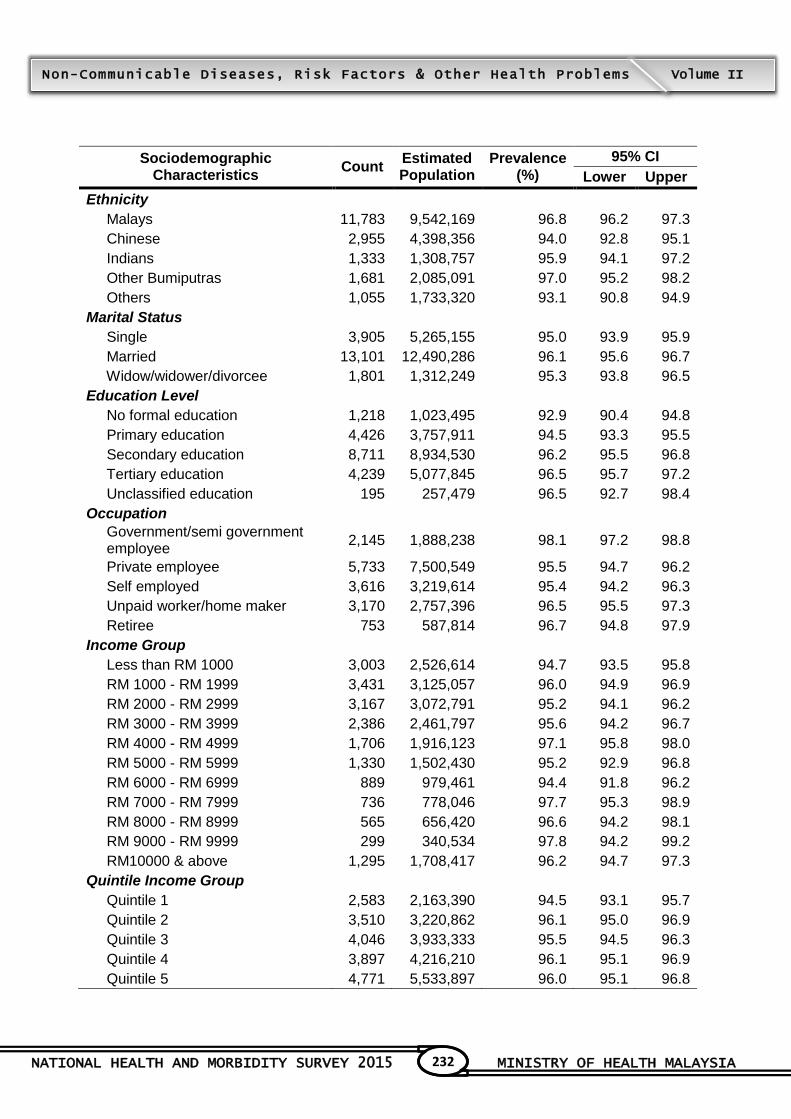
NATIONAL HEALTH AND MORBIDITY SURVEY 2015 MINISTRY OF HEALTH MALAYSIA
232
Non-Communicable Diseases, Risk Factors & Other Health Problems Volume II
Sociodemographic Characteristics
Count Estimated Population
Prevalence (%)
95% CI
Lower Upper
Ethnicity
Malays 11,783 9,542,169 96.8 96.2 97.3
Chinese 2,955 4,398,356 94.0 92.8 95.1
Indians 1,333 1,308,757 95.9 94.1 97.2
Other Bumiputras 1,681 2,085,091 97.0 95.2 98.2
Others 1,055 1,733,320 93.1 90.8 94.9
Marital Status
Single 3,905 5,265,155 95.0 93.9 95.9
Married 13,101 12,490,286 96.1 95.6 96.7
Widow/widower/divorcee 1,801 1,312,249 95.3 93.8 96.5
Education Level
No formal education 1,218 1,023,495 92.9 90.4 94.8
Primary education 4,426 3,757,911 94.5 93.3 95.5
Secondary education 8,711 8,934,530 96.2 95.5 96.8
Tertiary education 4,239 5,077,845 96.5 95.7 97.2
Unclassified education 195 257,479 96.5 92.7 98.4
Occupation
Government/semi government employee
2,145 1,888,238 98.1 97.2 98.8
Private employee 5,733 7,500,549 95.5 94.7 96.2
Self employed 3,616 3,219,614 95.4 94.2 96.3
Unpaid worker/home maker 3,170 2,757,396 96.5 95.5 97.3
Retiree 753 587,814 96.7 94.8 97.9
Income Group
Less than RM 1000 3,003 2,526,614 94.7 93.5 95.8
RM 1000 - RM 1999 3,431 3,125,057 96.0 94.9 96.9
RM 2000 - RM 2999 3,167 3,072,791 95.2 94.1 96.2
RM 3000 - RM 3999 2,386 2,461,797 95.6 94.2 96.7
RM 4000 - RM 4999 1,706 1,916,123 97.1 95.8 98.0
RM 5000 - RM 5999 1,330 1,502,430 95.2 92.9 96.8
RM 6000 - RM 6999 889 979,461 94.4 91.8 96.2
RM 7000 - RM 7999 736 778,046 97.7 95.3 98.9
RM 8000 - RM 8999 565 656,420 96.6 94.2 98.1
RM 9000 - RM 9999 299 340,534 97.8 94.2 99.2
RM10000 & above 1,295 1,708,417 96.2 94.7 97.3
Quintile Income Group
Quintile 1 2,583 2,163,390 94.5 93.1 95.7
Quintile 2 3,510 3,220,862 96.1 95.0 96.9
Quintile 3 4,046 3,933,333 95.5 94.5 96.3
Quintile 4 3,897 4,216,210 96.1 95.1 96.9
Quintile 5 4,771 5,533,897 96.0 95.1 96.8
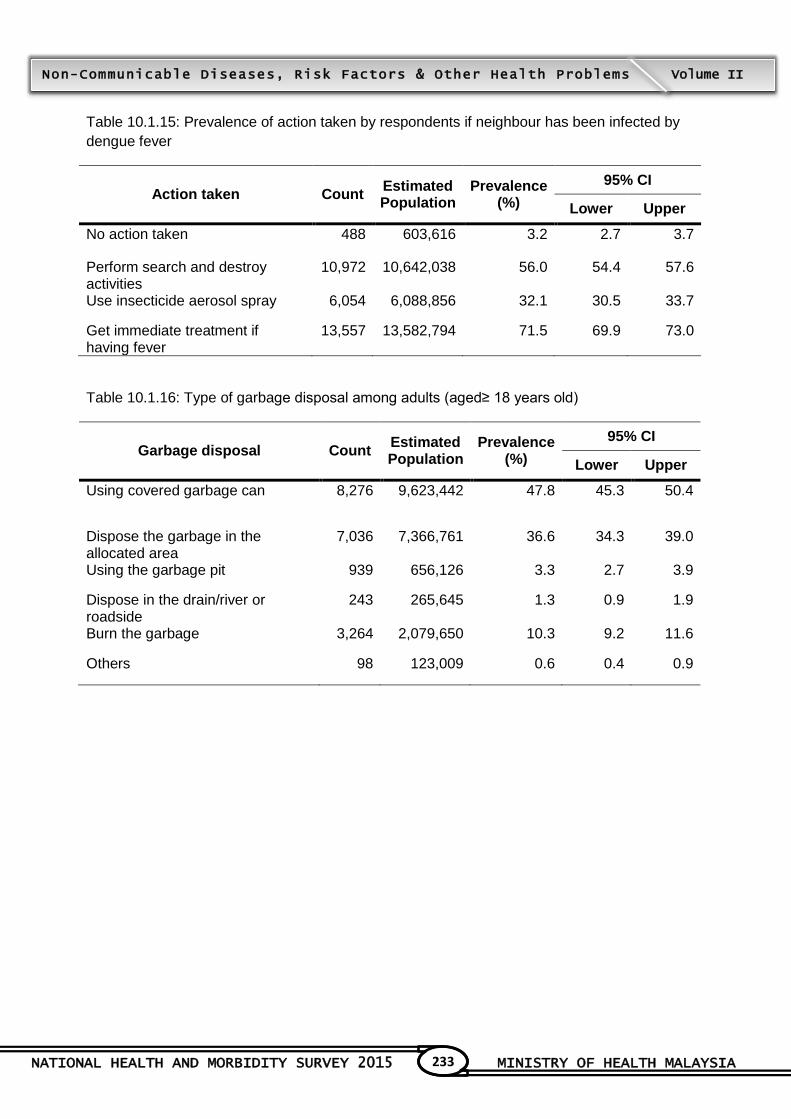
NATIONAL HEALTH AND MORBIDITY SURVEY 2015 MINISTRY OF HEALTH MALAYSIA
233
Non-Communicable Diseases, Risk Factors & Other Health Problems Volume II
Table 10.1.15: Prevalence of action taken by respondents if neighbour has been infected by
dengue fever
Action taken Count Estimated Population
Prevalence (%)
95% CI
Lower Upper
No action taken 488 603,616 3.2 2.7 3.7
Perform search and destroy activities
10,972 10,642,038 56.0 54.4 57.6
Use insecticide aerosol spray 6,054 6,088,856 32.1 30.5 33.7
Get immediate treatment if having fever
13,557 13,582,794 71.5 69.9 73.0
Table 10.1.16: Type of garbage disposal among adults (aged≥ 18 years old)
Garbage disposal Count Estimated Population
Prevalence (%)
95% CI
Lower Upper
Using covered garbage can 8,276 9,623,442 47.8 45.3 50.4
Dispose the garbage in the allocated area
7,036 7,366,761 36.6 34.3 39.0
Using the garbage pit 939 656,126 3.3 2.7 3.9
Dispose in the drain/river or roadside
243 265,645 1.3 0.9 1.9
Burn the garbage 3,264 2,079,650 10.3 9.2 11.6
Others 98 123,009 0.6 0.4 0.9
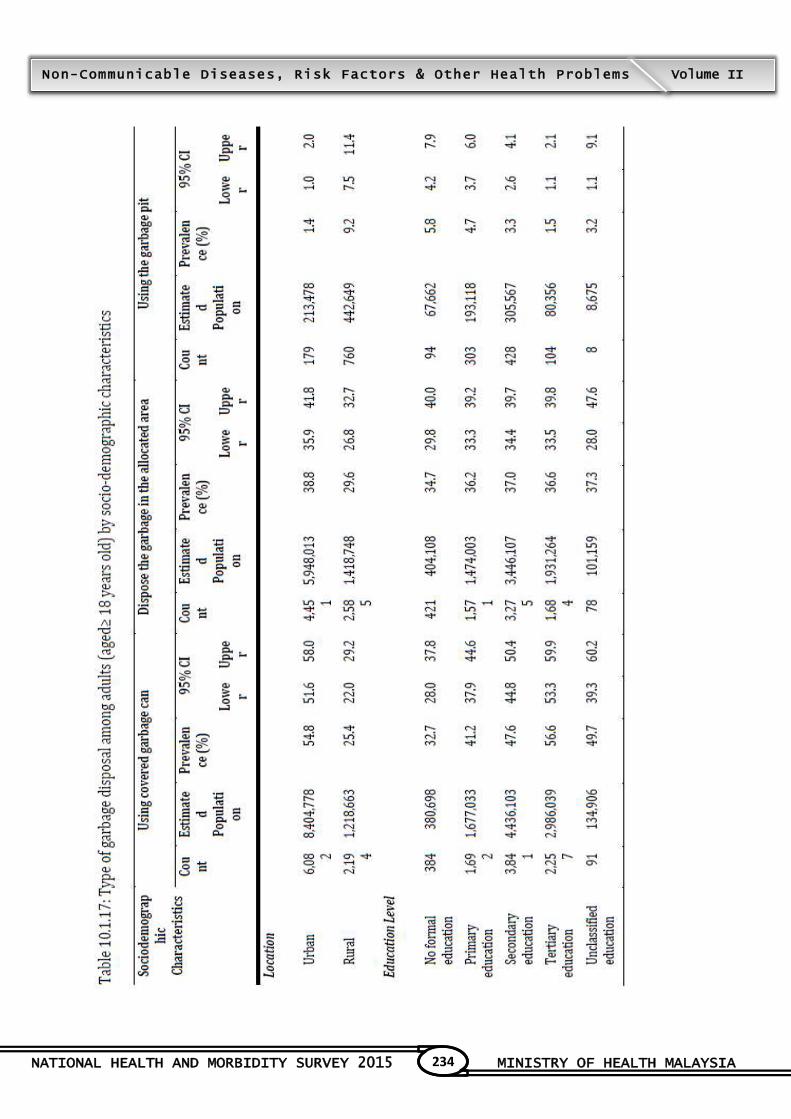
NATIONAL HEALTH AND MORBIDITY SURVEY 2015 MINISTRY OF HEALTH MALAYSIA
234
Non-Communicable Diseases, Risk Factors & Other Health Problems Volume II
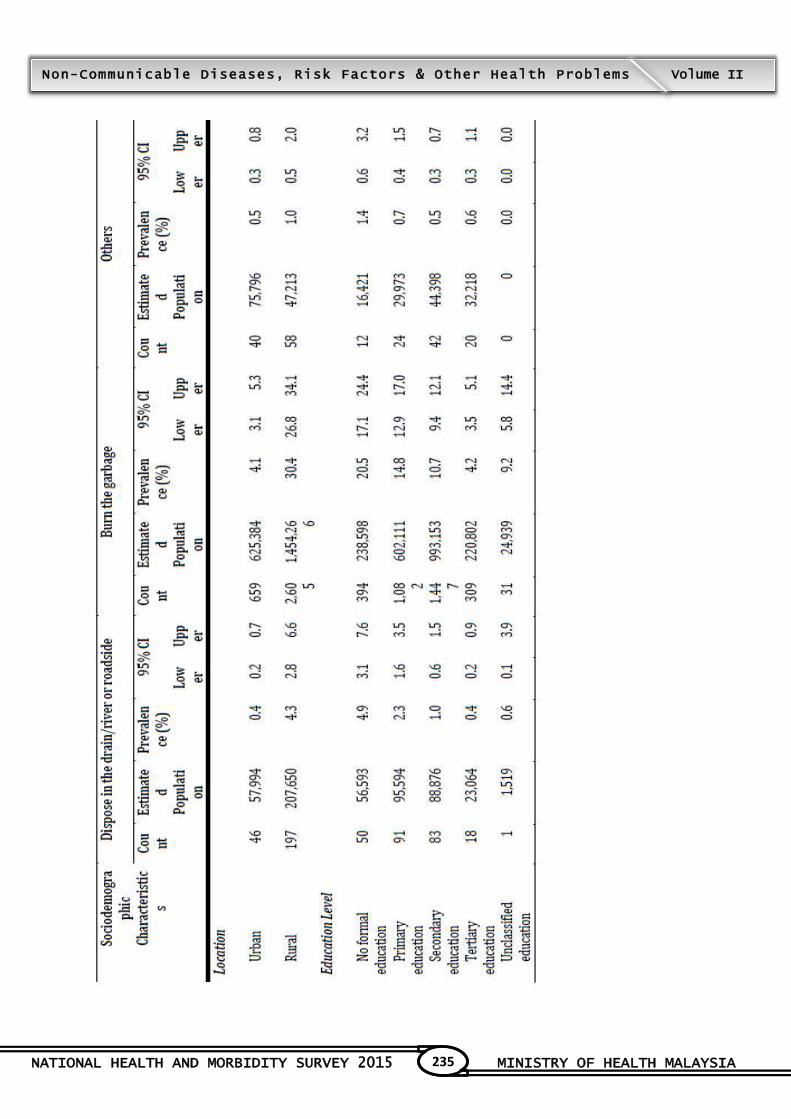
NATIONAL HEALTH AND MORBIDITY SURVEY 2015 MINISTRY OF HEALTH MALAYSIA
235
Non-Communicable Diseases, Risk Factors & Other Health Problems Volume II
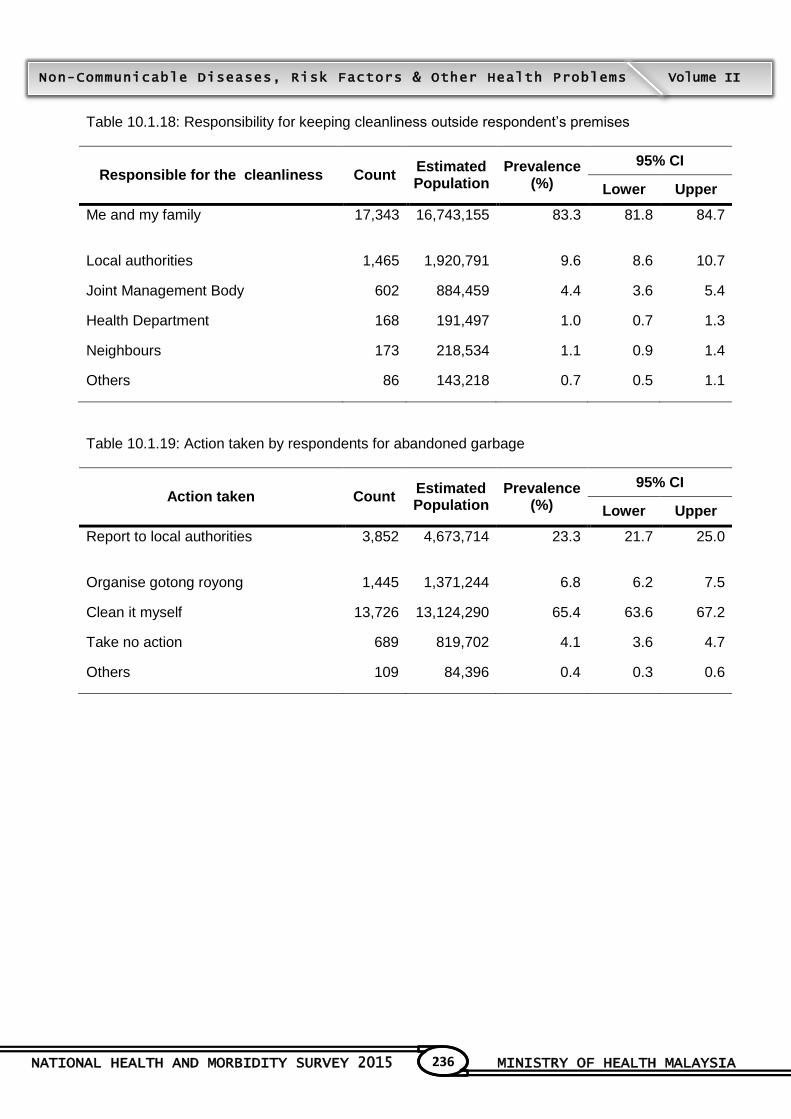
NATIONAL HEALTH AND MORBIDITY SURVEY 2015 MINISTRY OF HEALTH MALAYSIA
236
Non-Communicable Diseases, Risk Factors & Other Health Problems Volume II
Table 10.1.18: Responsibility for keeping cleanliness outside respondent‟s premises
Responsible for the cleanliness Count Estimated Population
Prevalence (%)
95% CI
Lower Upper
Me and my family 17,343 16,743,155 83.3 81.8 84.7
Local authorities 1,465 1,920,791 9.6 8.6 10.7
Joint Management Body 602 884,459 4.4 3.6 5.4
Health Department 168 191,497 1.0 0.7 1.3
Neighbours 173 218,534 1.1 0.9 1.4
Others 86 143,218 0.7 0.5 1.1
Table 10.1.19: Action taken by respondents for abandoned garbage
Action taken Count Estimated Population
Prevalence (%)
95% CI
Lower Upper
Report to local authorities 3,852 4,673,714 23.3 21.7 25.0
Organise gotong royong 1,445 1,371,244 6.8 6.2 7.5
Clean it myself 13,726 13,124,290 65.4 63.6 67.2
Take no action 689 819,702 4.1 3.6 4.7
Others 109 84,396 0.4 0.3 0.6

TOPIC 11

NATIONAL HEALTH AND MORBIDITY SURVEY 2015 MINISTRY OF HEALTH MALAYSIA
238
Non-Communicable Diseases, Risk Factors & Other Health Problems Volume II
11 TUBERCULOSIS
Contributors to this section: Joanita Sulaiman, Faizah Paiwai, Asmah Razali, Tee Guat Hiong,
Mohd Hatta Abdul Mutalip, Norazizah Ibrahim Wong, Sobashini a/p Kanniah, Muhammad Ismail,
Noran Naqiah Hairi, Jiloris F. Dony, Mohamed Naim Abdul Kadir
11.1 Background
Tuberculosis (TB) is an infectious airborne disease and a major global health problem. In 2013,
World Health Organization (WHO) estimated about 9 million people fell ill with TB globally.
However, only about 5.7 million newly diagnosed TB were reported to the national TB programmes
worldwide. Therefore, it is believed that about 3 million people with TB were „missed‟1. This is
either because they were not diagnosed or they were diagnosed but not reported. In Malaysia, the
reported number of TB cases in 2014 were 24, 711 cases with notification rate of 81 per 100,000
populations. Case detection rate of new and relapse cases in 2014 was 94.5%. This was less than
the targeted detection rate of 98%2. Thus, it is hoped that the surveillance on health seeking
behaviour and TB screening of TB-like symptom will help the TB control program in Malaysia to
identify gaps and challenges in order to plan effective intervention to control TB transmission.
11.2 Objectives
11.2.1 General Objective
To determine the prevalence of TB-like symptoms in Malaysia.
11.2.2 Specific objectives
To determine the health seeking behaviour of individuals with TB-like symptoms.
To determine the percentage of individuals with TB-like symptoms who were screened for
TB when sought treatment at either government or private health care facilities.
To identify the reasons behind individuals with TB-like symptoms who did not seek
treatment.
11.3 Methodology
11.3.1 Target Population
The tuberculosis data was obtained from respondents 15 years and above surveyed by trained
research assistants using pre-coded questionnaires. Respondents were asked whether they
had one or more TB-like symptoms which included coughing, coughing up phlegm, having
fever and night sweats for duration of more than two weeks as well as cough up blood and
unexpected loss of weight. Those individuals with TB-like symptoms who sought treatment at
government and/or private healthcare facilities were asked on the TB screening offered to
them by the facilities. For individuals with TB-like symptoms who did not seek any treatment
were investigated further for the reasons behind their decisions.
NATIONAL HEALTH AND MORBIDITY SURVEY 2015 MINISTRY OF HEALTH MALAYSIA
239
Non-Communicable Diseases, Risk Factors & Other Health Problems Volume II
11.3.2 Definition of Variables/ Terms
Individuals with TB-like symptoms were defined based on self-reporting of having one or more
TB symptoms in the last one month. These symptoms included coughing, coughing up
phlegm, having fever and night sweats for duration of more than two weeks as well as cough
up blood and unexpected loss of weight.
Health seeking behaviour was defined as actions taken by individuals with TB-like symptoms
in seeking treatment by self-medication, purchased medicines from pharmacies, seeking
treatment from traditional healers as well as from government and/or private healthcare
facilities.
Individuals with TB-like symptoms who sought treatment at government and/or private health
care facilities were asked on the TB screening offered to them by the facilities.
TB screening was defined as individuals with TB-like symptom having sputum examination
and/or chest x-ray conducted in government and/or private healthcare facilities.
11.4 Findings
A total of 1,380 respondents were found to have TB-like symptoms. This self-reported survey had
an estimated population of 1,474,861 Malaysians aged 15 years and above. The overall
prevalence of individuals with TB-like symptom in Malaysia was 5.0% (4.6, 5.5) with the highest
prevalence in Sarawak [7.8% (5.9, 10.2)] followed by Selangor [6.6% (5.4, 8.1)] and Sabah & WP
Labuan [6.6% (5.3, 8.1)]. The lowest was in the state of Penang with 1.6% (1.0, 2.6). The
prevalence of TB-like symptom was at 5.8% (5.1, 6.8) in the rural areas and 4.7% (4.2, 5.4) in the
urban areas with no significant difference (Table 11.1.1).
The prevalence of TB-like symptoms among non-Malaysians and Malaysians were 7.4% (5.2,
10.4) and 4.8% (4.4, 5.3) respectively with no significant difference. Individuals with TB-like
symptoms increased as age group increased from 5.8% (4.9, 6.9) in 26 - 35 years to 9.4% (7.8,
11.2) in >65 years old (Table 11.1.1).
This study showed that individuals with TB-like symptoms self-medicated [46.3% (42.8, 49.9)],
followed by purchased of medicines from pharmacies [37.6% (34.3, 41.1)]. In choosing healthcare
facilities, most respondents sought treatment from government health clinics [34.2% (30.6, 38.0)]
compared to other health care facilities. The difference in self-medication as compared to other
health seeking behaviour was statistically significant. A total of 9.6% (7.5, 12.2) of individuals with
TB-like symptoms did not do anything (Table 11.1.3).
Among individuals with TB-like symptoms who sought treatment in government and/or private
health care facilities, 26.6% (23.2, 30.4) reported to have had gone through sputum examination,
while 20.8% (17.8, 24.2) reported to have chest X-ray done (Table 11.1.4).
NATIONAL HEALTH AND MORBIDITY SURVEY 2015 MINISTRY OF HEALTH MALAYSIA
240
Non-Communicable Diseases, Risk Factors & Other Health Problems Volume II
A total of 27.8% (22.5, 33.8) of individuals with TB-like symptoms claimed to have their sputum
examined when they sought treatment in government hospitals, as compared to 24.9% (20.4,
30.1) of those who sought treatment in government clinics, 15.9% (12.1, 20.6) in private clinics
and 19.7% (12.3, 29.9) in private hospitals. The prevalence of having chest X-ray by individuals
with TB-like symptoms who sought treatment at government hospitals was 26.1% (21.1, 31.8),
21.8% (14.2, 31.8) at private hospitals, 18.4% (14.9, 22.4) at government health clinics and 12.4%
(8.2, 18.3) at private clinics (Table 11.1.5).
The main reasons for not seeking treatment among those with TB-like symptoms were because
they perceived the illness was not severe/serious [47.5% (36.1, 59.1)], treatments were not
required [19.3% (11.0, 31.6) and considered the health problem would resolve by itself [7.0% (2.3,
19.4) (Table 11.1.6).
11.5 Conclusion
The overall prevalence of self-reported TB-like symptom was 5.0%. The highest prevalence of
individuals with TB-like symptoms was reported in Sarawak and predominantly in rural areas. The
highest prevalence of individuals with TB-like symptoms was among those aged 65 years and
above. Our findings showed that individuals with TB-like symptoms were more likely to self-
medicate than sought treatment from healthcare providers. Those who sought medical treatment
at government hospitals were more likely to be screened for TB compared to government clinics,
private hospitals and private clinics. Those individuals with TB-like symptoms who did not seek
treatment believed the illness was not severe or serious enough to require any medical attention.
11.6 References
1. World Health Organization. (2014). Global tuberculosis control 2014.
2. Ministry of Health, Malaysia. (2014). Annual report 2014. (Unpublished data).

NATIONAL HEALTH AND MORBIDITY SURVEY 2015 MINISTRY OF HEALTH MALAYSIA
241
Non-Communicable Diseases, Risk Factors & Other Health Problems Volume II
Table 11.1.1: Prevalence of individuals with TB-like symptoms 15 years and above by socio-
demographic characteristics
Sociodemographic Characteristics
Count Estimated Population
Prevalence (%)
95% CI
Lower Upper
MALAYSIA 1380 1,474,861 5.0 4.6 5.5
State
Johor 115 155,105 4.6 3.4 6.2
Kedah 73 68,525 3.5 2.1 5.6
Kelantan 98 79,655 4.9 3.5 6.6
Melaka 47 27,957 3.4 1.5 7.4
Negeri Sembilan 57 28,318 2.8 1.8 4.3
Pahang 68 47,127 3.1 2.1 4.4
Pulau Pinang 66 26,648 1.6 1.0 2.6
Perak 89 96,323 4.1 3.0 5.7
Perlis 57 6,898 2.9 2.0 4.3
Selangor 269 385,787 6.6 5.4 8.1
Terengganu 55 33,818 3.0 2.0 4.5
Sabah & WP Labuan
164 228,458 6.6 5.3 8.1
Sarawak 138 200,167 7.8 5.9 10.2
WP Kuala Lumpur 51 86,829 5.1 3.0 8.5
WP Putrajaya 33 3,246 3.8 2.6 5.5
Location
Urban 759 1,048,392 4.7 4.2 5.4
Rural 621 426,469 5.8 5.1 6.8
Sex
Male 616 715,134 4.7 4.2 5.3
Female 764 759,728 5.3 4.8 6.0
Age Group
15-25 281 421,368 7.0 6.0 8.1
26-35 248 304,501 5.8 4.9 6.9
36-45 204 232,918 6.0 4.9 7.4
46-55 237 222,059 7.1 6.0 8.5
56-65 221 152,853 7.3 6.1 8.7
> 65 189 141,162 9.4 7.8 11.2
Nationality
Malaysian 1284 1,303,526 4.8 4.4 5.3
Non-malaysians 96 171,336 7.4 5.2 10.4
Ethnicity
Malays 849 755,124 4.9 4.4 5.5
Chinese 156 221,568 3.5 2.8 4.4
Indians 101 104,340 5.4 4.1 7.1
Other Bumiputras 186 227,917 6.6 5.2 8.3
Others 88 165,912 7.3 5.2 10.1

NATIONAL HEALTH AND MORBIDITY SURVEY 2015 MINISTRY OF HEALTH MALAYSIA
242
Non-Communicable Diseases, Risk Factors & Other Health Problems Volume II
Sociodemographic Characteristics
Count Estimated Population
Prevalence (%)
95% CI
Lower Upper
Marital Status
Single 337 479,097 5.8 5.0 6.7
Married 893 876,854 6.6 5.9 7.4
Widow/ widower/ divorcee 150 118,910 8.5 6.7 10.6
Education Level
No formal education 133 111,701 6.3 5.1 7.9
Primary education 374 340,337 4.4 3.7 5.2
Secondary education 598 665,817 6.2 5.5 7.0
Tertiary education 255 325,614 6.2 5.3 7.2
Unclassified education 18 29,521 2.8 1.6 5.0
Occupation
Government/semi government employee
136 134,911 7.0 5.6 8.8
Private employee 373 524,207 6.4 5.5 7.5
Self employed 264 238,518 6.9 5.8 8.2
Unpaid worker/home maker 221 188,674 6.5 5.4 7.7
Retiree 44 36,560 6.0 4.2 8.6
Income Group
Less than RM 1000 245 204,673 5.1 4.2 6.1
RM 1000 - RM 1999 264 263,389 5.4 4.5 6.4
RM 2000 - RM 2999 238 239,435 5.0 4.2 6.0
RM 3000 - RM 3999 169 216,304 5.7 4.5 7.1
RM 4000 - RM 4999 111 116,086 4.0 3.0 5.3
RM 5000 - RM 5999 111 131,442 5.8 4.4 7.6
RM 6000 - RM 6999 63 81,349 5.5 4.1 7.5
RM 7000 - RM 7999 40 47,164 3.9 2.6 5.8
RM 8000 - RM 8999 37 46,856 4.6 2.8 7.5
RM 9000 - RM 9999 21 20,094 4.0 2.3 7.0
RM 10000 & Above 81 108,069 4.3 3.3 5.5
Quintile Income Group
Quintile 1 210 176,296 5.1 4.2 6.2
Quintile 2 272 269,027 5.3 4.5 6.3
Quintile 3 292 293,981 4.8 4.1 5.7
Quintile 4 275 333,354 5.2 4.3 6.3
Quintile 5 331 402,203 4.8 4.1 5.7

NATIONAL HEALTH AND MORBIDITY SURVEY 2015 MINISTRY OF HEALTH MALAYSIA
243
Non-Communicable Diseases, Risk Factors & Other Health Problems Volume II
Table 11.1.2: Proportion of TB-like symptoms among respondents aged 15 years and above
The presence of TB-like symptoms Count Proportion
(%)
1 symptom
Cough > 2 weeks in the past 1 month 977 4.6
Cough up phlegm or sputum > 2 weeks in the past 1 month
581 2.7
Cough up blood for the past 1 month 50 0.2
Fever of > 2 weeks in the past 1 month 199 0.9
Unexpected loss of weight in the past 1 month 251 1.2
Drenching sweats for > 2 weeks in the past 1 month 260 1.2
1 + 1 symptoms
*Cough + fever 124 0.6
*Cough + unexpected loss of weight 111 0.5
*Cough + drenching night sweats 122 0.6
1 + 2 Symptoms
*Cough + fever + unexpected loss of weight 35 0.2
*Cough + fever + drenching night sweat 37 0.2
1 + 3 Symptoms
*Cough+ fever + loss of weight + drenching night sweat 16 0.1
*Cough = Any kind of cough; i.e. either cough > 2 weeks in the past 1 month or cough up phlegm or sputum
> 2 weeks in the past 1 month or cough up blood for the past 1 month
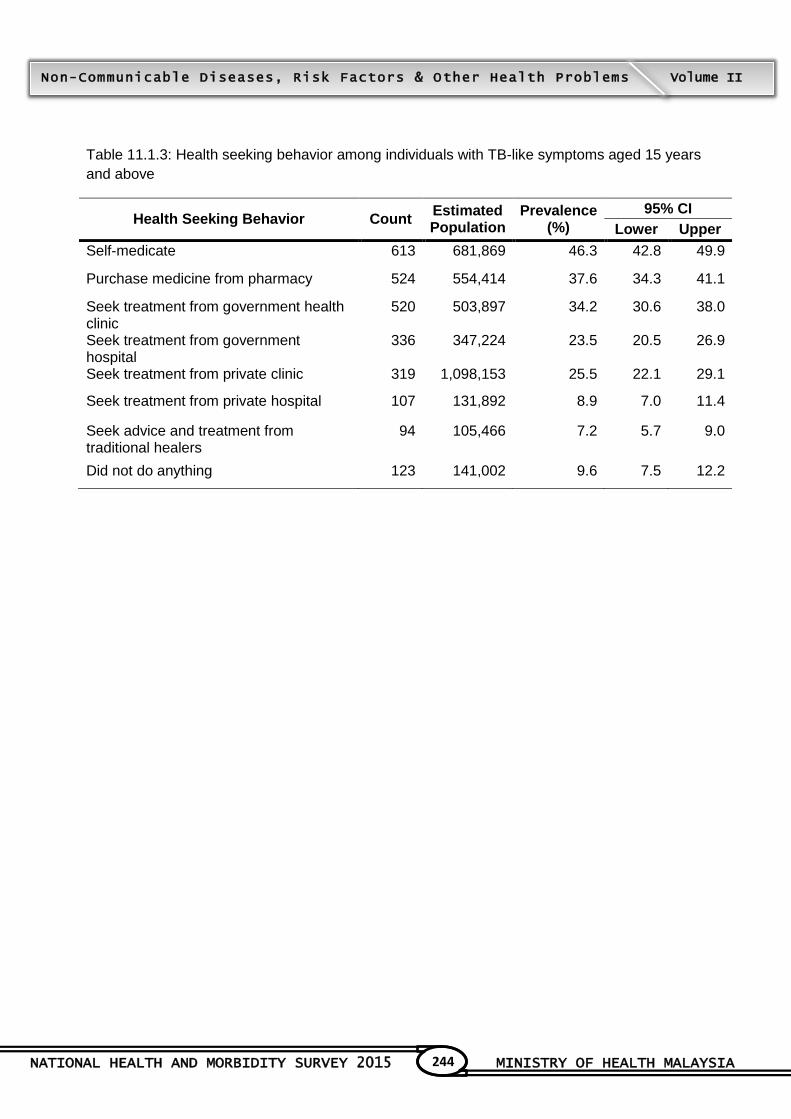
NATIONAL HEALTH AND MORBIDITY SURVEY 2015 MINISTRY OF HEALTH MALAYSIA
244
Non-Communicable Diseases, Risk Factors & Other Health Problems Volume II
Table 11.1.3: Health seeking behavior among individuals with TB-like symptoms aged 15 years
and above
Health Seeking Behavior Count Estimated Population
Prevalence (%)
95% CI
Lower Upper
Self-medicate 613 681,869 46.3 42.8 49.9
Purchase medicine from pharmacy 524 554,414 37.6 34.3 41.1
Seek treatment from government health clinic
520 503,897 34.2 30.6 38.0
Seek treatment from government hospital
336 347,224 23.5 20.5 26.9
Seek treatment from private clinic 319 1,098,153 25.5 22.1 29.1
Seek treatment from private hospital 107 131,892 8.9 7.0 11.4
Seek advice and treatment from traditional healers
94 105,466 7.2 5.7 9.0
Did not do anything 123 141,002 9.6 7.5 12.2
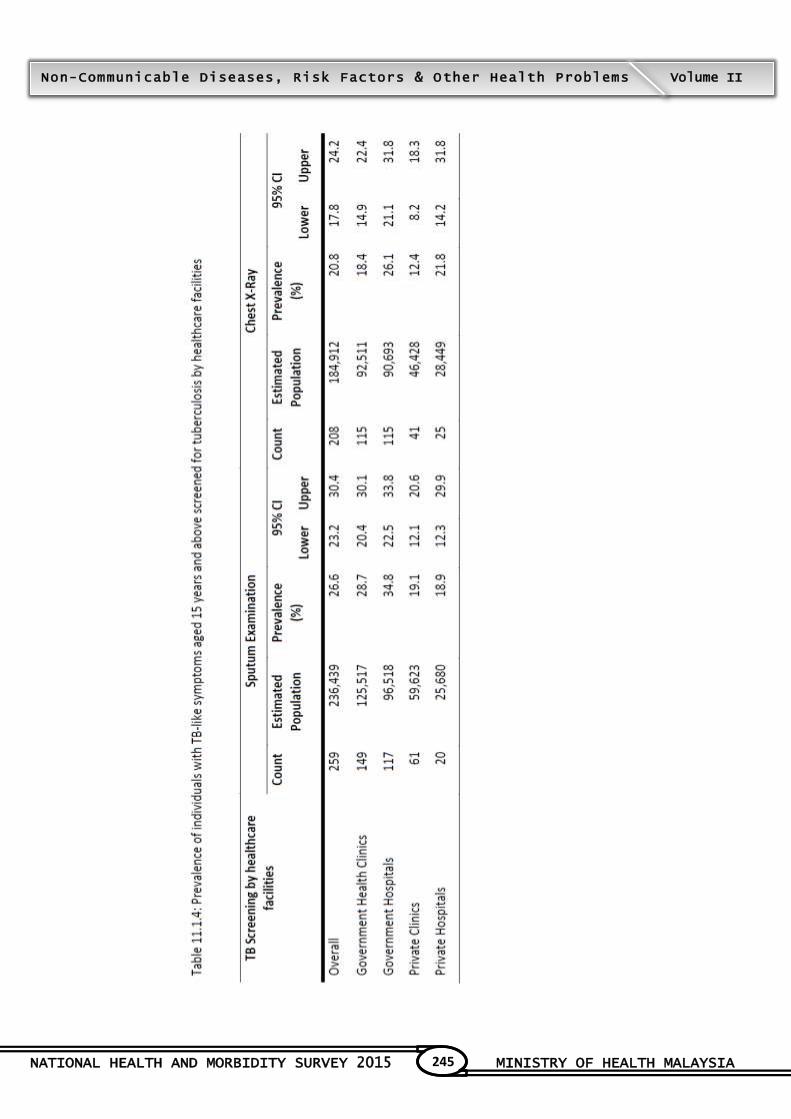
NATIONAL HEALTH AND MORBIDITY SURVEY 2015 MINISTRY OF HEALTH MALAYSIA
245
Non-Communicable Diseases, Risk Factors & Other Health Problems Volume II

NATIONAL HEALTH AND MORBIDITY SURVEY 2015 MINISTRY OF HEALTH MALAYSIA
246
Non-Communicable Diseases, Risk Factors & Other Health Problems Volume II
Table 11.1.5: Reasons for not seeking treatment for individuals with TB-like symptoms aged 15
years and above
Reasons for not seeking treatment
Count Estimated Population
Prevalence (%)
95% CI
Lower Upper
Already on treatment 3 3,996 3.4 1.1 10.4
Perceived the illness is not severe/ serious
52 55,149 47.5 36.1 59.1
Fear of negative effects of treatment
1 708 0.6 0.1 4.3
Fear of healthcare provider 3 3,725 3.2 0.8 12.3
Fear of instrument or treatment 0 0 - - -
Busy at work place 2 1,663 1.4 0.2 8.7
Unable to take leave from employer
0 0 - - -
Busy with household chores / home / child
2 4,203 3.6 0.7 16.7
Shy to see healthcare provider 1 1,786 1.5 0.2 9.3
Gender preference (healthcare provider)
0 0 - - -
Stigma 0 0 - - -
Cannot afford to pay for the treatment
2 585 0.5 0.1 2.0
No transport 0 0 - - -
Cannot afford to pay for the transport
0 0 - - -
Insufficient drugs or equipment at the healthcare facilities
0 0 - - -
Incompetent healthcare provider 0 0 - - -
Had bad service experience before
0 0 - - -
Was advised not to go 0 0 - - -
Will go later 1 1,394 1.2 0.2 8.1
Health problem will resolve by itself
3 8,078 7.0 2.3 19.4
Might lose earning 0 0 - - -
Cannot accept reality 0 0 - - -
Operating hours of facility not suitable
1 1,786 1.5 0.2 9.3
Place is far 2 3,357 2.9 0.5 14.4
Treatment is not required 22 22,374 19.3 11.0 31.6
No one to accompany 0 0 - - -
It is not an emergency 7 7,406 6.4 2.8 13.6


TOPIC 12


NATIONAL HEALTH AND MORBIDITY SURVEY 2015 MINISTRY OF HEALTH MALAYSIA
248
Non-Communicable Diseases, Risk Factors & Other Health Problems Volume II
12 LEPROSY
Contributors to this section: Tee Guat Hiong, Noran Naqiah Hairi, Muhammad Ismail, Asmah
Razali, Joanita Sulaiman, Mohd Hatta Abdul Mutalip, Norazizah Ibrahim Wong, Sobashini a/p
Kanniah, Jiloris F. Dony, Mohamed Naim Abdul Kadir
12.1 Background
Hansen's disease/leprosy is a chronic communicable disease caused by Mycobacterium Leprae.
It usually attacks skin, mucosal membrane and peripheral nerve of infected person that can lead to
skin disfigurement and deformity of hands, feet and eyes. The disease is commonly transmitted
via air droplets from untreated Hansen's disease/leprosy patients to those who are in close contact
during coughing, sneezing and etc.
Two main strategies for a successful Leprosy Control Program are;
i. To find all untreated cases of Hansen's disease/leprosy
ii. To start treatment with Multiple Drug Treatment (MDT) Regime provided freely by WHO as
soon as possible and in complete doses. Undetected or delayed in treating cases of
Hansen's disease/leprosy might cause permanent deformity to the patients and
transmission of the disease to others.
Community‟s awareness and knowledge on Hansen's disease/leprosy is essential in order to
assist in detecting and treating patients suspected to be infected with Hansen's disease/leprosy.
Early treatment will lead to complete cure from the disease without any deformity and disability.
Knowledge and perception in the community that Hansen's disease/leprosy can be cured with the
current treatment using MDT Regime is crucial in ensuring that patients will start and complete the
course of Hansen's disease/leprosy treatment.
12.2 Objectives
12.2.1 General Objective
To assess the community's awareness and knowledge towards Hansen's disease/leprosy in
Malaysia
12.2.2 Specific Objectives
i. To describe the community's awareness towards Hansen's disease/leprosy
ii. To describe the community's knowledge on Hansen's disease/leprosy
12.3 Target Population
The Hansen's disease / leprosy data were obtained from respondents aged 18 years and above
by trained research assistants using pre-coded questionnaires.
NATIONAL HEALTH AND MORBIDITY SURVEY 2015 MINISTRY OF HEALTH MALAYSIA
249
Non-Communicable Diseases, Risk Factors & Other Health Problems Volume II
12.3.1 Definitions of variables / Terms
a. Symptoms of Hansen's disease/leprosy were defined as skin lesions (hypo-pigmented /
hyper-pigmented skin patches) which normally associated with reduce/loss of sensation, not
sweating and no pain.
b. Cured from Hansen's disease/leprosy was defined as leprosy patients who had recovered
from the disease and would not transmit the disease to others.
c. Deformity from Hansen's disease/leprosy was defined as any disability of eyes/hands/feet
with or without facial disfigurement due to the disease.
12.4 Findings
A total of 48.8% (95%CI: 46.8, 50.6) of the respondents had ever heard about Hansen's
disease/leprosy. By locality, more urban dwellers (49.6%; 95% CI: 47.2, 51.8) had ever heard
about Hansen's disease/leprosy. A significantly higher proportion of females (51.9%; 95% CI: 49.8,
53.9) compared to males (45.8%; 95% CI: 43.7, 47.9) had ever heard of the disease. In terms of
age group, the highest proportion of ever heard about Hansen's disease/ leprosy was among the
41 - 50 years old (57.3%; 95% CI: 54.4, 60.1). Comparison by ethnic group showed that Malays
had the highest proportion of ever heard of the disease (63.1%; 95% CI: 61.3, 64.9), followed by
the Other Bumiputras (53.9%; 95% CI: 48.7, 58.9) Indians (37.5%; 95% CI: 32.9, 42.1) and
Chinese (27.1%; 95% CI: 24.0, 30.40). The awareness of Hansen's disease/leprosy increased
significantly as the education level increased, highest among those with tertiary education (64.8%;
95% CI: 62.1, 67.4) and lowest among those with no formal education (19.1%; 95% CI: 16.0,
22.6). With regards to income group, those in the 5th quintile (highest) (53.5%; 95% CI: 50.2, 56.6)
had the highest level of awareness as compared to those in the lowest 1st quintile (40.5%; 95% CI:
37.3, 43.7).
Overall, 62.9% (95% CI: 61.4, 64.3) of the respondents who had ever heard about Hansen's
disease/leprosy believed that the disease still exists in Malaysia and was significantly higher
among females (64.8%; 95% CI: 63.1, 66.6) than males (60.8%; 95% CI: 58.7, 62.8). There was a
decreasing trend from the youngest (18 - 30 years) (68.7%; 95% CI: 66.1, 71.3) to the oldest age
groups (> 60 years) (52.5%; 95%CI 48.4, 56.6) with regards to their belief on the existence of
Hansen's disease/leprosy in Malaysia.
A total of 58.5% (95 % CI: 56.5, 60.5) of the respondents who had ever heard about Hansen's
disease/leprosy thought that the probable symptoms of Hansen's disease/leprosy were skin
lesions associated with reduce/loss of sensation, not sweating and no pain. About 70% (67.7% 95
% CI: 66.2, 69.1) of these respondents thought that a person who had Hansen's disease/leprosy
could be cured. On the whole, 81.9% (95% CI: 80.6, 83.0) of these respondents thought that a
person with untreated Hansen's disease/leprosy could infect other people and 86.7% (95% CI:
85.5, 87.8) thought that Hansen's disease/leprosy could cause deformity if left untreated.
NATIONAL HEALTH AND MORBIDITY SURVEY 2015 MINISTRY OF HEALTH MALAYSIA
250
Non-Communicable Diseases, Risk Factors & Other Health Problems Volume II
12.5 Conclusion
In summary, the awareness of Hansen's disease/leprosy among Malaysians was fairly good with
nearly 50% of the respondents ever heard about the disease and 63% of those who had ever
heard about the disease believed that Hansen's disease/leprosy still exists in Malaysia. Females
were significantly more aware as compared to males in terms of ever heard of Hansen's
disease/leprosy and believed that Hansen's disease/leprosy still exist in Malaysia. Among these
respondents, the basic knowledge on symptoms of Hansen's disease/leprosy, treatment outcome,
infectivity and disease sequalae without treatment were considerably good with scores of 58.5%,
67.0%, 81.9% and 86.7% respectively.
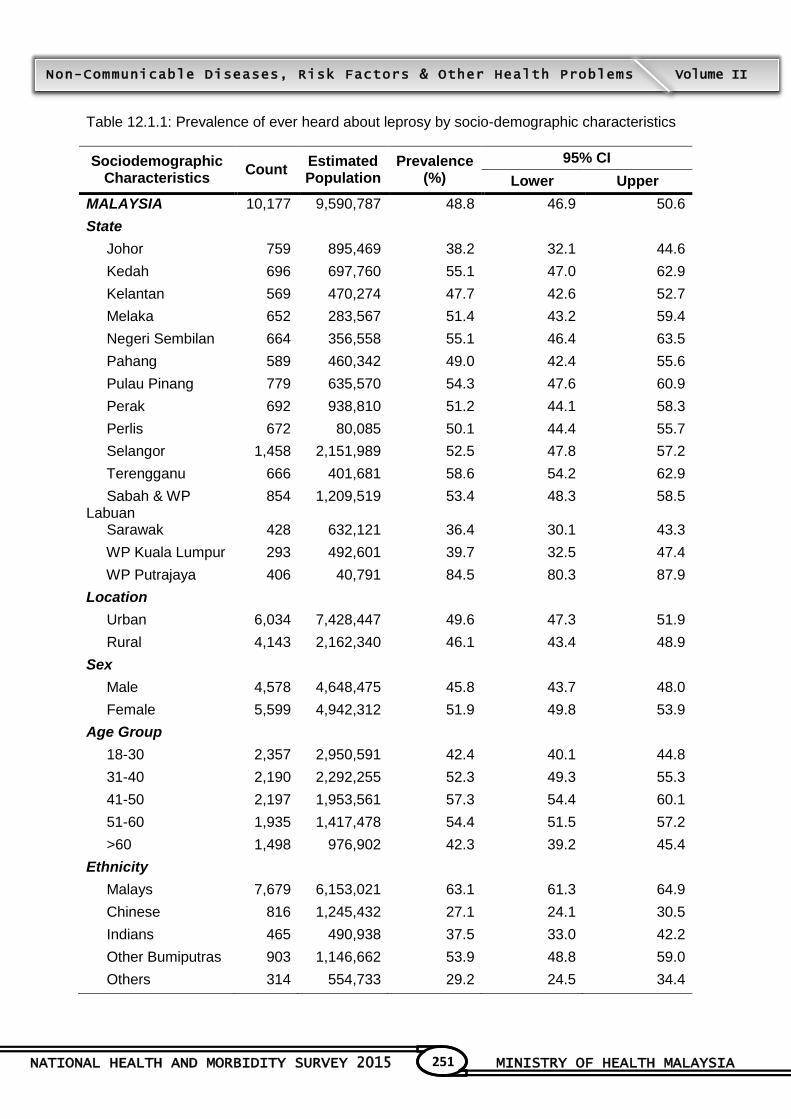
NATIONAL HEALTH AND MORBIDITY SURVEY 2015 MINISTRY OF HEALTH MALAYSIA
251
Non-Communicable Diseases, Risk Factors & Other Health Problems Volume II
Table 12.1.1: Prevalence of ever heard about leprosy by socio-demographic characteristics
Sociodemographic Characteristics
Count Estimated Population
Prevalence (%)
95% CI
Lower Upper
MALAYSIA 10,177 9,590,787 48.8 46.9 50.6
State
Johor 759 895,469 38.2 32.1 44.6
Kedah 696 697,760 55.1 47.0 62.9
Kelantan 569 470,274 47.7 42.6 52.7
Melaka 652 283,567 51.4 43.2 59.4
Negeri Sembilan 664 356,558 55.1 46.4 63.5
Pahang 589 460,342 49.0 42.4 55.6
Pulau Pinang 779 635,570 54.3 47.6 60.9
Perak 692 938,810 51.2 44.1 58.3
Perlis 672 80,085 50.1 44.4 55.7
Selangor 1,458 2,151,989 52.5 47.8 57.2
Terengganu 666 401,681 58.6 54.2 62.9
Sabah & WP Labuan
854 1,209,519 53.4 48.3 58.5
Sarawak 428 632,121 36.4 30.1 43.3
WP Kuala Lumpur 293 492,601 39.7 32.5 47.4
WP Putrajaya 406 40,791 84.5 80.3 87.9
Location
Urban 6,034 7,428,447 49.6 47.3 51.9
Rural 4,143 2,162,340 46.1 43.4 48.9
Sex
Male 4,578 4,648,475 45.8 43.7 48.0
Female 5,599 4,942,312 51.9 49.8 53.9
Age Group
18-30 2,357 2,950,591 42.4 40.1 44.8
31-40 2,190 2,292,255 52.3 49.3 55.3
41-50 2,197 1,953,561 57.3 54.4 60.1
51-60 1,935 1,417,478 54.4 51.5 57.2
>60 1,498 976,902 42.3 39.2 45.4
Ethnicity
Malays 7,679 6,153,021 63.1 61.3 64.9
Chinese 816 1,245,432 27.1 24.1 30.5
Indians 465 490,938 37.5 33.0 42.2
Other Bumiputras 903 1,146,662 53.9 48.8 59.0
Others 314 554,733 29.2 24.5 34.4

NATIONAL HEALTH AND MORBIDITY SURVEY 2015 MINISTRY OF HEALTH MALAYSIA
252
Non-Communicable Diseases, Risk Factors & Other Health Problems Volume II
Sociodemographic Characteristics
Count Estimated Population
Prevalence (%)
95% CI
Lower Upper
Marital Status
Single 1,729 2,223,309 40.4 37.8 43.0
Married 7,656 6,822,464 53.3 51.2 55.3
Widow/widower/ divorcee
792 545,014 40.3 36.9 43.7
Education Level
No formal education 274 211,181 19.1 16.0 22.6
Primary education 1,894 1,434,802 36.4 33.7 39.1
Secondary education 4,835 4,470,963 49.1 47.0 51.3
Tertiary education 3,107 3,387,186 64.8 62.1 67.4
Unclassified education 62 80,264 30.1 22.0 39.7
Occupation
Government/semi government employee
1,782 1,542,024 80.3 77.7 82.7
Private employee 2,851 3,428,749 44.1 41.6 46.6
Self employed 1,839 1,539,613 46.4 43.8 49.1
Unpaid worker/home maker
1,784 1,433,632 51.2 48.2 54.1
Retiree 528 397,886 66.2 61.2 70.9
Income Group
Less than RM 1000 1,335 1,069,387 40.6 37.6 43.7
RM 1000 - RM 1999 1,724 1,440,475 44.7 41.9 47.5
RM 2000 - RM 2999 1,686 1,504,319 47.0 43.9 50.2
RM 3000 - RM 3999 1,350 1,344,904 53.1 49.6 56.5
RM 4000 - RM 4999 965 1,002,872 51.8 47.2 56.4
RM 5000 - RM 5999 787 751,258 48.4 43.2 53.7
RM 6000 - RM 6999 531 536,879 52.3 46.4 58.2
RM 7000 - RM 7999 453 414,584 52.1 46.1 58.1
RM 8000 - RM 8999 346 370,008 54.7 47.2 62.0
RM 9000 - RM 9999 203 215,048 62.4 53.2 70.8
RM 10000 & above 797 941,052 53.8 47.2 60.3
Quintile Income Group
Quintile 1 1,138 911,741 40.5 37.3 43.7
Quintile 2 1,734 1,460,027 43.8 41.1 46.6
Quintile 3 2,151 1,924,241 47.3 44.4 50.1
Quintile 4 2,226 2,247,834 52.1 49.0 55.2
Quintile 5 2,928 3,046,943 53.5 50.2 56.6
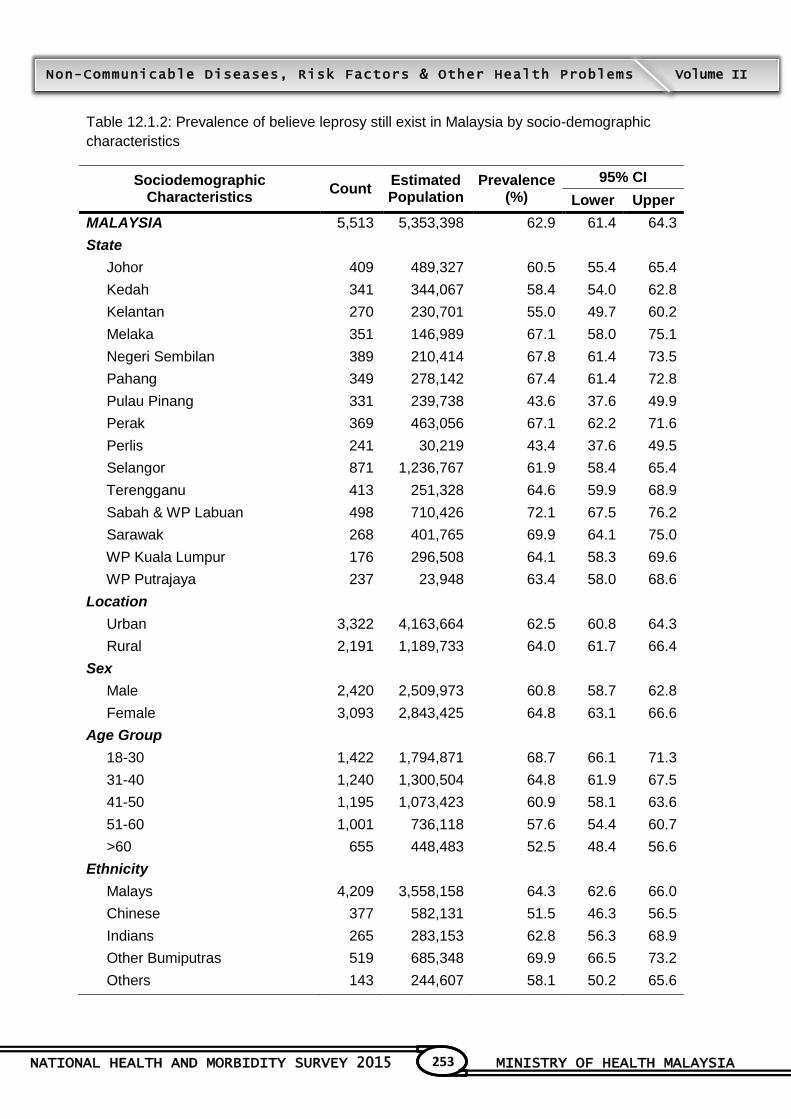
NATIONAL HEALTH AND MORBIDITY SURVEY 2015 MINISTRY OF HEALTH MALAYSIA
253
Non-Communicable Diseases, Risk Factors & Other Health Problems Volume II
Table 12.1.2: Prevalence of believe leprosy still exist in Malaysia by socio-demographic
characteristics
Sociodemographic Characteristics
Count Estimated Population
Prevalence (%)
95% CI
Lower Upper
MALAYSIA 5,513 5,353,398 62.9 61.4 64.3
State
Johor 409 489,327 60.5 55.4 65.4
Kedah 341 344,067 58.4 54.0 62.8
Kelantan 270 230,701 55.0 49.7 60.2
Melaka 351 146,989 67.1 58.0 75.1
Negeri Sembilan 389 210,414 67.8 61.4 73.5
Pahang 349 278,142 67.4 61.4 72.8
Pulau Pinang 331 239,738 43.6 37.6 49.9
Perak 369 463,056 67.1 62.2 71.6
Perlis 241 30,219 43.4 37.6 49.5
Selangor 871 1,236,767 61.9 58.4 65.4
Terengganu 413 251,328 64.6 59.9 68.9
Sabah & WP Labuan 498 710,426 72.1 67.5 76.2
Sarawak 268 401,765 69.9 64.1 75.0
WP Kuala Lumpur 176 296,508 64.1 58.3 69.6
WP Putrajaya 237 23,948 63.4 58.0 68.6
Location
Urban 3,322 4,163,664 62.5 60.8 64.3
Rural 2,191 1,189,733 64.0 61.7 66.4
Sex
Male 2,420 2,509,973 60.8 58.7 62.8
Female 3,093 2,843,425 64.8 63.1 66.6
Age Group
18-30 1,422 1,794,871 68.7 66.1 71.3
31-40 1,240 1,300,504 64.8 61.9 67.5
41-50 1,195 1,073,423 60.9 58.1 63.6
51-60 1,001 736,118 57.6 54.4 60.7
>60 655 448,483 52.5 48.4 56.6
Ethnicity
Malays 4,209 3,558,158 64.3 62.6 66.0
Chinese 377 582,131 51.5 46.3 56.5
Indians 265 283,153 62.8 56.3 68.9
Other Bumiputras 519 685,348 69.9 66.5 73.2
Others 143 244,607 58.1 50.2 65.6
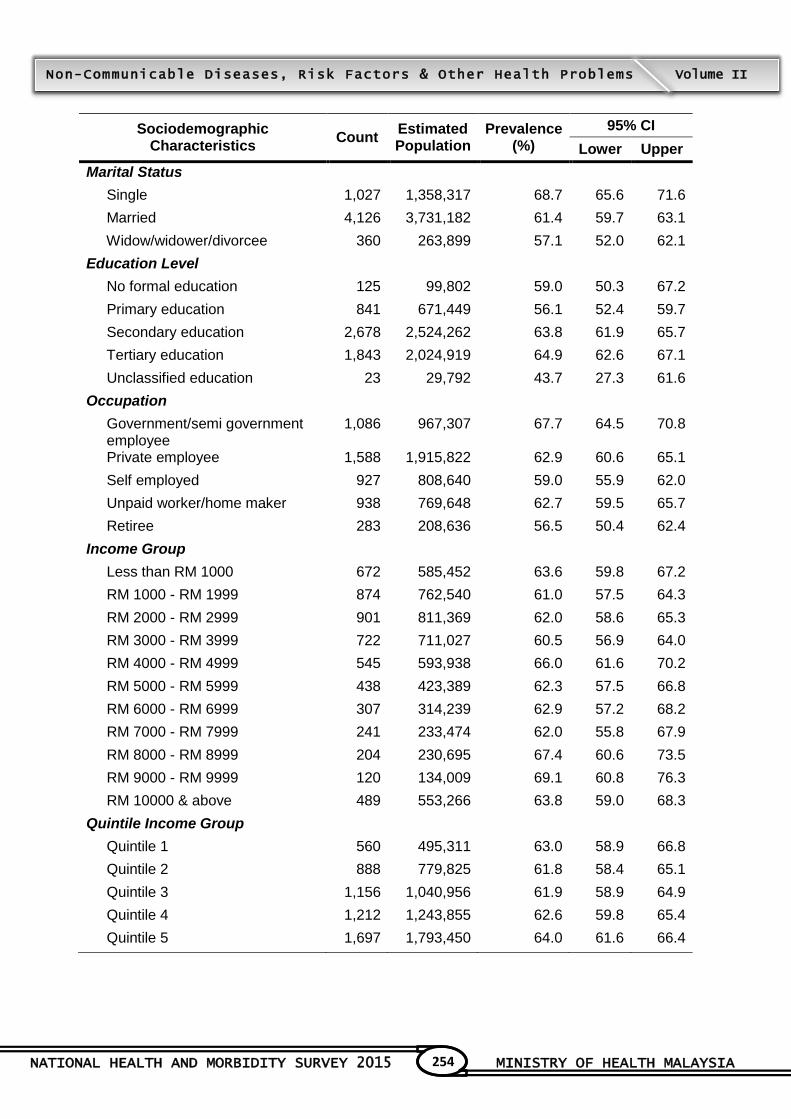
NATIONAL HEALTH AND MORBIDITY SURVEY 2015 MINISTRY OF HEALTH MALAYSIA
254
Non-Communicable Diseases, Risk Factors & Other Health Problems Volume II
Sociodemographic Characteristics
Count Estimated Population
Prevalence (%)
95% CI
Lower Upper
Marital Status
Single 1,027 1,358,317 68.7 65.6 71.6
Married 4,126 3,731,182 61.4 59.7 63.1
Widow/widower/divorcee 360 263,899 57.1 52.0 62.1
Education Level
No formal education 125 99,802 59.0 50.3 67.2
Primary education 841 671,449 56.1 52.4 59.7
Secondary education 2,678 2,524,262 63.8 61.9 65.7
Tertiary education 1,843 2,024,919 64.9 62.6 67.1
Unclassified education 23 29,792 43.7 27.3 61.6
Occupation
Government/semi government employee
1,086 967,307 67.7 64.5 70.8
Private employee 1,588 1,915,822 62.9 60.6 65.1
Self employed 927 808,640 59.0 55.9 62.0
Unpaid worker/home maker 938 769,648 62.7 59.5 65.7
Retiree 283 208,636 56.5 50.4 62.4
Income Group
Less than RM 1000 672 585,452 63.6 59.8 67.2
RM 1000 - RM 1999 874 762,540 61.0 57.5 64.3
RM 2000 - RM 2999 901 811,369 62.0 58.6 65.3
RM 3000 - RM 3999 722 711,027 60.5 56.9 64.0
RM 4000 - RM 4999 545 593,938 66.0 61.6 70.2
RM 5000 - RM 5999 438 423,389 62.3 57.5 66.8
RM 6000 - RM 6999 307 314,239 62.9 57.2 68.2
RM 7000 - RM 7999 241 233,474 62.0 55.8 67.9
RM 8000 - RM 8999 204 230,695 67.4 60.6 73.5
RM 9000 - RM 9999 120 134,009 69.1 60.8 76.3
RM 10000 & above 489 553,266 63.8 59.0 68.3
Quintile Income Group
Quintile 1 560 495,311 63.0 58.9 66.8
Quintile 2 888 779,825 61.8 58.4 65.1
Quintile 3 1,156 1,040,956 61.9 58.9 64.9
Quintile 4 1,212 1,243,855 62.6 59.8 65.4
Quintile 5 1,697 1,793,450 64.0 61.6 66.4
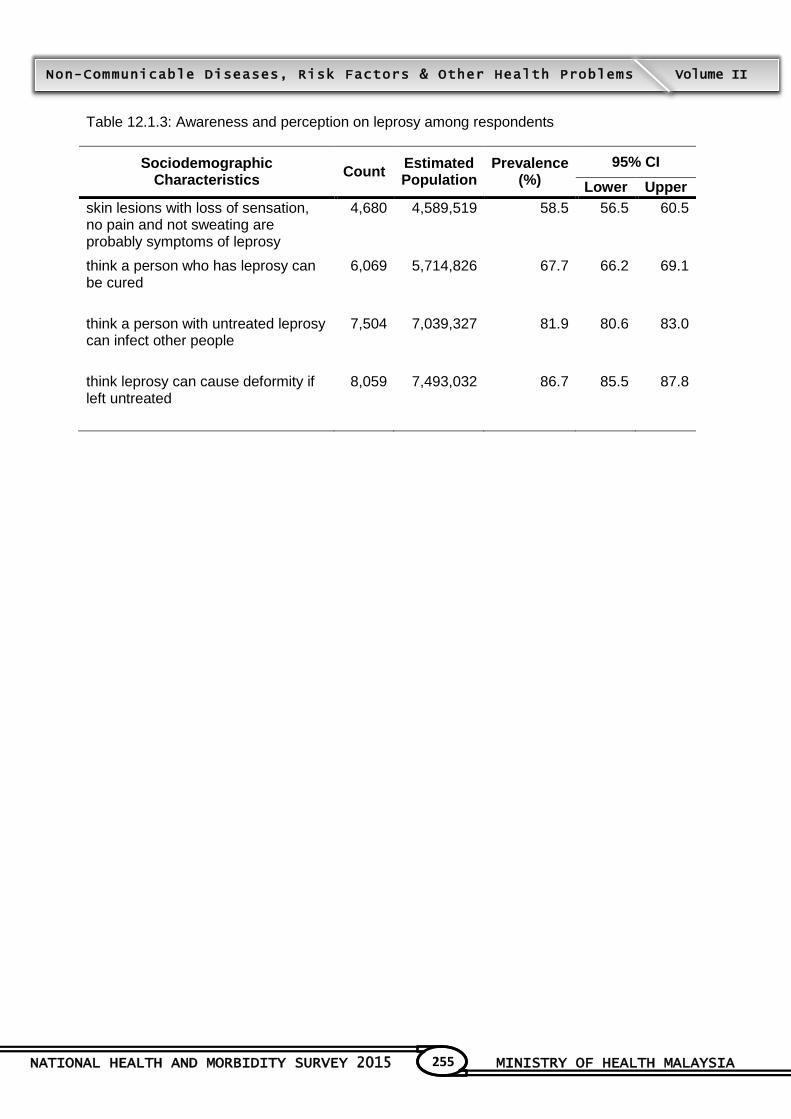
NATIONAL HEALTH AND MORBIDITY SURVEY 2015 MINISTRY OF HEALTH MALAYSIA
255
Non-Communicable Diseases, Risk Factors & Other Health Problems Volume II
Table 12.1.3: Awareness and perception on leprosy among respondents
Sociodemographic Characteristics
Count Estimated Population
Prevalence (%)
95% CI
Lower Upper
skin lesions with loss of sensation, no pain and not sweating are probably symptoms of leprosy
4,680 4,589,519 58.5 56.5 60.5
think a person who has leprosy can be cured
6,069 5,714,826 67.7 66.2 69.1
think a person with untreated leprosy can infect other people
7,504 7,039,327 81.9 80.6 83.0
think leprosy can cause deformity if left untreated
8,059 7,493,032 86.7 85.5 87.8

TOPIC 13

NATIONAL HEALTH AND MORBIDITY SURVEY 2015 MINISTRY OF HEALTH MALAYSIA
248
Non-Communicable Diseases, Risk Factors & Other Health Problems Volume II
13 DISABILITY
Contributors to this section: Noraida Mohamad Kasim, Salimah Othman, Khir Abdullah, Yusniza
Mohd Yusof, Norhayati Hussein, Mohd Yussof Sabtu, Jemsee Onggi, Nur Azna Mahmud, Zaidi
Yaacob, Siti Suriani Che Hussin, Norazizah Ibrahim Wong, Noor Ani Ahmad.
13.1 Background
Ministry of Health Malaysia (MOH), acknowledges disability as a major health issue and has incorporated Plan of Action (POA) for Person with Disabilities (PWDs) 2011-2020 to be in line with PWD Act 2008 and the Convention on the Right of Person with Disability (CRPD) 2007. The National Health Morbidity Survey (NHMS) 2015 focussed on the prevalence of disability and the impact of disability level on age, education and employment. Findings from NHMS 2015 will assist policy making in planning of health programme and resource allocation.
13.2 Objectives
13.2.1 General Objective
To determine the magnitude of disability and its impact on Malaysian adult population.
13.2.2 Specific objectives
13.2.2.1 To determine the prevalence of difficulty in :-
a) Seeing
b) Hearing
c) Walking or climbing (going up and down) stairs
d) Remembering or paying attention/concentrating
e) Caring for themselves
f) Communicating
13.2.2.2 To define the magnitude of level of difficulties in the siz domains.
13.2.2.3 To describe the types of disability by socio-demographic characteristics
13.3 Target Population, Study Instrument And Definitions
Data on disability was obtained from adult respondent 18 years and above through interviews by tr
ained research assistants using Washington Group Questionnaire (short version).
Level of difficulties were categorised into 4 categories which were „no difficulty‟, „moderately
difficult‟, „very difficult‟ and „unable‟. Based on WHO/UNESCAP classification used in the WG
questions pre-test report, responses were categorised as below; responses of „moderately difficult‟
was categorised into „mild difficulty‟, responses of „very difficult‟ was categorised into „severe
difficulty‟, while responses of „unable‟ was categorised into „complete difficulty‟.
13.3.1 Definition of terms/variables
Disability is an umbrella term encompassing impairment, activity limitation or
participation restriction.

NATIONAL HEALTH AND MORBIDITY SURVEY 2015 MINISTRY OF HEALTH MALAYSIA
249
Non-Communicable Diseases, Risk Factors & Other Health Problems Volume II
13.3.2 Difficulty in Seeing
Any condition that a person who has vision difficulties or problems of any kind even
when wearing glasses (if he/she wears glasses) or contact lenses.
13.3.3 Difficulty in Hearing
Any condition that a person who has some hearing limitation or problems of any
kind with their hearing even when using a hearing aid (if he/she wears a hearing
aid).
13.3.4 Difficulty in Walking
Any condition that a person who has some limitation or problems of any kind getting
around on foot.
13.3.5 Difficulty in Remembering
Any condition that a person who has some problems with remembering and
concentrating that contributes to difficulty in doing his/her daily activities.
13.3.6 Difficulty in Self-care
Any condition that a person who has some problems with taking care of
himself/herself independently.
13.3.7 Difficulty in Communicating
Any condition that a person who has some problems with talking, listening or
understanding speech such that it contributes to difficulty in doing his/her daily
activities.
13.4 Finding
13.4.1 General Finding
The prevalence of overall impairment and disability was 26.9% (95% CI: 25.7, 28.1). Among all
types of disability, the prevalence of difficulty in seeing was highest at 16.8% (95% CI: 15.9, 17.8),
followed by difficulty in walking 11.3% (95% CI: 10.6, 12.0), difficulty in remembering 9.4% (95%
CI: 8.7, 10.1), difficulty in listening 5.5% (95% CI: 5.0, 6.0), difficulty in communicating 3.4% (95%
CI: 3.1, 3.8) and difficulty in self-care 2.5% (95% CI: 2.2, 2.8).
13.4.2 Difficulty in Seeing
13.4.2.1 Prevalence of Mild Difficult in Seeing
The overall prevalence of mild difficult in seeing among adults of 18 years and above in this
survey was 15.5% (95% CI: 14.7, 16.5). There was a large variation between states, with the
highest prevalence in Pahang at 21.25% (95% CI: 17.6, 25.5), followed by Kedah at 20.72%
(95% CI: 18.4, 23.2) and Sabah/WP Labuan at 20.38% (95% CI: 17.9, 23.2), while the lowest
was Pulau Pinang at 8.08% (95% CI: 5.9, 11.1). The prevalence was significantly higher in the
NATIONAL HEALTH AND MORBIDITY SURVEY 2015 MINISTRY OF HEALTH MALAYSIA
250
Non-Communicable Diseases, Risk Factors & Other Health Problems Volume II
rural areas at 17.80% (95% CI: 16.4, 19.3) compared to urban areas at 14.82% (95% CI: 13.8,
16.0).
The prevalence of mild difficulty in seeing showed an increasing trend with age, from 7.67%
(95% CI: 6.7, 8.8) in the 18-30 years age group, reaching a peak of 34.56% (95% CI: 32.2,
37.0) among the 60 years and above. The prevalence was significantly higher among females
at 17.47% (95% CI: 16.3, 18.8) compared to males at 13.71% (95% CI: 12.8, 14.7).
In terms of the main ethnic groups, the other Bumiputras had the highest prevalence at
20.52% (95% CI: 18.1, 23.2), followed by Chinese at 15.53% (95% CI: 13.6, 17.6), Malays at
15.52% (95% CI: 14.5, 16.6), Indians at 14.57% (95% CI: 12.1, 17.5) and others ethnic at
10.87% (95% CI: 8.5, 13.9)
The highest prevalence of mild difficulty in seeing was observed among
widow/widower/divorcee at 31.32% (95% CI: 28.6, 34.2), followed by married respondents at
17.18% (95% CI: 16.1, 18.3) and singles at 7.75% (95% CI: 6.7, 8.9). The prevalence of
moderately difficult in seeing decreased from no formal education (29.95%, 95% CI: 26.4,
33.7) to tertiary education (10.47%, 95% CI: 9.2, 12.0). The prevalence of moderately difficult
in seeing was higher among unpaid workers (18.34%, 95% CI: 16.6, 20.3) and those have with
household income > RM 1,000 (22.66%, 95% CI: 20.6, 24.8).
13.4.2.2 Prevalence of Severe Difficulty in Seeing
The prevalence of severe difficulty in seeing in Malaysia was 1.06% (95% CI: 0.9 – 1.3)
Overall, there is no difference in the prevalence by sex. The prevalence in rural area was
1.63% (95% CI: 1.3 – 2.1). There is an increasing trend in prevalence with age, from 0.32%
(95% CI: 0.2, 0.6) in the 18-30 years age group, reaching a peak of 4.26% (95% CI: 3.3, 5.5)
among the 60 years old and above.
13.4.2.3 Prevalence of Complete Difficulty in Seeing
The prevalence of complete difficulty in seeing in Malaysia was 0.2% (95% CI: 0.1 – 0.3)
Overall, there is no difference in the prevalence by sex. The prevalence in urban area was
0.21% (95% CI: 0.1, 0.3). There was a peak of 0.4% (95% CI: 0.2, 0.8) among the 60 years old
and above.
13.4.3 Difficulty in Hearing
13.4.3.1 Prevalence of Mild Difficulty in Hearing
The overall prevalence of mild difficulty in hearing among adults of 18 years and above was
4.87% (95% CI: 4.5 – 5.3), higher in the rural areas 6.16% (95% CI: 5.5 – 6.9) compared to the
urban areas 4.47% (95% CI: 4.0 – 5.0). Other Bumiputras had the highest prevalence of
hearing difficulty at 6.59% (95% CI: 5.4, 8.0), followed by Chinese at 4.99% (95% CI: 4.1, 6.0),
Indians at 4.93% (95% CI: 3.6, 6.7), Malays at 4.71% (95% CI: 4.2, 5.3) and others at 3.48%
NATIONAL HEALTH AND MORBIDITY SURVEY 2015 MINISTRY OF HEALTH MALAYSIA
251
Non-Communicable Diseases, Risk Factors & Other Health Problems Volume II
(95% CI: 2.4, 5.1). In terms of marital status, widow/widower/divorcee recorded the highest
prevalence at 16.05% (95% CI: 14.0, 18.3) followed by married person at 4.90% (95% CI: 4.4,
5.4) and single persons at 2.01% (95% CI: 1.5, 2.7). Respondents with no formal education
recorded the highest prevalence at 16.3% (95% CI: 13.8, 19.2) followed by primary education
at 9.98% (95% CI: 8.9, 11.2), secondary education 3.05% (95% CI: 2.6, 3.5) and tertiary
education at 1.57% (95% CI: 1.2, 2.0).
Respondents with the income of less than RM 1000 recorded the highest prevalence at 9.85%
(95% CI: 8.5, 11.4), followed by respondents with income of RM 1000 - 1999 at 5.87% (95%
CI: 5.0, 6.9) and income of RM 2000 - 2999 at 4.8% (95% CI: 4.0, 5.8). Respondents with
income of RM 3000- 3999, RM 4000-4999, RM 5000-5999, RM 8000-8999 and above RM
10,000 were comparable between 3.08% - 3.89%. Income group of RM 6000-6999, RM 7000-
7999 and RM 9000-9999 recorded the least prevalence between 2.05% - 2.92%.
13.4.3.2 Prevalence of Severe Difficulty in Hearing
The overall prevalence of severe difficulty in hearing was 0.43% (95% CI: 0.3, 0.6). Prevalence
was highest among rural residents at 0.74% (95% CI: 0.5, 1.0) compared to urban residents at
0.34% (95% CI: 0.2, 0.5). No significant difference between genders was observed in all level
of difficulties. Widow/widower/divorcee recorded the highest prevalence at 2.4% (95% CI: 1.7,
3.5) followed by married persons with 0.32% (95% CI: 0.2, 0.5). Respondents with no formal
education had the prevalence at 2.30% (95% CI: 1.5, 3.6) and primary education at 1.30%
(95% CI: 0.7, 1.6). The prevalence in lower income group of less than RM 1000 was 1.01%
(95% CI: 0.6, 1.6) and RM 1000 – 1999 was 0.65% (95% CI: 0.4, 1.1).
13.4.3.3 Prevalence of Complete Difficulty in Hearing
The overall prevalence of complete difficulty in hearing was 0.17% (95% CI: 0.1, 0.3).
13.4.4 Difficulty in walking
13.4.4.1 Prevalence of Mild Difficulty in Walking
The overall prevalence of mild difficulty in walking among adults of 18 years and above was
9.54% (95% CI: 8.9, 10.2). There was a large variation between states, with the highest
prevalence in Kedah at 13.76% (95%CI: 11.5, 16.5) followed by WP Putrajaya at 13.16% (95%
CI: 9.6, 17.8), Melaka at 12.84% (95% CI: 10.3,15.9), Sarawak at 12.64% (95% CI: 9.9, 16.0),
Sabah & WP Labuan at 12.47% (95% CI: 10.7, 14.5) and Johor at 10.52% (95% CI: 8.9,
12.3); while the lowest was in Kelantan at 5.14% (95% CI: 3.7, 7.2).
The prevalence was slightly higher in the rural areas at 11.37% (95% CI: 10.2, 12.7) compared
to urban at 8.96% (95% CI: 8.3, 9.7), and female respondents had the highest prevalence of
mild difficulty in walking at 11.53% (95% CI: 10.7, 12.4) compared to males at 7.67% (95% CI:
7.0, 8.4). In terms of ethnic group, other Bumiputras had the highest prevalence at 14.68%
(95% CI: 12.3, 17.4), followed by Indians at 11.10% (95% CI: 12.3, 17.4), Malays at 9.20%
(95% CI: 8.4, 10.0) and Chinese at 9.10% (95% CI: 8.0, 10.3). Widow/widower/divorcee had
the highest prevalence of mild difficulty in walking at 26.75% (95% CI: 24.1, 29.6) compared to
respondents who were married at 10.57% (95% CI: 9.8, 11.4) and respondents who were
single at 2.83% (95% CI: 2.3, 3.5).

NATIONAL HEALTH AND MORBIDITY SURVEY 2015 MINISTRY OF HEALTH MALAYSIA
252
Non-Communicable Diseases, Risk Factors & Other Health Problems Volume II
By education, respondents with no formal education showed the highest prevalence of mild
difficulty in walking at 24.59% (95% CI: 21.4, 28.1) followed by primary education 17.60%
(95% CI: 16.1, 19.2), secondary 7.34% (95% CI: 6.6, 8.1) and tertiary 3.83% (95% CI: 3.2,
4.6). The retirees had the highest prevalence of mild difficulty in walking at 17.63% (95% CI:
14.6, 21.1) followed by unpaid workers at 13.24% (95% CI: 11.8, 14.8), self-employed at
8.47% (95% CI: 7.4, 9.7), government/semi government employed at 6.93% (95% CI: 5.6, 8.6)
and private employed at 4.61% (95% CI: 4.0, 5.4).
Prevalence was highest among those with household income less than RM1000 16.91% (95%
CI: 15.1, 18.9), followed by RM1000-1999 at 11.23% (95% CI: 10.0, 12.6). By quintile income
group, the highest prevalence at 17.99% (95% CI: 16.0, 20.2) was found in Q1 while the
lowest prevalence was among Q5 group at 6.88% (95% CI: 6.0, 7.9).
13.4.4.2 Prevalence of Severe Difficulty in walking
The overall prevalence of severe difficulty in walking was 1.13% (95% CI: 1.0, 1.3). The
highest prevalence was in Sarawak at 2.01% (95% CI: 1.2, 3.2), followed by 1.89% (95% CI:
1.0, 3.7) in Malacca. Higher prevalence was noted in rural areas 1.58% (95% CI: 1.3, 1.9)
compared to the urban areas 0.99% (95% CI: 0.8, 1.3). Females had a higher prevalence of
severe difficulty in walking at 1.27% (95% CI: 1.0, 1.6) as compared to males at 1.00% (95%
CI: 0.8, 1.3).
With regards to the age group, highest prevalence was noted among respondents more than
60 years at 6.12% (95% CI: 5.1, 7.4) followed by 41-50 years at 1.24 (95% CI: 0.9, 1.7). Other
Bumiputras had reported to have severe difficulty in walking at 1.83% (95% CI: 1.2, 2.8)
followed by Chinese 1.32% (95% CI: 0.9, 1.9), Indians 1.11% (95% CI: 0.7, 1.8) and Malays
1.06% (95% CI: 0.9, 1.3).
The highest prevalence of very difficult in walking was found in those with no formal education
at 5.57% (95% CI: 4.1, 7.6), the lowest among those with secondary education at 0.48% (95%
CI: 0.3, 0.7). Widow/widower/divorcee had the highest prevalence of very difficult in walking at
5.14% (95% CI: 4.0, 6.5). By quintile income group, Q1 group showed the highest prevalence
at 3.14% (95% CI: 2.4, 4.2) while the lowest prevalence was among Q5 group 0.64% (95% CI:
0.4, 1.0).
13.4.4.3 Prevalence of Complete Difficulty in Walking
The overall prevalence of complete difficulty in walking was 0.64 (95% 0.5, 0.8). The prevalence was significantly higher in rural areas 0.95% (95% CI: 0.7, 1.2) as compared to urban areas 0.54% (95% CI: 0.4, 0.7). By gender, females [0.74% (95% CI: 0.6, 1.0)] showed higher prevalence as compared to males [0.54% (95% CI: 0.4, 0.7)]. Prevalence among
Malays was 0.78% (95% CI: 0.6, 1.0). By marital status, the prevalence among widow/widower/divorcee was 3.01% (95% CI: 2.2, 4.1).
In terms of education level, prevalence of no formal education was higher at 3.89% (95% CI:
2.8, 5.4), followed by primary education at 1.09% (95% CI: 0.8, 1.5) and secondary education
at 0.27% (95% CI: 0.2, 0.4). Respondents with income less than RM1000 showed prevalence
at 1.18% (95% CI: 0.8, 1.6), between RM1000-1999 group at 0.72% (95% CI: 0.5, 1.1) and RM

NATIONAL HEALTH AND MORBIDITY SURVEY 2015 MINISTRY OF HEALTH MALAYSIA
253
Non-Communicable Diseases, Risk Factors & Other Health Problems Volume II
2000-2999 at 0.58% (95% CI: 0.4, 0.9). Prevalence was highest in quintile income Q1 which
was 1.35% (95% CI: 1.0, 1.9) while the lowest prevalence was among Q3 group 0.49% (95%
CI: 0.3, 0.8).
13.4.5 Difficulty in Remembering
13.4.5.1 Prevalence of Mild Difficulty in Remembering
The overall prevalence of mild difficulty in remembering was 8.57% (95% CI: 7.9, 9.3). There
was a large variation between states, with the highest prevalence in Sabah & WP Labuan at
17.43% (95% CI: 14.6, 20.6), followed by Sarawak at 11.31% (95% CI: 8.4, 15.0) and WP
Kuala Lumpur at 10.77% (95% CI: 7.9, 14.6), while the lowest was in Penang at 3.79% (95%
CI: 2.7, 5.3).
The prevalence was higher in rural areas at 10.11% (95% CI: 8.9, 11.4) compared to urban
areas at 8.09% (95% CI: 7.3, 8.9). Females had higher prevalence in mild difficulty in
remembering at 9.25% (95% CI: 8.5, 10.1) compared to males at 7.94% (95% CI: 7.2, 8.8).
The highest prevalence was observed among those aged above 60 years at 24.65% (95% CI:
22.5, 26.9) and the lowest prevalence was aged between 31-40 years at 4.94% (95% CI: 4.2,
5.9).
By ethnic group, the prevalence of mild difficulty in remembering from highest to lowest was as
follows; other Bumiputras 15.43% (95% CI: 12.7, 18.6), Chinese 8.96% (95% CI: 7.7, 10.4),
others 8.56% (95% CI: 6.6, 11.1), Indians 7.70% (95% CI: 6.0, 9.8) and Malays 7.01% (95%
CI: 6.3, 7.8). Widow/widower/divorcee group had the highest prevalence at 20.93% (95% CI:
18.5, 23.6) followed by married at 8.27% (95% CI: 7.5, 9.1). Prevalence of mild difficulty in
remembering was highest among those with no formal education at 22.21% (95% CI: 19.2,
25.5).
Retirees showed the highest prevalence of mild difficulty in remembering at 12.95% (95% CI:
10.0, 16.6) followed by unpaid worker at 9.58% (95% CI: 8.2, 11.2), self-employed at 7.29%
(95% CI: 6.2, 8.6), private employed at 5.47% (95% CI: 4.7, 6.3) and government/semi
government employed at 5.17% (95% CI: 3.9, 6.8).
By income group, the highest prevalence of moderately difficult in remembering was among
those earning less than RM1000 at 14.40% (95% CI: 12.7, 16.3). By quintile income group, Q1
group showed the highest prevalence at 15.40% (95% CI: 13.5, 17.5) while the lowest
prevalence was among Q5 group at 6.30% (95% CI: 5.3, 7.4).
13.4.5.2 Prevalence of Severe Difficulty in Remembering
The overall prevalence of severe difficulty in remembering was 0.52% (95% CI: 0.4, 0.7). By
state, the highest prevalence was 1.12% (95% CI: 0.7, 1.8) in Sarawak. Higher prevalence
was noted in rural areas with 1.10% (95% CI: 0.9, 1.4) compared to the urban areas at 0.34%
(95% CI: 0.2, 0.5). Females had higher prevalence in severe difficulty in remembering at
0.60% (95% CI: 0.5, 0.8) as compared to males at 0.45% (95% CI: 0.3, 0.6).

NATIONAL HEALTH AND MORBIDITY SURVEY 2015 MINISTRY OF HEALTH MALAYSIA
254
Non-Communicable Diseases, Risk Factors & Other Health Problems Volume II
The highest prevalence of severe difficulty in remembering was noted among age group of
more than 60 years at 2.45% (95% CI: 1.8, 3.3), Other Bumiputras at 1.43% (95% CI: 1.0, 2.0),
those with no formal education at 2.82% (95% CI: 2.0, 3.9) widow/widower/divorcee at 2.45%
(95% CI: 1.7, 3.5) and those with income less than RM1000 at 1.03% (95% CI: 0.7, 1.5).
13.4.5.3 Prevalence of Complete Difficulty in Remembering
The overall prevalence of complete difficulty in remembering was 0.27% (95% CI: 0.2, 0.4),
with prevalence of 0.26% (95% CI: 0.2, 0.4) and 0.28% (95% CI: 0.2, 0.4) in rural and urban
areas respectively.
13.4.6 Difficulty in Self-care
13.4.6.1 Prevalence of Mild Difficulty in Self-care
The overall prevalence of mild difficulty in self-care among Malaysian adults of 18 years and
above was 1.8% (95% CI: 1.5, 2.0). By state, Perak had the highest prevalence of mild
difficulty in self-care at 2.7% (95% CI: 1.7, 4.2) followed by WP Kuala Lumpur at 2.6 % (95%
CI 1.6, 4.3) and Pahang at 2.0% (95% CI: 1.3, 3.1).
The prevalence was slightly higher in the rural areas with 2.0% (95% CI: 1.7, 2.5) compared to
urban areas at 1.7% (95% CI: 1.4, 2.0). No significant difference between genders was
observed where males showed 1.8% (95% CI: 1.5, 2.2) and females 1.7% (95% CI: 1.5, 2.1).
By ethnic group, there was minimal differences in prevalence recorded where Chinese had the
prevalence of 2.1% (95% CI: 1.6, 2.8), followed by Indians at 2.0% (95% CI: 1.3, 3.1), Malays
at 1.8% (95% CI: 1.5, 2.1), and other Bumiputras at 1.7% (95% CI: 1.2, 2.4).
Widow/widower/divorcee recorded the highest prevalence of 6.7% (95% CI: 5.4, 8.2) followed
by respondents who were married at 1.6% (95% CI: 1.3, 1.9) and singles at 1.0% (95% CI: 0.7,
1.4).
By education level, the prevalence was 6.6% (95% CI: 5.2, 8.4) for those respondents with no
formal education, followed by primary education at 4.0% (95% CI: 3.3, 4.8) and secondary
education at 0.9% (95% CI: 0.6, 1.1). The highest prevalence of mild difficulty in self-care was
among respondents in income group less than RM 1000 at 3.9% (95% CI: 3.2, 4.9) followed by
income group RM 1000-1999 at 2.7% (95% CI: 2.1, 3.4).
13.4.6.2 Prevalence of Severe Difficulty in Self-care
The overall prevalence of severe difficulty in self-care was 0.3% (95% CI: 0.2, 0.4). No
difference in the prevalence by locality and sex. The prevalence among
widow/widower/divorcee was at 1.3% (95% CI: 0.8, 2.1) and married respondents at 0.2%
(95% CI: 0.1, 0.3)
NATIONAL HEALTH AND MORBIDITY SURVEY 2015 MINISTRY OF HEALTH MALAYSIA
255
Non-Communicable Diseases, Risk Factors & Other Health Problems Volume II
13.4.6.3 Prevalence of Complete Difficulty in Self-care
The overall prevalence of complete difficulty in self-care was 0.4% (95% CI: 0.3, 0.5), slightly
higher in rural areas at 0.6% (95% CI: 0.4, 0.8) as compared to urban at 0.3% (95% CI: 0.2,
0.5). No difference in the prevalence by sex. By marital status, widow/widower/divorcee had
the highest prevalence at 1.6% (95% CI: 1.0, 2.5).
13.4.7 Difficulty in Communicating
13.4.7.1 Prevalence of Mild Difficulty in Communicating
The overall prevalence of mild difficulty in communicating among adults of 18 years and above
was 2.7% (95% CI: 2.3, 3.0). Kuala Lumpur recorded the highest prevalence at 4.1% (95% CI:
9.9, 13.3), followed by Terengganu at 3.7% (95% CI: 2.5, 5.5) and Perak at 3.4% (95% CI: 2.3,
5.0); while Penang being the lowest at 1.5% (95% CI: 1.0, 2.4). Rural areas showed higher
prevalence compared to urban at 3.2% (95% CI: 2.8, 3.8) and 2.6% (95% CI: 2.2, 2.9)
respectively. By gender, males had a higher prevalence at 2.8% (95% CI: 2.4, 3.2) as
compared to females at 2.6% (95% CI: 2.2, 3.1).
By age group, the highest prevalence of mild difficulty in communicating was those above 60
years at 10.4% (95% CI: 8.9, 12.1) and lowest in 31-40 years age groups at 1.3% (95% CI:
0.9, 1.7). The highest prevalence of mild difficulty in communicating was among Chinese at
2.7% (95% CI: 1.9, 3.9), widow/widower/divorcee at 8.7% (95% CI: 7.0, 10.6), those with no
formal education at 10.5% (95% CI: 8.6, 12.8), retirees at 4.4% (95% CI: 2.8, 6.9).
Respondents with household income less than RM1000 reported the highest prevalence at
5.6% (95% CI: 4.7, 6.6) while household income of RM4000- 4999 reported the lowest
prevalence at 1.7% (95% CI: 1.0, 2.9). For quintile income group, Q1 showed the highest
prevalence at 5.8-% (95% CI: 4.9, 6.9), followed by Q2 at 3.5% (95% CI: 2.8, 4.4) and the
lowest being Q5 at 1.8% (95% CI: 1.4, 2.3).
13.4.7.2 Prevalence of Severe Difficulty in Communicating
The overall prevalence of severe difficulty in communicating was 0.4% (95% CI: 0.3, 0.5).
Higher prevalence was reported in rural areas 0.6% (95% CI: 0.4, 0.8) compared to the urban
areas 0.3% (95% CI: 0.2, 0.5). No difference in the prevalence by sex.
Prevalence was highest among respondents aged above 60 years old at 1.3% (95% CI: 0.9,
1.9) and the lowest among age group of 31-40 years old at 0.2% (95% CI: 0.1, 0.5). By ethnic
group, Malays had the highest prevalence at 0.3% (95% CI: 0.2, 0.4). The
widow/widower/divorcee group had higher prevalence of mild difficulty in communicating
compared to single group at 1.4% (95% CI: 0.9, 2.1) and 0.6% (95% CI: 0.4, 0.9) respectively.
Prevalence was higher among no formal education with 2.2% (95% CI: 1.4, 3.6) and primary
education group showed prevalence at 0.7% (95% CI: 0.5, 1.1). Those of income less than
RM1000 showed prevalence at 0.6% (95% CI: 0.4, 0.9).
NATIONAL HEALTH AND MORBIDITY SURVEY 2015 MINISTRY OF HEALTH MALAYSIA
256
Non-Communicable Diseases, Risk Factors & Other Health Problems Volume II
13.4.7.3 Prevalence of Complete Difficulty to Communicate
The overall prevalence of complete difficulty to communicate was 0.3% (95% CI: 0.2, 0.5). The
highest prevalence of unable to communicate was found among urban residents at 0.4% (95%
CI: 0.2, 0.5), males at 0.4% (95% CI: 0.2, 0.6), malays at 0.3% (95% CI: 0.2, 0.5) and
respondents who were single at 0.7% (95% CI: 0.4, 1.0).
13.4.7.4 Prevalence of Disability
Based on criteria of „at least one of the six domains is scored „severe (lots of difficulty)‟ or
„complete (unable to do it at all)‟, the prevalence of disability in this study was 3.3% (95% CI:
3.0-3.7) with an estimated 672,529 population affected.
13.5 Conclusion
This survey has highlighted the extent of major disabilities currently existing in the community. The
most commonly functional disability type was difficulty in seeing followed by difficulty in walking,
remembering, listening, communicating and self-care. Those with lower education level, lower
income and elderly group were more likely to report a disability.
13.6 Recommendation
In view of the findings which were highlighted above, the recommendations below are suggested.
i. Prevention and rehabilitation programme must be designed to targeted group especially
those with lower education level, lower income and elderly group.
ii. Focus on public awareness on disability prevention through networking with others
government and non-government agencies.
iii. Ensure accessibility to quality rehabilitative care.
iv. Perform regular early identification and screening of disability.
v. Provision of early disability intervention including referral to appropriate services or
programme, rehabilitation and prescription of assistive devices.
vi. Healthcare provider should be adequately trained to detect risk factor and early sign of
disability and able to manage appropriatly.
vii. Provide appropriate environmental access to various group of disability such as transport,
traffic light alarm, accessible toilet, ramp in line with requirement of universal design.
viii. Strengthen promotional activities to create disability awareness which include World Sight
Day, Better Speech and Hearing Month, World Stroke Day and so on.
ix. Expand and strengthen the outreach services.
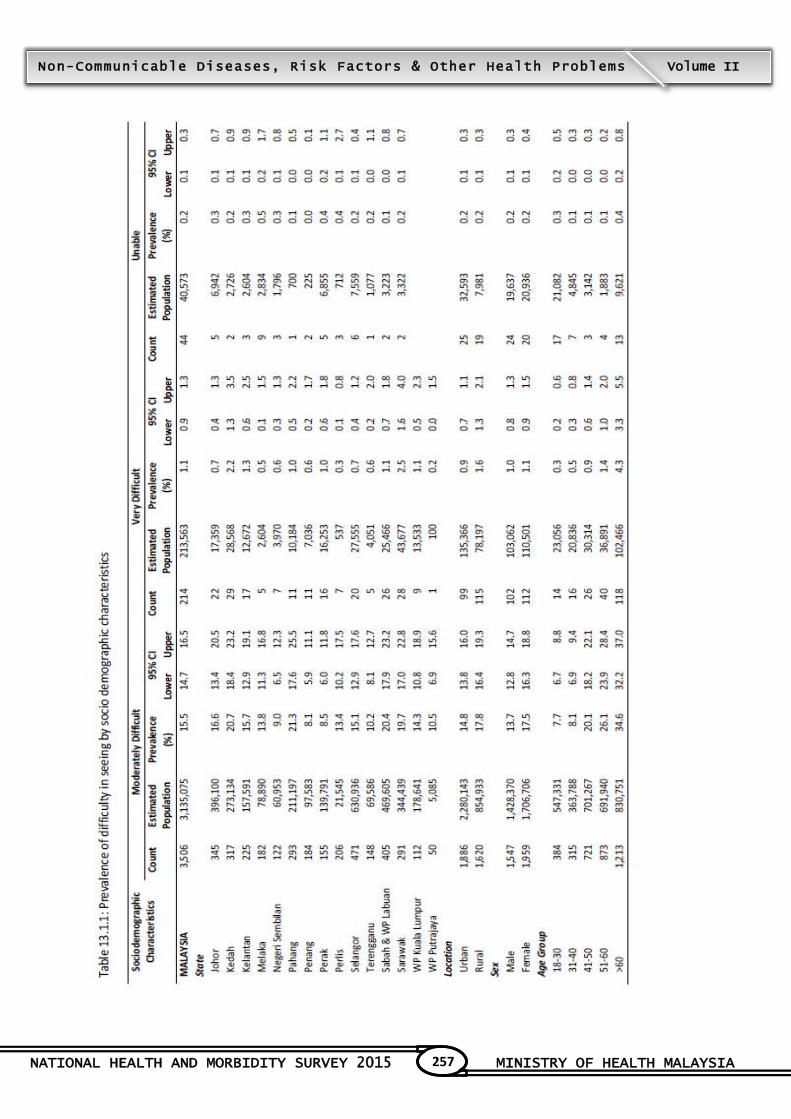
NATIONAL HEALTH AND MORBIDITY SURVEY 2015 MINISTRY OF HEALTH MALAYSIA
257
Non-Communicable Diseases, Risk Factors & Other Health Problems Volume II
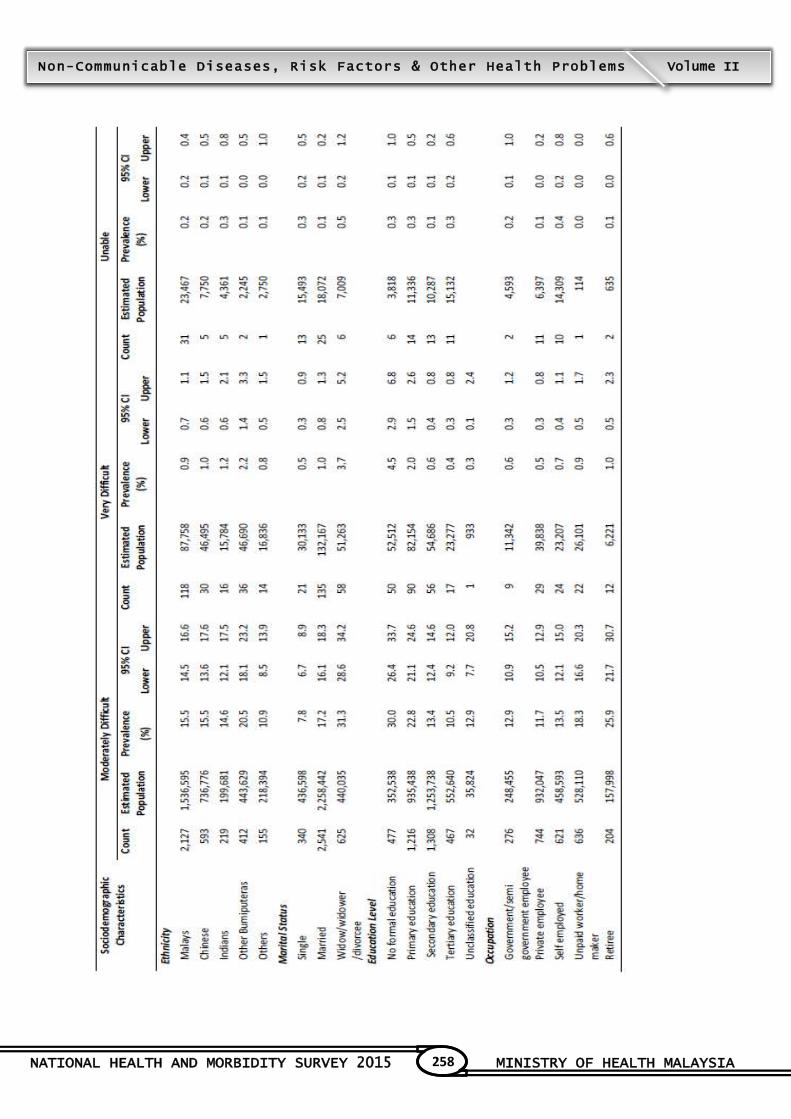
NATIONAL HEALTH AND MORBIDITY SURVEY 2015 MINISTRY OF HEALTH MALAYSIA
258
Non-Communicable Diseases, Risk Factors & Other Health Problems Volume II
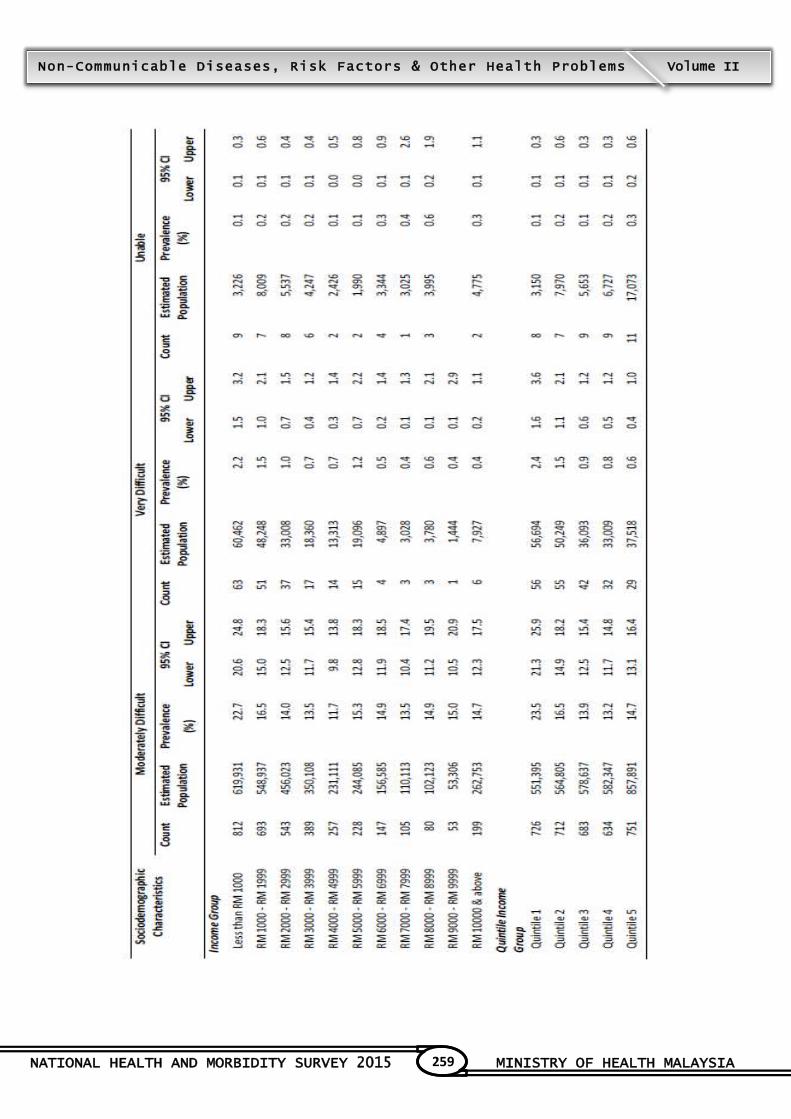
NATIONAL HEALTH AND MORBIDITY SURVEY 2015 MINISTRY OF HEALTH MALAYSIA
259
Non-Communicable Diseases, Risk Factors & Other Health Problems Volume II

NATIONAL HEALTH AND MORBIDITY SURVEY 2015 MINISTRY OF HEALTH MALAYSIA
260
Non-Communicable Diseases, Risk Factors & Other Health Problems Volume II
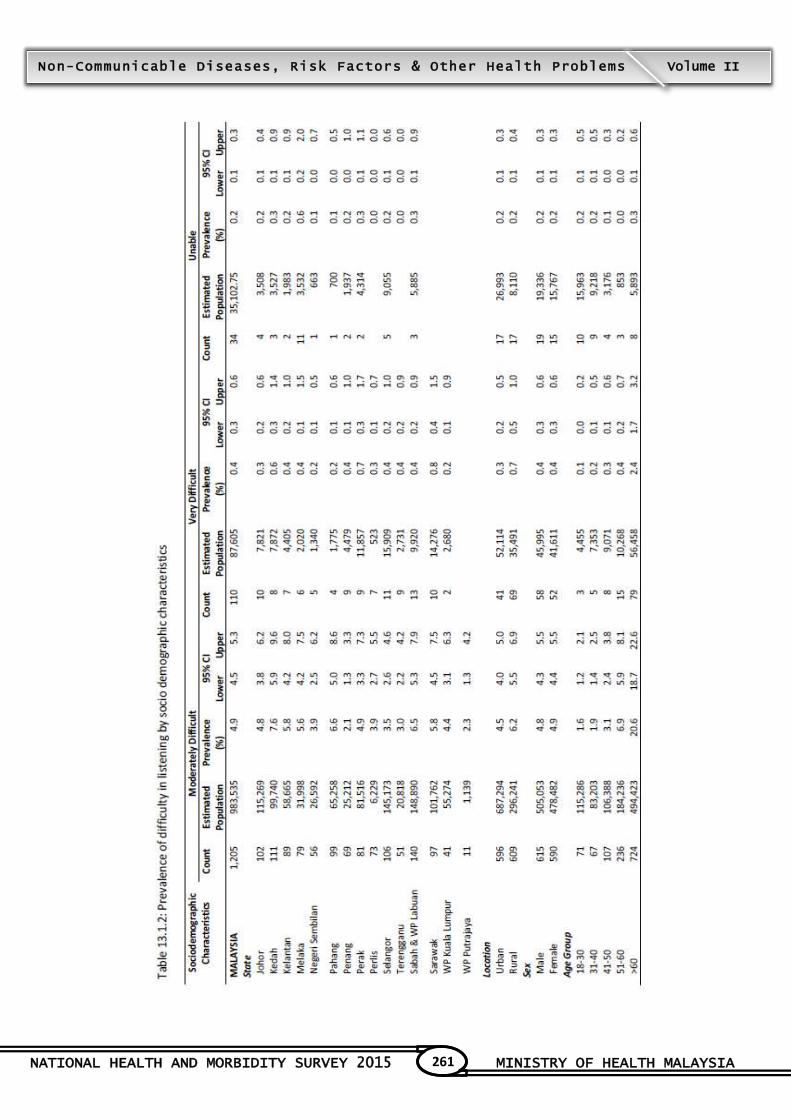
NATIONAL HEALTH AND MORBIDITY SURVEY 2015 MINISTRY OF HEALTH MALAYSIA
261
Non-Communicable Diseases, Risk Factors & Other Health Problems Volume II
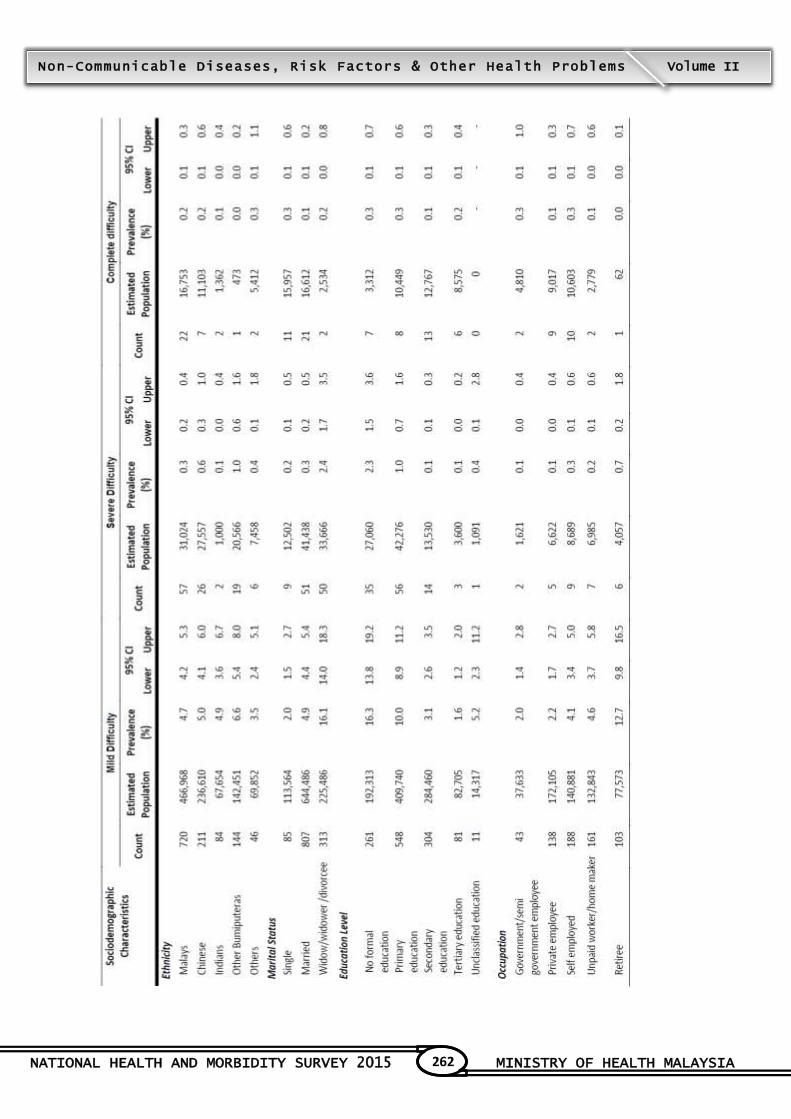
NATIONAL HEALTH AND MORBIDITY SURVEY 2015 MINISTRY OF HEALTH MALAYSIA
262
Non-Communicable Diseases, Risk Factors & Other Health Problems Volume II

NATIONAL HEALTH AND MORBIDITY SURVEY 2015 MINISTRY OF HEALTH MALAYSIA
263
Non-Communicable Diseases, Risk Factors & Other Health Problems Volume II
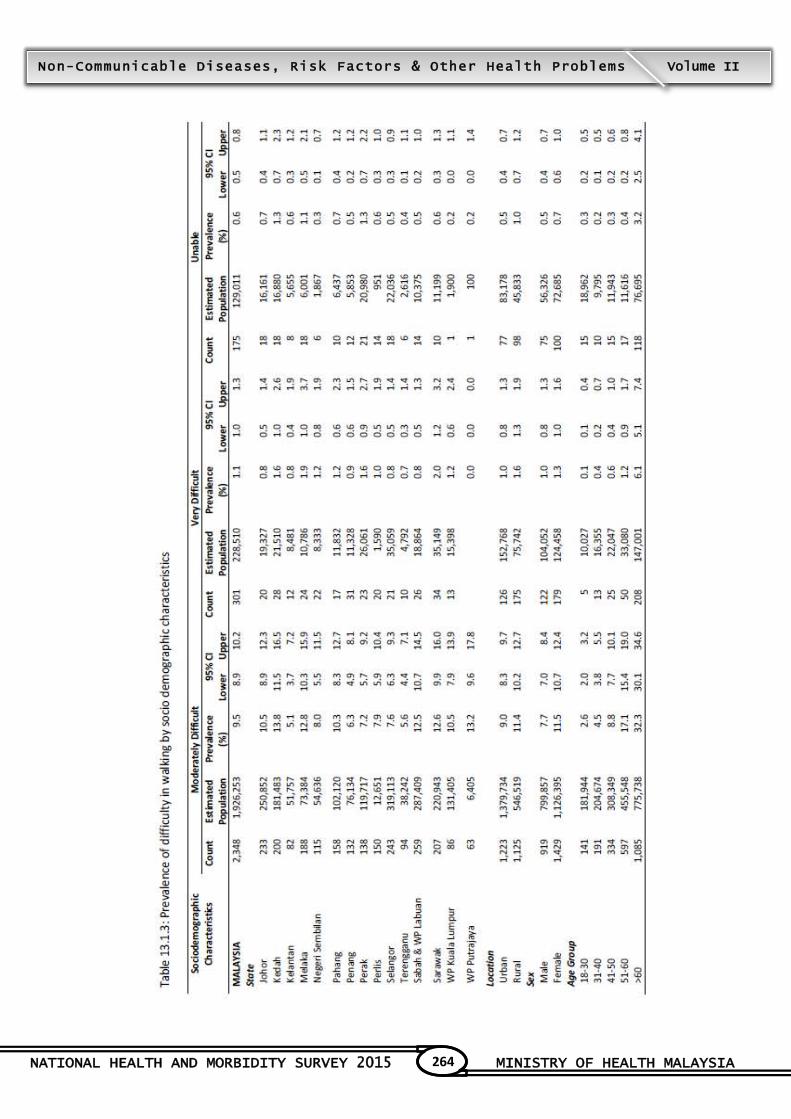
NATIONAL HEALTH AND MORBIDITY SURVEY 2015 MINISTRY OF HEALTH MALAYSIA
264
Non-Communicable Diseases, Risk Factors & Other Health Problems Volume II
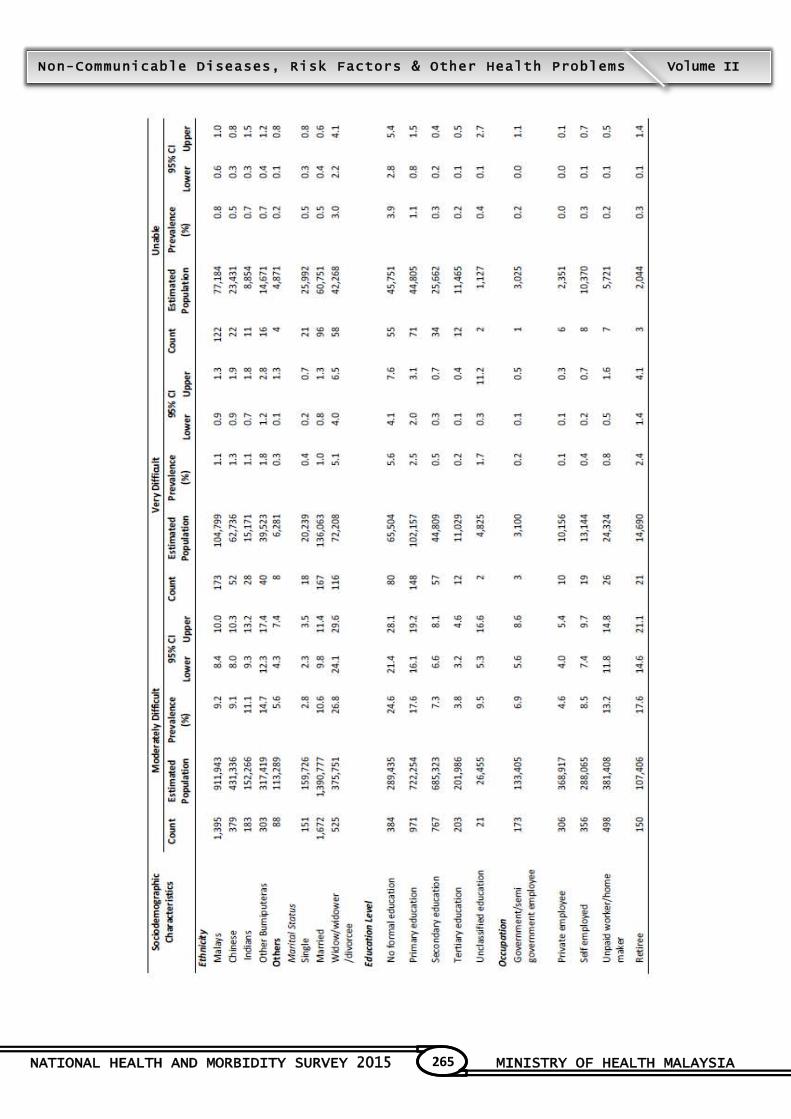
NATIONAL HEALTH AND MORBIDITY SURVEY 2015 MINISTRY OF HEALTH MALAYSIA
265
Non-Communicable Diseases, Risk Factors & Other Health Problems Volume II
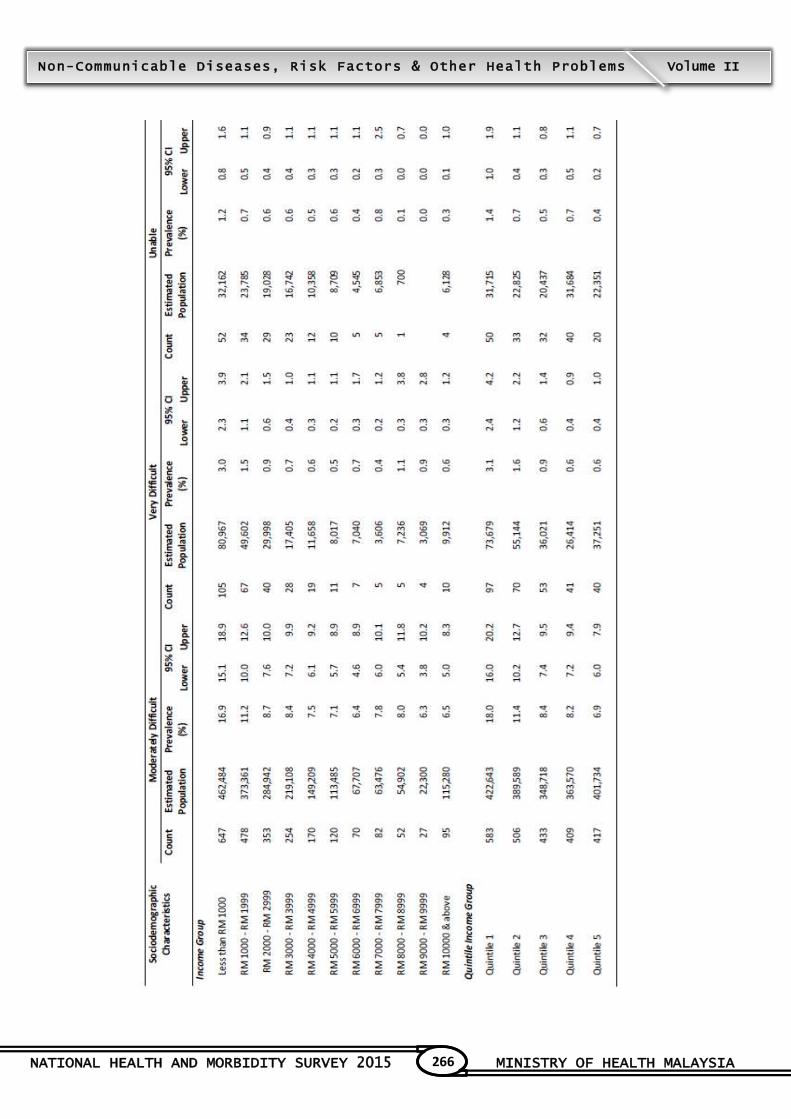
NATIONAL HEALTH AND MORBIDITY SURVEY 2015 MINISTRY OF HEALTH MALAYSIA
266
Non-Communicable Diseases, Risk Factors & Other Health Problems Volume II
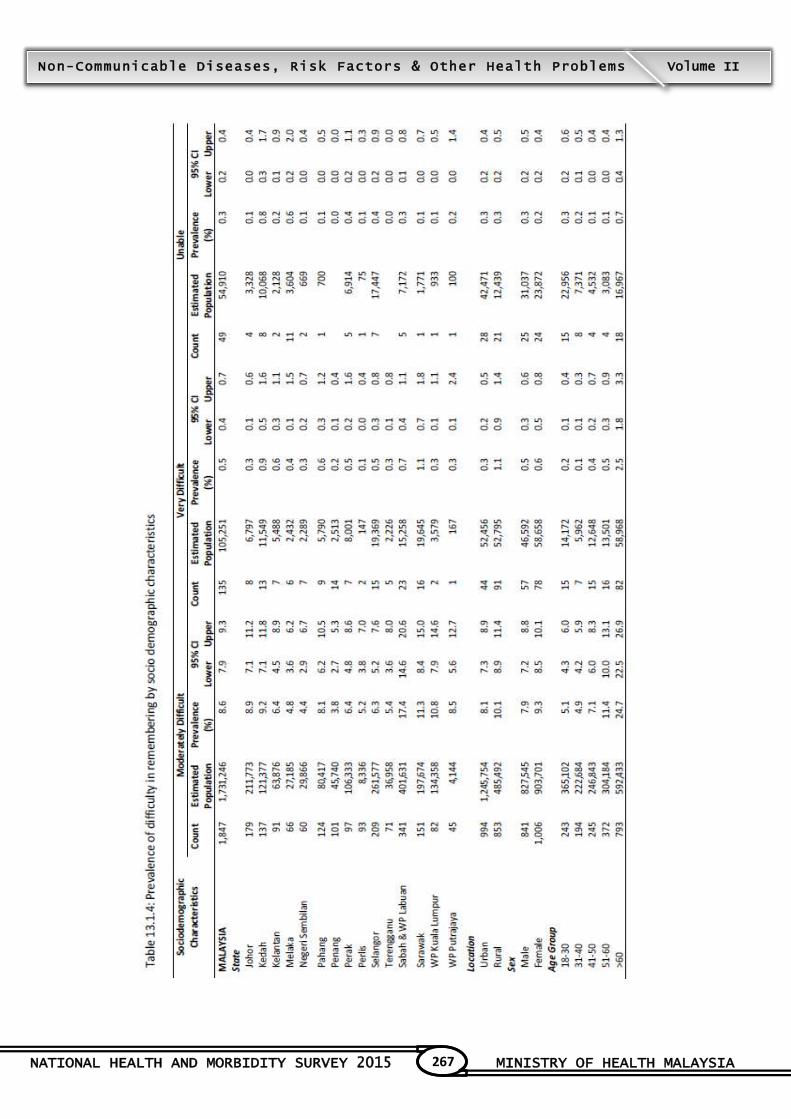
NATIONAL HEALTH AND MORBIDITY SURVEY 2015 MINISTRY OF HEALTH MALAYSIA
267
Non-Communicable Diseases, Risk Factors & Other Health Problems Volume II
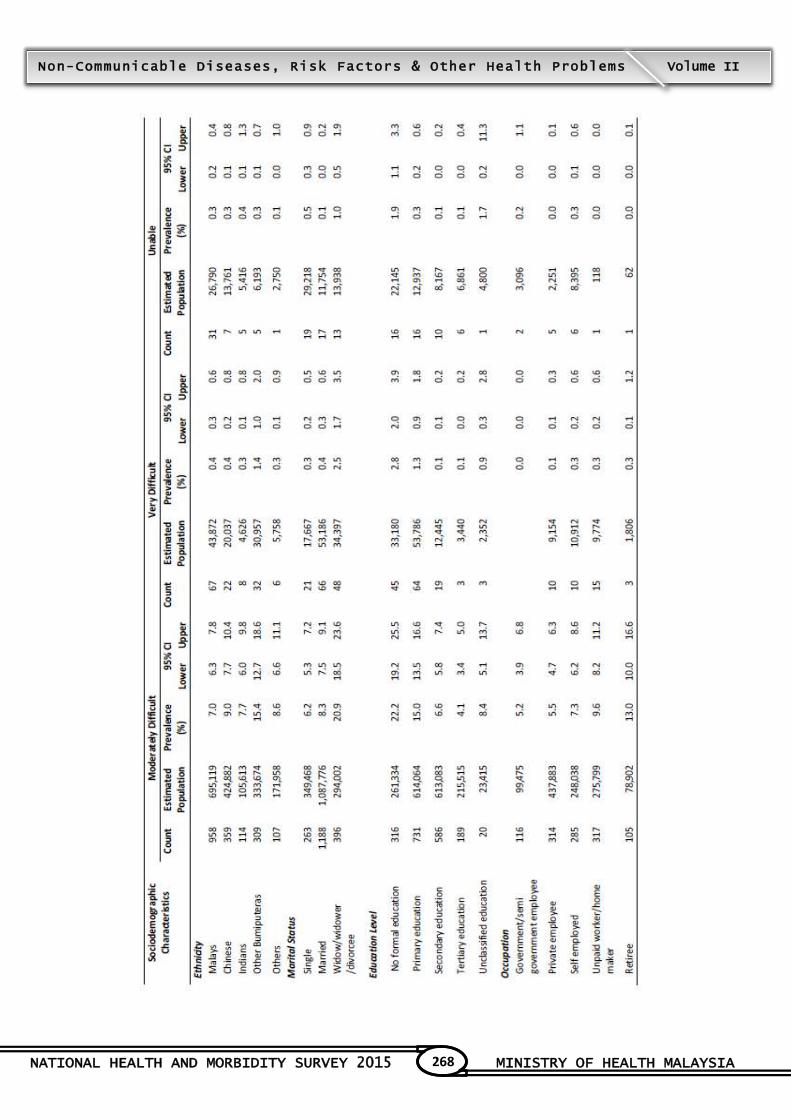
NATIONAL HEALTH AND MORBIDITY SURVEY 2015 MINISTRY OF HEALTH MALAYSIA
268
Non-Communicable Diseases, Risk Factors & Other Health Problems Volume II
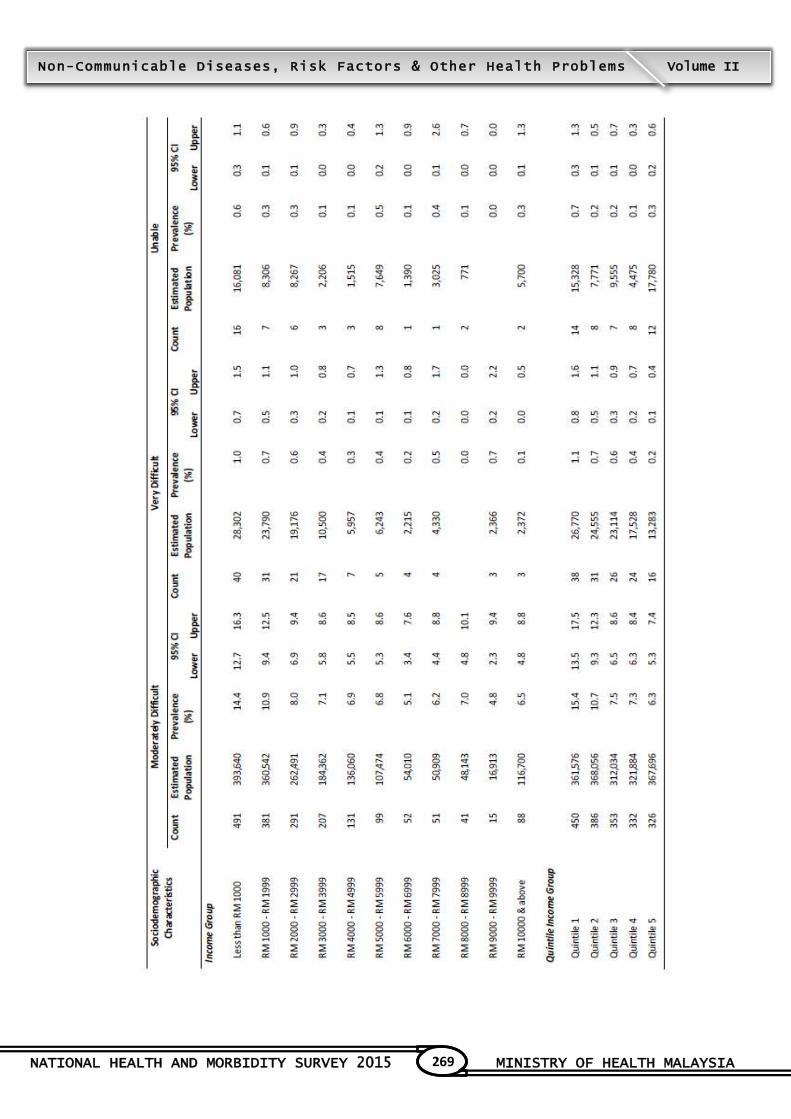
NATIONAL HEALTH AND MORBIDITY SURVEY 2015 MINISTRY OF HEALTH MALAYSIA
269
Non-Communicable Diseases, Risk Factors & Other Health Problems Volume II

NATIONAL HEALTH AND MORBIDITY SURVEY 2015 MINISTRY OF HEALTH MALAYSIA
270
Non-Communicable Diseases, Risk Factors & Other Health Problems Volume II
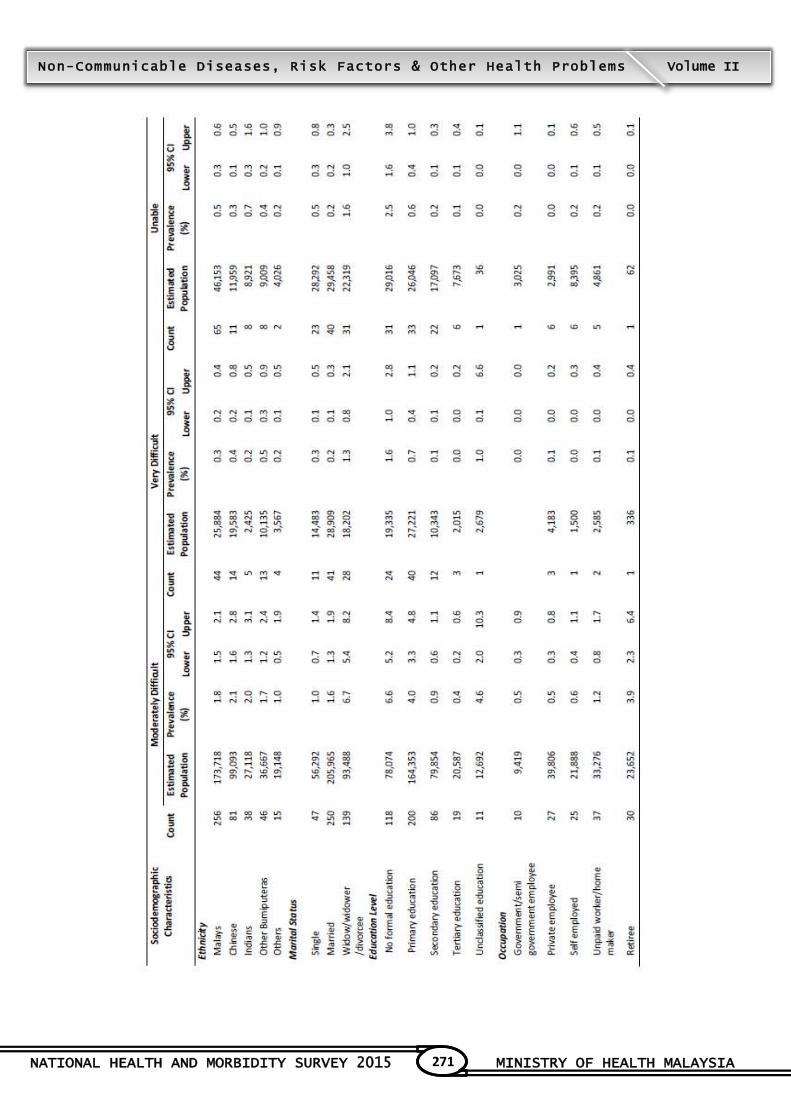
NATIONAL HEALTH AND MORBIDITY SURVEY 2015 MINISTRY OF HEALTH MALAYSIA
271
Non-Communicable Diseases, Risk Factors & Other Health Problems Volume II

NATIONAL HEALTH AND MORBIDITY SURVEY 2015 MINISTRY OF HEALTH MALAYSIA
272
Non-Communicable Diseases, Risk Factors & Other Health Problems Volume II
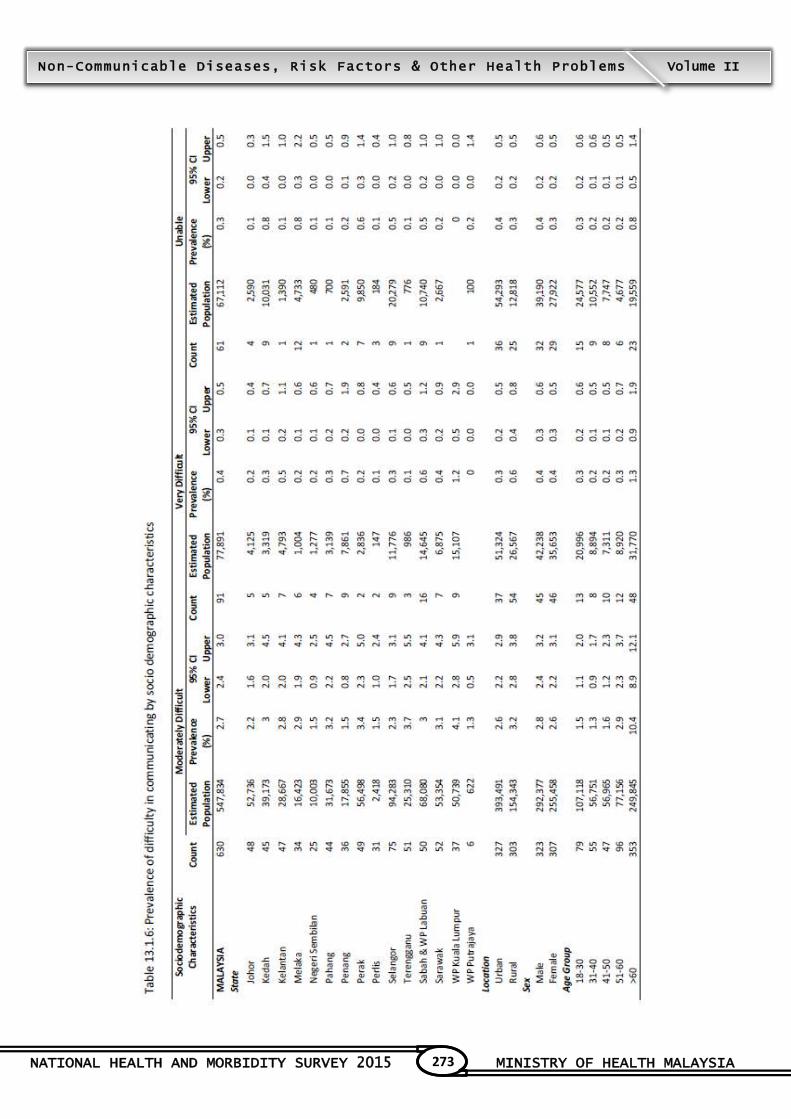
NATIONAL HEALTH AND MORBIDITY SURVEY 2015 MINISTRY OF HEALTH MALAYSIA
273
Non-Communicable Diseases, Risk Factors & Other Health Problems Volume II
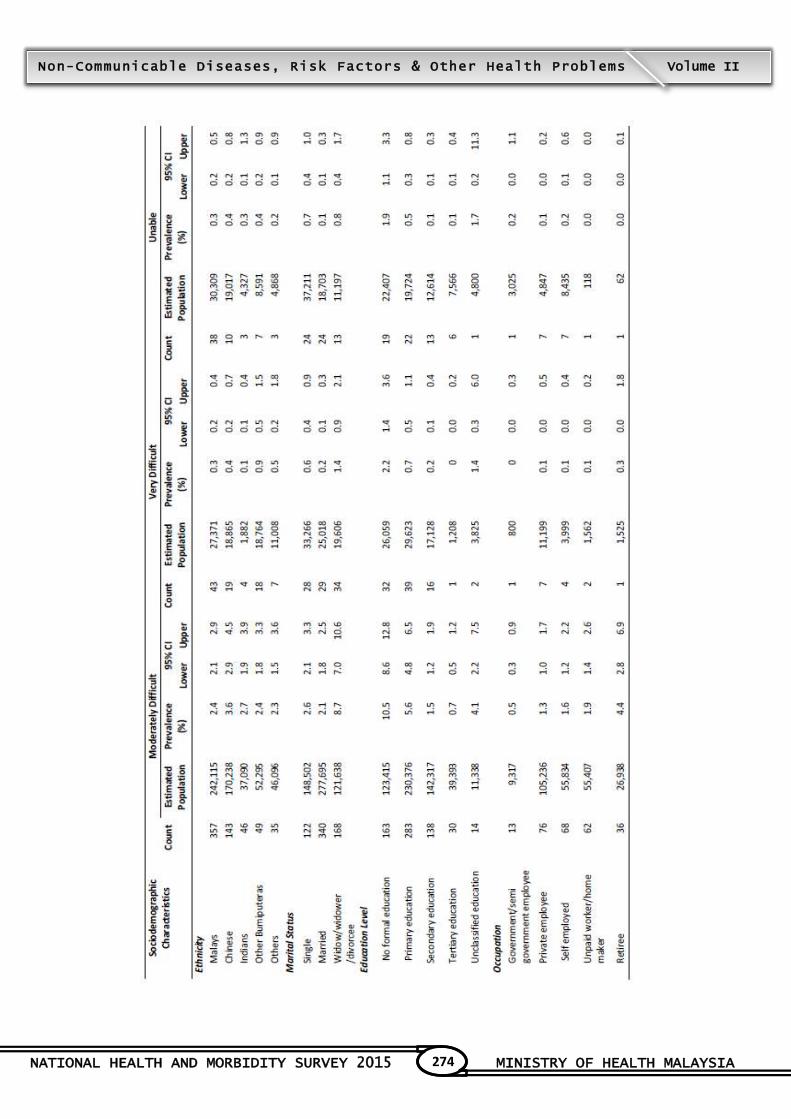
NATIONAL HEALTH AND MORBIDITY SURVEY 2015 MINISTRY OF HEALTH MALAYSIA
274
Non-Communicable Diseases, Risk Factors & Other Health Problems Volume II
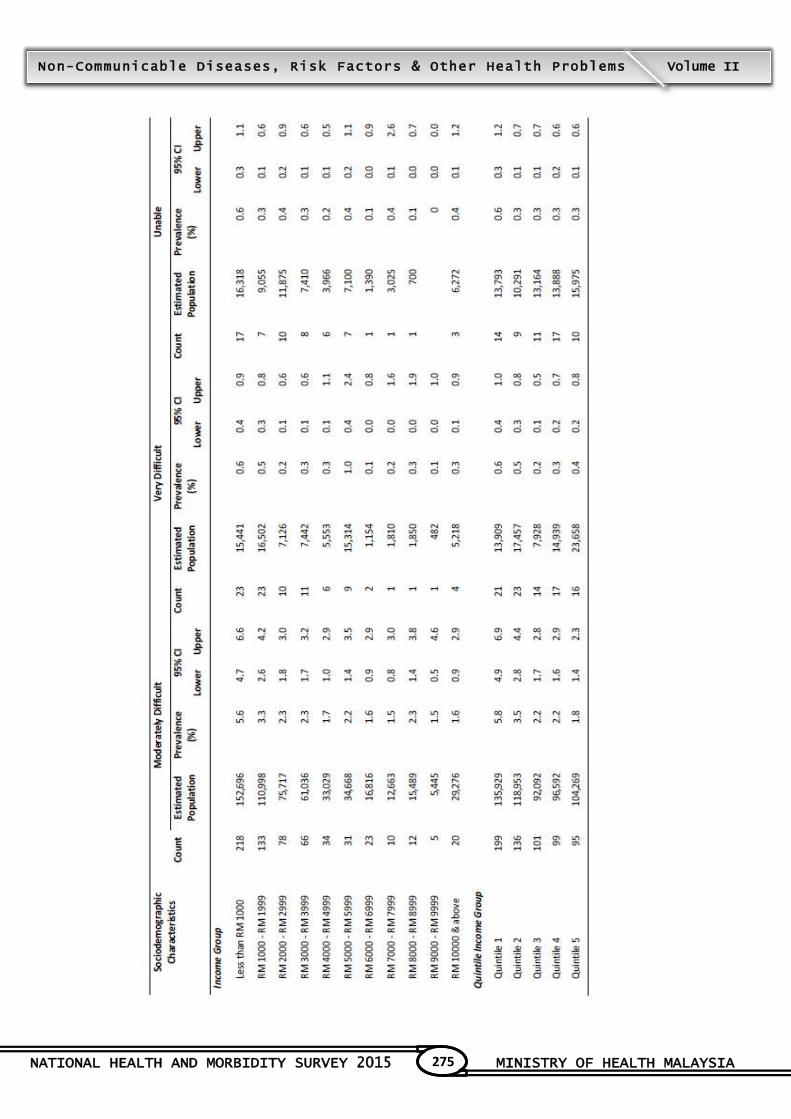
NATIONAL HEALTH AND MORBIDITY SURVEY 2015 MINISTRY OF HEALTH MALAYSIA
275
Non-Communicable Diseases, Risk Factors & Other Health Problems Volume II


TOPIC 14

NATIONAL HEALTH AND MORBIDITY SURVEY 2015 MINISTRY OF HEALTH MALAYSIA
286
Non-Communicable Diseases, Risk Factors & Other Health Problems Volume II
14. HEALTH LITERACY
Contributors to this section: Norrafizah Jaafar, Abu Bakar Rahman, Mohd Azahadi Omar
14.1 Background
Health literacy (HL) is defined by the World Health Organization (WHO) as cognitive and social
skills which determine the motivation and ability of individuals to gain access, to understand and
use information in ways which promote and maintain good health. According to Expert Panel on
Health Literacy, HL is defined as the ability to access, understand, evaluate and communicate
information as a way to promote, maintain and improve health in a variety of settings across the
life-course.
The Institute of Medicine of The National Academies United States of America reported that
individuals with inadequate health literacy have poorer health outcomes (1.5 to 3 times more likely
to experience) and less likely to use preventive care compared to those with adequate health
literacy; who are able to understand the information and make decisions about health and
ultimately reduce inequities in health.
At some point, even well-educated individual with strong reading and writing skills may face
trouble understanding a medical form or doctor's instructions regarding a drug or procedure.
Health literacy is related to convergence of education, culture and language, communication skills
of health professional, the nature of materials and messages and the settings in which health-
related supports are provided.
14.2 Objectives
14.2.1 General Objective
To determine the prevalence of health literacy in Malaysian adults.
14.2.2 Specific objectives
To determine the prevalence of overall health literacy by socio-demographic
subgroups.
To determine the prevalence of different levels of health literacy (Limited likely, limited
possible and adequate) by socio demographic subgroups.

NATIONAL HEALTH AND MORBIDITY SURVEY 2015 MINISTRY OF HEALTH MALAYSIA
287
Non-Communicable Diseases, Risk Factors & Other Health Problems Volume II
14.3 Target Population, Study Instrument And Definitions
Data on health literacy was obtained from adult respondents aged 18 years and above
through self-administered questionnaires using the Newest Vital Sign tool (NVS). The NVS
contains a specially designed ice cream nutrition label that is accompanied by a series of
questions and requires 3 minutes for administration.
The score sheet contain 6 domains on calories intake, amount of serving, saturated fat intake,
percentage of daily value calories intake, safeness of eating the ice cream and ingredients of
the ice cream. The answers were categorised into score 0 to 6 and divided into 3 levels
namely as:
14.3.1 Limited likely literacy (CATEGORY 1)
This indicated a high likelihood of low health literacy (LHL). The scoring range from 0 to
1.
14.3.2 Limited possible literacy (CATEGORY 2)
This indicated the possibility of LHL. The scoring range from 2 to 3.
14.3.3 Adequate literacy (CATEGORY 3)
This indicated adequate health literacy. The scoring range from 4 to 6. Those
individuals who do not meet criteria for Categories 3 are considered as inadequate
health literacy or low health literacy.
14.4 Findings
The overall prevalence of adequate health literacy among adults aged 18 years and above
was 6.6% (95% CI: 5.6, 7.7) with no differences between gender [Females (6.6%, 95% CI:
5.6, 7.9)] vs [males (6.5%, 95% CI: 5.3, 7.9)]. The urban population [7.8% (95% CI: 6.6, 9.3)]
reported a significantly adequate health literacy compared to the rural population [2.3% (95%
CI: 1.7, 3.1)]. The prevalence of adequate health literacy was highest among the age group of
20-34 years old. The level of health literacy decreased with increasing age and this was most
apparent in the elderly. The highest prevalence of adequate health literacy was among
Chinese [10.6% (95% CI: 8.2, 13.6)] and Indians [10.1% (95% CI: 7.0, 14.6)], followed by
Malays [6.0% (95% CI: 4.8, 7.4)], Other Bumiputras [2.4% (95% CI: 1.3, 4.3)], and others
[1.8% (95% CI: 0.9, 3.6)]. The level of adequate health literacy was highest among single
respondents [8.3% (95% CI: 6.8, 10.1)] compared to married persons [5.8% (95% CI: 4.8,
7.0)] and widow/ widower/ divorcee [5.0% (95% CI: 3.2, 7.8)].
NATIONAL HEALTH AND MORBIDITY SURVEY 2015 MINISTRY OF HEALTH MALAYSIA
288
Non-Communicable Diseases, Risk Factors & Other Health Problems Volume II
With regards to the level of education, adults with tertiary education [11.0% (95% CI: 9.3,
13.0)] were found to be more adequate in health literacy than those with primary [2.4% (95%
CI: 1.5, 3.6)] or secondary education [5.1% (95% CI: 4.1, 6.5)]. In occupational sector,
government/semi government employee [8.5% (95% CI: 6.6, 10.8)] had the highest
prevalence of adequate health literacy while unpaid worker/home maker [4.3% (95% CI: 3.3,
5.5)] had the lowest. By state, Perak [19.5% (95% CI: 13.2, 27.9)] had the highest prevalence
of adequate in health literacy, followed by WP Putrajaya [16.0% (95% CI: 11.4, 21.9)] and
Kedah [12.6% (95% CI: 7.6, 20.2)] (Table 14.1.1). There was no trend of adequate health
literacy according to income group with the highest among those earned RM6000-RM6999
[11.6% (95% CI: 7.8, 16.9)] and lowest among those earned RM2000-RM2999 [3.6% (95%
CI: 2.5, 5.2)].
14.5 Conclusion
This is the first nationwide study on health literacy among Malaysian adults. However, the level of
adequate health literacy was 6.6%. There was an obvious difference between urban and rural
locality and education level. To address the issue of low health literacy, health professionals and
community must be knowledgeable, aware, and responsive to the health literacy of patients and
population.
14.6 Recommendations
In order to promote a health literate population:
Ministry of Health should take the lead in developing uniform standards for addressing
health literacy
Intensity multidisciplinary research on the extent, associations and consequences of limited
health literacy.
Enhancement of health promotion to empower the community on the importance of
adequate heath literacy
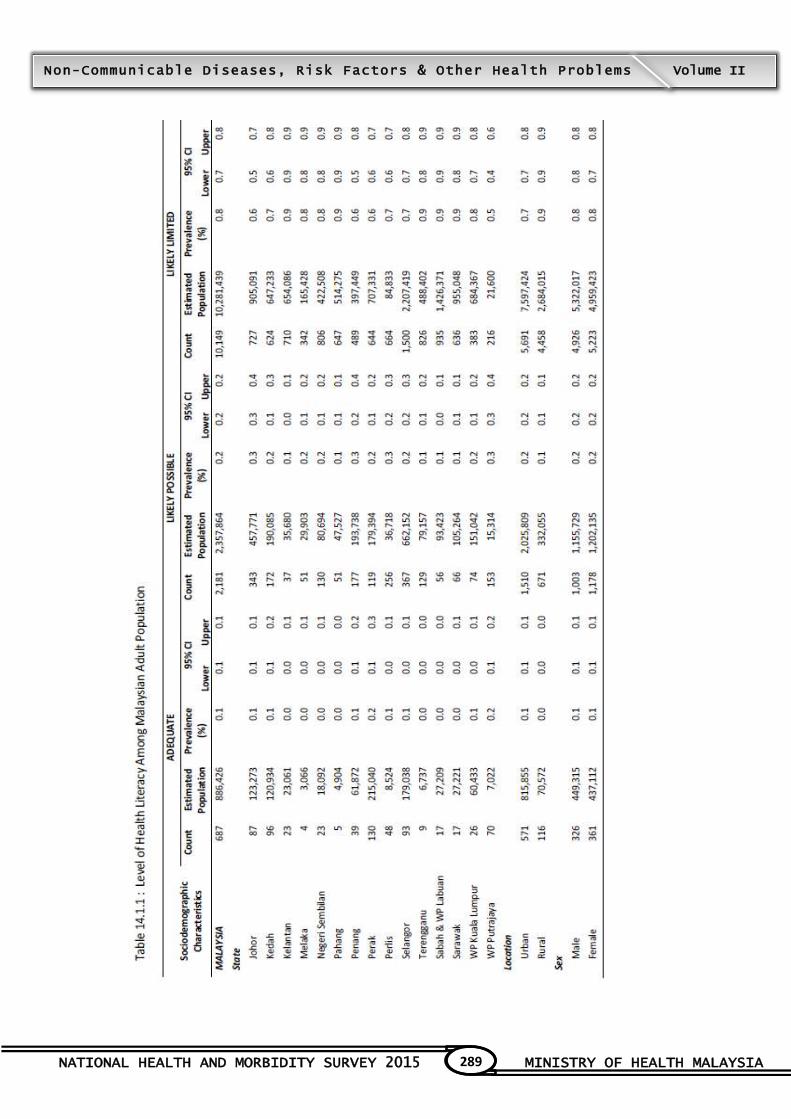
NATIONAL HEALTH AND MORBIDITY SURVEY 2015 MINISTRY OF HEALTH MALAYSIA
289
Non-Communicable Diseases, Risk Factors & Other Health Problems Volume II

NATIONAL HEALTH AND MORBIDITY SURVEY 2015 MINISTRY OF HEALTH MALAYSIA
290
Non-Communicable Diseases, Risk Factors & Other Health Problems Volume II
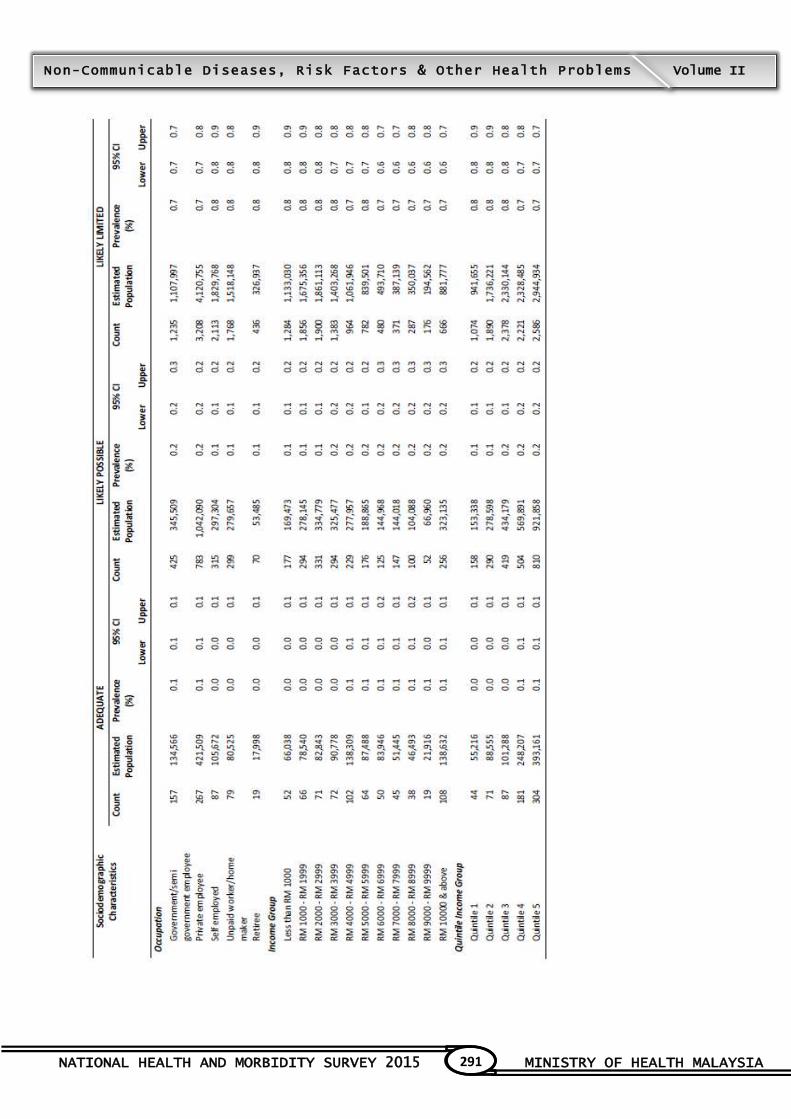
NATIONAL HEALTH AND MORBIDITY SURVEY 2015 MINISTRY OF HEALTH MALAYSIA
291
Non-Communicable Diseases, Risk Factors & Other Health Problems Volume II