Embed Size (px)
Citation preview
RESEARCH ARTICLE Open Access
A birth population-based survey of pretermmorbidity and mortality by gestational ageXiaojing Guo1, Xiaoqiong Li2, Tingting Qi2, Zhaojun Pan3, Xiaoqin Zhu4, Hui Wang4, Ying Dong1,Hongni Yue3,4* and Bo Sun1*
Abstract
Background: Despite 15–17 millions of annual births in China, there is a paucity of information on prevalence andoutcome of preterm birth. We characterized the outcome of preterm births and hospitalized preterm infants bygestational age (GA) in Huai’an in 2015, an emerging prefectural region of China.
Methods: Of 59,245 regional total births, clinical data on 2651 preterm births and 1941 hospitalized pretermneonates were extracted from Huai’an Women and Children’s Hospital (HWCH) and non-HWCH hospitals in 2018–2020. Preterm prevalence, morbidity and mortality rates were characterized and compared by hospital categoriesand GA spectra. Death risks of preterm births and hospitalized preterm infants in the whole region were analyzedwith multivariable Poisson regression.
Results: The prevalence of extreme, very, moderate, late and total preterm of the regional total births were 0.14,0.53, 0.72, 3.08 and 4.47%, with GA-specific neonatal mortality rates being 44.4, 15.8, 3.7, 1.5 and 4.3%, respectively.There were 1025 (52.8% of whole region) preterm admissions in HWCH, with significantly lower in-hospital deathrate of inborn (33 of 802, 4.1%) than out-born (23 of 223, 10.3%) infants. Compared to non-HWCH, three-fold moreneonates in HWCH were under critical care with higher death rate, including most extremely preterm infants.Significantly all-death risks were found for the total preterm births in birth weight < 1000 g, GA < 32 weeks,amniotic fluid contamination, Apgar-5 min < 7, and birth defects. For the hospitalized preterm infants, significantlyin-hospital death risks were found in out-born of HWCH, GA < 32 weeks, birth weight < 1000 g, Apgar-5 min < 7,birth defects, respiratory distress syndrome, necrotizing enterocolitis and ventilation, whereas born in HWCH,antenatal glucocorticoids, cesarean delivery and surfactant use decreased the death risks.
Conclusions: The integrated data revealed the prevalence, GA-specific morbidity and mortality rate of total pretermbirths and their hospitalization, demonstrating the efficiency of leading referral center and whole regional perinatal-neonatal network in China. The concept and protocol should be validated in further studies for prevention ofpreterm birth.
Keywords: Birth population, Prevalence, Preterm, Morbidity, Mortality, Gestation, Regional perinatal-neonatalnetwork
© The Author(s). 2021, corrected publication 2021. Open Access This article is licensed under a Creative Commons Attribution4.0 International License, which permits use, sharing, adaptation, distribution and reproduction in any medium or format, aslong as you give appropriate credit to the original author(s) and the source, provide a link to the Creative Commons licence,and indicate if changes were made. The images or other third party material in this article are included in the article's CreativeCommons licence, unless indicated otherwise in a credit line to the material. If material is not included in the article's CreativeCommons licence and your intended use is not permitted by statutory regulation or exceeds the permitted use, you will needto obtain permission directly from the copyright holder. To view a copy of this licence, visit http://creativecommons.org/licenses/by/4.0/. The Creative Commons Public Domain Dedication waiver (http://creativecommons.org/publicdomain/zero/1.0/) applies to the data made available in this article, unless otherwise stated in a credit line to the data.
* Correspondence: [email protected]; [email protected];[email protected] of Neonatology and Unit of Population Health Information,Huai’an Women and Children’s Hospital, 104 South Ren Min Road, Huai’an223002, Jiangsu, China1The NCH Key Laboratory of Neonatal Diseases, National Children’s MedicalCenter, Children’s Hospital of Fudan University, Shanghai 201102, ChinaFull list of author information is available at the end of the article
Guo et al. BMC Pregnancy and Childbirth (2021) 21:291 https://doi.org/10.1186/s12884-021-03726-4
BackgroundPerinatal and neonatal morbidity and mortality of pre-term births represent the focus of quality improvementwith perinatal healthcare strategies [1–5]. Despite themajority of neonatal deaths attributed to preterm birthcomplication, and a large amount of hospital admission-based data by gestational age (GA), available in China,the whole picture of perinatal-neonatal care remainsunclear due to a lack of birth population-based clinicalsurveys from obstetric and neonatal perspective [6–9].Although the number of Chinese annual birth popula-tion has reached 15–17 millions in the past decade, withan established universal health insurance coveringmaternal-infant healthcare [10–13], there is a paucity ofdata on vital statistics of preterm births and assessmentof combined effects of antenatal, peripartum and postna-tal interventions on perinatal and neonatal outcome inthe preterm birth and hospitalized population.Many institute-based surveys and controlled studies
may provide prevalence, morbidity and mortality as out-come of hospitalized preterm population or samples,however, reliable information in birth population-basedoutcome of hospitalized neonatal infants remains lackingfrom China. For prevention of preterm birth, perinataland neonatal death, many efforts have been exerted inthe past decade with the universal maternal-infant healthinsurance coverage as well as facility-based robust tech-nologies, including antenatal care with fetal ultrasoundmonitoring, glucocorticosteroids, tocolysis, delivery re-suscitation and neonatal intensive and critical care [1–5,7, 8, 14–16]. However, efficacy of these strategies mayvary taking geographic and socioeconomic status ofChina into account. In this regard, further in-depth in-vestigations are required to unravel the efficiency ofperinatal-neonatal service as an integrated antenatal,peripartum and postnatal care system under particularclinical settings and infrastructure, in order to optimizefacility-based practice in emerging regions in world-wideperspective.The national surveillance system reporting on peri-
natal information in China has limitations as it onlyretrieved data of preterm births ≥28 weeks of GA [6, 17–19]. Huai’an is an emerging prefectural region in eastChina with 5.6-million population and 50% rural resi-dents, the regional gross domestic production per capitaapproaching the national average level. According to ourprevious surveys of complete birth registries in Huai’anin 2015, a survival rate up to 44 weeks of adjusted post-menstrual age (aPMA) of more than 50% was observedin preterm infants with 27–28 gestational weeks and be-yond [11]. By comparison, the 50% survival rate was re-ported in 23–25 weeks of gestation from the nation-wideregistry or perinatal network data in developed countries[1–5, 7–9]. Our previous data demonstrated substantial
and persistent improvement in Huai’an perinatal-neonatal care between 2010 and 2015, probably due tothe establishment of centralized prenatal care and deliv-eries at level II and III hospitals [10, 11, 20]. This en-abled us to take facility-specific conditions and regionalinfrastructure into consideration, when investigating theimpact of integrated antenatal, peripartum and postnatalinterventions on preterm especially extreme pretermsurvival in this region.The current study aimed to delineate the prevalence,
morbidity and mortality of whole regional preterm birthsand hospitalized infants stratified by GA, to investigatethe role of Huai’an Women and Children’s Hospital(HWCH) as the main transferal center of whole region,and to verify the efficacy of perinatal interventions andthe underlying neonatal morbidities of deaths. As birthpopulation-based studies on perinatal and neonatalhealthcare are still at preliminary stage in China [6, 12,13], our concept and methodology of using regionalbirth registry data to assess death risks in hospitalizedpreterm population, and the quality of regionalperinatal-neonatal healthcare system, may be helpful tore-evaluate and optimize the standard of care and healthinsurance policy in the emerging region in transition ofChina [6, 13].
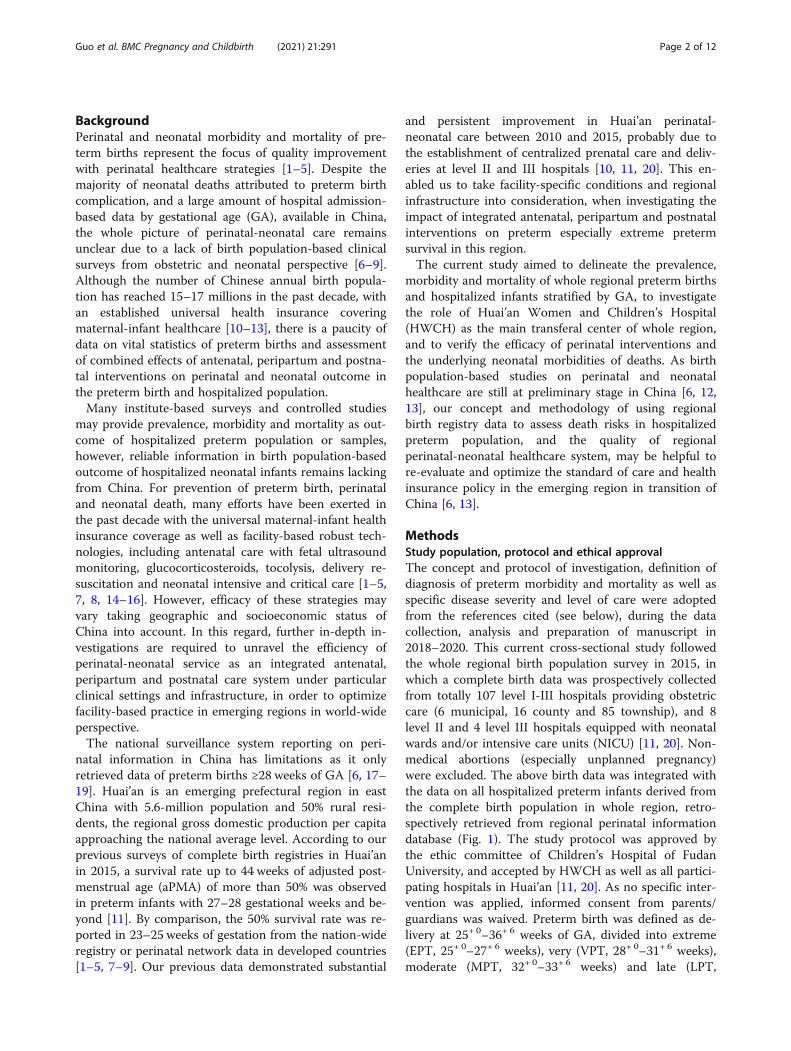
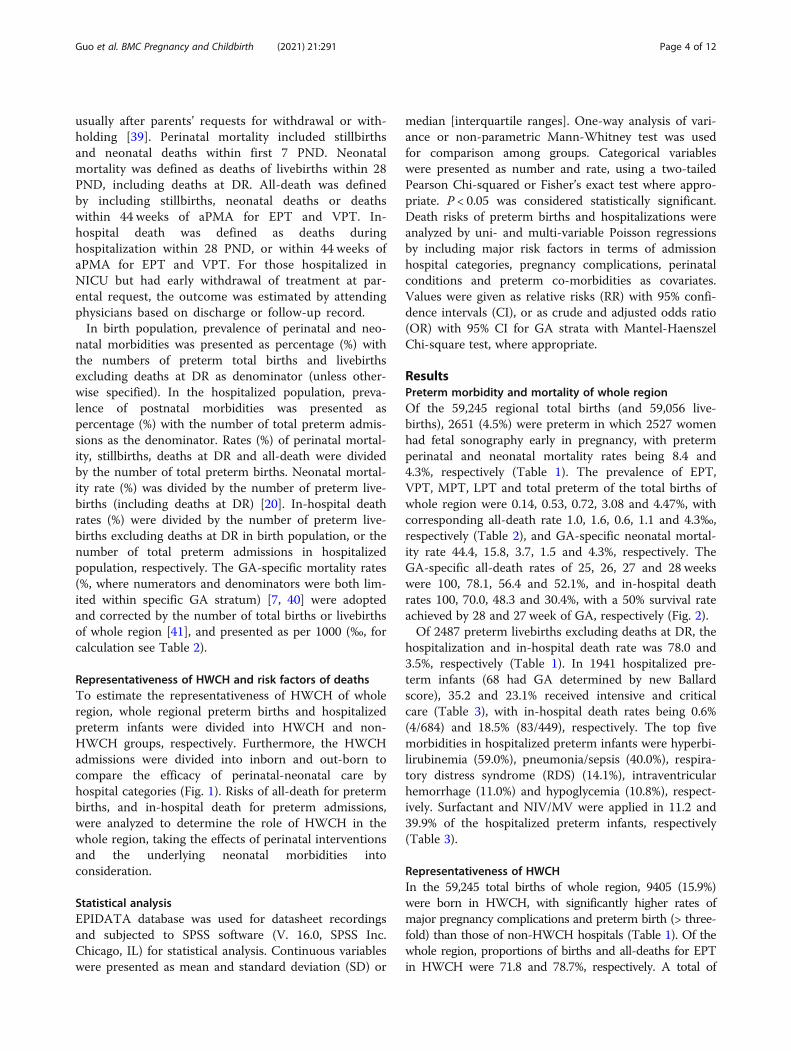
MethodsStudy population, protocol and ethical approvalThe concept and protocol of investigation, definition ofdiagnosis of preterm morbidity and mortality as well asspecific disease severity and level of care were adoptedfrom the references cited (see below), during the datacollection, analysis and preparation of manuscript in2018–2020. This current cross-sectional study followedthe whole regional birth population survey in 2015, inwhich a complete birth data was prospectively collectedfrom totally 107 level I-III hospitals providing obstetriccare (6 municipal, 16 county and 85 township), and 8level II and 4 level III hospitals equipped with neonatalwards and/or intensive care units (NICU) [11, 20]. Non-medical abortions (especially unplanned pregnancy)were excluded. The above birth data was integrated withthe data on all hospitalized preterm infants derived fromthe complete birth population in whole region, retro-spectively retrieved from regional perinatal informationdatabase (Fig. 1). The study protocol was approved bythe ethic committee of Children’s Hospital of FudanUniversity, and accepted by HWCH as well as all partici-pating hospitals in Huai’an [11, 20]. As no specific inter-vention was applied, informed consent from parents/guardians was waived. Preterm birth was defined as de-livery at 25+ 0–36+ 6 weeks of GA, divided into extreme(EPT, 25+ 0–27+ 6 weeks), very (VPT, 28+ 0–31+ 6 weeks),moderate (MPT, 32+ 0–33+ 6 weeks) and late (LPT,
Guo et al. BMC Pregnancy and Childbirth (2021) 21:291 Page 2 of 12
34+ 0–36+ 6 weeks) preterm groups [21, 22]. Those ofEPT below 25 weeks of GA were not included due tovery few numbers and parental decision not to provideresuscitation at delivery. Incidences of EPT, VPT, MPT,LPT and total preterm births were presented as preva-lence in percent of the number of total births (includingterm and post-term births) of whole region.
Definitions of preterm morbidity and mortalityThe diagnostic criteria of pregnancy, perinatal and neo-natal co-morbidities and complications are presented inadditional file 1 [23–34]. Definitions regarding vital sta-tistics are based on the original survey [11, 20], andthe 10th revision of the international classification ofdiseases [35]. Briefly, GA was mainly determined bythe date of last menstrual period and/or fetal
sonography in early pregnancy, or postnatal assess-ment by new Ballard score when prenatal recordswere missing or incomplete [36]. Birth weight (BW)was measured at birth. Small for GA (SGA) was de-fined as a BW < 10th percentile for gender and GA[37]. Birth defects (BD) were identified prenatally orwithin the first 7 postnatal days (PND) [11, 20]. Se-verity of neonatal underlying diseases were character-ized as requiring intensive or critical care based onthe treatment strength during hospitalization, such asdegree of the disease severity, in need of non-invasive/ mechanical ventilation (NIV/MV), surfactant, vaso-pressor, or surgery, etc. (also see additional file 1) [7,28, 38]. Fetal death was deemed to be synonymouswith stillbirth. Deaths at delivery room (DR) referredto those born alive but died during resuscitation,
Fig. 1 The flowchart of database and enrolled preterm population by gestational age strata and hospital categories. Abbreviations: EPT, extremelypreterm; VPT, very preterm; MPT, moderate preterm; LPT, late preterm; ET, early term. For definitions of deaths and other abbreviations see Table1 legends
Guo et al. BMC Pregnancy and Childbirth (2021) 21:291 Page 3 of 12
usually after parents’ requests for withdrawal or with-holding [39]. Perinatal mortality included stillbirthsand neonatal deaths within first 7 PND. Neonatalmortality was defined as deaths of livebirths within 28PND, including deaths at DR. All-death was definedby including stillbirths, neonatal deaths or deathswithin 44 weeks of aPMA for EPT and VPT. In-hospital death was defined as deaths duringhospitalization within 28 PND, or within 44 weeks ofaPMA for EPT and VPT. For those hospitalized inNICU but had early withdrawal of treatment at par-ental request, the outcome was estimated by attendingphysicians based on discharge or follow-up record.In birth population, prevalence of perinatal and neo-
natal morbidities was presented as percentage (%) withthe numbers of preterm total births and livebirthsexcluding deaths at DR as denominator (unless other-wise specified). In the hospitalized population, preva-lence of postnatal morbidities was presented aspercentage (%) with the number of total preterm admis-sions as the denominator. Rates (%) of perinatal mortal-ity, stillbirths, deaths at DR and all-death were dividedby the number of total preterm births. Neonatal mortal-ity rate (%) was divided by the number of preterm live-births (including deaths at DR) [20]. In-hospital deathrates (%) were divided by the number of preterm live-births excluding deaths at DR in birth population, or thenumber of total preterm admissions in hospitalizedpopulation, respectively. The GA-specific mortality rates(%, where numerators and denominators were both lim-ited within specific GA stratum) [7, 40] were adoptedand corrected by the number of total births or livebirthsof whole region [41], and presented as per 1000 (‰, forcalculation see Table 2).
Representativeness of HWCH and risk factors of deathsTo estimate the representativeness of HWCH of wholeregion, whole regional preterm births and hospitalizedpreterm infants were divided into HWCH and non-HWCH groups, respectively. Furthermore, the HWCHadmissions were divided into inborn and out-born tocompare the efficacy of perinatal-neonatal care byhospital categories (Fig. 1). Risks of all-death for pretermbirths, and in-hospital death for preterm admissions,were analyzed to determine the role of HWCH in thewhole region, taking the effects of perinatal interventionsand the underlying neonatal morbidities intoconsideration.
Statistical analysisEPIDATA database was used for datasheet recordingsand subjected to SPSS software (V. 16.0, SPSS Inc.Chicago, IL) for statistical analysis. Continuous variableswere presented as mean and standard deviation (SD) or
median [interquartile ranges]. One-way analysis of vari-ance or non-parametric Mann-Whitney test was usedfor comparison among groups. Categorical variableswere presented as number and rate, using a two-tailedPearson Chi-squared or Fisher’s exact test where appro-priate. P < 0.05 was considered statistically significant.Death risks of preterm births and hospitalizations wereanalyzed by uni- and multi-variable Poisson regressionsby including major risk factors in terms of admissionhospital categories, pregnancy complications, perinatalconditions and preterm co-morbidities as covariates.Values were given as relative risks (RR) with 95% confi-dence intervals (CI), or as crude and adjusted odds ratio(OR) with 95% CI for GA strata with Mantel-HaenszelChi-square test, where appropriate.
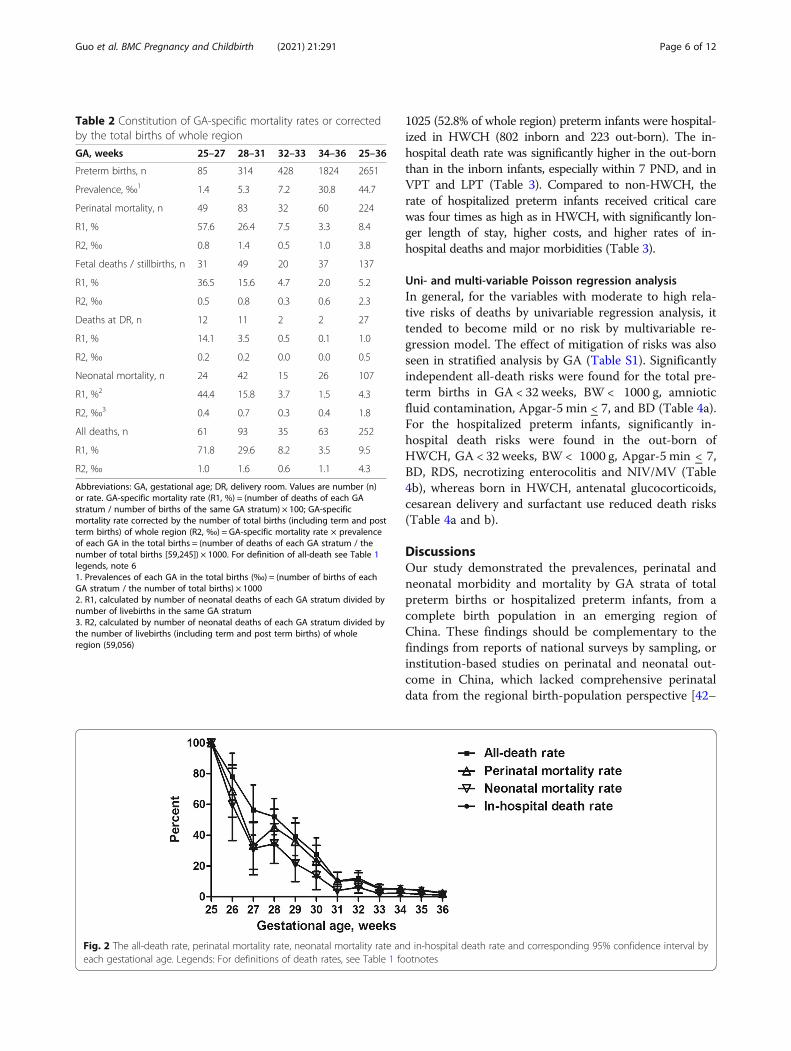
ResultsPreterm morbidity and mortality of whole regionOf the 59,245 regional total births (and 59,056 live-births), 2651 (4.5%) were preterm in which 2527 womenhad fetal sonography early in pregnancy, with pretermperinatal and neonatal mortality rates being 8.4 and4.3%, respectively (Table 1). The prevalence of EPT,VPT, MPT, LPT and total preterm of the total births ofwhole region were 0.14, 0.53, 0.72, 3.08 and 4.47%, withcorresponding all-death rate 1.0, 1.6, 0.6, 1.1 and 4.3‰,respectively (Table 2), and GA-specific neonatal mortal-ity rate 44.4, 15.8, 3.7, 1.5 and 4.3%, respectively. TheGA-specific all-death rates of 25, 26, 27 and 28 weekswere 100, 78.1, 56.4 and 52.1%, and in-hospital deathrates 100, 70.0, 48.3 and 30.4%, with a 50% survival rateachieved by 28 and 27 week of GA, respectively (Fig. 2).Of 2487 preterm livebirths excluding deaths at DR, the
hospitalization and in-hospital death rate was 78.0 and3.5%, respectively (Table 1). In 1941 hospitalized pre-term infants (68 had GA determined by new Ballardscore), 35.2 and 23.1% received intensive and criticalcare (Table 3), with in-hospital death rates being 0.6%(4/684) and 18.5% (83/449), respectively. The top fivemorbidities in hospitalized preterm infants were hyperbi-lirubinemia (59.0%), pneumonia/sepsis (40.0%), respira-tory distress syndrome (RDS) (14.1%), intraventricularhemorrhage (11.0%) and hypoglycemia (10.8%), respect-ively. Surfactant and NIV/MV were applied in 11.2 and39.9% of the hospitalized preterm infants, respectively(Table 3).
Representativeness of HWCHIn the 59,245 total births of whole region, 9405 (15.9%)were born in HWCH, with significantly higher rates ofmajor pregnancy complications and preterm birth (> three-fold) than those of non-HWCH hospitals (Table 1). Of thewhole region, proportions of births and all-deaths for EPTin HWCH were 71.8 and 78.7%, respectively. A total of
Guo et al. BMC Pregnancy and Childbirth (2021) 21:291 Page 4 of 12
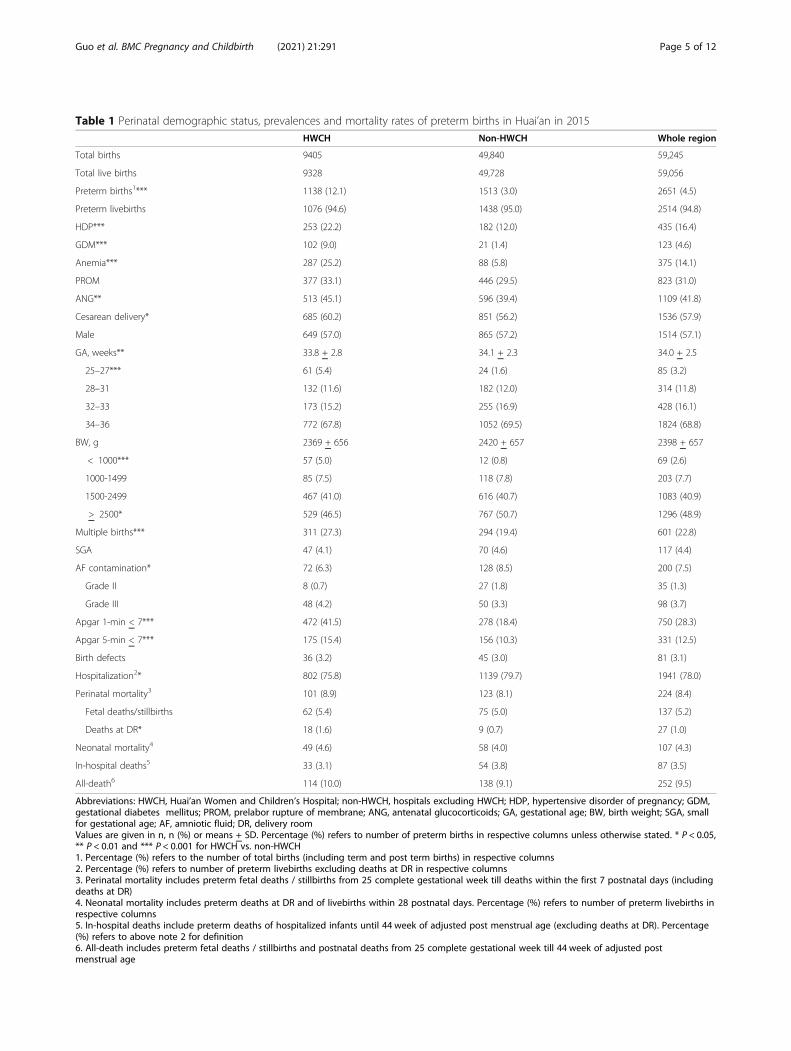
Table 1 Perinatal demographic status, prevalences and mortality rates of preterm births in Huai’an in 2015
HWCH Non-HWCH Whole region
Total births 9405 49,840 59,245
Total live births 9328 49,728 59,056
Preterm births1*** 1138 (12.1) 1513 (3.0) 2651 (4.5)
Preterm livebirths 1076 (94.6) 1438 (95.0) 2514 (94.8)
HDP*** 253 (22.2) 182 (12.0) 435 (16.4)
GDM*** 102 (9.0) 21 (1.4) 123 (4.6)
Anemia*** 287 (25.2) 88 (5.8) 375 (14.1)
PROM 377 (33.1) 446 (29.5) 823 (31.0)
ANG** 513 (45.1) 596 (39.4) 1109 (41.8)
Cesarean delivery* 685 (60.2) 851 (56.2) 1536 (57.9)
Male 649 (57.0) 865 (57.2) 1514 (57.1)
GA, weeks** 33.8 + 2.8 34.1 + 2.3 34.0 + 2.5
25–27*** 61 (5.4) 24 (1.6) 85 (3.2)
28–31 132 (11.6) 182 (12.0) 314 (11.8)
32–33 173 (15.2) 255 (16.9) 428 (16.1)
34–36 772 (67.8) 1052 (69.5) 1824 (68.8)
BW, g 2369 + 656 2420 + 657 2398 + 657
< 1000*** 57 (5.0) 12 (0.8) 69 (2.6)
1000-1499 85 (7.5) 118 (7.8) 203 (7.7)
1500-2499 467 (41.0) 616 (40.7) 1083 (40.9)
> 2500* 529 (46.5) 767 (50.7) 1296 (48.9)
Multiple births*** 311 (27.3) 294 (19.4) 601 (22.8)
SGA 47 (4.1) 70 (4.6) 117 (4.4)
AF contamination* 72 (6.3) 128 (8.5) 200 (7.5)
Grade II 8 (0.7) 27 (1.8) 35 (1.3)
Grade III 48 (4.2) 50 (3.3) 98 (3.7)
Apgar 1-min < 7*** 472 (41.5) 278 (18.4) 750 (28.3)
Apgar 5-min < 7*** 175 (15.4) 156 (10.3) 331 (12.5)
Birth defects 36 (3.2) 45 (3.0) 81 (3.1)
Hospitalization2* 802 (75.8) 1139 (79.7) 1941 (78.0)
Perinatal mortality3 101 (8.9) 123 (8.1) 224 (8.4)
Fetal deaths/stillbirths 62 (5.4) 75 (5.0) 137 (5.2)
Deaths at DR* 18 (1.6) 9 (0.7) 27 (1.0)
Neonatal mortality4 49 (4.6) 58 (4.0) 107 (4.3)
In-hospital deaths5 33 (3.1) 54 (3.8) 87 (3.5)
All-death6 114 (10.0) 138 (9.1) 252 (9.5)
Abbreviations: HWCH, Huai’an Women and Children’s Hospital; non-HWCH, hospitals excluding HWCH; HDP, hypertensive disorder of pregnancy; GDM,gestational diabetes mellitus; PROM, prelabor rupture of membrane; ANG, antenatal glucocorticoids; GA, gestational age; BW, birth weight; SGA, smallfor gestational age; AF, amniotic fluid; DR, delivery roomValues are given in n, n (%) or means + SD. Percentage (%) refers to number of preterm births in respective columns unless otherwise stated. * P < 0.05,** P < 0.01 and *** P < 0.001 for HWCH vs. non-HWCH1. Percentage (%) refers to the number of total births (including term and post term births) in respective columns2. Percentage (%) refers to number of preterm livebirths excluding deaths at DR in respective columns3. Perinatal mortality includes preterm fetal deaths / stillbirths from 25 complete gestational week till deaths within the first 7 postnatal days (includingdeaths at DR)4. Neonatal mortality includes preterm deaths at DR and of livebirths within 28 postnatal days. Percentage (%) refers to number of preterm livebirths inrespective columns5. In-hospital deaths include preterm deaths of hospitalized infants until 44 week of adjusted post menstrual age (excluding deaths at DR). Percentage(%) refers to above note 2 for definition6. All-death includes preterm fetal deaths / stillbirths and postnatal deaths from 25 complete gestational week till 44 week of adjusted postmenstrual age
Guo et al. BMC Pregnancy and Childbirth (2021) 21:291 Page 5 of 12
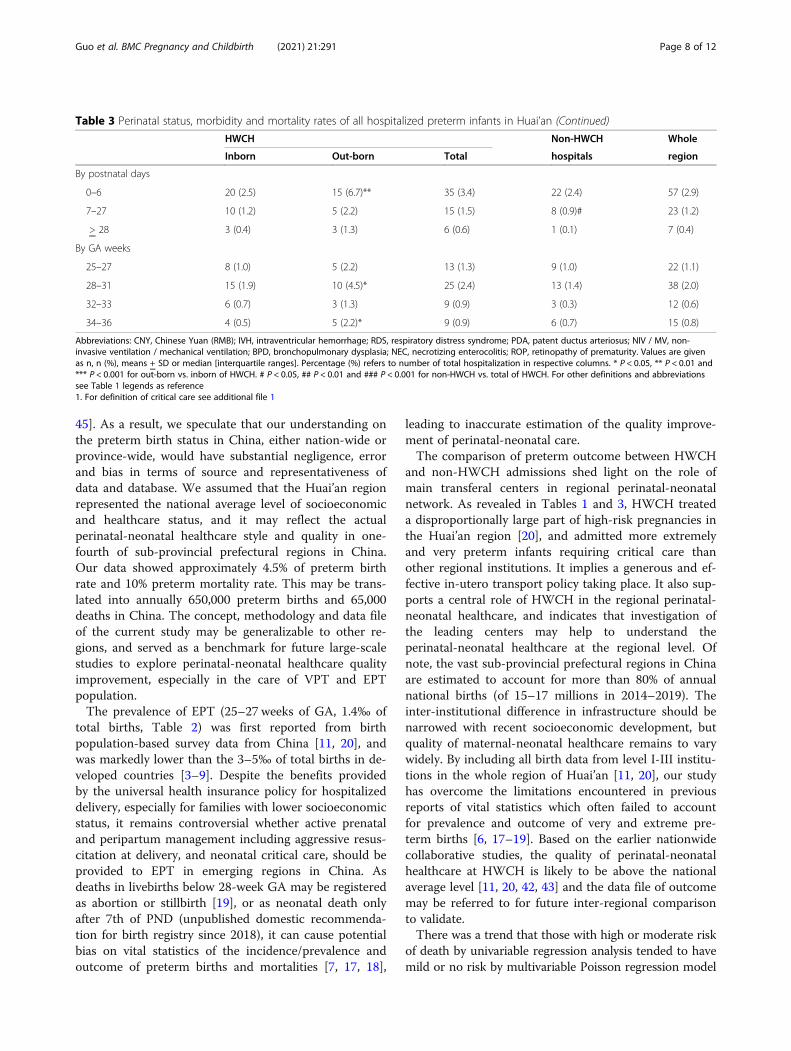
1025 (52.8% of whole region) preterm infants were hospital-ized in HWCH (802 inborn and 223 out-born). The in-hospital death rate was significantly higher in the out-bornthan in the inborn infants, especially within 7 PND, and inVPT and LPT (Table 3). Compared to non-HWCH, therate of hospitalized preterm infants received critical carewas four times as high as in HWCH, with significantly lon-ger length of stay, higher costs, and higher rates of in-hospital deaths and major morbidities (Table 3).
Uni- and multi-variable Poisson regression analysisIn general, for the variables with moderate to high rela-tive risks of deaths by univariable regression analysis, ittended to become mild or no risk by multivariable re-gression model. The effect of mitigation of risks was alsoseen in stratified analysis by GA (Table S1). Significantlyindependent all-death risks were found for the total pre-term births in GA < 32 weeks, BW < 1000 g, amnioticfluid contamination, Apgar-5 min < 7, and BD (Table 4a).For the hospitalized preterm infants, significantly in-hospital death risks were found in the out-born ofHWCH, GA < 32 weeks, BW < 1000 g, Apgar-5 min < 7,BD, RDS, necrotizing enterocolitis and NIV/MV (Table4b), whereas born in HWCH, antenatal glucocorticoids,cesarean delivery and surfactant use reduced death risks(Table 4a and b).
DiscussionsOur study demonstrated the prevalences, perinatal andneonatal morbidity and mortality by GA strata of totalpreterm births or hospitalized preterm infants, from acomplete birth population in an emerging region ofChina. These findings should be complementary to thefindings from reports of national surveys by sampling, orinstitution-based studies on perinatal and neonatal out-come in China, which lacked comprehensive perinataldata from the regional birth-population perspective [42–
Table 2 Constitution of GA-specific mortality rates or correctedby the total births of whole region
GA, weeks 25–27 28–31 32–33 34–36 25–36
Preterm births, n 85 314 428 1824 2651
Prevalence, ‰1 1.4 5.3 7.2 30.8 44.7
Perinatal mortality, n 49 83 32 60 224
R1, % 57.6 26.4 7.5 3.3 8.4
R2, ‰ 0.8 1.4 0.5 1.0 3.8
Fetal deaths / stillbirths, n 31 49 20 37 137
R1, % 36.5 15.6 4.7 2.0 5.2
R2, ‰ 0.5 0.8 0.3 0.6 2.3
Deaths at DR, n 12 11 2 2 27
R1, % 14.1 3.5 0.5 0.1 1.0
R2, ‰ 0.2 0.2 0.0 0.0 0.5
Neonatal mortality, n 24 42 15 26 107
R1, %2 44.4 15.8 3.7 1.5 4.3
R2, ‰3 0.4 0.7 0.3 0.4 1.8
All deaths, n 61 93 35 63 252
R1, % 71.8 29.6 8.2 3.5 9.5
R2, ‰ 1.0 1.6 0.6 1.1 4.3
Abbreviations: GA, gestational age; DR, delivery room. Values are number (n)or rate. GA-specific mortality rate (R1, %) = (number of deaths of each GAstratum / number of births of the same GA stratum) × 100; GA-specificmortality rate corrected by the number of total births (including term and postterm births) of whole region (R2, ‰) = GA-specific mortality rate × prevalenceof each GA in the total births = (number of deaths of each GA stratum / thenumber of total births [59,245]) × 1000. For definition of all-death see Table 1legends, note 61. Prevalences of each GA in the total births (‰) = (number of births of eachGA stratum / the number of total births) × 10002. R1, calculated by number of neonatal deaths of each GA stratum divided bynumber of livebirths in the same GA stratum3. R2, calculated by number of neonatal deaths of each GA stratum divided bythe number of livebirths (including term and post term births) of wholeregion (59,056)
Fig. 2 The all-death rate, perinatal mortality rate, neonatal mortality rate and in-hospital death rate and corresponding 95% confidence interval byeach gestational age. Legends: For definitions of death rates, see Table 1 footnotes
Guo et al. BMC Pregnancy and Childbirth (2021) 21:291 Page 6 of 12
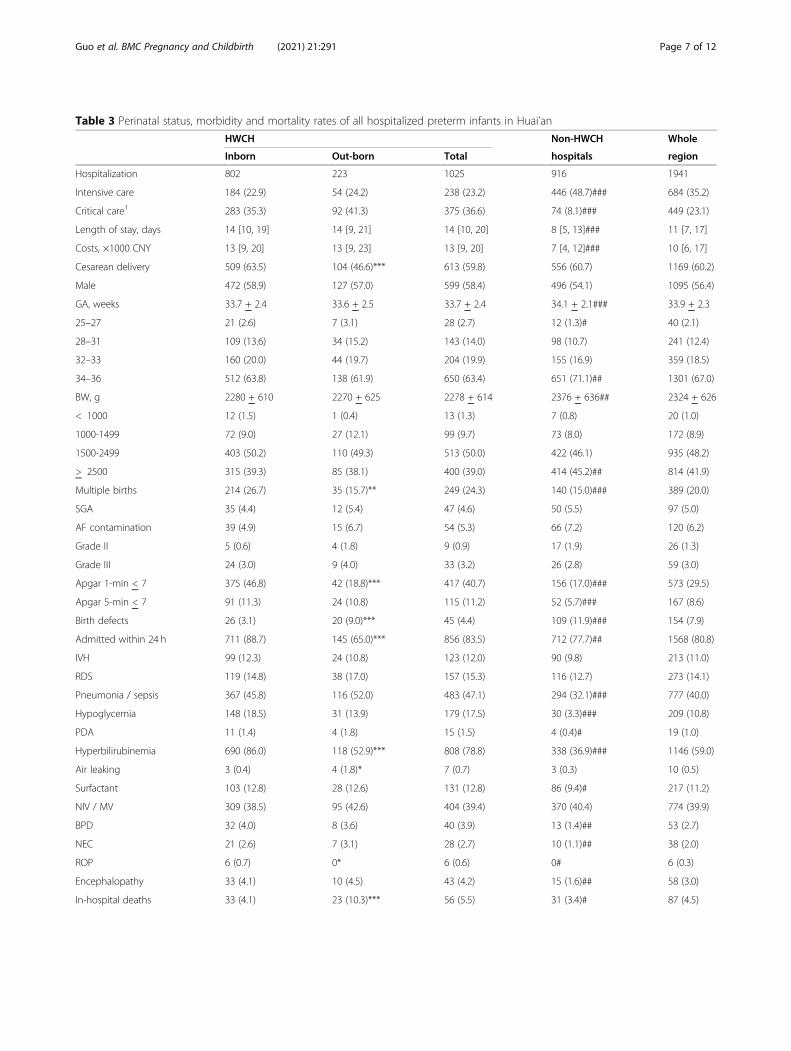
Table 3 Perinatal status, morbidity and mortality rates of all hospitalized preterm infants in Huai’an
HWCH Non-HWCH Whole
Inborn Out-born Total hospitals region
Hospitalization 802 223 1025 916 1941
Intensive care 184 (22.9) 54 (24.2) 238 (23.2) 446 (48.7)### 684 (35.2)
Critical care1 283 (35.3) 92 (41.3) 375 (36.6) 74 (8.1)### 449 (23.1)
Length of stay, days 14 [10, 19] 14 [9, 21] 14 [10, 20] 8 [5, 13]### 11 [7, 17]
Costs, ×1000 CNY 13 [9, 20] 13 [9, 23] 13 [9, 20] 7 [4, 12]### 10 [6, 17]
Cesarean delivery 509 (63.5) 104 (46.6)*** 613 (59.8) 556 (60.7) 1169 (60.2)
Male 472 (58.9) 127 (57.0) 599 (58.4) 496 (54.1) 1095 (56.4)
GA, weeks 33.7 + 2.4 33.6 + 2.5 33.7 + 2.4 34.1 + 2.1### 33.9 + 2.3
25–27 21 (2.6) 7 (3.1) 28 (2.7) 12 (1.3)# 40 (2.1)
28–31 109 (13.6) 34 (15.2) 143 (14.0) 98 (10.7) 241 (12.4)
32–33 160 (20.0) 44 (19.7) 204 (19.9) 155 (16.9) 359 (18.5)
34–36 512 (63.8) 138 (61.9) 650 (63.4) 651 (71.1)## 1301 (67.0)
BW, g 2280 + 610 2270 + 625 2278 + 614 2376 + 636## 2324 + 626
< 1000 12 (1.5) 1 (0.4) 13 (1.3) 7 (0.8) 20 (1.0)
1000-1499 72 (9.0) 27 (12.1) 99 (9.7) 73 (8.0) 172 (8.9)
1500-2499 403 (50.2) 110 (49.3) 513 (50.0) 422 (46.1) 935 (48.2)
> 2500 315 (39.3) 85 (38.1) 400 (39.0) 414 (45.2)## 814 (41.9)
Multiple births 214 (26.7) 35 (15.7)** 249 (24.3) 140 (15.0)### 389 (20.0)
SGA 35 (4.4) 12 (5.4) 47 (4.6) 50 (5.5) 97 (5.0)
AF contamination 39 (4.9) 15 (6.7) 54 (5.3) 66 (7.2) 120 (6.2)
Grade II 5 (0.6) 4 (1.8) 9 (0.9) 17 (1.9) 26 (1.3)
Grade III 24 (3.0) 9 (4.0) 33 (3.2) 26 (2.8) 59 (3.0)
Apgar 1-min < 7 375 (46.8) 42 (18.8)*** 417 (40.7) 156 (17.0)### 573 (29.5)
Apgar 5-min < 7 91 (11.3) 24 (10.8) 115 (11.2) 52 (5.7)### 167 (8.6)
Birth defects 26 (3.1) 20 (9.0)*** 45 (4.4) 109 (11.9)### 154 (7.9)
Admitted within 24 h 711 (88.7) 145 (65.0)*** 856 (83.5) 712 (77.7)## 1568 (80.8)
IVH 99 (12.3) 24 (10.8) 123 (12.0) 90 (9.8) 213 (11.0)
RDS 119 (14.8) 38 (17.0) 157 (15.3) 116 (12.7) 273 (14.1)
Pneumonia / sepsis 367 (45.8) 116 (52.0) 483 (47.1) 294 (32.1)### 777 (40.0)
Hypoglycemia 148 (18.5) 31 (13.9) 179 (17.5) 30 (3.3)### 209 (10.8)
PDA 11 (1.4) 4 (1.8) 15 (1.5) 4 (0.4)# 19 (1.0)
Hyperbilirubinemia 690 (86.0) 118 (52.9)*** 808 (78.8) 338 (36.9)### 1146 (59.0)
Air leaking 3 (0.4) 4 (1.8)* 7 (0.7) 3 (0.3) 10 (0.5)
Surfactant 103 (12.8) 28 (12.6) 131 (12.8) 86 (9.4)# 217 (11.2)
NIV / MV 309 (38.5) 95 (42.6) 404 (39.4) 370 (40.4) 774 (39.9)
BPD 32 (4.0) 8 (3.6) 40 (3.9) 13 (1.4)## 53 (2.7)
NEC 21 (2.6) 7 (3.1) 28 (2.7) 10 (1.1)## 38 (2.0)
ROP 6 (0.7) 0* 6 (0.6) 0# 6 (0.3)
Encephalopathy 33 (4.1) 10 (4.5) 43 (4.2) 15 (1.6)## 58 (3.0)
In-hospital deaths 33 (4.1) 23 (10.3)*** 56 (5.5) 31 (3.4)# 87 (4.5)
Guo et al. BMC Pregnancy and Childbirth (2021) 21:291 Page 7 of 12
45]. As a result, we speculate that our understanding onthe preterm birth status in China, either nation-wide orprovince-wide, would have substantial negligence, errorand bias in terms of source and representativeness ofdata and database. We assumed that the Huai’an regionrepresented the national average level of socioeconomicand healthcare status, and it may reflect the actualperinatal-neonatal healthcare style and quality in one-fourth of sub-provincial prefectural regions in China.Our data showed approximately 4.5% of preterm birthrate and 10% preterm mortality rate. This may be trans-lated into annually 650,000 preterm births and 65,000deaths in China. The concept, methodology and data fileof the current study may be generalizable to other re-gions, and served as a benchmark for future large-scalestudies to explore perinatal-neonatal healthcare qualityimprovement, especially in the care of VPT and EPTpopulation.The prevalence of EPT (25–27 weeks of GA, 1.4‰ of
total births, Table 2) was first reported from birthpopulation-based survey data from China [11, 20], andwas markedly lower than the 3–5‰ of total births in de-veloped countries [3–9]. Despite the benefits providedby the universal health insurance policy for hospitalizeddelivery, especially for families with lower socioeconomicstatus, it remains controversial whether active prenataland peripartum management including aggressive resus-citation at delivery, and neonatal critical care, should beprovided to EPT in emerging regions in China. Asdeaths in livebirths below 28-week GA may be registeredas abortion or stillbirth [19], or as neonatal death onlyafter 7th of PND (unpublished domestic recommenda-tion for birth registry since 2018), it can cause potentialbias on vital statistics of the incidence/prevalence andoutcome of preterm births and mortalities [7, 17, 18],
leading to inaccurate estimation of the quality improve-ment of perinatal-neonatal care.The comparison of preterm outcome between HWCH
and non-HWCH admissions shed light on the role ofmain transferal centers in regional perinatal-neonatalnetwork. As revealed in Tables 1 and 3, HWCH treateda disproportionally large part of high-risk pregnancies inthe Huai’an region [20], and admitted more extremelyand very preterm infants requiring critical care thanother regional institutions. It implies a generous and ef-fective in-utero transport policy taking place. It also sup-ports a central role of HWCH in the regional perinatal-neonatal healthcare, and indicates that investigation ofthe leading centers may help to understand theperinatal-neonatal healthcare at the regional level. Ofnote, the vast sub-provincial prefectural regions in Chinaare estimated to account for more than 80% of annualnational births (of 15–17 millions in 2014–2019). Theinter-institutional difference in infrastructure should benarrowed with recent socioeconomic development, butquality of maternal-neonatal healthcare remains to varywidely. By including all birth data from level I-III institu-tions in the whole region of Huai’an [11, 20], our studyhas overcome the limitations encountered in previousreports of vital statistics which often failed to accountfor prevalence and outcome of very and extreme pre-term births [6, 17–19]. Based on the earlier nationwidecollaborative studies, the quality of perinatal-neonatalhealthcare at HWCH is likely to be above the nationalaverage level [11, 20, 42, 43] and the data file of outcomemay be referred to for future inter-regional comparisonto validate.There was a trend that those with high or moderate risk
of death by univariable regression analysis tended to havemild or no risk by multivariable Poisson regression model
Table 3 Perinatal status, morbidity and mortality rates of all hospitalized preterm infants in Huai’an (Continued)
HWCH Non-HWCH Whole
Inborn Out-born Total hospitals region
By postnatal days
0–6 20 (2.5) 15 (6.7)** 35 (3.4) 22 (2.4) 57 (2.9)
7–27 10 (1.2) 5 (2.2) 15 (1.5) 8 (0.9)# 23 (1.2)
> 28 3 (0.4) 3 (1.3) 6 (0.6) 1 (0.1) 7 (0.4)
By GA weeks
25–27 8 (1.0) 5 (2.2) 13 (1.3) 9 (1.0) 22 (1.1)
28–31 15 (1.9) 10 (4.5)* 25 (2.4) 13 (1.4) 38 (2.0)
32–33 6 (0.7) 3 (1.3) 9 (0.9) 3 (0.3) 12 (0.6)
34–36 4 (0.5) 5 (2.2)* 9 (0.9) 6 (0.7) 15 (0.8)
Abbreviations: CNY, Chinese Yuan (RMB); IVH, intraventricular hemorrhage; RDS, respiratory distress syndrome; PDA, patent ductus arteriosus; NIV / MV, non-invasive ventilation / mechanical ventilation; BPD, bronchopulmonary dysplasia; NEC, necrotizing enterocolitis; ROP, retinopathy of prematurity. Values are givenas n, n (%), means + SD or median [interquartile ranges]. Percentage (%) refers to number of total hospitalization in respective columns. * P < 0.05, ** P < 0.01 and*** P < 0.001 for out-born vs. inborn of HWCH. # P < 0.05, ## P < 0.01 and ### P < 0.001 for non-HWCH vs. total of HWCH. For other definitions and abbreviationssee Table 1 legends as reference1. For definition of critical care see additional file 1
Guo et al. BMC Pregnancy and Childbirth (2021) 21:291 Page 8 of 12
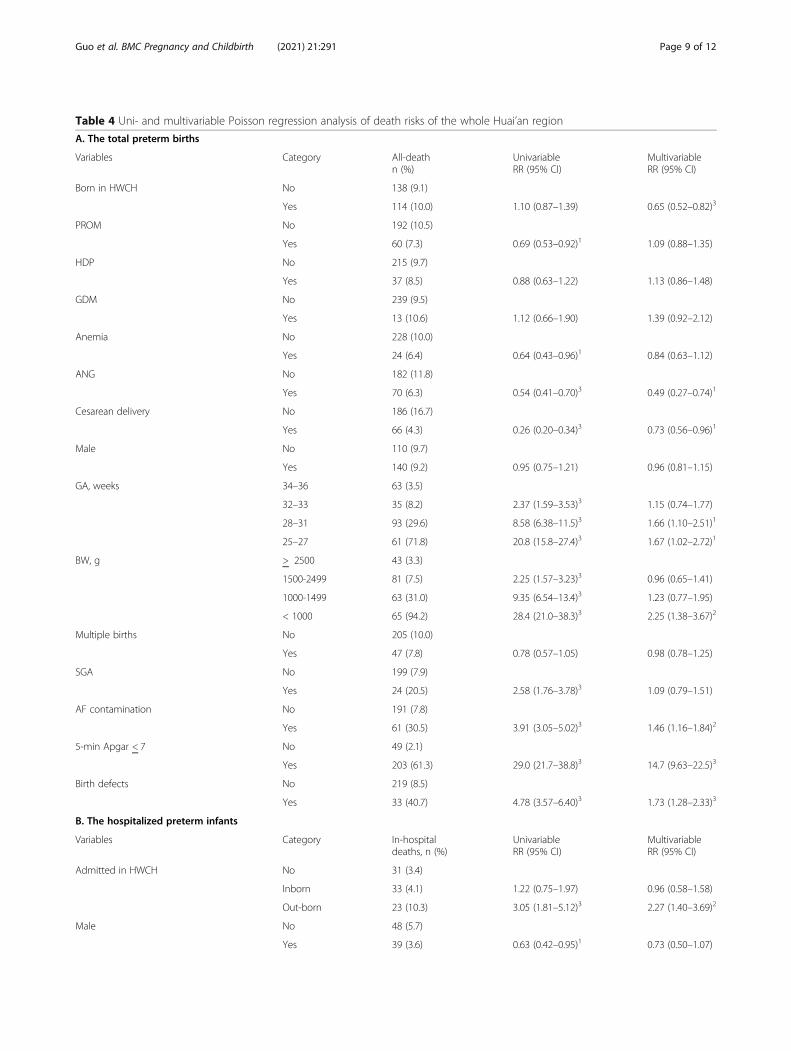
Table 4 Uni- and multivariable Poisson regression analysis of death risks of the whole Huai’an region
A. The total preterm births
Variables Category All-deathn (%)
UnivariableRR (95% CI)
MultivariableRR (95% CI)
Born in HWCH No 138 (9.1)
Yes 114 (10.0) 1.10 (0.87–1.39) 0.65 (0.52–0.82)3
PROM No 192 (10.5)
Yes 60 (7.3) 0.69 (0.53–0.92)1 1.09 (0.88–1.35)
HDP No 215 (9.7)
Yes 37 (8.5) 0.88 (0.63–1.22) 1.13 (0.86–1.48)
GDM No 239 (9.5)
Yes 13 (10.6) 1.12 (0.66–1.90) 1.39 (0.92–2.12)
Anemia No 228 (10.0)
Yes 24 (6.4) 0.64 (0.43–0.96)1 0.84 (0.63–1.12)
ANG No 182 (11.8)
Yes 70 (6.3) 0.54 (0.41–0.70)3 0.49 (0.27–0.74)1
Cesarean delivery No 186 (16.7)
Yes 66 (4.3) 0.26 (0.20–0.34)3 0.73 (0.56–0.96)1
Male No 110 (9.7)
Yes 140 (9.2) 0.95 (0.75–1.21) 0.96 (0.81–1.15)
GA, weeks 34–36 63 (3.5)
32–33 35 (8.2) 2.37 (1.59–3.53)3 1.15 (0.74–1.77)
28–31 93 (29.6) 8.58 (6.38–11.5)3 1.66 (1.10–2.51)1
25–27 61 (71.8) 20.8 (15.8–27.4)3 1.67 (1.02–2.72)1
BW, g > 2500 43 (3.3)
1500-2499 81 (7.5) 2.25 (1.57–3.23)3 0.96 (0.65–1.41)
1000-1499 63 (31.0) 9.35 (6.54–13.4)3 1.23 (0.77–1.95)
< 1000 65 (94.2) 28.4 (21.0–38.3)3 2.25 (1.38–3.67)2
Multiple births No 205 (10.0)
Yes 47 (7.8) 0.78 (0.57–1.05) 0.98 (0.78–1.25)
SGA No 199 (7.9)
Yes 24 (20.5) 2.58 (1.76–3.78)3 1.09 (0.79–1.51)
AF contamination No 191 (7.8)
Yes 61 (30.5) 3.91 (3.05–5.02)3 1.46 (1.16–1.84)2
5-min Apgar < 7 No 49 (2.1)
Yes 203 (61.3) 29.0 (21.7–38.8)3 14.7 (9.63–22.5)3
Birth defects No 219 (8.5)
Yes 33 (40.7) 4.78 (3.57–6.40)3 1.73 (1.28–2.33)3
B. The hospitalized preterm infants
Variables Category In-hospitaldeaths, n (%)
UnivariableRR (95% CI)
MultivariableRR (95% CI)
Admitted in HWCH No 31 (3.4)
Inborn 33 (4.1) 1.22 (0.75–1.97) 0.96 (0.58–1.58)
Out-born 23 (10.3) 3.05 (1.81–5.12)3 2.27 (1.40–3.69)2
Male No 48 (5.7)
Yes 39 (3.6) 0.63 (0.42–0.95)1 0.73 (0.50–1.07)
Guo et al. BMC Pregnancy and Childbirth (2021) 21:291 Page 9 of 12
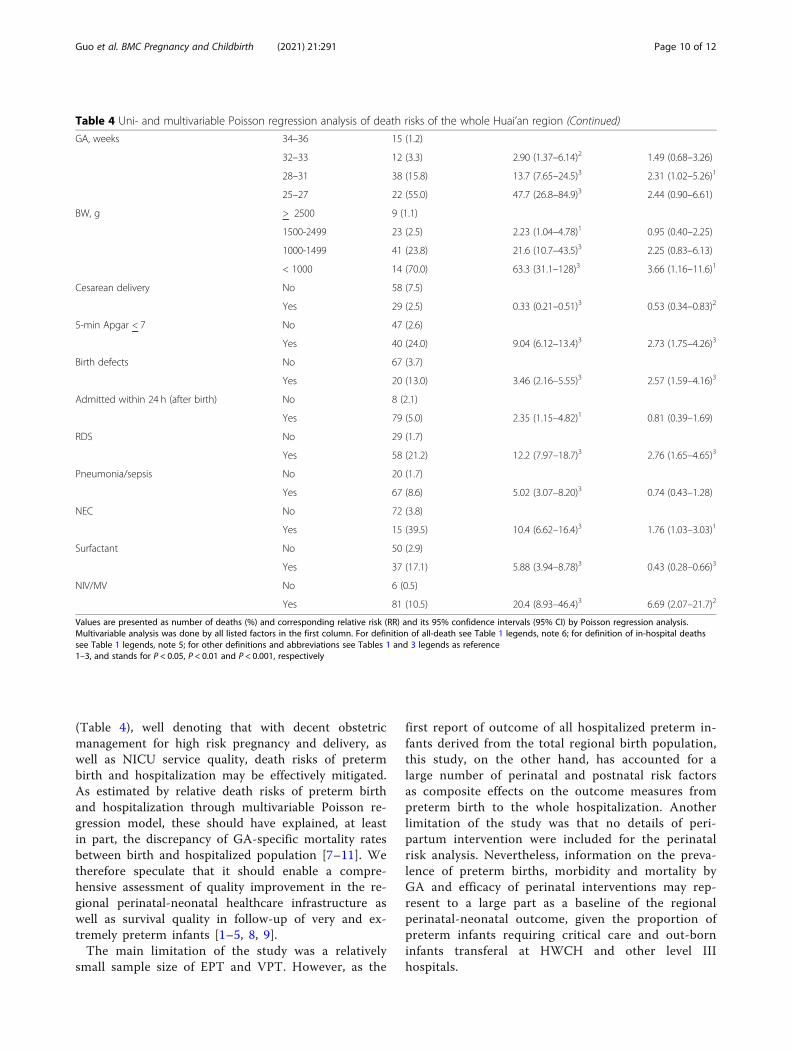
(Table 4), well denoting that with decent obstetricmanagement for high risk pregnancy and delivery, aswell as NICU service quality, death risks of pretermbirth and hospitalization may be effectively mitigated.As estimated by relative death risks of preterm birthand hospitalization through multivariable Poisson re-gression model, these should have explained, at leastin part, the discrepancy of GA-specific mortality ratesbetween birth and hospitalized population [7–11]. Wetherefore speculate that it should enable a compre-hensive assessment of quality improvement in the re-gional perinatal-neonatal healthcare infrastructure aswell as survival quality in follow-up of very and ex-tremely preterm infants [1–5, 8, 9].The main limitation of the study was a relatively
small sample size of EPT and VPT. However, as the
first report of outcome of all hospitalized preterm in-fants derived from the total regional birth population,this study, on the other hand, has accounted for alarge number of perinatal and postnatal risk factorsas composite effects on the outcome measures frompreterm birth to the whole hospitalization. Anotherlimitation of the study was that no details of peri-partum intervention were included for the perinatalrisk analysis. Nevertheless, information on the preva-lence of preterm births, morbidity and mortality byGA and efficacy of perinatal interventions may rep-resent to a large part as a baseline of the regionalperinatal-neonatal outcome, given the proportion ofpreterm infants requiring critical care and out-borninfants transferal at HWCH and other level IIIhospitals.
Table 4 Uni- and multivariable Poisson regression analysis of death risks of the whole Huai’an region (Continued)
GA, weeks 34–36 15 (1.2)
32–33 12 (3.3) 2.90 (1.37–6.14)2 1.49 (0.68–3.26)
28–31 38 (15.8) 13.7 (7.65–24.5)3 2.31 (1.02–5.26)1
25–27 22 (55.0) 47.7 (26.8–84.9)3 2.44 (0.90–6.61)
BW, g > 2500 9 (1.1)
1500-2499 23 (2.5) 2.23 (1.04–4.78)1 0.95 (0.40–2.25)
1000-1499 41 (23.8) 21.6 (10.7–43.5)3 2.25 (0.83–6.13)
< 1000 14 (70.0) 63.3 (31.1–128)3 3.66 (1.16–11.6)1
Cesarean delivery No 58 (7.5)
Yes 29 (2.5) 0.33 (0.21–0.51)3 0.53 (0.34–0.83)2
5-min Apgar < 7 No 47 (2.6)
Yes 40 (24.0) 9.04 (6.12–13.4)3 2.73 (1.75–4.26)3
Birth defects No 67 (3.7)
Yes 20 (13.0) 3.46 (2.16–5.55)3 2.57 (1.59–4.16)3
Admitted within 24 h (after birth) No 8 (2.1)
Yes 79 (5.0) 2.35 (1.15–4.82)1 0.81 (0.39–1.69)
RDS No 29 (1.7)
Yes 58 (21.2) 12.2 (7.97–18.7)3 2.76 (1.65–4.65)3
Pneumonia/sepsis No 20 (1.7)
Yes 67 (8.6) 5.02 (3.07–8.20)3 0.74 (0.43–1.28)
NEC No 72 (3.8)
Yes 15 (39.5) 10.4 (6.62–16.4)3 1.76 (1.03–3.03)1
Surfactant No 50 (2.9)
Yes 37 (17.1) 5.88 (3.94–8.78)3 0.43 (0.28–0.66)3
NIV/MV No 6 (0.5)
Yes 81 (10.5) 20.4 (8.93–46.4)3 6.69 (2.07–21.7)2
Values are presented as number of deaths (%) and corresponding relative risk (RR) and its 95% confidence intervals (95% CI) by Poisson regression analysis.Multivariable analysis was done by all listed factors in the first column. For definition of all-death see Table 1 legends, note 6; for definition of in-hospital deathssee Table 1 legends, note 5; for other definitions and abbreviations see Tables 1 and 3 legends as reference1–3, and stands for P < 0.05, P < 0.01 and P < 0.001, respectively
Guo et al. BMC Pregnancy and Childbirth (2021) 21:291 Page 10 of 12
ConclusionIn conclusion, the prevalence of preterm birth andhospitalization based morbidity and mortality by GAstrata or hospital categories, as characterized for bothHWCH and non-HWCH, reflected the baseline andquality of healthcare status of regional network, repre-senting the perinatal-neonatal healthcare in emerging re-gions. The concept and protocol of the study should befeasible to other regions of China and beyond to gaincomprehensive understanding in the world-wide cam-paign for prevention of preterm birth.
AbbreviationsaPMA: adjusted post menstrual age; BD: birth defects;BPD: bronchopulmonary dysplasia; BW: birth weight; DR: delivery room;EPT: extreme preterm; GA: gestational age; HWCH: Huai’an Women andChildren’s Hospital; LPT: late preterm; MPT: moderate preterm;MV: mechanical ventilation; NICU: neonatal intensive care unit; NIV: non-invasive ventilation; PND: postnatal day(s); RDS: respiratory distress syndrome;VPT: very preterm
Supplementary InformationThe online version contains supplementary material available at https://doi.org/10.1186/s12884-021-03726-4.
Additional file 1. Definitions of pregnancy and perinatal co-morbiditiesand complications and standard of care at admission and duringhospitalization of preterm infants.
Additional file 2. A full list of members and their affiliations of Huai’anPerinatal-Neonatal study group.
Additional file 3: Table S1. Crude and gestational age-adjusted oddsratio (OR) of death risks of the whole Huai’an region.
AcknowledgementsThe authors thank all the committed staffs from member hospitals, as well asthose at township hospitals and health care services, of the Huai’anPerinatal-Neonatal Study Group for generous participation and support ofthe study. Contribution of Drs. Y. Xu, MD and S. Luo, MD from Children’sHospital of Fudan University in data collection is highly appreciated. Dr.Guoyou Qin from the Department of Biostatistics, School of Public Health ofFudan University has reviewed all the data analysis and presentation, towhich the authors are very grateful.
Authors’ contributionsXG executed the study protocol, data collection and analysis, drafted andrevised manuscript. XL and ZP supervised and validated clinical datacollection and analysis, and reviewed manuscript. TQ, XZ and HW carried outdata collection and analysis, and reviewed manuscript. YD engaged in dataanalysis, and critically revised manuscript. HY conceptualized and designedthe study, coordinated and supervised data collection and analysis, andcritically revised manuscript. BS conceptualized and designed the study,supervised data analysis, and critically revised manuscript. All authorsapproved the final manuscript as submitted and agree to be accountable forrespective aspects of the work.
FundingSupported by grants from the Project of Maternal and Child Health Care byJiangsu Provincial Commission of Health (F201402 [Yue H]), the NationalNatural Science Foundation (No. 81501288 [Dong Y]) and ShanghaiMunicipal Commission of Health (Project Young Physician Investigator [DongY]). The funding body had no influence on the design of the study,collection, analysis, and interpretation of data, and in writing the manuscript.
Availability of data and materialsThe datasets used and/or analyzed during the current study are availablefrom the corresponding author on reasonable request.
Declarations
Ethics approval and consent to participateThe ethics committee of Children’s Hospital of Fudan University approvedthe study design and protocol, and waived the need for consent (#2019–194). This approval was adopted and approved by Huai’an Women andChildren’s Hospital and all participated hospitals in accordance with theChinese regulations for clinical practice and investigation (www.nhc.gov.cn).The permissions and the names of the ethics committees and scientificcommittees (institutional review board) of the major participating hospitalsare referred to Zhu X, et al. BMC Pregnancy Childbirth. 2019; 19(1): 224.
Consent for publicationNot applicable.
Competing interestsAll the authors have declared no any financial and non-financial competinginterests to disclose.
Author details1The NCH Key Laboratory of Neonatal Diseases, National Children’s MedicalCenter, Children’s Hospital of Fudan University, Shanghai 201102, China.2Department of Obstetrics, Huai’an Women and Children’s Hospital, Huai’an223002, Jiangsu, China. 3Department of Neonatology and Unit of PopulationHealth Information, Huai’an Women and Children’s Hospital, 104 South RenMin Road, Huai’an 223002, Jiangsu, China. 4Unit of Population HealthInformation, Huai’an Women and Children’s Hospital, Huai’an 223002,Jiangsu, China.
Received: 16 August 2020 Accepted: 17 March 2021
References1. Costeloe KL, Hennessy EM, Haider S, Stacey F, Marlow N, Draper ES. Short
term outcomes after extreme preterm birth in England: comparison of twobirth cohorts in 1995 and 2006 (the EPICure studies). BMJ. 2012;345(dec043):e7976. https://doi.org/10.1136/bmj.e7976.
2. Ancel PY, Goffinet F, EPIPAGE-2 Writing Group, Kuhn P, Langer B, Matis J,et al. Survival and morbidity of preterm children born at 22 through 34weeks’ gestation in France in 2011: Results of the EPIPAGE-2 cohort study.JAMA Pediatr. 2015;169(3):230–8.
3. Norman M, Hallberg B, Abrahamsson T, Björklund LJ, Domellöf M, Farooqi A,et al. Association between year of birth and 1-year survival amongextremely preterm infants in Sweden during 2004-2007 and 2014-2016.JAMA. 2019;321(12):1188–99. https://doi.org/10.1001/jama.2019.2021.
4. Bolisetty S, Legge N, Bajuk B, Lui K, New South Wales and the AustralianCapital Territory neonatal intensive care Units' data collection. Preterminfant outcomes in New South Wales and the Australian Capital Territory. JPaediatr Child Health. 2015;51(7):713–21. https://doi.org/10.1111/jpc.12848.
5. Helenius K, Sjörs G, Shah PS, Modi N, Reichman B, Morisaki N, et al. Survivalin very preterm infants: an international comparison of 10 national neonatalnetworks. Pediatrics 2017; 140 (6). pii: e20171264.
6. He C, Liu L, Chu Y, Perin J, Dai L, Li X, et al. National and subnational all-causeand cause-specific child mortality in China, 1996-2015: a systematic analysiswith implications for the sustainable development goals. Lancet Glob Health.2017;5(2):e186–97. https://doi.org/10.1016/S2214-109X(16)30334-5.
7. Manuck TA, Rice MM, Bailit JL, Grobman WA, Reddy UM, Wapner RJ, et al.Preterm neonatal morbidity and mortality by gestational age: Acontemporary cohort. Am J Obstet Gynecol. 2016;215(1):103.e1–e14.
8. Stoll BJ, Hansen NI, Bell EF, Shankaran S, Laptook AR, Walsh MC, et al.Neonatal outcomes of extremely preterm infants from the NICHD neonatalresearch network. Pediatrics. 2010;126(3):443–56. https://doi.org/10.1542/peds.2009-2959.
9. Haumont D, Modi N, Saugstad OD, Antetere R, NguyenBa C, Turner M, et al.Evaluating preterm care across Europe using the eNewborn European networkdatabase. Pediatr Res. 2020;88(3):484–95. https://doi.org/10.1038/s41390-020-0769-x.
Guo et al. BMC Pregnancy and Childbirth (2021) 21:291 Page 11 of 12
10. Sun L, Yue H, Sun B, Han L, Qi M, Tian Z, et al. Estimation of birthpopulation-based perinatal-neonatal mortality and preterm rate in Chinafrom a regional survey in 2010. J Matern-Fetal Neonat Med. 2013;26(16):1641–8. https://doi.org/10.3109/14767058.2013.794208.
11. Wang H, Yue H, Sun B, Zhu X, Niu H, Qi T, et al. Birth population survey inHuai’an in 2015: perinatal-neonatal mortality and preterm birth rate inemerging regions in China. J Matern-Fetal Neonatal Med. 2020;33(5):838–46.https://doi.org/10.1080/14767058.2018.1506439.
12. Sun B, Shao X, Cao Y, Xia S, Yue H. Neonatal-perinatal medicine in atransitional period in China. Arch Dis Child Fetal Neonatal Ed. 2013;98(5):F440–4. https://doi.org/10.1136/archdischild-2012-302524.
13. Li HT, Xue M, Hellerstein S, Cai Y, Gao Y, Zhang Y, et al. Association ofChina's universal two child policy with changes in births and birth relatedhealth factors: national, descriptive comparative study. BMJ. 2019;366:l4680.
14. Roberts D, Brown J, Medley N, Dalziel SR. Antenatal corticosteroids foraccelerating fetal lung maturation for women at risk of preterm birth.Cochrane Database Syst Rev. 2017;3:CD004454.
15. Travers CP, Carlo WA, McDonald SA, Das A, Bell EF, Ambalavanan N, et al.Mortality and pulmonary outcomes of extremely preterm infants exposedto antenatal corticosteroids. Am J Obstet Gynacol. 2018;218(1):130 e1–e13.
16. Althabe F, Belizán JM, McClure EM, Hemingway-Foday J, Berrueta M,Mazzoni A, et al. A population-based, multifaceted strategy to implementantenatal corticosteroid treatment versus standard care for the reduction ofneonatal mortality due to preterm birth in low-income and middle-incomecountries: the ACT cluster-randomised trial. Lancet. 2015;385(9968):629–39.https://doi.org/10.1016/S0140-6736(14)61651-2.
17. Feng XL, Guo SF, Hipgrave D, Zhu J, Zhang L, Song L, et al. China’s facility-based birth strategy and neonatal mortality: a population-basedepidemiological study. Lancet. 2011;378(9801):1493–500. https://doi.org/10.1016/S0140-6736(11)61096-9.
18. Liang J, Mao M, Dai L, Li X, Miao L, Li Q, et al. Neonatal mortality due to pretermbirth at 28–36 weeks’ gestation in China, 2003–2008. Paediatr Perinat Epidemiol.2011;25(6):593–600. https://doi.org/10.1111/j.1365-3016.2011.01232.x.
19. Zhu J, Liang J, Mu Y, Li X, Guo S, Scherpbier R, et al. Sociodemographic andobstetric characteristics of stillbirths in China: A census of nearly 4 million healthfacility births between 2012 and 2014. Lancet Global Health. 2016;4(2):e109–18.
20. Zhu X, Niu H, Wang H, Li X, Qi T, Ding W, et al. High risk pregnancyassociated perinatal morbidity and mortality: a second birth population-based survey in Huai'an in 2015. BMC Pregnancy Childbirth. 2019;19(1):224.https://doi.org/10.1186/s12884-019-2323-6.
21. World Health Organization. Born too soon: the global action report onpreterm birth. Geneva. 2012:5.
22. Engle WA. A recommendation for the definition of "late preterm" (near-term) and the birth weight-gestational age classification system. SeminPerinatol. 2006;30(1):2–7. https://doi.org/10.1053/j.semperi.2006.01.007.
23. Committee on Practice. ACOG Practice Bulletin No. 188: Prelabor rupture ofmembranes. Obstet Gynecol. 2018;131(1):e1–e14. https://doi.org/10.1097/AOG.0000000000002455.
24. Committee on Practice. ACOG Practice Bulletin No. 202: gestationalhypertension and preeclampsia. Obstet Gynecol. 2019;133(1):e1–e25.
25. Committee on Practice. ACOG Practice Bulletin No. 190: gestational diabetesmellitus. Obstet Gynecol. 2018;131(2):e49–64. https://doi.org/10.1097/AOG.0000000000002501.
26. Sun D, McLeod A, Gandhi S, Malinowski AK, Shehata N. Anemia inpregnancy: a pragmatic approach. Obstet Gynecol Surv. 2017;72(12):730–7.https://doi.org/10.1097/OGX.0000000000000510.
27. Dorner RA, Burton VJ, Allen MC, Robinson S, Soares BP. Preterm neuroimagingand neurodevelopmental outcome: a focus on intraventricular hemorrhage,post-hemorrhagic hydrocephalus, and associated brain injury. J Perinatol. 2018;38(11):1431–43. https://doi.org/10.1038/s41372-018-0209-5.
28. Sweet DG, Carnielli V, Greisen G, Hallman M, Ozek E, Plavka R, et al.European consensus guidelines on the management of neonatal respiratorydistress syndrome in preterm infants-2013 update. Neonatology. 2013;103(4):353–68. https://doi.org/10.1159/000349928.
29. Committee on Fetus and Newborn, Adamkin DH. Postnatal glucosehomeostasis in late-preterm and term infants. Pediatrics. 2011;127(3):575–9.https://doi.org/10.1542/peds.2010-3851.
30. American Academy of Pediatrics Subcommittee on Hyperbilirubinemia.Management of hyperbilirubinemia in the newborn infant 35 or more weeks ofgestation. Pediatrics. 2004;114(1):297–316. https://doi.org/10.1542/peds.114.1.297.
31. Jobe AH, Bancalari E. Bronchopulmonary dysplasia. Am J Respir Crit CareMed. 2001;163(7):1723–9. https://doi.org/10.1164/ajrccm.163.7.2011060.
32. Bell MJ, Ternberg JL, Feigin RD, Keating JP, Marshall R, Barton L, et al.Neonatal necrotizing enterocolitis. Therapeutic decisions based uponclinical staging. Ann Surg. 1978;187(1):1–7. https://doi.org/10.1097/00000658-197801000-00001.
33. Fierson WM, American Academy of Pediatrics Section on Ophthalmology,American Academy of Ophthalmology, American Association for PediatricOphthalmology and Strabismus, American Association of CertifiedOrthoptists. Screening examination of premature infants for retinopathy ofprematurity. Pediatrics. 2018;142(6):e20183061.
34. Parikh P, Juul SE. Neuroprotection strategies in preterm encephalopathy. SeminPediatr Neurol. 2019;32:100772. https://doi.org/10.1016/j.spen.2019.08.008.
35. World Health Organization. International statistical classification of diseaseand related health problems. 10th revision (ICD-10), Geneva 1993.
36. Ballard JL, Khoury JC, Wedig K, Wang L, Eilers-Walsman BL, Lipp R. NewBallard Score, expanded to include extremely premature infants. J Pediatr.1991;119(3):417–23.
37. Fenton TR, Kim JH. A systematic review and meta-analysis to revise theFenton growth chart for preterm infants. BMC Pediatr. 2013;13(1):59. https://doi.org/10.1186/1471-2431-13-59.
38. Smithhart W, Wyckoff MH, Kapadia V, Jaleel M, Kakkilaya V, Brown LS, et al.Delivery room continuous positive airway pressure and pneumothorax.Pediatrics 2019; 144 (3). pii: e20190756.
39. Dargaville PA, Gerber A, Johansson S, De Paoli AG, Kamlin CO, Orsini F, et al.Incidence and outcome of CPAP failure in preterm infants. Pediatrics. 2016;138(1):e20153985. https://doi.org/10.1542/peds.2015-3985.
40. Gordis L. Mortality rates in: epidemiology 5th edition. Philadelphia: ElsevierSaunders; 2013. p. 64–5.
41. Callaghan WM, MacDorman MF, Shapiro-Mendoza CK, Barfield WD.Explaining the recent decrease in US infant mortality rate, 2007–2013. Am JObstet Gynacol. 2017;216(1):73.e1–8.
42. Wang H, Gao X, Liu C, Yan C, Lin X, Yang C, et al. Morbidity and mortality ofneonatal respiratory failure in China. Surfactant treatment in very immatureinfants. Pediatrics. 2012;129(3):e731–40. https://doi.org/10.1542/peds.2011-0725.
43. Wang H, Gao X, Liu C, Yan C, Lin X, Dong Y, et al. Surfactant reduced themortality of neonates with birth weight >1500 g and hypoxemic respiratoryfailure: a survey from an emerging NICU network. J Perinatol. 2017;36:883–9.
44. Kong X, Xu F, Wu R, Wu H, Ju R, Zhao X, et al. Neonatal mortality andmorbidity among infants between 24 to 31 complete weeks: a multicentersurvey in China from 2013 to 2014. BMC Pediatr. 2016;16(1):174. https://doi.org/10.1186/s12887-016-0716-5.
45. Wu F, Liu G, Feng Z, Tan X, Yang C, Ye X, et al. Short-term outcomes ofextremely preterm infants at discharge: a multicenter study fromGuangdong province during 2008-2017. BMC Pediatr. 2019;19(1):405.https://doi.org/10.1186/s12887-019-1736-8.
Publisher’s NoteSpringer Nature remains neutral with regard to jurisdictional claims inpublished maps and institutional affiliations.
Guo et al. BMC Pregnancy and Childbirth (2021) 21:291 Page 12 of 12