Embed Size (px)
Citation preview
Issues and facts related to the charitable purposes of our hospitals and the protection of Montana’s consumers
Fourth Annual Report Montana Attorney General Steve Bullock
MONTANA OFFICE OF CONSUMER PROTECTION
By Lawrence L. White, Jr., MHA, FACHE | Anna Iverson Buckner, MA, MPHSchool of Public and Community Health Sciences, The University of Montana
Montana’s Hospitals
2011

ATTORNEY GENERAL STATE OF MONTANA
Steve Bullock Department of Justice Attorney General 215 North Sanders P.O. Box 201401 Helena, MT 59620-1401
September 2011 My office, in cooperation with the School of Public and Community Health Sciences at The University of Montana, is pleased to make the fourth annual Montana’s Hospitals report available to consumers throughout the state. Again this year, I would like to express my thanks to Larry White and his team for pulling together and analyzing the statistical data. The report is an annual assessment of the charitable purposes of the 10 largest nonprofit hospitals and foundations in our state. For the second year, the report also includes information about 12 smaller, critical access hospitals in Montana. All of these 22 nonprofit hospitals are public benefit corporations under Montana law. They exist to serve their communities, not to make a profit. Because of this, they have been given tax exempt status – a status that saves them tens of millions of dollars annually. These hospitals have a duty to provide community benefits to the areas they serve. Charity care – free or discounted services to those with demonstrated financial need – is the most significant community benefit nonprofit hospitals provide. It is in the interest of all hospitals and the communities they serve to ensure that all qualified patients are provided charity care rather than face collection actions on debts they cannot afford to repay, and which the hospital will likely end up writing off as bad debt. As this fourth report shows, charity care continues to increase in Montana, although it still varies widely across hospitals. The large hospitals have increased charity care significantly over the past four years, from a median 1.57% of their budgets in 2006 to 2.79% of their budgets in 2009. Table 4 and Graph 2. As was pointed out last year, Montana’s small hospitals continue to show a lower level of charity care overall, although there was an increase from 1.32% of their budgets in 2008 to 1.59% in 2009. Table 4. While the trend of increasing percentages of overall budgets dedicated to charity care is encouraging, there appears to be room for continued improvement. Montana’s nonprofit hospitals sent accounts totaling more than $122 million to collection in 2009. Appendix 5. While the hospitals properly need to pursue collection efforts in appropriate cases, it is highly likely that many patients whose accounts were turned over to collection could have qualified for charity care at the outset.

Charity care is one of several categories of “community benefits” upon which hospitals’ nonprofit status is justified for purposes of receiving tax exemptions. When all community benefit categories are considered, with only one exception, Montana’s nonprofit hospitals provide benefits that substantially exceed the value of the tax exemptions they receive. Table 7a and Appendix 4. Even when considering charity care costs alone, 8 of the 10 large hospitals and 7 of the 12 small hospitals provide benefits that exceed the value of their tax exemptions. Table 7b. As I pointed out last year, and as this report shows, traditional charity care now amounts to only a fraction of a hospital’s total “community benefits.” Appendix 3. Hospitals should ensure that less specific community benefits are not displacing direct charity care, and that those expenditures classified as “community benefits” are wanted or needed in a particular community. One category of community benefits that warrants specific attention is subsidized services. Seven of the 10 large hospitals spend more on charity care than on subsidized health services. In contrast, three of the large hospitals spend millions more on subsidized health services than they do on charity care. These health services include the acquisition and financial support of medical practices that otherwise would exist in the communities and, therefore, may not properly be considered a “community benefit” according to applicable criteria. Appendix 1 (Community Benefit Definitions). This may be indicative of changes in the health care delivery system that are not unique to Montana. Nevertheless, it has implications with respect to whether the hospitals are truly operating as nonprofit entities. Our nonprofit hospitals are invaluable assets in our communities. They face significant challenges in these difficult economic times, and the services they provide are deserving of recognition and appreciation. The Attorney General is responsible both for monitoring nonprofit corporations and for protecting the interests of those served by a nonprofit corporation. Thus, it is the responsibility of my office to ensure that they continue to perform the charitable purposes for which they were formed. We hope this series of reports will help consumers, community members, hospital administrators, board members, and other stakeholders gain a greater understanding of how our hospitals are performing their charitable purposes. Most sincerely,
Steve Bullock Attorney General
Montana’s Hospitals: Issues and Facts Related to the Charitable Purposes of Our Hospitals and the Protection of Montana Consumers
Fourth Annual Report
Prepared for Montana Attorney General
Steve Bullock
By
Lawrence L. White, Jr., MHA, FACHE
Anna Iverson Buckner, MA, MPH
September 2011
School of Public and Community Health Sciences
The University of Montana
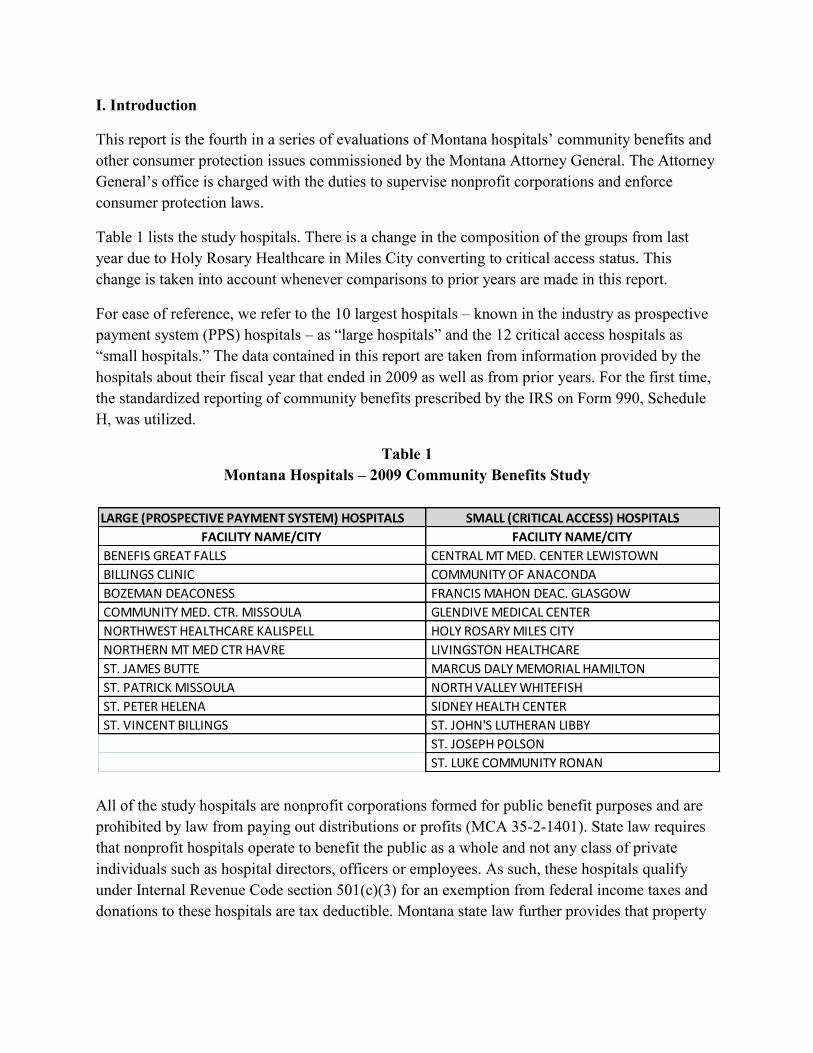
I. Introduction
This report is the fourth in a series of evaluations of Montana hospitals’ community benefits and other consumer protection issues commissioned by the Montana Attorney General. The Attorney General’s office is charged with the duties to supervise nonprofit corporations and enforce consumer protection laws.
Table 1 lists the study hospitals. There is a change in the composition of the groups from last year due to Holy Rosary Healthcare in Miles City converting to critical access status. This change is taken into account whenever comparisons to prior years are made in this report.
For ease of reference, we refer to the 10 largest hospitals – known in the industry as prospective payment system (PPS) hospitals – as “large hospitals” and the 12 critical access hospitals as “small hospitals.” The data contained in this report are taken from information provided by the hospitals about their fiscal year that ended in 2009 as well as from prior years. For the first time, the standardized reporting of community benefits prescribed by the IRS on Form 990, Schedule H, was utilized.
Table 1 Montana Hospitals – 2009 Community Benefits Study
All of the study hospitals are nonprofit corporations formed for public benefit purposes and are prohibited by law from paying out distributions or profits (MCA 35-2-1401). State law requires that nonprofit hospitals operate to benefit the public as a whole and not any class of private individuals such as hospital directors, officers or employees. As such, these hospitals qualify under Internal Revenue Code section 501(c)(3) for an exemption from federal income taxes and donations to these hospitals are tax deductible. Montana state law further provides that property
LARGE (PROSPECTIVE PAYMENT SYSTEM) HOSPITALS SMALL (CRITICAL ACCESS) HOSPITALS
FACILITY NAME/CITY FACILITY NAME/CITY
BENEFIS GREAT FALLS CENTRAL MT MED. CENTER LEWISTOWN
BILLINGS CLINIC COMMUNITY OF ANACONDA
BOZEMAN DEACONESS FRANCIS MAHON DEAC. GLASGOW
COMMUNITY MED. CTR. MISSOULA GLENDIVE MEDICAL CENTER
NORTHWEST HEALTHCARE KALISPELL HOLY ROSARY MILES CITY
NORTHERN MT MED CTR HAVRE LIVINGSTON HEALTHCARE
ST. JAMES BUTTE MARCUS DALY MEMORIAL HAMILTON
ST. PATRICK MISSOULA NORTH VALLEY WHITEFISH
ST. PETER HELENA SIDNEY HEALTH CENTER
ST. VINCENT BILLINGS ST. JOHN'S LUTHERAN LIBBY
ST. JOSEPH POLSON
ST. LUKE COMMUNITY RONAN

used exclusively for non-profit health care facilities is exempt from property taxes (MCA 15-6-201) and from income tax (MCA 15-31-102).
In 1956 the Internal Revenue Service requirements for a hospital to qualify as tax exempt stated, very simply, that a hospital must “…provide charity care to the extent of its financial ability.” 1 In the years following the enactment of Medicare and Medicaid, the regulations became less specific as the “community benefit” standard was introduced. In so many words, federal law reflects an expectation that tax exempt hospitals will provide a community benefit proportionate to the value of their tax exemption. The Internal Revenue Service has explained that community benefit is broader than just charity care and “…is a flexible standard based on the totality of the circumstances and that a hospital need not demonstrate every factor to be exempt.”2
Until 2007 the community benefit standard remained very general. In that year, the IRS defined eight specific community benefits that can count in meeting the hospitals’ requirements in return for tax exempt status (see Appendix 1 for a full description of community benefits). This specificity, as well as uniform reporting, has enabled us to more reliably document and evaluate hospital community benefits than was possible for the first report. Meanwhile, the Attorney General retains the duty to ensure that the services hospitals provide under the more specific federal community benefit standards are consistent with their original public benefit obligations under state law.
II. Charity Care
In light of the high cost of medical care and the recent economic recession, the importance of charity care for a community has perhaps never been greater. During 2009, in Montana hospital prices increased by 7.6%3 and unemployment stood at 6.3%.4 These and other factors gave rise to an increased need for financial assistance from hospitals and consequently an increase in the cost of charity care they provide. The Affordable Care Act (ACA) passed in March 2010 has many provisions related to tax exemption for charitable hospitals, including the requirement that hospitals publicize their financial assistance policies. It also requires the secretaries of Treasury and Health and Human Services to provide an annual report to Congress on charity care and bad debts expenses. Consequently, our intent in this section is to “shine a light” on hospital performance related to charity care.
Financial Assistance Policies: When the IRS published new community benefit regulations in December 2007, charity care remained at the heart of the requirements for tax exempt status. And while Montana hospitals have had financial assistance policies for many years, for the first time, federal regulations require that hospitals have a charity policy and also that they make them known to those who might need them.

The poverty line established by Federal Poverty Guidelines (FPG) is used by hospitals to establish need. In 2009, for a family of four, the poverty line was $22,050. Montana’s hospitals structure their charity policies on a sliding scale such that financial assistance begins with a 10% discount and progresses to a write off of 100%.
Our analysis of these policies over the past four years shows that five of the 10 large hospitals have made their financial assistance policies more liberal. Tables 2A and 2B display the lower and upper limits of the hospitals’ charity policies. The shaded areas highlight changes from 2006.
Because a catastrophic medical event such as a stroke or brain injury can result in bills totaling $750,000 and more, even families with incomes above the thresholds where the sliding scale discount begins can be left with bills they are unable to pay. We inspected the hospitals’ policies for provisions that take into account circumstances involving catastrophic or unusual situations. We found that all of the large hospitals and four of the small hospitals’ policies provide for such circumstances.
At Benefis for example, catastrophic financial assistance is considered when an individual's liability will exceed 50% of the family's gross income. Similarly, at Sidney Health Center full or partial assistance may be provided to patients with gross family income above the 175% threshold when circumstances determined by the Patient Accounts Manager indicate that full payment may cause social and financial hardships so as to significantly harm the patient or the family unit.
Table 2A Large Hospitals’ 2009 Charity Policy and Four-Year Changes
FACILITY NAME/CITY
%FPG CHARITY BEGINS
2006
% FPG CHARITY BEGINS
2009
% FPG FOR FULL
WRITE OFF
2006
% FPG FOR FULL
WRITE OFF
2009
BENEFIS GREAT FALLS 200% 220% 150% 180%
BILLINGS CLINIC 300% 300% 110% 200%
BOZEMAN DEACONESS 200% 250% 100% 150%
COMMUNITY MED. CTR. MISSOULA 300% 300% 200% 200%
NORTHWEST HEALTHCARE KALISPELL 200% 300% 125% 150%
NORTHERN MT MED CTR HAVRE 200% 200% 100% 100%
ST. JAMES BUTTE 400% 400% 200% 200%
ST. PATRICK MISSOULA 400% 400% 200% 200%
ST. PETER HELENA 200% 250% 125% 150%
ST. VINCENT BILLINGS 400% 400% 200% 200%
AVERAGE 280% 302% 151% 173%

Our study of the small hospitals has just two years’ data. Their current financial assistance limits are compared with last year in the table below.
Table 2B
Small Hospitals’ 2009 Charity Policy and Two-Year Changes
FACILITY NAME/CITY
%FPG CHARITY BEGINS
2008
% FPG CHARITY BEGINS
2009
% FPG FOR FULL
WRITE OFF
2008
% FPG FOR FULL
WRITE OFF
2009
CENTRAL MT MED. CENTER LEWISTOWN 300% 300% 150% 150%
COMMUNITY OF ANACONDA 200% 200% 100% 100%
FRANCIS MAHON DEAC. GLASGOW 175% 200% 100% 100%
GLENDIVE MEDICAL CENTER 200% 200% 100% 100%
HOLY ROSARY MILES CITY 400% 400% 200% 200%
LIVINGSTON HEALTHCARE 200% 200% 100% 100%
MARCUS DALY MEMORIAL HAMILTON 200% 200% 100% 100%
NORTH VALLEY WHITEFISH 200% 200% 50% 100%
SIDNEY HEALTH CENTER 175% 175% 100% 100%
ST. JOHN'S LUTHERAN LIBBY 200% 200% 100% 100%
ST. JOSEPH POLSON 400% 400% 200% 200%
ST. LUKE COMMUNITY RONAN 300% 300% 150% 150%
AVERAGE 246% 248% 121% 125%
Charity Care Applications: Once a hospital’s financial assistance policy is approved by its board of directors, the way it is implemented and followed significantly affects the number of individuals who can benefit from it. To evaluate this, we examined the hospitals’ financial assistance procedures. Also, we asked how the policy is made known to the public and about difficulties hospitals encounter when attempting to implement their procedures.
Understandably, there is considerable variation among hospitals in the charity application process. Most require a three or four-page financial disclosure form, plus two or three attachments with items like tax returns and bank statements. Others are less complex. St. Vincent Healthcare has the simplest procedure; just a one-page screening form that is returned to them for evaluation. (Additional paperwork is required if the screen suggests the applicant may qualify.)
When we asked hospitals what difficulties they had in implementing their charity policies, the most common barrier identified was the failure or inability of the patient to provide all the needed documentation in a timely manner. Information provided by one hospital estimated that

only about 25 % of the charity applications they give out are returned and, of those that are returned, only 5% are complete. Overall, the complexity of the forms and the process undoubtedly causes some individuals who qualify for financial assistance to not apply. We suggest that the Montana Hospital Association and the Attorney General’s Office of Consumer Protection collaborate on the development of a simplified model application for hospitals to consider using.
Charity Care Information: The means for informing the public included distributing information on the hospital’s website, signage in registration areas, brochures given at registration or admission, and information on monthly statements and other computer-generated letters. Much of this information also encourages patients to speak with a financial counselor for additional information and assistance. One hospital (St. Vincent’s) mentioned that they include availability of financial assistance information as part of their regular advertising in the city’s largest newspaper. Frances Mahon also mentioned that the contact information for the financial counselor is in the local newspaper.
By including charity care or financial assistance information on its website, a hospital increases the chance that the policy will be well known and accessible to patients and the public. Of the large hospitals, only one of the 10, Northern Montana Healthcare, Havre, did not provide information on its web page about financial assistance or charity care. Billings Clinic now provides financial assistance information on its website when last year this information was absent. Additionally, users are able to perform a search for “financial assistance” on the large facility websites with successful results in all but one case, Bozeman Deaconess.
Eight of the 12 small facilities now provide financial assistance or charity care information on their websites. Last year, only four small facilities provided this information. Central Montana Medical Center, Frances Mahon Deaconess, Glendive Medical Center, and Livingston Healthcare have added financial assistance information to their websites. Additionally, for the small hospitals, it was less likely that a search of the website was possible or would lead to results for financial assistance. Only two websites (Livingston Healthcare and Holy Rosary, Miles City) yielded successful results. Like the large hospitals, two of the small hospitals provided more than just basic financial assistance information by including access to a more detailed financial assistance policy.
When searching for each hospital’s financial assistance policy using Google (“hospital name” financial assistance policy), good results were found for six of the large hospitals and five of the small hospitals.

Readability: In an examination of the financial assistance and charity care policies on each hospital’s website, we assessed the readability of that information (see Appendix 2). Readability is a measure of how difficult it is to read and understand the text contained within each website. It is represented by the grade level a person would need to have reached to understand the material.
Of the 17 hospitals that included charity care or financial assistance information on their websites, the average grade level required to understand the information was 13th grade. This means that on average, a reader would need to have completed one year of college to have a good understanding of that information.
The lowest reading level required was 9th grade (St. Joseph-Polson). The highest reading level required was 16th grade, or at least four years of college
(Glendive Medical Center).
When broken down by classification of hospital, there was not much difference in terms of readability. For the large hospitals, the average grade level required was 12.79 and for the small hospitals, the average grade level required was 13.11.
Charity Care Approvals: To evaluate charity approval rates among hospitals, we compare the number of applications approved to the number of patients the hospital served. “Adjusted patient days” is a volume measure that combines inpatient and outpatient care, thus capturing the total workload of the facility.
Table 3 displays the number of approved charity applications per 1000 adjusted patient days. In 2009, all hospitals experienced a dramatic increase in the number of charity applications received compared with 2008 (41,500 vs. 27,200). The percent of applications approved remained constant at about 92%, resulting in a significant jump in the total number of approved applications. As a group and compared with past years, Montana’s hospitals are doing a better job of implementing their financial assistance policies.

Table 3 Approved Charity Applications per 1000 Adjusted Patient Days – 2009
Charity Care Costs: Table 4 shows the total cost of charity care provided in 2009 as well as its percent of hospital operating expense and surplus. Overall, charity costs increased by almost $12.5 million compared with the previous year and constituted 2.75% of operating expenses. The average reported for all U.S. hospitals the same year was 2.5%.5
FACILITY NAME/CITY
APPROVALS
Per 1000
ADJ.
PATIENT
DAYS
TOTAL CHARITY
APPLICATIONS
CHARITY
APPLICATIONS
APPROVED
PERCENT
APPROVED
AVG. COST PER
CHARITY CASE
APPROVED
NORTHWEST HEALTHCARE KALISPELL 97.03 5876 5276 90% 541$
COMMUNITY MED. CTR. MISSOULA 96.65 2770 2539 92% 1,167$
BENEFIS GREAT FALLS 81.63 8843 8440 95% 740$
BILLINGS CLINIC 76.14 8942 8341 93% 1,722$
ST. JAMES BUTTE 66.78 2077 2042 98% 1,281$
ST. PETER HELENA 50.54 2726 2587 95% 1,152$
ST. PATRICK MISSOULA 38.94 3425 3025 88% 2,188$
NORTHERN MT MED CTR HAVRE 23.99 488 427 88% 1,210$
BOZEMAN DEACONESS 23.15 1015 877 86% 2,797$
ST. VINCENT BILLINGS 19.49 1931 1846 96% 3,571$
2009 Average/Totals 57.43 38093 35400 92% 1,637$
2008 Average/Totals 31.6 24881 23323 93% $ 2,448
NORTH VALLEY WHITEFISH 48.03 664 591 89% 1,197$
ST. JOSEPH POLSON 33.35 412 374 91% 1,081$
LIVINGSTON HEALTHCARE 31.72 430 404 94% 1,617$
FRANCIS MAHON DEAC. GLASGOW 27.58 309 246 80% 1,454$
ST. JOHN'S LUTHERAN LIBBY 17.58 263 211 80% 1,870$
GLENDIVE MEDICAL CENTER 17.02 174 166 95% 2,241$
CENTRAL MT MED. CENTER LEWISTOWN 16.70 235 223 95% 1,418$
SIDNEY HEALTH CENTER 14.74 206 174 84% 1,533$
COMMUNITY OF ANACONDA 14.01 86 74 86% 1,385$
MARCUS DALY MEMORIAL HAMILTON 9.30 194 144 74% 1,033$
HOLY ROSARY MILES CITY 9.20 476 474 99.58% 844$
ST. LUKE COMMUNITY RONAN 1.11 56 48 86% 3,661$
2009 Average 20.03 3505 3129 88% 1,611$
2008 Average 12.6 2343 2012 82% $ 2,830

Table 4 Charity Costs and Percent Operating Expense/Surplus - 2009
* Facility had operating loss
FACILITY NAME/CITY
CHARITY COSTS
2009
CHARITY
CARE AS A
PERCENT OF
OP. EXPENSE
CHARITY CARE
% OP.
SURPLUS
BILLINGS CLINIC 14,506,721$ 3.18% 297.87%
ST. VINCENT BILLINGS 10,707,594$ 3.57% 62.61%
ST. PATRICK MISSOULA 7,768,725$ 3.49% 61.97%
BENEFIS GREAT FALLS 7,720,419$ 2.99% 49.74%
NORTHWEST HEALTHCARE KALISPELL 3,535,165$ 1.68% 215.21%
BOZEMAN DEACONESS 3,285,401$ 2.29% 40.74%
COMMUNITY MED. CTR. MISSOULA 3,219,635$ 2.51% 108.86%
ST. PETER HELENA 3,108,727$ 2.58% 81.99%
ST. JAMES BUTTE 2,999,200$ 3.45% *
NORTHERN MT MED CENTER HAVRE 641,742$ 1.16% 52.03%
Total/Median 57,493,329$ 2.79% 62.61%
2008 Total/Median 48,208,581$ 2.57% 69.50%
HOLY ROSARY MILES CITY 1,547,854$ 4.28% *
SIDNEY HEALTH CENTER 1,295,985$ 3.21% *
NORTH VALLEY WHITEFISH 938,596$ 2.80% *
FRANCIS MAHON DEAC. GLASGOW 528,994$ 2.08% 20.84%
ST. JOSEPH POLSON 519,674$ 2.33% 167.66%
MARCUS DALY MEMORIAL HAMILTON 463,344$ 1.05% *
LIVINGSTON HEALTHCARE 448,112$ 1.30% 103.27%
GLENDIVE MEDICAL CENTER 419,626$ 1.17% 50.51%
ST. JOHN'S LUTHERAN LIBBY 405,401$ 1.74% 30.48%
CENTRAL MT MED. CENTER LEWISTOWN 371,268$ 1.44% 883.13%
COMMUNITY OF ANACONDA 299,210$ 1.15% 24.99%
ST. LUKE COMMUNITY RONAN 195,177$ 0.59% 10.19%
Total/Median 7,433,241$ 1.59% 40.49%
2008 Total/Median 4,299,177$ 1.32% 22.16%

In Graph 1, charity care as a percent of operating expense is plotted against the hospital’s percent of operating surplus to display the cost of charity care relative to the surplus earned by the institution. This graph shows the variation in profitability and charity care experienced among the hospitals. For example, the small hospital with the greatest loss (10%) had the highest charity care (4.4%), while another small hospital with one of the highest surpluses (5.1%) had the lowest charity care (0.59%).
Graph 1
Charity Trend: The four-year trend in charity care for Montana’s largest hospitals shows a consistent and dramatic increase as measured in absolute dollars, percent of expenses and percent of surplus. Graph 2 displays these trends. Reasons for this consistent increase are many and include the improved advertisement of financial assistance policies by hospitals, a liberalization of these policies and the increased need of Montana citizens due to lack of health care coverage and rising prices.
-10.00%
-7.50%
-5.00%
-2.50%
0.00%
2.50%
5.00%
7.50%
10.00%
0.00% 0.50% 1.00% 1.50% 2.00% 2.50% 3.00% 3.50% 4.00% 4.50% 5.00%
Op
era
tin
g P
rofi
t M
argi
n
Cost of Charity, as % of Operating Expense
Comparison of Charity Care and Operating Profit Margin
Large Hospitals Small Hospitals
Large Hospital Average % of Op. Expense Spent on Charity Care Small Hospital Avg % of Op. Exp Spent on Charity Care

Graph 2
III. Community Benefits
As mentioned earlier, in 2007, the IRS requirement for Community Benefit by nonprofit hospitals was substantially changed. In addition to charity care, the IRS included the costs of programs and activities itemized in Appendix 1 as contributing to the value of community benefit by a hospital. A diagram of how community benefits are now structured appears below.6
$34,193,000
$42,585,000
$48,609,000
$59,041,000
0.00%
0.50%
1.00%
1.50%
2.00%
2.50%
3.00%
3.50%
20.00%
30.00%
40.00%
50.00%
60.00%
70.00%
80.00%
2006 2007 2008 2009
Ch
arit
y C
are
Co
st %
of
Op
. Exp
en
se
Ch
arit
y C
are
Co
st %
of
Op
. Su
rplu
s
Large Hospitals Trends in Charity Care Costs -Percent of Expense and Surplus
Median Surplus
Total Charity Care in Dollars
Median Expense

* Included in Montana community benefits (See Appendix 1)
Table 5 displays the cost of all community benefits provided by Montana hospitals in 2009 and the percent of operating expenses they represent. The complete detail for all community benefits costs can be found in Appendix 3. Contrary to past trends, in 2009 the large hospitals had $2.7 million less total community benefit costs due to improved Medicaid reimbursement (almost $17 million more for the group). On the other hand, the small hospitals show an increase of $6.4 million.
Hospital Community Benefit
Medicaid & Other Government Sponsored
Programs (means tested)
Charity Care
Programs/Activities
Community Health
Improvement
Health Professions Education
Subsidized Health Services
Research
Financial & Inkind
Contributions
Community Benefit
Operations
Community Building
Activities *
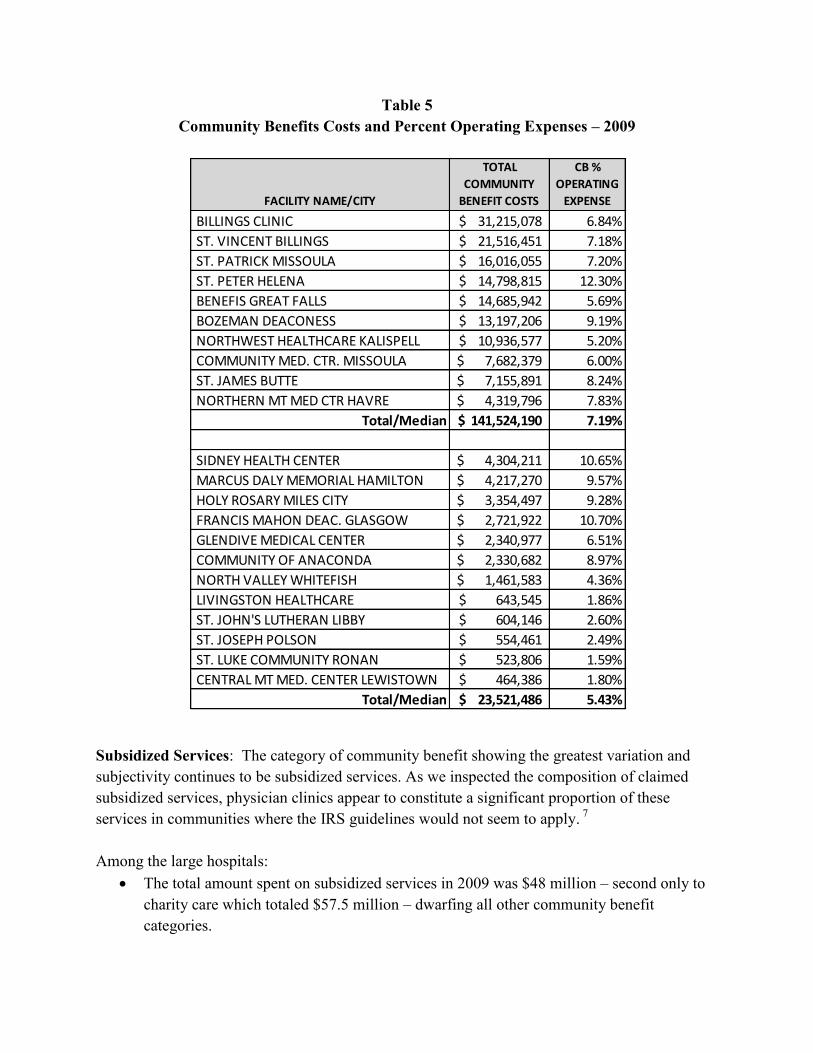
Table 5 Community Benefits Costs and Percent Operating Expenses – 2009
Subsidized Services: The category of community benefit showing the greatest variation and subjectivity continues to be subsidized services. As we inspected the composition of claimed subsidized services, physician clinics appear to constitute a significant proportion of these services in communities where the IRS guidelines would not seem to apply. 7 Among the large hospitals:
The total amount spent on subsidized services in 2009 was $48 million – second only to charity care which totaled $57.5 million – dwarfing all other community benefit categories.
FACILITY NAME/CITY
TOTAL
COMMUNITY
BENEFIT COSTS
CB %
OPERATING
EXPENSE
BILLINGS CLINIC 31,215,078$ 6.84%
ST. VINCENT BILLINGS 21,516,451$ 7.18%
ST. PATRICK MISSOULA 16,016,055$ 7.20%
ST. PETER HELENA 14,798,815$ 12.30%
BENEFIS GREAT FALLS 14,685,942$ 5.69%
BOZEMAN DEACONESS 13,197,206$ 9.19%
NORTHWEST HEALTHCARE KALISPELL 10,936,577$ 5.20%
COMMUNITY MED. CTR. MISSOULA 7,682,379$ 6.00%
ST. JAMES BUTTE 7,155,891$ 8.24%
NORTHERN MT MED CTR HAVRE 4,319,796$ 7.83%
Total/Median 141,524,190$ 7.19%
SIDNEY HEALTH CENTER 4,304,211$ 10.65%
MARCUS DALY MEMORIAL HAMILTON 4,217,270$ 9.57%
HOLY ROSARY MILES CITY 3,354,497$ 9.28%
FRANCIS MAHON DEAC. GLASGOW 2,721,922$ 10.70%
GLENDIVE MEDICAL CENTER 2,340,977$ 6.51%
COMMUNITY OF ANACONDA 2,330,682$ 8.97%
NORTH VALLEY WHITEFISH 1,461,583$ 4.36%
LIVINGSTON HEALTHCARE 643,545$ 1.86%
ST. JOHN'S LUTHERAN LIBBY 604,146$ 2.60%
ST. JOSEPH POLSON 554,461$ 2.49%
ST. LUKE COMMUNITY RONAN 523,806$ 1.59%
CENTRAL MT MED. CENTER LEWISTOWN 464,386$ 1.80%
Total/Median 23,521,486$ 5.43%

The percent of all community benefits consisting of subsidized services ranges from 18% to 62%. Three large hospitals spent from two to four times more on subsidized services than on charity care:
FACILITY NAME/CITY
CHARITY CARE
SUBSID.
HEALTH SERVICES
BOZEMAN DEACONESS $3,285,401 $7,007,406
NORTHERN MT MED. CENTER HAVRE $641,742 $2,557,481
ST. PETER HELENA $3,108,727 $9,212,668
At small hospitals, the percent of all community benefits consisting of subsidized services ranges from 0% to 63%. Table 6 is a comparison of the amounts of charity care provided to the amounts of subsidized services claimed.
Table 6 Comparison of Charity Care to Subsidized Services – 2009
FACILITY NAME/CITY CHARITY CARE
SUBSIDIZED HEALTH
SERVICES
BENEFIS GREAT FALLS 7,720,419$ 4,841,562$
BILLINGS CLINIC 14,506,721$ 7,969,298$
BOZEMAN DEACONESS 3,285,401$ 7,007,406$
COMMUNITY MED. CTR. MISSOULA 3,219,635$ 2,777,223$
NORTHWEST HEALTHCARE KALISPELL 3,535,165$ 3,212,974$
NORTHERN MT MED CTR HAVRE 641,742$ 2,557,481$
ST. JAMES BUTTE 2,999,200$ 1,278,927$
ST. PATRICK MISSOULA 7,768,725$ 3,250,659$
ST. PETER HELENA 3,108,727$ 9,212,668$
ST. VINCENT BILLINGS 10,707,594$ 5,946,749$
CENTRAL MT MED. CENTER LEWISTOWN 371,268$ 600$
COMMUNITY OF ANACONDA 299,210$ 1,706,710$
FRANCIS MAHON DEAC. GLASGOW 528,994$ 1,943,618$
GLENDIVE MEDICAL CENTER 419,626$ 1,590,306$
HOLY ROSARY MILES CITY 1,547,854$ 67,423$
LIVINGSTON HEALTHCARE 448,112$ -$
MARCUS DALY MEMORIAL HAMILTON 463,344$ 2,676,427$
NORTH VALLEY WHITEFISH 938,596$ 38,738$
SIDNEY HEALTH CENTER 1,295,985$ 2,536,399$
ST. JOHN'S LUTHERAN LIBBY 405,401$ -$
ST. JOSEPH POLSON 519,674$ 485$
ST. LUKE COMMUNITY RONAN 195,177$ 102,566$

Community Benefits Compared to Tax Exemption: By comparing the value of the nonprofit hospitals’ tax exemptions to the costs of the community benefits, we get a “big picture” perspective of the economic exchange society makes by granting tax exempt status to Montana’s hospitals. Table 7a shows this comparison.
The calculation of the value of the hospitals’ tax exemption includes: federal and state income taxes, estimated Montana property taxes8, and the tax advantage from issuing tax exempt bonds.
We calculate the value of the tax exemption for both operating income (patient care activities) and total income (includes non-operating income such as investment earnings and rental income) because total income can vary significantly from year to year. The detail behind this calculation is shown in Appendix 4. The reader should note that in 2009, three hospitals had operating losses and six incurred losses when total income is included. The number of hospitals with losses in 2009 is unusually high compared with prior years, making the comparison of the percent of community benefit to tax exemption value difficult. Nevertheless, it is safe to conclude that, again in 2009, Montana’s hospitals continued to increase the value of community benefits they provided compared to the value of the tax exemption they received. Table 7b compares charity care alone to the value of the operating tax exemption.
Table 7a Community Benefit Cost Compared to Value of Tax Exemption – 2009
FACILITY NAME/CITY
TOTAL
COMMUNITY
BENEFIT COST
VALUE TAX
EXEMPTION
OPR. INC.
OPR. INC
COMMUNITY
BENEFIT % TAX
EXEMPTION
VALUE TAX
EXEMPTION
TOTAL INC.
TOTAL
COMMUNITY
BENEFIT % TAX
EXEMPTION
BILLINGS CLINIC 31,215,078$ 6,379,434$ 489% (1,855,641)$ *
ST. VINCENT BILLINGS 21,516,451$ 8,179,831$ 263% 13,896,057$ 155%
ST. PATRICK MISSOULA 16,016,055$ 6,320,143$ 253% 6,665,202$ 240%
ST. PETER HELENA 14,798,815$ 2,128,436$ 695% (526,401)$ *
BENEFIS GREAT FALLS 14,685,942$ 9,766,318$ 150% 9,558,396$ 154%
BOZEMAN DEACONESS 13,197,206$ 3,883,592$ 340% 5,429,450$ 243%
NORTHWEST HEALTHCARE KALISPELL 10,936,577$ 643,331$ 1700% (2,870,456)$ *
COMMUNITY MED. CTR. MISSOULA 7,682,379$ 1,408,265$ 546% 4,515,166$ 170%
ST. JAMES BUTTE 7,155,891$ (922,723)$ * (884,809)$ *
NORTHERN MT MED CTR HAVRE 4,319,796$ 474,460$ 910% 812,595$ 532%
TOTAL 141,524,190$ 38,261,088$ 415% 34,739,561$ 242%
2008 TOTAL/MEDIAN 145,483,268$ 39,085,091$ 381% 43,534,415$ 283%
SIDNEY HEALTH CENTER 4,304,211$ (449,241)$ * (751,570)$ *
MARCUS DALY MEMORIAL HAMILTON 4,217,270$ 121,308$ 3477% 296,240$ 1424%
HOLY ROSARY MILES CITY 3,354,497$ (1,164,287)$ * (1,147,743)$ *
FRANCIS MAHON DEAC. GLASGOW 2,721,922$ 1,021,913$ 266% 1,327,347$ 205%
GLENDIVE MEDICAL CENTER 2,340,977$ 733,472$ 319% 521,317$ 449%
COMMUNITY OF ANACONDA 2,330,682$ 462,430$ 504% 574,691$ 406%
NORTH VALLEY WHITEFISH 1,461,583$ (42,566)$ * 179,499$ 814%
LIVINGSTON HEALTHCARE 643,545$ 187,112$ 344% 195,214$ 330%
ST. JOHN'S LUTHERAN LIBBY 604,146$ 518,407$ 117% 626,156$ 96%
ST. JOSEPH POLSON 554,461$ 304,679$ 182% 324,695$ 171%
ST. LUKE COMMUNITY RONAN 523,806$ 1,037,653$ 50% 1,452,140$ 36% CENTRAL MT MED. CENTER LEWISTOWN 464,386$ 60,890$ 763% 105,675$ 439%
TOTAL 23,521,486$ 2,791,769$ 344% 3,703,661$ 478%
2008 TOTAL/MEDIAN 15,872,834$ 5,957,228$ 307% 6,437,883$ 238%
* Facility had an operating or total loss

Table 7b Charity Care Cost Compared to Value of Tax Exemption-2009
IV. Hospital Billing and Collection Practices
Uncompensated Care: Hospitals have the obligation to provide care to anyone needing medical services. For individuals who do not qualify or fail to apply for charity care and who do not pay, the charges for services result in bad debts. The combination of charity care and bad debts comprise the total amount of charges for services that the hospital writes off as uncollectable. This sum is called uncompensated care, and it has been a widely used measure of free care in hospitals for over 30 years. In the U.S. in 2009, uncompensated care costs rose by 7%9 and amounted to 6% of all hospital expenses10. In Montana these costs rose by 8.2% (almost $24 million) and amounted to 5.2% of total expenses for large hospitals and 5.5% for small hospitals. Table 8 shows uncompensated care in 2009 for each hospital.
FACILITY NAME/CITY
TOTAL CHARITY
CARE COST
VALUE TAX
EXEMPTION
OPR. INC.
TOTAL CHARITY
CARE COST %
TAX EXEMPTION
NORTHWEST HEALTHCARE KALISPELL 3,535,165$ 643,331$ 550%
COMMUNITY MED. CTR. MISSOULA 3,219,635$ 1,408,265$ 229%
BILLINGS CLINIC 14,506,721$ 6,379,434$ 227%
ST. PETER HELENA 3,108,727$ 2,128,436$ 146%
NORTHERN MT MED CENTER HAVRE 641,742$ 474,460$ 135%
ST. VINCENT BILLINGS 10,707,594$ 8,179,831$ 131%
ST. PATRICK MISSOULA 7,768,725$ 6,320,143$ 123%
BOZEMAN DEACONESS 3,285,401$ 3,883,592$ 85%
BENEFIS GREAT FALLS 7,720,419$ 9,766,318$ 79%
ST. JAMES BUTTE 2,999,200$ (922,723)$ *
HOLY ROSARY MILES CITY 1,547,854$ (1,164,287)$ *
SIDNEY HEALTH CENTER 1,295,985$ (449,241)$ *
NORTH VALLEY WHITEFISH 938,596$ (42,566)$ *
FRANCIS MAHON DEAC. GLASGOW 528,994$ 1,021,913$ 52%
ST. JOSEPH POLSON 519,674$ 304,679$ 171%
MARCUS DALY MEMORIAL HAMILTON 463,344$ 121,308$ 382%
LIVINGSTON HEALTHCARE 448,112$ 187,112$ 239%
GLENDIVE MEDICAL CENTER 419,626$ 733,472$ 57%
ST. JOHN'S LUTHERAN LIBBY 405,401$ 518,407$ 78%
CENTRAL MT MED. CENTER LEWISTOWN 371,268$ 60,890$ 610%
COMMUNITY OF ANACONDA 299,210$ 462,430$ 65%
ST. LUKE COMMUNITY RONAN 195,177$ 1,037,653$ 19%
*facility had operating loss
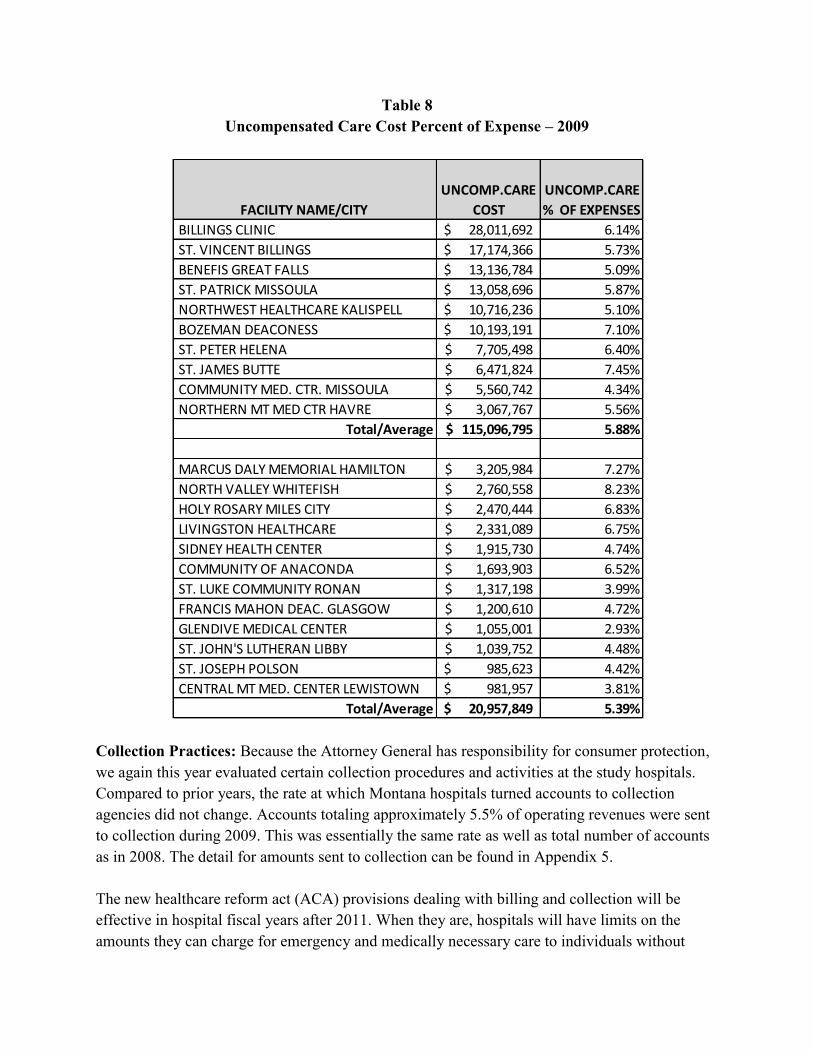
Table 8 Uncompensated Care Cost Percent of Expense – 2009
Collection Practices: Because the Attorney General has responsibility for consumer protection, we again this year evaluated certain collection procedures and activities at the study hospitals. Compared to prior years, the rate at which Montana hospitals turned accounts to collection agencies did not change. Accounts totaling approximately 5.5% of operating revenues were sent to collection during 2009. This was essentially the same rate as well as total number of accounts as in 2008. The detail for amounts sent to collection can be found in Appendix 5. The new healthcare reform act (ACA) provisions dealing with billing and collection will be effective in hospital fiscal years after 2011. When they are, hospitals will have limits on the amounts they can charge for emergency and medically necessary care to individuals without
FACILITY NAME/CITY
UNCOMP.CARE
COST
UNCOMP.CARE
% OF EXPENSES
BILLINGS CLINIC 28,011,692$ 6.14%
ST. VINCENT BILLINGS 17,174,366$ 5.73%
BENEFIS GREAT FALLS 13,136,784$ 5.09%
ST. PATRICK MISSOULA 13,058,696$ 5.87%
NORTHWEST HEALTHCARE KALISPELL 10,716,236$ 5.10%
BOZEMAN DEACONESS 10,193,191$ 7.10%
ST. PETER HELENA 7,705,498$ 6.40%
ST. JAMES BUTTE 6,471,824$ 7.45%
COMMUNITY MED. CTR. MISSOULA 5,560,742$ 4.34%
NORTHERN MT MED CTR HAVRE 3,067,767$ 5.56%
Total/Average 115,096,795$ 5.88%
MARCUS DALY MEMORIAL HAMILTON 3,205,984$ 7.27%
NORTH VALLEY WHITEFISH 2,760,558$ 8.23%
HOLY ROSARY MILES CITY 2,470,444$ 6.83%
LIVINGSTON HEALTHCARE 2,331,089$ 6.75%
SIDNEY HEALTH CENTER 1,915,730$ 4.74%
COMMUNITY OF ANACONDA 1,693,903$ 6.52%
ST. LUKE COMMUNITY RONAN 1,317,198$ 3.99%
FRANCIS MAHON DEAC. GLASGOW 1,200,610$ 4.72%
GLENDIVE MEDICAL CENTER 1,055,001$ 2.93%
ST. JOHN'S LUTHERAN LIBBY 1,039,752$ 4.48%
ST. JOSEPH POLSON 985,623$ 4.42%
CENTRAL MT MED. CENTER LEWISTOWN 981,957$ 3.81%
Total/Average 20,957,849$ 5.39%

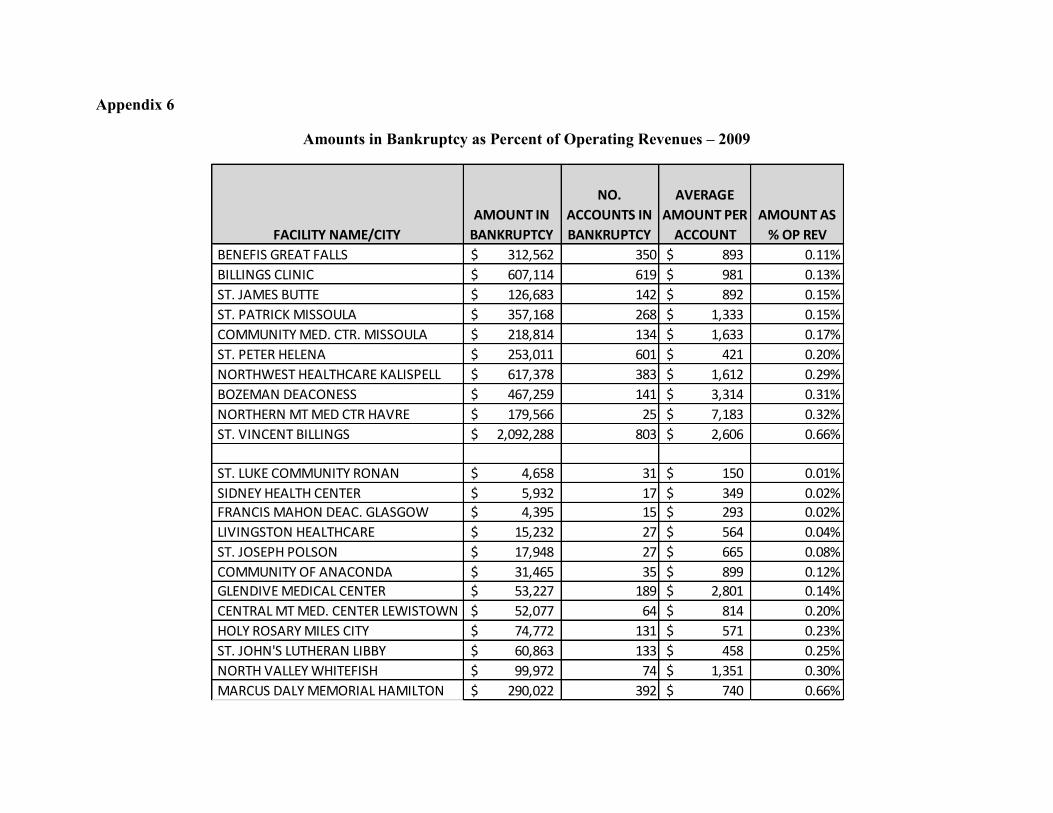
insurance. The limit will be the amount generally billed to people who have insurance. Our inspection of the hospital collection policies revealed that in 2009, no hospitals provided such limits. Bankruptcy: In 2009, the number of accounts resulting in bankruptcy increased. Likely, this reflects the overall economic conditions that year in Montana. The average dollar value of these accounts remained low at $1,509 for large hospitals and $736 for small hospitals. The detail about bankruptcy for each hospital is found at Appendix 6. The trend in hospital accounts resulting in bankruptcy and average amounts is shown in Graph 3.
Graph 3
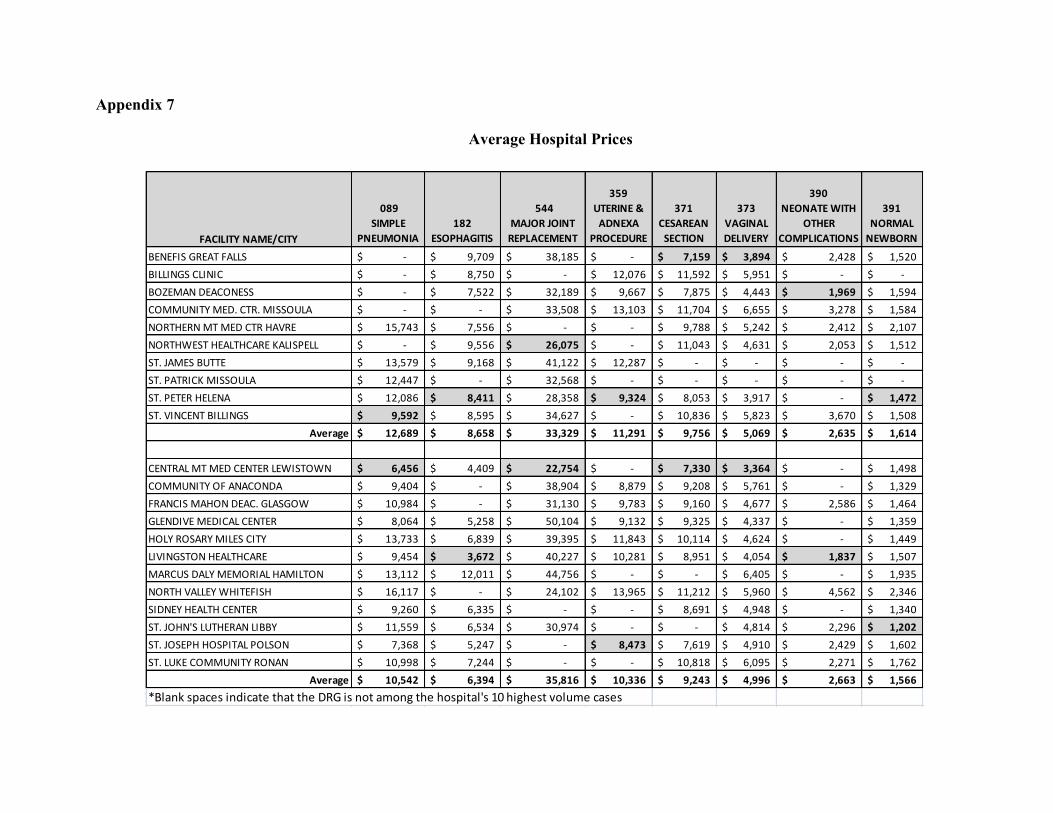
V. Pricing:
Appendix 7 displays the adjusted average prices the study hospitals charged for eight of the most common reasons for inpatient hospitalization in 2009. The prices are not strictly comparable because the Diagnostic Related Group (DRG) classifications do not entirely reflect the differences in severity among cases.
2898
1,896
3466
$1,730
$1,996 $2,087
0
500
1000
1500
2000
2500
3000
3500
4000
2007 2008 2009
Bankruptcy Trends 2007-2009
Number of Accounts in Bankruptcy Average Value of accounts written off to Bankruptcy
FACILITY NAME NET ASSETS
CONTRIBUTIONS
AND GRANTS
TOTAL
REVENUE
FUNDRAISING
COSTS
PROGRAM
SERVICES
EXPENSE
TOTAL
EXPENSES
TOTAL EXPENSES
PROGRAM SVCS.
% DIR. PUB.
SUPT.
BENEFIS GREAT FALLS 9,868,915$ 2,009,793$ 2,567,998$ -$ 1,543,801$ 1,628,043$ 94.83%
BOZEMAN DEACONESS 15,957,119$ 4,121,882$ 4,148,756$ 239,953$ 731,715$ 1,627,129$ 44.97%
BILLINGS CLINIC 25,129,509$ 5,517,261$ 5,302,577$ 800,167$ 4,869,454$ 5,640,039$ 86.34%
COMMUNITY MED. CTR. MISSOULA 5,545,963$ 318,402$ 572,195$ 182,275$ 190,735$ 741,130$ 25.74%
NORTHWEST HEALTHCARE KALISPELL 3,998,260$ 2,437,704$ 2,641,601$ 96,143$ 1,319,215$ 1,994,591$ 66.14%
NORTHERN MT MED CTR HAVRE 1,622,040$ 331,052$ 398,049$ 35,389$ 307,054$ 433,197$ 70.88%
ST. JAMES BUTTE 424,132$ 263,543$ 334,433$ -$ -$ 184,358$ 0.00%
ST. PATRICK MISSOULA 7,200,141$ 2,203,590$ 2,371,578$ 383,452$ 1,832,605$ 2,427,935$ 75.48%
ST. PETER HELENA 9,054,276$ 1,726,506$ 1,128,237$ 9,882$ 965,413$ 992,488$ 97.27%
ST. VINCENT BILLINGS 29,927,472$ 6,404,484$ 6,912,221$ 179,773$ 4,367,348$ 5,165,995$ 84.54%
CENTRAL MT MED. CENTER LEWISTOWN N/A N/A N/A N/A N/A N/A N/A
COMMUNITY OF ANACONDA 281,960$ 120,113$ 162,980$ -$ 500$ 34,402$ 1.45%
FRANCIS MAHON DEAC. GLASGOW N/A N/A N/A -$ N/A N/A N/A
GLENDIVE MEDICAL CENTER 1,502,404$ 97,443$ 155,810$ -$ -$ 166,399$ 0.00%
HOLY ROSARY MILES CITY 1,152,173$ 427,316$ 478,636$ -$ 272,357$ 317,650$ 85.74%
LIVINGSTON HEALTHCARE 1,500,748$ 124,335$ 135,612$ -$ 52,625$ 52,635$ 99.98%
MARCUS DALY MEMORIAL HAMILTON 1,102,150$ 268,256$ 59,602$ 950$ 100,459$ 132,232$ 75.97%
NORTH VALLEY WHITEFISH 874,968$ 155,692$ 194,161$ -$ 365,423$ 374,041$ 97.70%
SIDNEY HEALTH CENTER 465,127$ 387,461$ 389,375$ 20,278$ 198,221$ 314,150$ 63.10%
ST. JOHN'S LUTHERAN LIBBY 1,042,794$ 130,336$ 165,008$ -$ 255,336$ 255,336$ 100.00%
ST. JOSEPH POLSON N/A N/A N/A N/A N/A N/A N/A
ST. LUKE COMMUNITY RONAN 1,134,836$ 65,851$ 99,755$ -$ -$ 31,690$ 0.00%
In general, small hospitals have lower average prices than large hospitals. This reflects the higher cost structure as well as the higher severity of cases at the large hospitals. The average price difference between the large and small hospitals ranged from over $2000 for Esophagitis to almost nothing for Normal Newborns.
For the large hospitals, St. Peter’s in Helena had the most consistently low prices with less than average prices reported in almost all of the DRGs. Billings Clinic and Community Medical Center Missoula had the most consistently higher prices. At the small hospitals, Central Montana Medical Center, Holy Rosary and St. Joseph Hospital all had the most consistently low prices. Marcus Daly, North Valley and St. Luke showed consistently higher prices.
VI. Hospital Foundations:
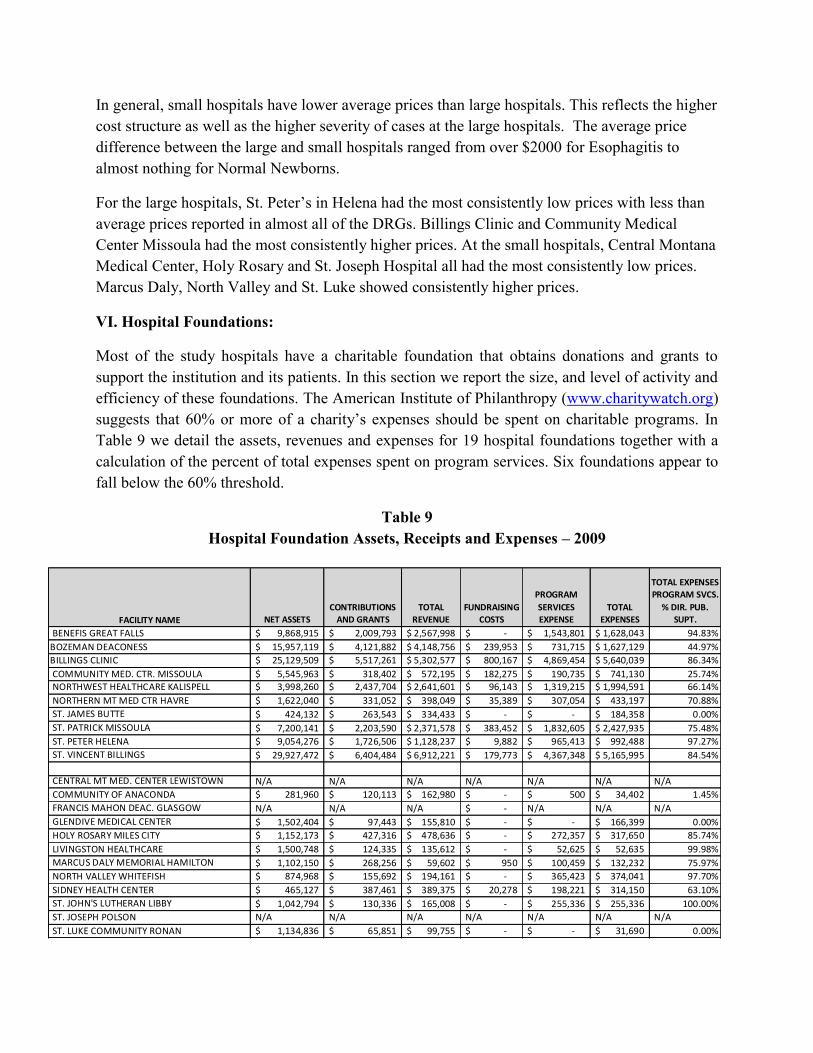
Most of the study hospitals have a charitable foundation that obtains donations and grants to support the institution and its patients. In this section we report the size, and level of activity and efficiency of these foundations. The American Institute of Philanthropy (www.charitywatch.org) suggests that 60% or more of a charity’s expenses should be spent on charitable programs. In Table 9 we detail the assets, revenues and expenses for 19 hospital foundations together with a calculation of the percent of total expenses spent on program services. Six foundations appear to fall below the 60% threshold.
Table 9 Hospital Foundation Assets, Receipts and Expenses – 2009

VII. Conclusion:
Over the four years covered by this report, the Montana hospitals being evaluated have significantly increased the amount of charity care they provide as measured in total dollars, as well as proportions of their expenses and surplus (see Chart 2). For this, they should be commended. Similarly, the value of the total community benefits provided by the large hospitals compared to the value of the taxes they would pay if they were organized for profit continues to increase (415% greater than the value of their tax exemption in 2009).
The field of healthcare is dynamic, including the area of community benefits. Boards of directors and healthcare managers should pay particular attention to the new requirements in the Affordable Care Act, which call for hospitals to assess community health needs in collaboration with others and then to link their community health improvement services to these needs. Additionally, hospitals should more critically evaluate which services they deem “subsidized” when reporting community benefits.
Appendix 1
Community Benefit Definitions11
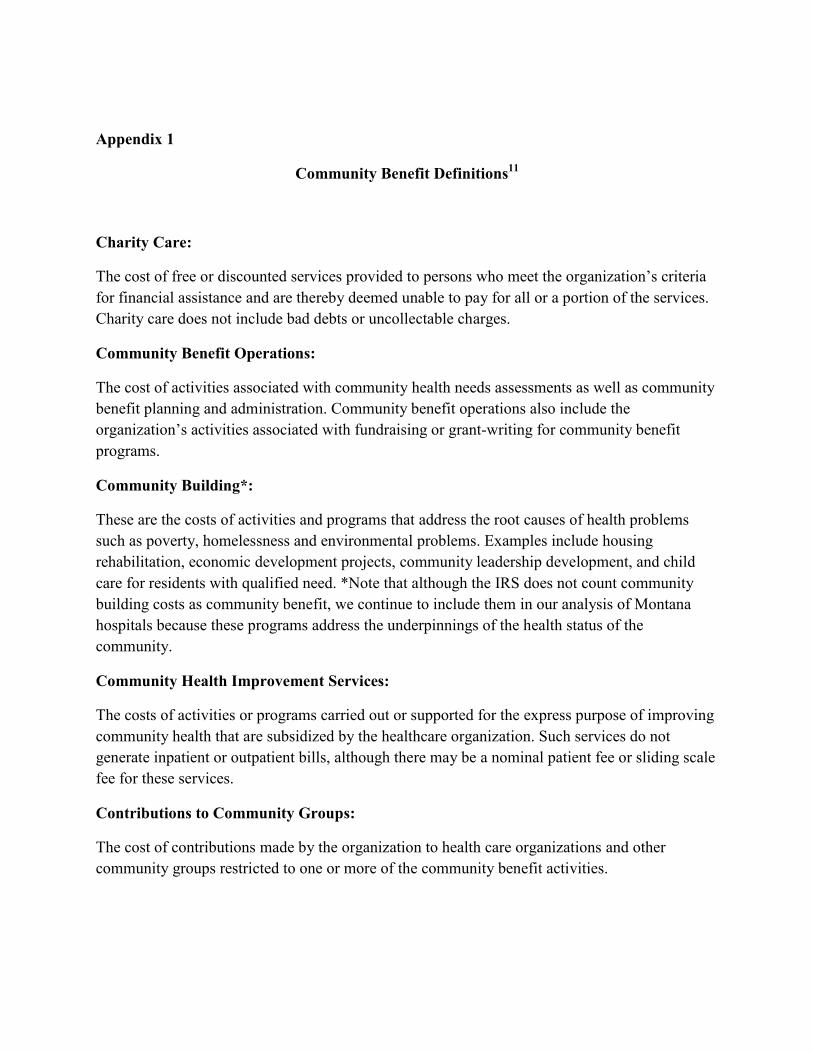
Charity Care:
The cost of free or discounted services provided to persons who meet the organization’s criteria for financial assistance and are thereby deemed unable to pay for all or a portion of the services. Charity care does not include bad debts or uncollectable charges.
Community Benefit Operations:
The cost of activities associated with community health needs assessments as well as community benefit planning and administration. Community benefit operations also include the organization’s activities associated with fundraising or grant-writing for community benefit programs.
Community Building*:
These are the costs of activities and programs that address the root causes of health problems such as poverty, homelessness and environmental problems. Examples include housing rehabilitation, economic development projects, community leadership development, and child care for residents with qualified need. *Note that although the IRS does not count community building costs as community benefit, we continue to include them in our analysis of Montana hospitals because these programs address the underpinnings of the health status of the community.
Community Health Improvement Services:
The costs of activities or programs carried out or supported for the express purpose of improving community health that are subsidized by the healthcare organization. Such services do not generate inpatient or outpatient bills, although there may be a nominal patient fee or sliding scale fee for these services.
Contributions to Community Groups:
The cost of contributions made by the organization to health care organizations and other community groups restricted to one or more of the community benefit activities.

Health Professional Education:
The cost of educational programs that result in a degree, certificate, or training necessary to be licensed to practice as a health professional, as required by state law, or continuing education necessary to retain state license or certification by a board in the individual’s health profession specialty. It does not include education or training programs available exclusively to the organization’s employees and medical staff or scholarships provide to those individuals. However, it does include education programs if the primary purpose of such programs is to educate health professionals in the broader community.
Research:
The cost of any study or investigation the goal of which is to generate generalizable knowledge made available to the public such as knowledge about underlying biological mechanisms of health and disease, natural processes, or principles affecting health or illness; evaluation of safety and efficacy of interventions for disease such as clinical trials and studies of therapeutic protocols; laboratory-based studies; epidemiology, health outcomes, and effectiveness; behavioral or sociological studies related to health, delivery of care, or prevention; studies related to changes in the health care delivery system; and communication of findings and observations, including publication in a medical journal. The organization may include the cost of internally funded research it conducts as well as the cost of research it conducts funded by a tax-exempt or government entity.
Subsidized Health Services:
The cost of clinical services provided despite a financial loss to the organization. In order to qualify as a subsidized health service, the organization must provide the service because it meets an identified community need. A service meets an identified community need if it is reasonable to conclude that if the organization no longer offered the service, the service would be unavailable in the community, the community’s capacity to provide the service would be below the community’s need, or the service would become the responsibility of government or another tax-exempt organization.
Unreimbursed Medicaid:
The unpaid costs of Medicaid and other public programs (such as State Health Insurance Program- SCHIP) for low-income persons. This is the loss created when the payments from these programs are less than the costs of caring for beneficiaries of these programs.

Appendix 2
Hospital Financial Assistance Policy Readability Score
The Readability score indicates the grade level a person would need to reach to understand the
material. The score obtained at http://www.addedbytes.com/code/readability-score/.
FACILITY NAME/CITYREADABILITY
SCORE
BENEFIS GREAT FALLS 14.58
BILLINGS CLINIC 11.12
BOZEMAN DEACONESS 15.1
COMMUNITY MED. CTR. MISSOULA 14.46
NORTHWEST HEALTHCARE KALISPELL 10.46
NORTHERN MT MED CTR HAVRE N/A
ST. JAMES BUTTE 11.94
ST. PATRICK MISSOULA 11.58 ST. PETER HELENA 14.7
ST. VINCENT BILLINGS 11.16
Average 12.79
CENTRAL MT MED. CENTER LEWISTOWN 13.96
COMMUNITY OF ANACONDA N/A
FRANCIS MAHON DEAC. GLASGOW 15.8
GLENDIVE MEDICAL CENTER 16.02
HOLY ROSARY MILES CITY 13.12
LIVINGSTON HEALTHCARE 12.76
MARCUS DALY MEMORIAL HAMILTON N/A NORTH VALLEY WHITEFISH N/A
SIDNEY HEALTH CENTER 12.6
ST. JOHN'S LUTHERAN LIBBY 11.92
ST. JOSEPH POLSON 8.7
ST. LUKE COMMUNITY RONAN 13.68
Average 13.17

Appendix 3
Large Hospitals Community Benefits - 2009
FACILITY NAME/CITY CHARITY CARE
UNREIMB.
MEDICAID COST
COMM HEALTH
IMPROVEMENT
SERV./COMM BEN
OPS
SUBSID. HEALTH
SERV.
CONTRIBUTIONS
COMM GRP
HEALTH PROF.
ED. RESEARCH
COMM.
BUILDING TOTAL
BENEFIS GREAT FALLS 7,720,419$ -$ 101,702$ 4,841,562$ 1,690,140$ 30,696$ 45,316$ 256,107$ 14,685,942$
BILLINGS CLINIC 14,506,721$ 927,176$ 3,362,008$ 7,969,298$ 179,548$ 1,738,123$ 2,256,551$ 275,653$ 31,215,078$
BOZEMAN DEACONESS 3,285,401$ 1,881,495$ 568,082$ 7,007,406$ 290,037$ 152,753$ -$ 12,032$ 13,197,206$
COMMUNITY MED. CTR. MISSOULA 3,219,635$ -$ 216,579$ 2,777,223$ 242,102$ 1,198,556$ -$ 28,284$ 7,682,379$
NORTHWEST HEALTHCARE KALISPELL 3,535,165$ 3,474,164$ 536,629$ 3,212,974$ 22,975$ 44,922$ -$ 109,748$ 10,936,577$
NORTHERN MT MED CTR HAVRE 641,742$ 841,094$ 41,549$ 2,557,481$ 105,447$ 42,732$ -$ 89,751$ 4,319,796$
ST. JAMES BUTTE 2,999,200$ 2,255,505$ 463,483$ 1,278,927$ 58,983$ 35,254$ -$ 64,539$ 7,155,891$
ST. PATRICK MISSOULA 7,768,725$ 3,673,432$ 889,489$ 3,250,659$ 96,149$ 205,738$ 69,963$ 61,900$ 16,016,055$
ST. PETER HELENA 3,108,727$ 1,840,668$ 294,515$ 9,212,668$ 178,770$ 79,493$ -$ 83,974$ 14,798,815$
ST. VINCENT BILLINGS 10,707,594$ -$ 2,961,648$ 5,946,749$ 736,730$ 599,072$ 142,754$ 421,904$ 21,516,451$
Total 2009 57,493,329$ 14,893,534$ 9,435,684$ 48,054,947$ 3,600,881$ 4,127,339$ 2,514,584$ 1,403,892$ 141,524,190$
Total 2008 48,608,755$ 31,667,789$ 9,997,140$ 44,016,542$ 6,402,502$ 4,609,775$ 990,134$ 1,252,431$ 147,545,068$

Appendix 3
Small Hospitals Community Benefits - 2009
FACILITY NAME/CITY CHARITY CARE
UNREIMB.
MEDICAID COST
COMM HEALTH
IMPROVEMENT
SERV./COMM BEN
OPS
SUBSID. HEALTH
SERV.
CONTRIBUTIONS
COMM GRP
HEALTH PROF.
ED. RESEARCH
COMM.
BUILDING TOTAL
CENTRAL MT MED. CENTER LEWISTOWN 371,268$ -$ 16,924$ 600$ 17,119$ 51,397$ -$ 7,078$ 464,386$
COMMUNITY OF ANACONDA 299,210$ 159,441$ 127,384$ 1,706,710$ 29,016$ 3,956$ -$ 4,965$ 2,330,682$
FRANCIS MAHON DEAC. GLASGOW 528,994$ -$ 52,581$ 1,943,618$ 20,000$ 124,654$ -$ 52,075$ 2,721,922$
GLENDIVE MEDICAL CENTER 419,626$ -$ 156,642$ 1,590,306$ 142,079$ 27,865$ -$ 4,459$ 2,340,977$
HOLY ROSARY MILES CITY 1,547,854$ 857,665$ 316,640$ 67,423$ 232,011$ 144,824$ -$ 188,080$ 3,354,497$
LIVINGSTON HEALTHCARE 448,112$ 130,832$ 42,981$ -$ 20,896$ 724$ -$ -$ 643,545$
MARCUS DALY MEMORIAL HAMILTON 463,344$ 575,212$ 209,500$ 2,676,427$ 86,261$ 55,282$ -$ 151,244$ 4,217,270$
NORTH VALLEY WHITEFISH 938,596$ -$ 108,726$ 38,738$ 165,694$ 114,130$ -$ 95,699$ 1,461,583$
SIDNEY HEALTH CENTER 1,295,985$ 384,556$ 54,801$ 2,536,399$ 22,564$ 9,906$ -$ -$ 4,304,211$
ST. JOHN'S LUTHERAN LIBBY 405,401$ -$ 194,920$ -$ 3,825$ -$ -$ -$ 604,146$
ST. JOSEPH POLSON 519,674$ -$ 13,267$ 485$ 14,326$ 6,709$ -$ -$ 554,461$
ST. LUKE COMMUNITY RONAN 195,177$ 111,193$ 30,214$ 102,566$ 42,172$ 132,845$ -$ 12,205$ 626,372$
Total 2009 7,433,241$ 2,218,899$ 1,324,580$ 10,663,272$ 795,963$ 672,292$ -$ 515,805$ 23,624,052$
Total 2008 3,899,003$ 1,136,206$ 969,448$ 5,872,206$ 1,336,975$ 432,548$ -$ 164,648$ 13,811,034$

Appendix 4
Calculation of Value of Tax Exemption on Operating Income – 2009
FACILITY NAME/ CITY
OPERATING
INCOME
FEDERAL INCOME
TAX
STATE INCOME
TAX
ESTIMATED
PROPERTY
TAX
TAX EXEMPT
BOND VALUE
OPERATING TAX
EXEMPTION
BENEFIS GREAT FALLS 15,520,482$ 5,276,964$ 691,437$ 2,061,878$ 1,736,039$ 9,766,318$
BILLINGS CLINIC 4,870,174$ 1,655,859$ 216,966$ 2,506,765$ 1,999,843$ 6,379,434$
BOZEMAN DEACONESS 8,065,301$ 2,742,202$ 359,309$ 38,195$ 743,886$ 3,883,592$
COMMUNITY MED. CTR. MISSOULA 2,957,589$ 1,005,580$ 131,761$ 75,828$ 195,096$ 1,408,265$
NORTHWEST HEALTHCARE KALISPELL 1,642,626$ 558,493$ 73,179$ 11,659$ -$ 643,331$
NORTHERN MT MED CTR HAVRE 1,233,346$ 419,338$ 54,946$ 177$ -$ 474,460$
ST. JAMES BUTTE (2,408,635)$ (818,936)$ (107,305)$ 3,518$ -$ (922,723)$
ST. PATRICK MISSOULA 12,536,520$ 4,262,417$ 558,502$ 757,279$ 741,946$ 6,320,143$
ST. PETER HELENA 3,791,618$ 1,289,150$ 168,917$ 26,011$ 644,358$ 2,128,436$
ST. VINCENT BILLINGS 17,102,274$ 5,814,773$ 761,906$ 1,603,152$ -$ 8,179,831$
CENTRAL MT MED. CENTER LEWISTOWN 42,040$ 14,294$ 1,873$ 13,641$ 31,082$ 60,890$
COMMUNITY OF ANACONDA 1,197,469$ 407,139$ 53,347$ 1,943$ -$ 462,430$
FRANCIS MAHON DEAC. GLASGOW 2,538,345$ 863,037$ 113,083$ 25,187$ 20,605$ 1,021,913$
GLENDIVE MEDICAL CENTER 830,827$ 282,481$ 37,013$ 12,499$ 401,478$ 733,472$
HOLY ROSARY MILES CITY (3,147,463)$ (1,070,137)$ (140,219)$ 46,070$ -$ (1,164,287)$
LIVINGSTON HEALTHCARE 433,915$ 147,531$ 19,331$ 20,250$ -$ 187,112$
MARCUS DALY MEMORIAL HAMILTON (339,574)$ (115,455)$ (15,128)$ 122,333$ 129,558$ 121,308$
NORTH VALLEY WHITEFISH (648,566)$ (220,512)$ (28,894)$ 206,840$ -$ (42,566)$
SIDNEY HEALTH CENTER (2,091,306)$ (711,044)$ (93,168)$ 3,191$ 351,780$ (449,241)$
ST. JOHN'S LUTHERAN LIBBY 1,330,231$ 452,279$ 59,262$ 6,867$ -$ 518,407$
ST. JOSEPH POLSON 309,953$ 105,384$ 13,808$ 51,010$ 134,476$ 304,679$
ST. LUKE COMMUNITY RONAN 1,916,175$ 651,500$ 85,366$ 9,134$ 291,654$ 1,037,653$

Appendix 4
Calculation of Value of Tax Exemption on Total Income – 2009
FACILITY NAME/ CITY TOTAL INCOME
FEDERAL
INCOME TAX
STATE
INCOME TAX
ESTIMATED
PROPERTY TAX
TAX EXEMPT
BOND VALUE
TOTAL TAX
EXEMPTION
BENEFIS GREAT FALLS 14,979,792$ 5,093,129$ 667,350$ 2,061,878$ 1,736,039$ 9,558,396$
BILLINGS CLINIC (16,544,660)$ (5,625,184)$ (737,065)$ 2,506,765$ 1,999,843$ (1,855,641)$
BOZEMAN DEACONESS 12,085,215$ 4,108,973$ 538,396$ 38,195$ 743,886$ 5,429,450$
COMMUNITY MED. CTR. MISSOULA 11,036,905$ 3,752,548$ 491,694$ 75,828$ 195,096$ 4,515,166$
NORTHWEST HEALTHCARE KALISPELL (7,494,772)$ (2,548,222)$ (333,892)$ 11,659$ -$ (2,870,456)$
NORTHERN MT MED CTR HAVRE 2,112,647$ 718,300$ 94,118$ 177$ -$ 812,595$
ST. JAMES BUTTE (2,310,042)$ (785,414)$ (102,912)$ 3,518$ -$ (884,809)$
ST. PATRICK MISSOULA 13,433,825$ 4,567,501$ 598,477$ 757,279$ 741,946$ 6,665,202$
ST. PETER HELENA (3,112,130)$ (1,058,124)$ (138,645)$ 26,011$ 644,358$ (526,401)$
ST. VINCENT BILLINGS 31,966,988$ 10,868,776$ 1,424,129$ 1,603,152$ -$ 13,896,057$
CENTRAL MT MED. CENTER LEWISTOWN 158,501$ 53,890$ 7,061$ 13,641$ 31,082$ 105,675$
COMMUNITY OF ANACONDA 1,489,399$ 506,396$ 66,353$ 1,943$ -$ 574,691$
FRANCIS MAHON DEAC. GLASGOW 3,332,610$ 1,133,087$ 148,468$ 25,187$ 20,605$ 1,327,347$
GLENDIVE MEDICAL CENTER 279,131$ 94,905$ 12,435$ 12,499$ 401,478$ 521,317$
HOLY ROSARY MILES CITY (3,104,442)$ (1,055,510)$ (138,303)$ 46,070$ -$ (1,147,743)$
LIVINGSTON HEALTHCARE 454,984$ 154,695$ 20,270$ 20,250$ -$ 195,214$
MARCUS DALY MEMORIAL HAMILTON 115,328$ 39,212$ 5,138$ 122,333$ 129,558$ 296,240$
NORTH VALLEY WHITEFISH (71,099)$ (24,174)$ (3,167)$ 206,840$ -$ 179,499$
SIDNEY HEALTH CENTER (2,877,496)$ (978,349)$ (128,192)$ 3,191$ 351,780$ (751,570)$
ST. JOHN'S LUTHERAN LIBBY 1,610,425$ 547,545$ 71,744$ 6,867$ -$ 626,156$
ST. JOSEPH POLSON 362,005$ 123,082$ 16,127$ 51,010$ 134,476$ 324,695$
ST. LUKE COMMUNITY RONAN 2,994,023$ 1,017,968$ 133,384$ 9,134$ 291,654$ 1,452,140$

Appendix 5
Amounts Sent to Collection as Percent of Operating Revenue – 2009
FACILITY NAME/CITY
OPERATING
REVENUES
AMOUNT
TURNED TO
COLLECTION
NUMBER OF
ACCOUNTS
TURNED TO
COLLECTION
AVERAGE
AMOUNT PER
INDIVIDUAL
AMOUNT
AS % OF
OP REV
BENEFIS GREAT FALLS 273,722,252$ 8,045,171$ 10957 734$ 2.94%
BILLINGS CLINIC 461,061,821$ 14,790,116$ 7535 1,963$ 3.21%
BOZEMAN DEACONESS 152,800,087$ 9,118,343$ 7018 1,299$ 5.97%
COMMUNITY MED. CTR. MISSOULA 131,084,392$ 7,370,580$ 7470 987$ 5.62%
NORTHWEST HEALTHCARE KALISPELL 211,772,951$ 12,701,213$ 8070 1,574$ 6.00%
NORTHERN MT MED CTR HAVRE 56,397,964$ 3,655,748$ 2235 1,636$ 6.48%
ST. JAMES BUTTE 84,428,771$ 7,146,646$ 6383 1,120$ 8.46%
ST. PATRICK MISSOULA 234,898,295$ 13,541,664$ 12967 1,044$ 5.76%
ST. PETER HELENA 124,147,758$ 7,224,123$ 8702 830$ 5.82%
ST. VINCENT BILLINGS 316,700,985$ 14,990,689$ 6631 1,453$ 4.73%
CENTRAL MT MED. CENTER LEWISTOWN 25,528,832$ 839,114$ 821 1,022$ 3.29%
COMMUNITY OF ANACONDA 27,188,787$ 1,090,669$ 1289 846$ 4.01%
FRANCIS MAHON DEAC. GLASGOW 27,966,867$ 608,086$ 685 888$ 2.17%
GLENDIVE MEDICAL CENTER 36,814,635$ 1,522,107$ 1036 1,469$ 4.13%
HOLY ROSARY MILES CITY 32,104,838$ 3,283,496$ 5438 604$ 10.23%
LIVINGSTON HEALTHCARE 34,947,411$ 3,842,906$ 3483 1,103$ 11.00%
MARCUS DALY MEMORIAL HAMILTON 43,742,019$ 4,941,396$ 2720 1,817$ 11.30%
NORTH VALLEY WHITEFISH 32,885,716$ 3,367,973$ 2865 1,176$ 10.24%
SIDNEY HEALTH CENTER 38,327,973$ 1,381,327$ 1830 755$ 3.60%
ST. JOHN'S LUTHERAN LIBBY 24,562,723$ 990,123$ 739 1,340$ 4.03%
ST. JOSEPH POLSON 22,621,468$ -$ 0 -$ 0.00%
ST. LUKE COMMUNITY RONAN 34,893,889$ 1,920,954$ 4589 419$ 5.51%
Appendix 6
Amounts in Bankruptcy as Percent of Operating Revenues – 2009
FACILITY NAME/CITY
AMOUNT IN
BANKRUPTCY
NO.
ACCOUNTS IN
BANKRUPTCY
AVERAGE
AMOUNT PER
ACCOUNT
AMOUNT AS
% OP REV
BENEFIS GREAT FALLS 312,562$ 350 893$ 0.11%
BILLINGS CLINIC 607,114$ 619 981$ 0.13%
ST. JAMES BUTTE 126,683$ 142 892$ 0.15%
ST. PATRICK MISSOULA 357,168$ 268 1,333$ 0.15%
COMMUNITY MED. CTR. MISSOULA 218,814$ 134 1,633$ 0.17%
ST. PETER HELENA 253,011$ 601 421$ 0.20%
NORTHWEST HEALTHCARE KALISPELL 617,378$ 383 1,612$ 0.29%
BOZEMAN DEACONESS 467,259$ 141 3,314$ 0.31%
NORTHERN MT MED CTR HAVRE 179,566$ 25 7,183$ 0.32%
ST. VINCENT BILLINGS 2,092,288$ 803 2,606$ 0.66%
ST. LUKE COMMUNITY RONAN 4,658$ 31 150$ 0.01%
SIDNEY HEALTH CENTER 5,932$ 17 349$ 0.02%
FRANCIS MAHON DEAC. GLASGOW 4,395$ 15 293$ 0.02%
LIVINGSTON HEALTHCARE 15,232$ 27 564$ 0.04%
ST. JOSEPH POLSON 17,948$ 27 665$ 0.08%
COMMUNITY OF ANACONDA 31,465$ 35 899$ 0.12%
GLENDIVE MEDICAL CENTER 53,227$ 189 2,801$ 0.14%
CENTRAL MT MED. CENTER LEWISTOWN 52,077$ 64 814$ 0.20%
HOLY ROSARY MILES CITY 74,772$ 131 571$ 0.23%
ST. JOHN'S LUTHERAN LIBBY 60,863$ 133 458$ 0.25%
NORTH VALLEY WHITEFISH 99,972$ 74 1,351$ 0.30%
MARCUS DALY MEMORIAL HAMILTON 290,022$ 392 740$ 0.66%
Appendix 7
Average Hospital Prices
FACILITY NAME/CITY
089
SIMPLE
PNEUMONIA
182
ESOPHAGITIS
544
MAJOR JOINT
REPLACEMENT
359
UTERINE &
ADNEXA
PROCEDURE
371
CESAREAN
SECTION
373
VAGINAL
DELIVERY
390
NEONATE WITH
OTHER
COMPLICATIONS
391
NORMAL
NEWBORN
BENEFIS GREAT FALLS -$ 9,709$ 38,185$ -$ 7,159$ 3,894$ 2,428$ 1,520$
BILLINGS CLINIC -$ 8,750$ -$ 12,076$ 11,592$ 5,951$ -$ -$
BOZEMAN DEACONESS -$ 7,522$ 32,189$ 9,667$ 7,875$ 4,443$ 1,969$ 1,594$
COMMUNITY MED. CTR. MISSOULA -$ -$ 33,508$ 13,103$ 11,704$ 6,655$ 3,278$ 1,584$
NORTHERN MT MED CTR HAVRE 15,743$ 7,556$ -$ -$ 9,788$ 5,242$ 2,412$ 2,107$
NORTHWEST HEALTHCARE KALISPELL -$ 9,556$ 26,075$ -$ 11,043$ 4,631$ 2,053$ 1,512$
ST. JAMES BUTTE 13,579$ 9,168$ 41,122$ 12,287$ -$ -$ -$ -$
ST. PATRICK MISSOULA 12,447$ -$ 32,568$ -$ -$ -$ -$ -$
ST. PETER HELENA 12,086$ 8,411$ 28,358$ 9,324$ 8,053$ 3,917$ -$ 1,472$
ST. VINCENT BILLINGS 9,592$ 8,595$ 34,627$ -$ 10,836$ 5,823$ 3,670$ 1,508$
Average 12,689$ 8,658$ 33,329$ 11,291$ 9,756$ 5,069$ 2,635$ 1,614$
CENTRAL MT MED CENTER LEWISTOWN 6,456$ 4,409$ 22,754$ -$ 7,330$ 3,364$ -$ 1,498$
COMMUNITY OF ANACONDA 9,404$ -$ 38,904$ 8,879$ 9,208$ 5,761$ -$ 1,329$
FRANCIS MAHON DEAC. GLASGOW 10,984$ -$ 31,130$ 9,783$ 9,160$ 4,677$ 2,586$ 1,464$
GLENDIVE MEDICAL CENTER 8,064$ 5,258$ 50,104$ 9,132$ 9,325$ 4,337$ -$ 1,359$
HOLY ROSARY MILES CITY 13,733$ 6,839$ 39,395$ 11,843$ 10,114$ 4,624$ -$ 1,449$
LIVINGSTON HEALTHCARE 9,454$ 3,672$ 40,227$ 10,281$ 8,951$ 4,054$ 1,837$ 1,507$
MARCUS DALY MEMORIAL HAMILTON 13,112$ 12,011$ 44,756$ -$ -$ 6,405$ -$ 1,935$
NORTH VALLEY WHITEFISH 16,117$ -$ 24,102$ 13,965$ 11,212$ 5,960$ 4,562$ 2,346$
SIDNEY HEALTH CENTER 9,260$ 6,335$ -$ -$ 8,691$ 4,948$ -$ 1,340$
ST. JOHN'S LUTHERAN LIBBY 11,559$ 6,534$ 30,974$ -$ -$ 4,814$ 2,296$ 1,202$
ST. JOSEPH HOSPITAL POLSON 7,368$ 5,247$ -$ 8,473$ 7,619$ 4,910$ 2,429$ 1,602$
ST. LUKE COMMUNITY RONAN 10,998$ 7,244$ -$ -$ 10,818$ 6,095$ 2,271$ 1,762$
Average 10,542$ 6,394$ 35,816$ 10,336$ 9,243$ 4,996$ 2,663$ 1,566$
*Blank spaces indicate that the DRG is not among the hospital's 10 highest volume cases

End Notes:
1. “Nonprofit Hospitals: Variations in Standards and Guidance Limits Comparison of How Hospitals Meet Community Benefit Requirements”, Government Accountability Office, Sept. 2008.
2. “Hospital Compliance Project Interim Report”, Internal Revenue Service, July 2007.
3. Modern Healthcare, February 17, 2011.
4. Modern Healthcare, March 21, 2011.
5. Montana Department of Labor and Industry, Labor Force Statistics, 2009.
6. Taken from “Thinking Strategically About Community Benefit”, Julie Trocchio, ACHE Congress on Leadership, March 2011.
7. The IRS instructions referenced are: “In order to qualify as a subsidized health service, the organization must provide the service because it meets an identified community need. A service meets an identified community need if it is reasonable to conclude that if the organization no
longer offered the service, the service would become unavailable in the community, the community’s capacity to provide the service would be below the community’s need, or the service would become the responsibility of government or another tax exempt organization.” (Emphasis added). Instructions for Schedule H, Form 990, Department of the Treasury, 2009.
8. Due to difficulties in identifying the value of property taxes excluded by the Department of Revenue, this amount is an estimate using 2009 and 2008 data.
9. Modern Healthcare, December 13, 2010.
10. “Uncompensated Care Fact Sheet”, American Hospital Association, December, 2010.
11. Taken from “Instructions for Schedule H (Form 990)”, Internal Revenue Service, 2008 and “A Guide for Planning and Reporting Community Benefit”, Catholic Health Care Association, 2006.