Embed Size (px)
Citation preview

Montana’s statewide longitudinal data system Project
Montana’s Statewide Longitudinal
Data System(SLDS)
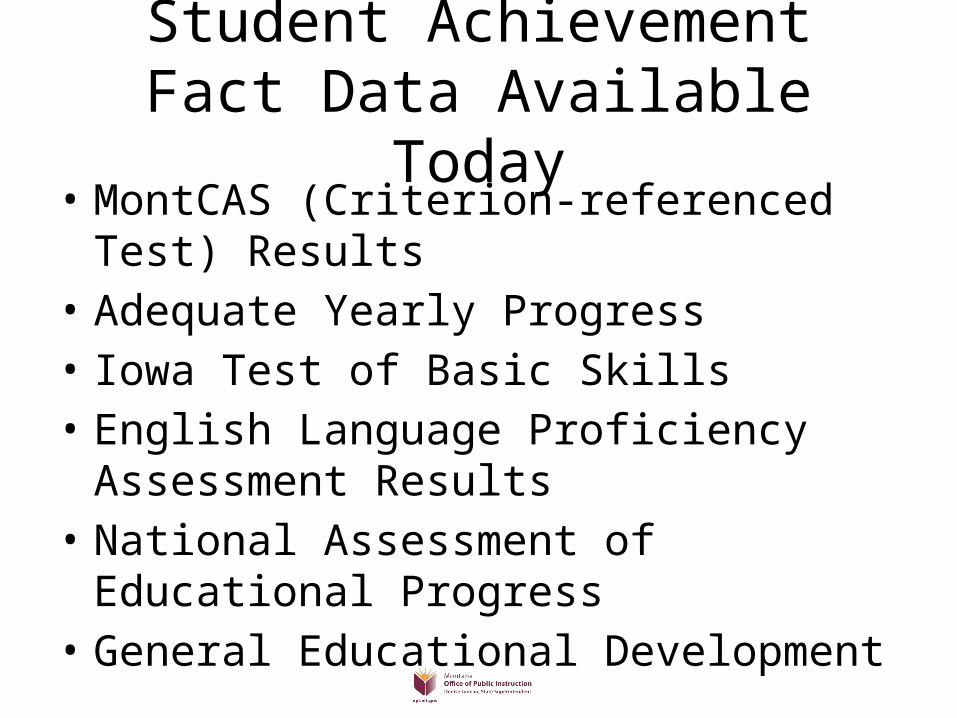
Student Achievement Fact Data Available Today
• MontCAS (Criterion-referenced Test) Results• Adequate Yearly Progress• Iowa Test of Basic Skills• English Language Proficiency Assessment
Results• National Assessment of Educational Progress• General Educational Development
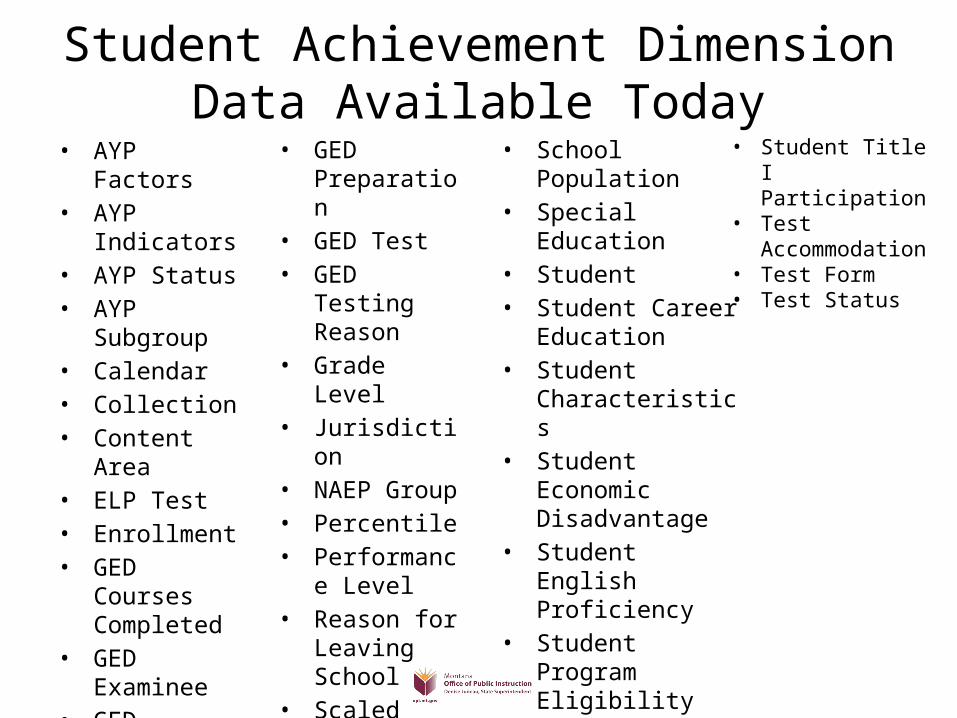
Student Achievement Dimension Data Available Today
• AYP Factors• AYP Indicators• AYP Status• AYP Subgroup• Calendar• Collection• Content Area• ELP Test• Enrollment• GED Courses
Completed• GED Examinee• GED Examinee
History• GED Option
• GED Preparation
• GED Test• GED Testing
Reason• Grade Level• Jurisdiction• NAEP Group• Percentile• Performance
Level• Reason for
Leaving School• Scaled Score• School Agency
• School Population• Special Education• Student• Student Career
Education• Student
Characteristics• Student Economic
Disadvantage• Student English
Proficiency• Student Program
Eligibility• Student Program
Participation
• Student Title I Participation
• Test Accommodation
• Test Form• Test Status
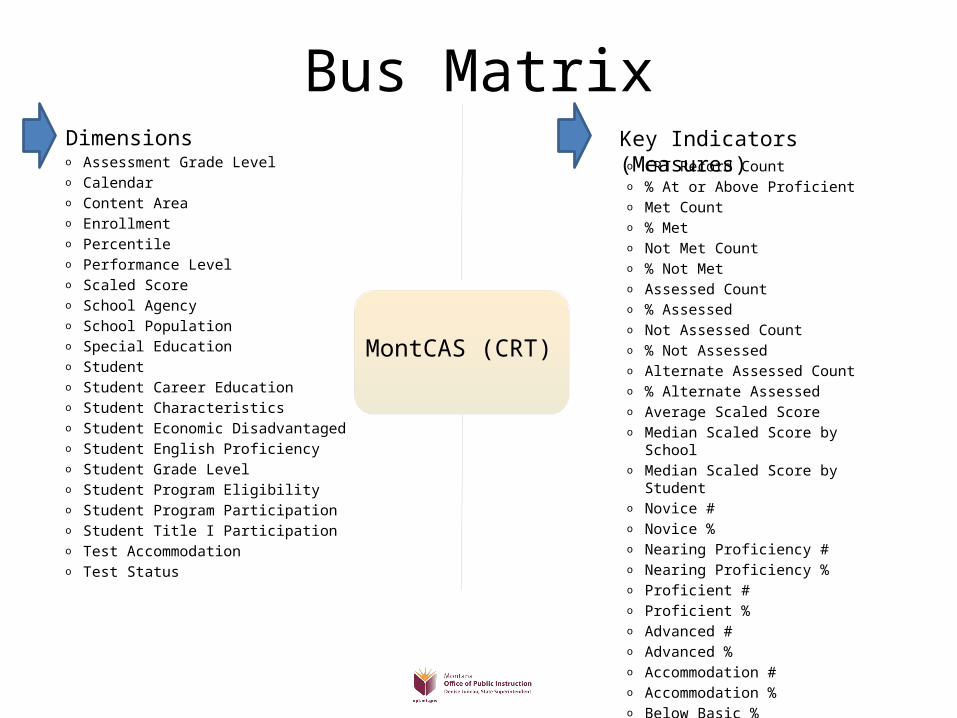
Bus MatrixDimensionso Assessment Grade Levelo Calendaro Content Areao Enrollmento Percentileo Performance Levelo Scaled Scoreo School Agencyo School Populationo Special Educationo Studento Student Career Educationo Student Characteristicso Student Economic Disadvantagedo Student English Proficiencyo Student Grade Levelo Student Program Eligibilityo Student Program Participationo Student Title I Participationo Test Accommodationo Test Status
MontCAS (CRT)
Key Indicators (Measures)o CRT Record Counto % At or Above Proficiento Met Counto % Meto Not Met Counto % Not Meto Assessed Counto % Assessedo Not Assessed Counto % Not Assessedo Alternate Assessed Counto % Alternate Assessedo Average Scaled Scoreo Median Scaled Score by Schoolo Median Scaled Score by Studento Novice #o Novice %o Nearing Proficiency #o Nearing Proficiency %o Proficient #o Proficient %o Advanced #o Advanced %o Accommodation #o Accommodation %o Below Basic %
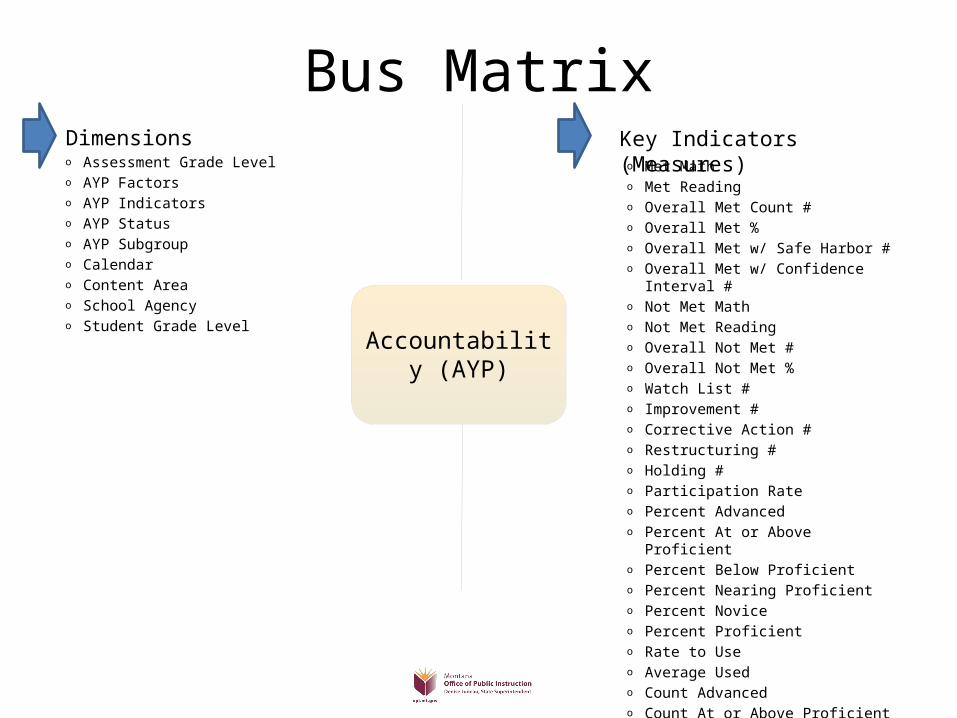
Bus MatrixDimensionso Assessment Grade Levelo AYP Factorso AYP Indicatorso AYP Statuso AYP Subgroupo Calendaro Content Areao School Agencyo Student Grade Level
Accountability (AYP)
Key Indicators (Measures)o Met Matho Met Readingo Overall Met Count #o Overall Met %o Overall Met w/ Safe Harbor #o Overall Met w/ Confidence
Interval #o Not Met Matho Not Met Readingo Overall Not Met #o Overall Not Met %o Watch List #o Improvement #o Corrective Action #o Restructuring #o Holding #o Participation Rateo Percent Advancedo Percent At or Above Proficiento Percent Below Proficiento Percent Nearing Proficiento Percent Noviceo Percent Proficiento Rate to Useo Average Usedo Count Advancedo Count At or Above Proficient
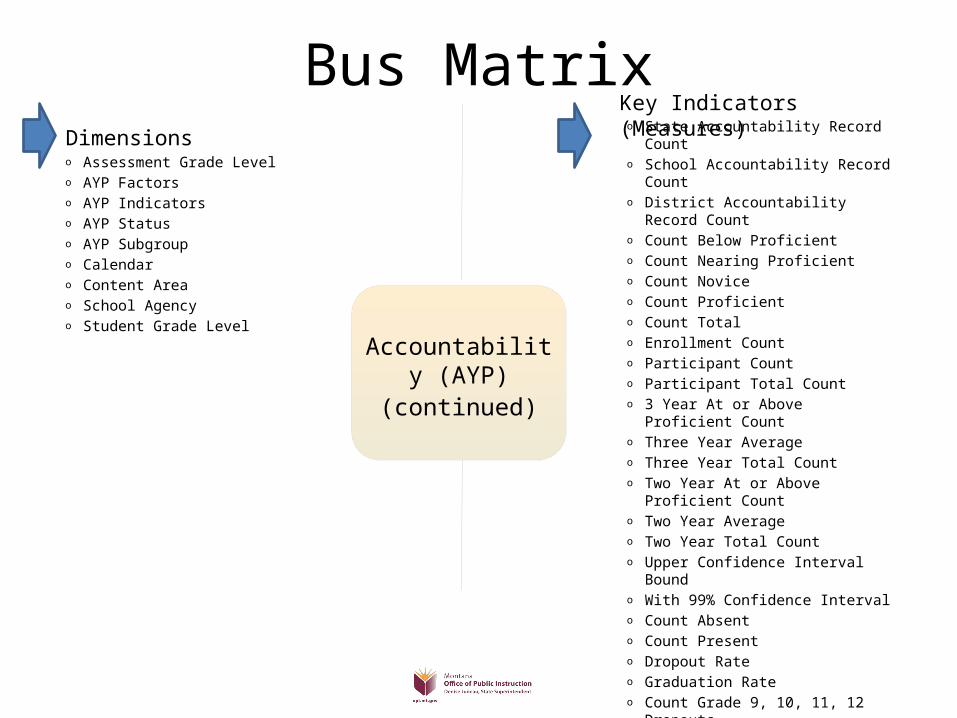
Bus MatrixDimensions
Accountability (AYP)
(continued)
Key Indicators (Measures)o State Accountability Record Counto School Accountability Record
Counto District Accountability Record
Counto Count Below Proficiento Count Nearing Proficiento Count Noviceo Count Proficiento Count Totalo Enrollment Counto Participant Counto Participant Total Counto 3 Year At or Above Proficient
Counto Three Year Averageo Three Year Total Counto Two Year At or Above Proficient
Counto Two Year Averageo Two Year Total Counto Upper Confidence Interval Boundo With 99% Confidence Intervalo Count Absento Count Presento Dropout Rateo Graduation Rateo Count Grade 9, 10, 11, 12
Dropoutso Count Graduateso Count Non Standard Graduateso Count Other High School
Completerso Total Dropouts Plus Graduates
o Assessment Grade Levelo AYP Factorso AYP Indicatorso AYP Statuso AYP Subgroupo Calendaro Content Areao School Agencyo Student Grade Level
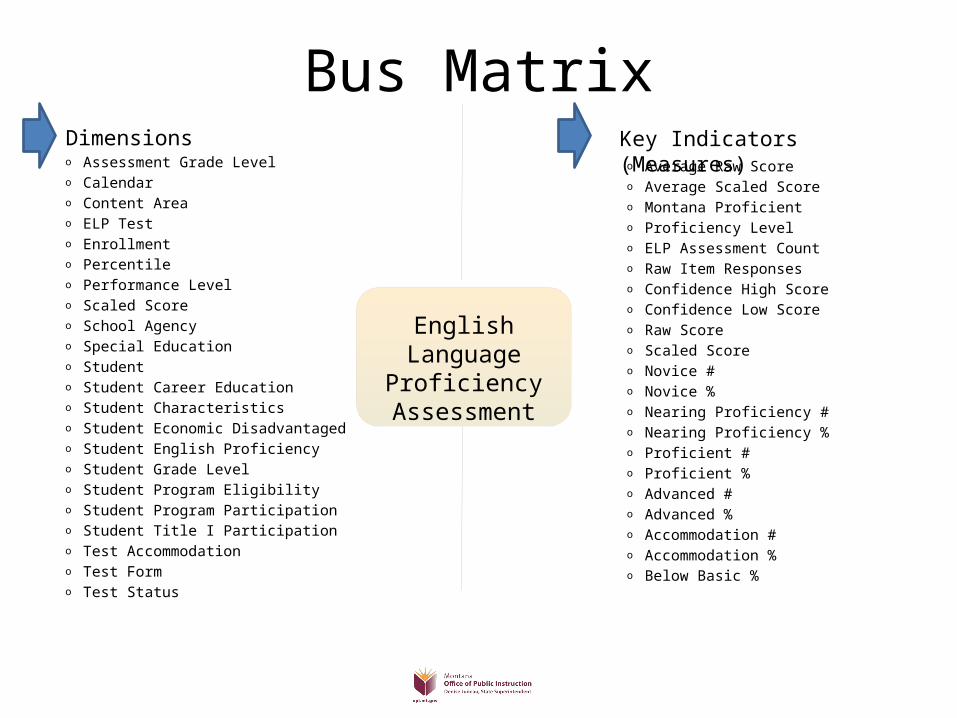
Bus MatrixDimensionso Assessment Grade Levelo Calendaro Content Areao ELP Testo Enrollmento Percentileo Performance Levelo Scaled Scoreo School Agencyo Special Educationo Studento Student Career Educationo Student Characteristicso Student Economic Disadvantagedo Student English Proficiencyo Student Grade Levelo Student Program Eligibilityo Student Program Participationo Student Title I Participationo Test Accommodationo Test Formo Test Status
English Language Proficiency Assessment
Key Indicators (Measures)o Average Raw Scoreo Average Scaled Scoreo Montana Proficiento Proficiency Levelo ELP Assessment Counto Raw Item Responseso Confidence High Scoreo Confidence Low Scoreo Raw Scoreo Scaled Scoreo Novice #o Novice %o Nearing Proficiency #o Nearing Proficiency %o Proficient #o Proficient %o Advanced #o Advanced %o Accommodation #o Accommodation %o Below Basic %
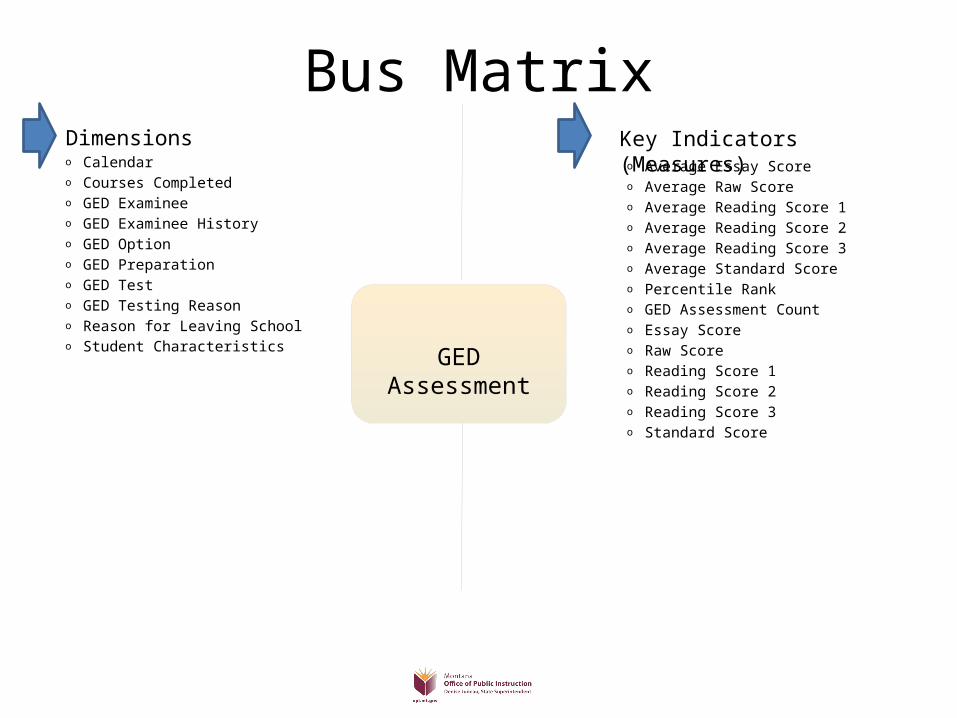
Bus MatrixDimensionso Calendaro Courses Completedo GED Examineeo GED Examinee Historyo GED Optiono GED Preparationo GED Testo GED Testing Reasono Reason for Leaving Schoolo Student Characteristics GED
Assessment
Key Indicators (Measures)o Average Essay Scoreo Average Raw Scoreo Average Reading Score 1o Average Reading Score 2o Average Reading Score 3o Average Standard Scoreo Percentile Ranko GED Assessment Counto Essay Scoreo Raw Scoreo Reading Score 1o Reading Score 2o Reading Score 3o Standard Score
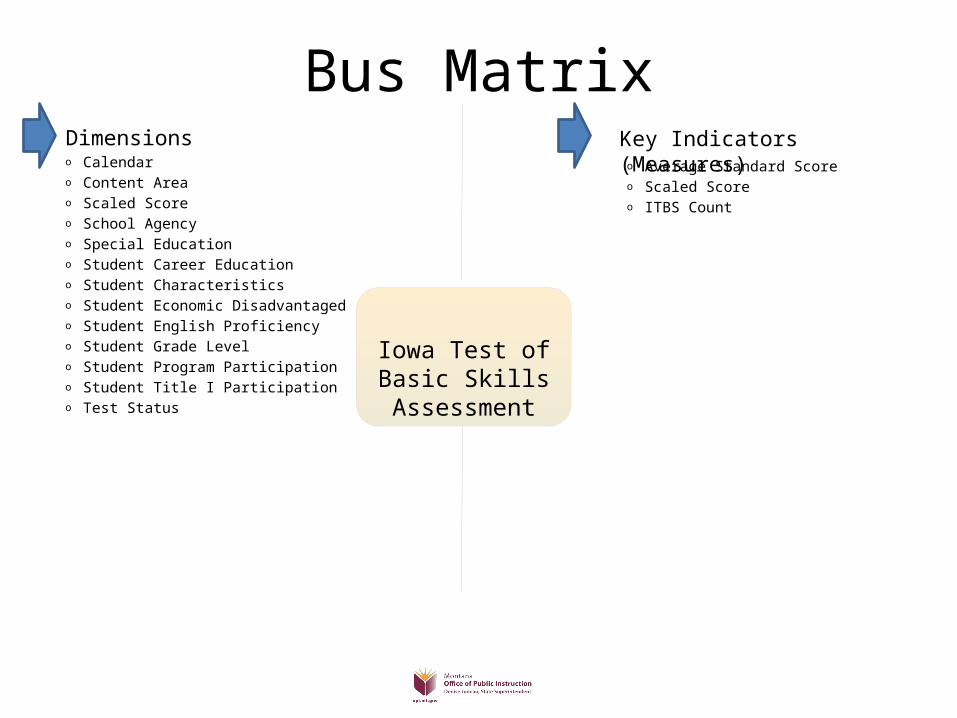
Bus MatrixDimensionso Calendaro Content Areao Scaled Scoreo School Agencyo Special Educationo Student Career Educationo Student Characteristicso Student Economic Disadvantagedo Student English Proficiencyo Student Grade Levelo Student Program Participationo Student Title I Participationo Test Status
Iowa Test of Basic Skills Assessment
Key Indicators (Measures)o Average Standard Scoreo Scaled Scoreo ITBS Count
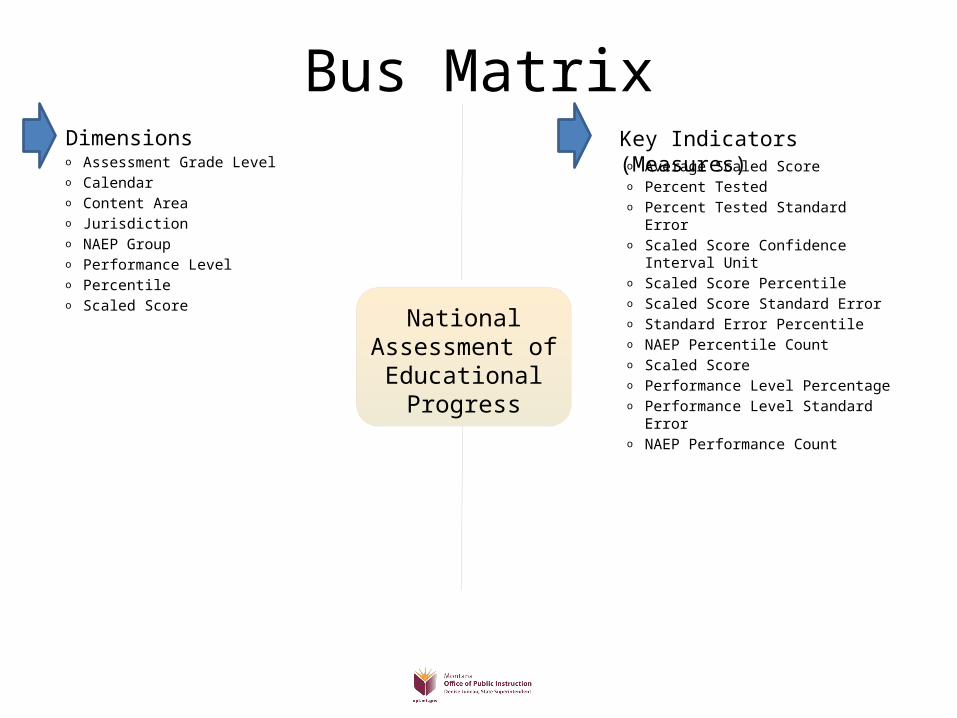
Bus MatrixDimensionso Assessment Grade Levelo Calendaro Content Areao Jurisdictiono NAEP Groupo Performance Levelo Percentileo Scaled Score
National Assessment of
Educational Progress
Key Indicators (Measures)o Average Scaled Scoreo Percent Testedo Percent Tested Standard Erroro Scaled Score Confidence Interval
Unito Scaled Score Percentileo Scaled Score Standard Erroro Standard Error Percentileo NAEP Percentile Counto Scaled Scoreo Performance Level Percentageo Performance Level Standard Erroro NAEP Performance Count
FURTHER QUESTIONS?
CONTACT THE OPI HELP DESK: [email protected]
DOWNLOAD THE SLIDES HERE:HTTP
://GEMS.OPI.MT.GOV/TRAININGCENTER/
Thank You!