Embed Size (px)
Citation preview


Mono Basin “Synthesis of Instream Flow Recommendations” Public Review Draft Report LADWP Comments March 30, 2010
SUMMARY OF COMMENTS
Mono Basin Exports Export allocations and conditions are specified in Order 98-05 and at this time LADWP is allowed 16,000 acre-feet (af) annually for export. The Stream Scientists have recommended no exports before the end of peaking operations and no exports if Grant Lake Reservoir (GLR) falls below 11,500 af. In addition, their recommendations severely limit exports during dry years and will require drawing from storage to meet requirements in extremely dry years. These conditions are not acceptable to LADWP. Also, although LADWP has not been diverting from Walker and Parker creeks in recent years, LADWP does not accept the recommendation of “continued curtailment of diversions”. The option to divert from Parker and Walker creeks should remain open. As mentioned earlier, Mono Basin exports have always been an important component of the overall water supply and operations of the Los Angeles Aqueduct. There are a number of environmental projects and conditions that must be accounted for downstream of Mono Basin that could be adversely affected by restrictions of both water supplies and timing of exports. These include Crowley Lake operations, the Owens River Gorge Rewatering, the Lower Owens River Project (LORP), Owens Lake Dust Control Project, irrigation demands, and environmental enhancement projects under the Inyo/LA agreement and 1997 Memorandum of Understanding. Mono Basin decisions of the past have also received significant criticisms regarding the failure to recognize down-system impacts. For instance the Upper Owens River thermal problems are exacerbated during dry years and with zero exports this situation will only worsen. Spawning runs out of Crowley Lake will be greatly inhibited due to the fish barrier (thermal barrier) created by Hot Creek’s influence on the river and lack of moderating water from above. Irrigation on the Upper Owens River for private ranches and LADWP ranchers also becomes severely restricted. Crowley Lake experiences severe algal blooms leading to water quality issues that emanate throughout the whole Owens River system. From a statewide perspective, water resources are becoming scarcer while an increasing human population is creating ever higher demands. Water that LADWP cannot receive from the Mono Basin would have to be replaced by deliveries from elsewhere in the State (i.e. Delta) as Los Angeles still needs the water and the State’s water systems are integrally tied together. Mono Basin exports have become even more valuable as the State’s water availability scenarios have changed dramatically since Order 98-05. In addition, environmental demands for water in the Eastern Sierra (LORP, Owens Lake Dust Control, etc...) have reduced LADWP’s average annual exports to less than half of those from the 1971-1988 period. These factors make it critical that LADWP meet the environmental goals of the Mono Basin in “an efficient and reasonable manner.”
3 of 23

Mono Basin “Synthesis of Instream Flow Recommendations” Public Review Draft Report LADWP Comments March 30, 2010
Forecast A May 1st forecast would be impractical for several reasons. To begin with, our forecasting models with their polynomial equations and their associated constants and coefficients, were developed using April 1st snow survey information. To input May 1st snow survey information into them would be inherently inaccurate. In addition, in the past 60 years, there have been no May 1st snow surveys performed, with the exception of a couple of extremely wet years; so there exists no database with which to develop May 1st forecasting equations. Additionally, even if May 1st runoff equations for Mono Basin could be somehow developed, like their April 1st forecast counterparts, they would depend on the snow courses in the Mono Basin, which are measured by Southern California Edison (SCE), and SCE does not perform May 1st snow surveys. Further, a May 1st forecast is unnecessary as illustrated by Table 2 in Appendix A-5. During the 38-year period from 1970 to 2008, the April 1st runoff forecast only overestimated the runoff year-type twice and underestimated the runoff year-type three times. As a surrogate for the May 1st forecast, LADWP proposes the following: if the April 1st forecast is within +/- 2.5 percent of a year-type border, LADWP will monitor April’s precipitation data, using the Cain Ranch precipitation station, to decide if a May 1st update to the April 1st forecast would be useful. If the April precipitation is less than half of the median April precipitation, the lower year type will be used; if the April precipitation is more than twice the median April precipitation, the higher year type will be used; if the April precipitation falls between 50 percent and 200 percent of the median April precipitation, then the actual April 1st forecast will be used. We suggest using the Cain Ranch precipitation station, as that station is operated by LADWP and is consistently maintained and read, as opposed to the Gem Lake precipitation station which is operated by SCE, and which has not been read in several years. Southern California Edison Since SCE operates reservoirs upstream of LADWP’s facilities for their hydropower generation, hence regulating flows, LADWP would like to emphasize that without SCE’s cooperation in releasing greater peak floods, the new peak prescriptions cannot be met. LADWP plans to approach SCE and request its cooperation to whatever extent possible. However, LADWP cannot compel such cooperation, as SCE must operate within its own Federal Energy Regulatory Commission (FERC) licensing requirements. The SWRCB’s and/or the State’s assistance in this matter would greatly be appreciated. Finally, it must be recognized that the pre-1941 condition of the Mono Basin included SCE operations. Excess Water Additionally, we are concerned with the proposed use of “excess” water that should be available for export in the “Post-Transition” period. This excess, on average, is 16,204 af (based on Table 6-3 on page 114 using negative excess values being converted to zero) with a range of 0 in some dry years to 50,000 af
4 of 23

Mono Basin “Synthesis of Instream Flow Recommendations” Public Review Draft Report LADWP Comments March 30, 2010
during extreme wet years. Because Mono Lake may not reach 6,391 ft soon, it is very likely that the transitional period will continue for more than 10 years. It is suggested by the report to prolong the snowmelt bench for Rush Creek and also stated “But absence of this excess stream flow in post-transition years with higher exports will not cause adverse conditions in Rush Creek”. First, a clear guideline for this additional release is necessary. A prolonged bench alone in Rush Creek could adversely affect fish as the snowmelt bench will replace the summer and fall base flows except in Dry runoff years, and in 8 out of 19 modeled years the bench will continue into the winter base flow. Second, the prolonged snowmelt bench will elevate the summer base flows, resulting in higher soil moisture availability throughout the summer. This, in turn, could result in expansion of the riparian patches beyond the limits that would otherwise be imposed by limited water availability. If the riparian acreage were to increase as a result of the prolonged benches, subsequent shrinkage or die back upon return to the normal streamflow regime could be considered as an “environmental setback,” triggering a demand for restoration of the excess release, which would limit LADWP’s export of water to which it would otherwise be entitled. Rush Creek: Ramping Ramping rates need to be 10 cubic feet per second (cfs) or 10 percent whichever is greater for Rush Creek from GLR. The eight foot gate used to operate flows out of GLR is not suited for small changes in flows. Once the gate is moved during a flow change, the gate must be seated and the seating of the gate by itself can change flows by a few cfs. Also, the flow meter can have a margin of error up to a few cfs, again causing problems with assuring a specific flow down the Mono Gate One Return Ditch (MGORD). With very small flow changes, trying to unseat a massive gate, slightly move it and reseat it, and then waiting several hours for the flows to make their way to the MGORD, all in an environment where flow measurement error is greater than the actual flow change, is impractical, especially in light of the inability to define the ecological implications of a given flow difference, such as that between 35 and 41 cfs, for instance. Flow changes of 10 cfs increments are the smallest that can be made to the MGORD in a reliable and operationally reasonable fashion. Window of Acceptable Flows The analyses performed allowing for some variations in flows that translate to a plus/minus allowable stage change of 2.5 percent (total of 5 percent) were well done and are acceptable to LADWP. Normal Year Peak Requirement of 380 cfs Analyses by the Stream Scientists appear to have pinned the normal year peak flow requirement at 380 cfs. 380 cfs was the MAXIMUM designed flowrate of the MGORD when the ditch was regraded to increase the capacity in 2001. Since then the growth of vegetation, sediment deposits, scouring in areas, rodent holes etc have adversely impacted the flow capacity. Marked rock experiments, bedload sampling, groundwater
5 of 23

Mono Basin “Synthesis of Instream Flow Recommendations” Public Review Draft Report LADWP Comments March 30, 2010
monitoring, and floodplain inundation all point to a bankfull flowrate for Lower Rush Creek of 325 to 350 cfs. Equally important is that the new SEF (Stream Ecosystem Flow) of 380 cfs down the MGORD is not attainable. First, the outlet pipe out of GLR has a maximum design flow capacity of 371 cfs. Second, LADWP’s engineers and hydrology team agree that the MGORD can safely handle only 350 cfs. The main concerns are that 1) at 380 cfs the MGORD is completely full and puts maximum stress on the berm; 2) there are several historical seeps through which water flows out of and under the MGORD; and 3) there continues to be a problem with gophers burrowing through the berm which lead to leaks…all of which heightens the possibility that at flows of 380 cfs a breach could dewater Rush Creek. Flow Scenarios for Different Water Year Types LADWP proposes three modifications to the flow scenarios proposed by the Stream Scientist for Rush Creek: A. Dry Normal I and Dry Normal II runoff years should be eliminated and
replaced with Dry Normal:
Two Dry Normal year types are biologically and ecologically unnecessary and simply increase operational demands. Instead there should only be a Dry Normal year type with no peaking flows and a recurrence interval window between 80 and 60 percent of normal runoff.
The objectives of the proposed 200 cfs for 3 days peak flow for Dry Normal Type II include minor geomorphic works (gravel mobilization and sediment deposition in the point bars), off channel stream flow connectivity, riparian regeneration and shallow groundwater recharge. However, the gravel mobilization threshold (200 to 250 cfs) is met only below the Narrows and there are no data presented to support the connectivity threshold. Further, three days of surface water connection could be detrimental to the fish population. During redd (spawning nest) surveys conducted in 2009, only four of redds (14 percent) were found in the lower section of Rush Creek while 25 (86 percent) were found in Upper Rush including in Rock Garden and MGORD. Also very minimum shallow groundwater recharge would occur during a three day peak flow since the water table elevation is closely related to the stage height of the channel, and the water table quickly recedes when peak flows are dropped (Figure C-10 and C-11). According to the successful germination criteria in page 97, the regeneration can occur in interfluves/depression within aggraded floodplain without a side channel and emergent floodplains and aggraded floodplains with side channels. But the proposed duration of the peak is so short that it is very unlikely to achieve seedling establishment in those geomorphic surfaces because of quickly receding water table and also scouring in subsequent years for seedlings in the emergent floodplain and channel margins. Besides, successful regeneration of woody riparian species is known to occur in wet years with approximately 5-10 year periodicity (Baker 1990, Stromberg et al. 1991, Scott et al. 1997, Stromberg 1998,
6 of 23

Mono Basin “Synthesis of Instream Flow Recommendations” Public Review Draft Report LADWP Comments March 30, 2010
Lytle and Merritt 2004), and often driven by decadal or longer climatic cycles (Baker 1990, Hauer et al. 2007). Wetter years should suffice this regeneration cycle. Thus eliminating 200 cfs for three day will not adversely affect the Rush Creek ecosystem. Instead, the water would be more beneficially used by filling or raising the GRL level to augment supplies of cooler water. By maintaining GLR full, the turbidity and temperature issues can be alleviated or eliminated.
B. In Dry Normal, (Stream Scientists’ Dry Normal Type I for SEFs), the spring bench
should be lowered to 70 cfs from 80 cfs.
The 80 cfs riparian threshold is based only on the 8 Channel section of Rush Creek. There are some problems with generalizing the results from this reach. A tentatively drawn potentiometric surface map in the reach indicates the section is losing water with very steep hydraulic gradient between the stream and piezometer (Figure C-9 to C-11). The water table elevation at the piezometer 8C-5 is constantly lower than the main channel surface water elevation, ranging from a difference of one foot during peak discharge to more than 4 ft during the low flows, at a distance of around 100 ft as shown Figure C-10. The interpretation of the data shown in Figure C-17 to C-21 may not be accurate, as the drop of the water table seems to occur around 60 cfs rather than 80 cfs. Moreover, the five-foot threshold to the depth to the water table in Figure C-6 is questionable because the number was calculated using the horizontal plane extending from the 91 cfs surface water elevation. The actual value of the depth to the water table should be larger than that shown in Figure C-6. For instance, in the 8 Channel section, the stream is losing water according to the stage height and piezometer comparison shown in the Figure C-10 and C-11. When wells along the same cross section are compared (8C-5 and 8C-6), the water table is lower at 8C-6 (piezometer located further away from the main channel) most of the year even with perennial flows on 8 Channel, thus further supporting the non-horizontal plane of the water table (interestingly Figure C-11, 8C-1 and 8C-3 are not presented to compare to 8C-2 and 8C-4 respectively for comparison along the same transect). In addition, steepness of hydraulic gradient changes with discharge due to changing an aquifer storage. The aerial photos were taken after the peak during the receding limb (from Appendix A-1, a peak for Rush was in the beginning of June) with larger storage. Thus, the water table levels during 91 cfs, even with properly modeled water table elevation, reflect the depth to the water table at the discharge only during the receding limb, but not at other times of the year, particularly in the mid to late summer. The depth thresholds should be greater than 5 feet for riparian patches. Most of the water table elevation is maintained within 6 feet of the capillary fringe in all the piezometer figures even during low flow seasons. Therefore, there will be very little effect, if any, on riparian plant communities if the spring bench is lowered to 70 cfs from 80 cfs.
C. In Dry runoff years, the spring bench should be lowered to 40 cfs from 70 cfs
In 2008, when the average flow between May 1 and July 26 (the snow melt bench period proposed for SEFs) was 42.7 cfs, no dieback was observed in Rush Creek.
7 of 23

Mono Basin “Synthesis of Instream Flow Recommendations” Public Review Draft Report LADWP Comments March 30, 2010
Figure C-10 shows the water table elevation never dropped 4 ft below the ground level when the average daily discharges ranged from 30 cfs to 40 cfs between December 19 and March 31. The discharges of proceeding four month period ranged between 15 and 50 cfs, and the flow was as low as 14.6 cfs before December 19, suggesting the water table elevation can be sustained within the “riparian threshold” by 40 cfs without prior recharge of the groundwater. Figure C-12 and C-13 also show the water table level being within 5 feet of the capillary fringe in 2008. Even if the water table elevation were to drop more than 5 feet from the ground level, the riparian vegetation should be able to survive. The 5 foot threshold presented in Figure C-6 may not accurately represent the depth to the water table in general; an actual value of the depth to the water table should be larger than that shown in Figure C-6. A steep hydraulic gradient between the main channel and piezometers is observed in the “representative reach” of Rush Creek (Channel 8 section). Thus, the horizontal plane extension does not represent what the water table elevation should be, and the depth to the water table should be greater than five feet for many patches shown in Figure C-6. This would explain why no dieback was observed during the average flow of 42.7 cfs during the would-be snow bench period of 2008 even though the water table or capillary fringe may have dropped 5 feet below the ground level.
Lee Vining Creek: Spring Snowmelt Diversion Rates In order to operate Lee Vining Creek Intake and Conduit as recommended in the Synthesis Report, LADWP will need to install another Langemann Gate in the Lee Vining Conduit and perform programming to tie communications of both Langemann Gates back to the flume above. Other upgrades will be needed to replace the Lee Vining Conduit steel grizzlies, as they catch debris before it goes into the conduit and they are corroding. LADWP will need two years from when the new operations are finalized in order to complete any installations of upgrades. The one cfs diversion rates for the April 1 to September 30 diversion period as presented in Table 2-6 in the Synthesis Report are not operationally possible. As a result LADWP requests that five cfs increments be used instead (as shown in the table below). This will allow for easier programming, accuracy, troubleshooting of the final structures, and help reduce wear and tear on LADWP facilities. With varying creek flow, the technology and accuracy of the control gates are within plus or minus 5 percent of the flow (or 2 cfs, whichever is greater). Finally, at flow rates above 250 cfs LADWP should be able to divert a consistent 50 cfs 1) to maintain a fuller GLR; 2) to ensure a smooth hydrograph below the intake; and 3) because the downstream geomorphic work performed by the higher peak flows will be minimally impacted by a decrease of 50 cfs.
8 of 23

Mono Basin “Synthesis of Instream Flow Recommendations” Public Review Draft Report LADWP Comments March 30, 2010
LADWP Proposed Diversion Table: (Adapted from Table 2-6 of Synthesis Report)
Lee Vining ‘Above Intake’ Flow (cfs)
Conduit Diversion Flow (cfs)
30 – 34 0 35 – 39 5 40 – 49 10 50 – 79 15 80 – 99 20
100 – 129 25 130 – 169 30 170 – 199 35 200 – 239 40 240 – 249 45
250 and Above 50 LADWP is concerned, however, that the entire analysis that created Table 2-6 is taken from a SINGLE cross section that is highly controlled and partially man-made and does not have a complete rating curve (does not have data through the entire range of flows). A better analysis would recognize the fact that each cross section will exhibit different characteristics and perhaps using a composite rating curve may provide for a wider range of conditions through a wider range of locations at the various flow rates. Termination Criteria and Monitoring: LADWP agrees with the Stream Scientists’ suggestion that “the current termination criteria specified in Order 98-07 have served their purpose ….” (Executive Summary page 3, 2nd paragraph). Also, LADWP understands and agrees that a monitoring program will be necessary to determine the efficacy of the new flow regimes. However, LADWP is concerned that the proposed monitoring program is more extensive than the existing program and that there is no specified end date. We propose the following changes to the monitoring described in the Synthesis Report:
A. Hydrology and Water Temperature Groundwater level and water temperature monitoring that is already in place would be continued. One additional data logger would be added to the Rush Creek 10-Channel piezometer array and one additional data logger to the Lee Vining Creek ‘C’ piezometer array set to record at hourly intervals. Four new Onset Pro V2 stream temperature data loggers would be deployed. The locations of these loggers would be Lee Vining Conduit at the head of the 5-Siphons Bypass, the confluence of the 5-Siphons Bypass with Rush Creek, Rush Creek immediately upstream of Parker Creek, and at Mono Gate One. Both the piezometer and stream temperature monitoring would be discontinued after five years. This should provide ample data to assess how the SEFs are affecting the hydrology and water temperatures.
9 of 23

Mono Basin “Synthesis of Instream Flow Recommendations” Public Review Draft Report LADWP Comments March 30, 2010
B. Grant Lake Reservoir
Grant Lake Reservoir temperature and dissolved oxygen monitoring would be conducted for three years to update the Cullen and Railsback thermal gradient profiles and the Stream Temp model.
C. Streamflow Gauging
Flow measurement will be conducted in the 5-Siphons Bypass channel during the experimental release to determine if there are any flow losses compared to what is being measured at the Lee Vining Conduit so that the temperature model can be updated. Monthly synoptic stream discharges on Rush and Lee Vining Creeks will also be continued for two years. The two years should show what sections of the creeks are gaining and what sections are losing. With the new synoptic data, the the SEFs can be fine-tuned, if necessary.
D. Rush Creek County Road Gauge
The Rush Creek County Road gauging station would not be re-operated. The area is too hydrologically unstable and the cross section changes too much to provide dependable data.
E. Aerial/Satellite Photography
Imagery would be one foot or better resolution, in true color as a single 4-band (red, green, blue, near infra-red). These four bands would be collected simultaneously with identical look angles, and precisely registered. Aerial photos would be obtained at five-year intervals until 2025.
F. Ground Photography
Ground photography would be continued at five year intervals and until 2020.
G. Riffle Crest Elevations Riffle crest thalweg elevations would not be surveyed (see K. Side-Channel Maintenance).
H. Sediment Bypass Operations
The sediment bypass plan already in place would be followed.
I. Trout Habitat Surveys Habitat typing and pool surveys would be continued on both Rush Creek from the Narrows to Mono Lake and Lee Vining Creek covering the 10,000 ft of channel originally surveyed in RY2008. Surveys would be conducted at five-year intervals and would be discontinued after 2025.
The three sampling periods should provide adequate habitat and pool data to determine how the SEFs are affecting both creeks.
10 of 23

Mono Basin “Synthesis of Instream Flow Recommendations” Public Review Draft Report LADWP Comments March 30, 2010
11 of 23
J. Riparian Vegetation Acreage Riparian vegetation would be mapped on 1 ft pixel resolution or better aerial photographs in years 2015 and 2020. Riparian vegetation would not be field-mapped. If there is no significant change in riparian cover between 2015 and 2020, riparian vegetation mapping would be discontinued in year 2020. In dry years, qualitative visual surveys would be conducted around piezometers arrays to determine whether riparian vigor has been maintained. These qualitative surveys would also be discontinued in year 2020.
K. Side-Channel Maintenance
Side-channel maintenance on the 4Bii and the 8 channels would continue as recommended by the Stream Scientists and approved by the SWRCB on October 6, 2008. Maintenance of these side-channels would terminate in 2012.
L. Fisheries Population Monitoring
Fisheries monitoring in the Mono Basin would continue as prescribed in the Synthesis Report until 2015. This should provide sufficient data to determine if the SEFs are achieving what was intended. After 2015, only yearly mark-recapture runs would be conducted at the Bottomlands section on Rush Creek and the Main Channel section on Lee Vining Creek. Every five years, a mark-recapture run would be conducted on the MGORD. Passive Integrated Tags (PIT) tags would no longer be implanted after 2015, but marked fish would still be scanned for tags to obtain specific growth rate information. All mark-recapture runs will produce population estimates, length-frequency histograms, density estimates, biomass estimates, condition factors, and Relative Stock Density (RSD) values. This monitoring would continue until the recommended metrics are met (Hunter 2007).
Mono Basin Stream Restoration & Monitoring Program: " Synthesis of Instream Flow Recommendations" Public Review Draft Report
NO. PAGE PARAGRAPH SECTION NO. COMMENTS SCIENTISTS RESPONSE/ACTIONS BY
General Comments
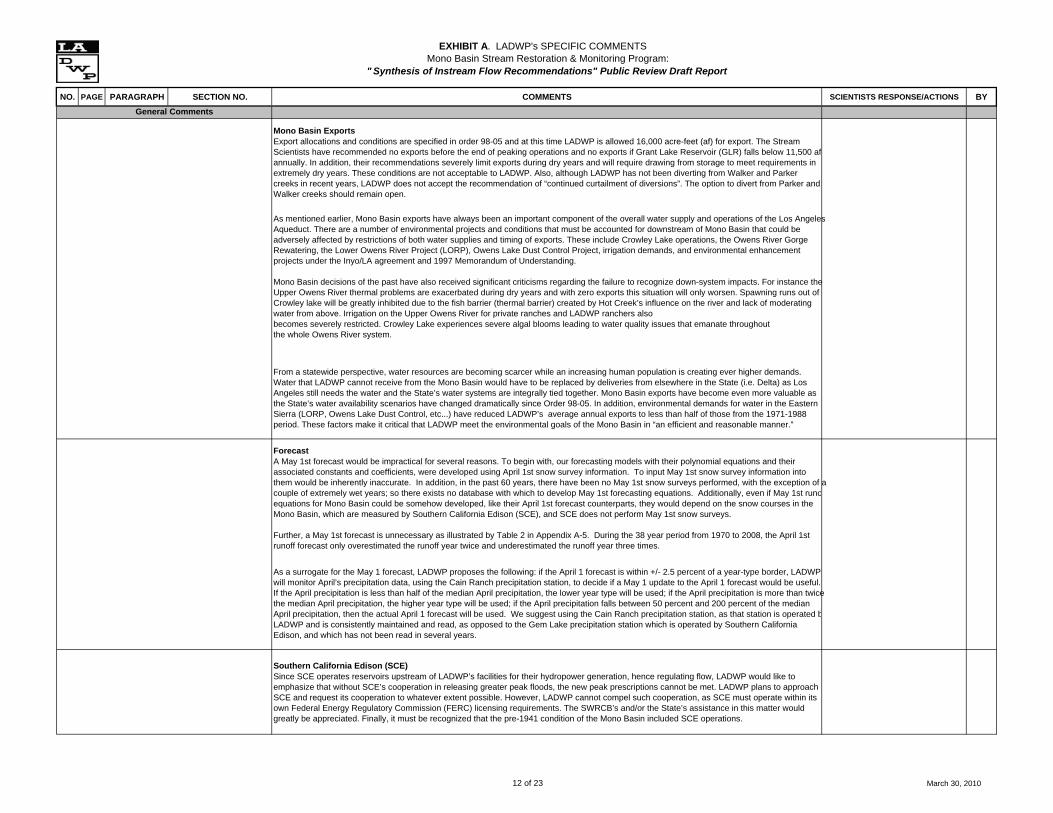
Mono Basin ExportsExport allocations and conditions are specified in order 98-05 and at this time LADWP is allowed 16,000 acre-feet (af) for export. The Stream Scientists have recommended no exports before the end of peaking operations and no exports if Grant Lake Reservoir (GLR) falls below 11,500 af annually. In addition, their recommendations severely limit exports during dry years and will require drawing from storage to meet requirements in extremely dry years. These conditions are not acceptable to LADWP. Also, although LADWP has not been diverting from Walker and Parker creeks in recent years, LADWP does not accept the recommendation of “continued curtailment of diversions”. The option to divert from Parker and Walker creeks should remain open.
As mentioned earlier, Mono Basin exports have always been an important component of the overall water supply and operations of the Los Angeles Aqueduct. There are a number of environmental projects and conditions that must be accounted for downstream of Mono Basin that could be adversely affected by restrictions of both water supplies and timing of exports. These include Crowley Lake operations, the Owens River Gorge Rewatering, the Lower Owens River Project (LORP), Owens Lake Dust Control Project, irrigation demands, and environmental enhancement projects under the Inyo/LA agreement and 1997 Memorandum of Understanding.
Mono Basin decisions of the past have also received significant criticisms regarding the failure to recognize down-system impacts. For instance the Upper Owens River thermal problems are exacerbated during dry years and with zero exports this situation will only worsen. Spawning runs out of Crowley lake will be greatly inhibited due to the fish barrier (thermal barrier) created by Hot Creek’s influence on the river and lack of moderating water from above. Irrigation on the Upper Owens River for private ranches and LADWP ranchers also becomes severely restricted. Crowley Lake experiences severe algal blooms leading to water quality issues that emanate throughout the whole Owens River system.
From a statewide perspective, water resources are becoming scarcer while an increasing human population is creating ever higher demands. Water that LADWP cannot receive from the Mono Basin would have to be replaced by deliveries from elsewhere in the State (i.e. Delta) as Los Angeles still needs the water and the State’s water systems are integrally tied together. Mono Basin exports have become even more valuable as the State’s water availability scenarios have changed dramatically since Order 98-05. In addition, environmental demands for water in the Eastern Sierra (LORP, Owens Lake Dust Control, etc...) have reduced LADWP’s average annual exports to less than half of those from the 1971-1988 period. These factors make it critical that LADWP meet the environmental goals of the Mono Basin in “an efficient and reasonable manner.”
ForecastA May 1st forecast would be impractical for several reasons. To begin with, our forecasting models with their polynomial equations and their associated constants and coefficients, were developed using April 1st snow survey information. To input May 1st snow survey information into them would be inherently inaccurate. In addition, in the past 60 years, there have been no May 1st snow surveys performed, with the exception of a couple of extremely wet years; so there exists no database with which to develop May 1st forecasting equations. Additionally, even if May 1st runoequations for Mono Basin could be somehow developed, like their April 1st forecast counterparts, they would depend on the snow courses in the Mono Basin, which are measured by Southern California Edison (SCE), and SCE does not perform May 1st snow surveys.
Further, a May 1st forecast is unnecessary as illustrated by Table 2 in Appendix A-5. During the 38 year period from 1970 to 2008, the April 1st runoff forecast only overestimated the runoff year twice and underestimated the runoff year three times.
As a surrogate for the May 1 forecast, LADWP proposes the following: if the April 1 forecast is within +/- 2.5 percent of a year-type border, LADWP will monitor April’s precipitation data, using the Cain Ranch precipitation station, to decide if a May 1 update to the April 1 forecast would be useful. If the April precipitation is less than half of the median April precipitation, the lower year type will be used; if the April precipitation is more than twice the median April precipitation, the higher year type will be used; if the April precipitation falls between 50 percent and 200 percent of the median April precipitation, then the actual April 1 forecast will be used. We suggest using the Cain Ranch precipitation station, as that station is operated bLADWP and is consistently maintained and read, as opposed to the Gem Lake precipitation station which is operated by Southern California Edison, and which has not been read in several years.
Southern California Edison (SCE)Since SCE operates reservoirs upstream of LADWP’s facilities for their hydropower generation, hence regulating flow, LADWP would like to emphasize that without SCE’s cooperation in releasing greater peak floods, the new peak prescriptions cannot be met. LADWP plans to approach SCE and request its cooperation to whatever extent possible. However, LADWP cannot compel such cooperation, as SCE must operate within its own Federal Energy Regulatory Commission (FERC) licensing requirements. The SWRCB’s and/or the State’s assistance in this matter would greatly be appreciated. Finally, it must be recognized that the pre-1941 condition of the Mono Basin included SCE operations.
EXHIBIT A. LADWP's SPECIFIC COMMENTS
12 of 23 March 30, 2010

Mono Basin Stream Restoration & Monitoring Program: " Synthesis of Instream Flow Recommendations" Public Review Draft Report
NO. PAGE PARAGRAPH SECTION NO. COMMENTS SCIENTISTS RESPONSE/ACTIONS BY
EXHIBIT A. LADWP's SPECIFIC COMMENTS
Excess WaterAdditionally, we are concerned with the proposed use of “excess” water that should be available for export in the Post-transition period. This excesson average, is 16,204 af (based on Table 6-3 on page 114 using negative excess values being converted to zero) with a range of 0 in some dry years to 50,000 af during extreme wet years. Because Mono Lake may not reach 6,391 ft soon, it is very likely that the transitional period will continue for more than 10 years. It is suggested by the report to prolong the snowmelt bench for Rush Creek and also stated “But absence of this excess stream flow in post-transition years with higher exports will not cause adverse conditions in Rush Creek”. First, a clear guideline for this additional release is necessary. A prolonged bench alone in Rush Creek could adversely affect fish as the snowmelt bench will replace the summer and fall base flows except in Dry runoff years, and in 8 out of 19 modeled years the bench will continue into the winter base flow. Second, the prolonged snowmelt bench will elevate the summer base flows, resulting in higher soil moisture availability through out the summer. This, in turn, coin expansion of the riparian patches beyond the limits that would otherwise be imposed by limited water availability. If the riparian acreage were to increase as a result of the prolonged benches, subsequent shrinkage or die back upon return to the normal streamflow regime could be considered as an “environmental setback,” triggering a demand for restoration of the excess release, which would limit LADWP’s export of water to which it would otherwise be entitled.
Ramping Ramping rates need to be 10 cubic feet per second (cfs) or 10 percent whichever is greater for Rush Creek from Grant. The 8 ft gate used to operate flows out of Grant Lake is not suited for small changes in flows. Once the gate is moved during a flow change, the gate must be seated and the seating of the gate by itself can change flows by a few cfs. Also, the flow meter can have a margin of error up to a few cfs, again causing problems with assuring a specific flow down the MGORD (Mono Gate One Return Ditch). With very small flow changes, trying to unseat a massive gate, slightly move it and reseat it, and then waiting several hours for the flows to make their way to the MGORD, all in an environment where flow measurement error is greater than the actual flow change, is impractical, especially in light of the inability to define the ecological implications of a given flow difference, such as that between 35 and 41 cfs, for instance. Flow changes of 10 cfs increments are the smallest that can be made to the MGORD in a reliable and operationally reasonable fashion.
Window of Acceptable FlowsThe analyses performed allowing for some variations in flows that translate to a plus/minus allowable stage change of 2.5 percent (total of 5 percent) were well done and are acceptable to LADWP.
Normal Year Peak Requirement of 380 cfsAnalyses by the Stream Scientists appear to have pinned the normal year peak flow requirement at 380 cfs. 380 cfs was the MAXIMUM designed flowrate of the Mono Gate One Return Ditch (MGORD) when the ditch was regraded to increase the capacity in 2001. Since then the growth of vegetation, sediment deposits, scouring in areas, rodent holes etc have adversely impacted the flow capacity. Marked rock experiments, bedload sampling, groundwater monitoring, and floodplain inundation all point to a bankfull flowrate for Lower Rush Creek of 325 to 350 cfs.
Equally important is that the new SEF (Stream Ecosystem Flow) of 380 cfs down the MGORD is not attainable. First, the outlet pipe out of GLR has a maximum design flow capacity of 371 cfs. Second, the engineers and hydrology team agree that the MGORD can safely handle only 350 cfsThe main concerns are that 1) at 380 cfs the MGORD is completely full and putting maximum stress on the berm; 2) there are several historical seeps through which water flows out of and under the MGORD; and 3) there continues to be a problem with gophers burrowing through the berm w380 cfs a breach could dewater Rush Creek.
13 of 23 March 30, 2010

Mono Basin Stream Restoration & Monitoring Program: " Synthesis of Instream Flow Recommendations" Public Review Draft Report
NO. PAGE PARAGRAPH SECTION NO. COMMENTS SCIENTISTS RESPONSE/ACTIONS BY
EXHIBIT A. LADWP's SPECIFIC COMMENTS
Flow Scenarios for Different Water Year TypesLADWP proposes three modifications to the flow scenarios proposed for Rush Creek:
Dry Normal I and Dry Normal II runoff years should be eliminated and replaced with Dry Normal:
Two Dry Normal year types are biologically and ecologically unnecessary and simply increase operational demands. Instead there should only be a Dry Normal year type with no peaking flows and a recurrence interval window between 80 and 60 percent of normal runoff.
The objectives of the proposed 200 cfs for 3 days peak flow for Dry Normal Type II include minor geomorphic works (gravel mobilization and sediment deposition in the point bars), off channel stream flow connectivity, riparian regeneration and shallow groundwater recharge. However, the gravel mobilization threshold (200 to 250 cfs) is met only below the Narrows and there are no data presented to support the connectivity threshold. Further, three days of surface water connection could be detrimental to the fish population. During redd (spawning nest) surveys conducted in 2009, only four of redds (14 percent) were found in the lower section of Rush Creek while 25 (86 percent) were found in Upper Rush including in Rock GaAlso very minimum shallow groundwater recharge would occur during a three day peak flow since the water table elevation is closely related to the stage height of the channel, and the water table quickly recedes when peak flows are dropped (Figure C-10 and C-11). According to the successful germination criteria in page 97, the regeneration can occur in interfluves/depression within aggraded floodplain without a side channel and emergent floodplains and aggraded floodplains with side channels. But the proposed duration of the peak is so short that it is very unlikely to achieve seedling establishment in those geomorphic surfaces because of quickly receding water table and also scouring in subsequent years for seedlings in the emergent floodplain and channel margins. Besides, successful regeneration of woody riparian species is known to occur in wet years with approximately 5-10 year periodicity (Baker 1990, Stromberg et al. 1991, Scott et al. 1997, Stromberg 1998, Lytle and Merritt 2004), and often driven by decadal or longer climatic cycles (Baker 1990, Hauer et al. 2007). Wetter years should suffice this regeneration cycle. Thus eliminating 200 cfs for three day will not adversely affect the Rush Creek ecosystem. Instead, the water would be more beneficially used by filling or raising the GRL level to augment supplies of cooler water. By maintaining GLR full, the turbidity and temperature issues can be alleviated or eliminated.
In Dry Normal, (Stream Scientists' Dry Normal Type I for SEFs), the spring bench should be lowered to 70 cfs from 80 cfs.
The 80 cfs riparian threshold is based only on the 8 Channel section of Rush Creek. There are some problems with generalizing the results from this reach. A tentatively drawn potentiometric surface map in the reach indicates the section is losing water with very steep hydraulic gradient between the stream and piezometer (Figure C-9 to C-11). The water table elevation at the piezometer 8C-5 is constantly lower than the main channel surface water elevation, ranging from a difference of one foot during peak discharge to more than 4 ft during the low flows, at a distance of around 100 ft as shown Figure C-10. The interpretation of the data shown in Figure C-17 to C-21 may not be accurate, as the drop of the water table seems to occur around 60 cfs rather than 80 cfs. Moreover, the five-foot threshold to the depth to the water table in Figure C-6 is questionable because the number was calculated using the horizontal plane extending from the 91 cfs surface water elevation. The actual value of the depth to the water table should be larger than that shown in Figure C-6. For instance, in the 8 Channel section, the stream is losing water according to the stage height and piezometer comparison shown in the Figure C-10 and C-11. When wells along the same cross section are compared (8C-5 and 8C-6), the water table is lower at 8C-6 (piezometer located further away from the main channel) most of the year even with perennial flows on 8 Channel, thus further supporting the non-horizontal plane of the water table (interestingly Figure C-11, 8C-1 and 8C-3 are not presented to compare to 8C-2 and 8C-4 respectively for comparison along the same transect). In addition, steepness of hydraulic gradient changes with discharge due to changing an aquifer storage. The aerial photos were taken after the peak during the receding limb (from Appendix A-1, a peak for Rush was in the beginning of June) with larger storage. Thus, the water table levels during 91 cfs, even with properly modeled water table elevation, reflect the depth to the water table at the discharge only during the receding limb, but not at other times of the year, particularly in the mid to late summer. The depth thresholds should be greater than 5 feet for riparian patches. Most of the water table elevation is maintained within 6 feet of the capillary fringe in all the piezometer figures even during low flow seasons. Therefore, there will be very little effect, if any, on riparian plant communities if the spring bench is lowered to 70 cfs from 80 cfs.
14 of 23 March 30, 2010
Mono Basin Stream Restoration & Monitoring Program: " Synthesis of Instream Flow Recommendations" Public Review Draft Report
NO. PAGE PARAGRAPH SECTION NO. COMMENTS SCIENTISTS RESPONSE/ACTIONS BY
EXHIBIT A. LADWP's SPECIFIC COMMENTS
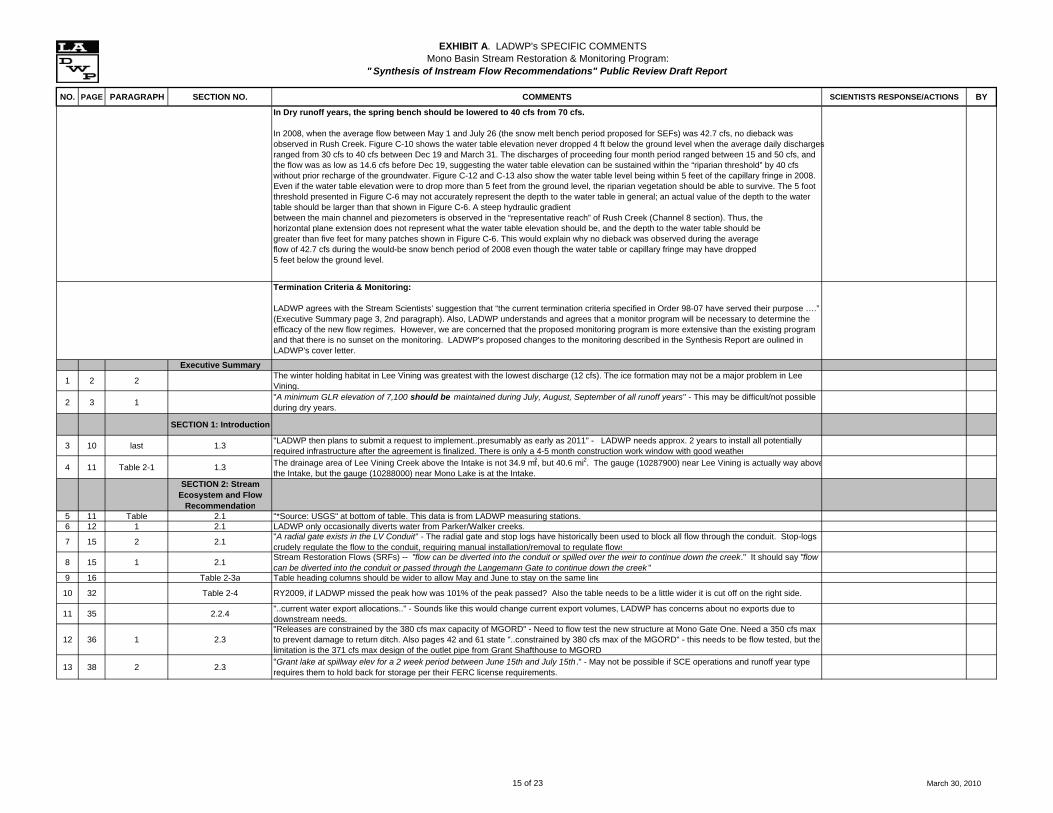
In Dry runoff years, the spring bench should be lowered to 40 cfs from 70 cfs.
In 2008, when the average flow between May 1 and July 26 (the snow melt bench period proposed for SEFs) was 42.7 cfs, no dieback was observed in Rush Creek. Figure C-10 shows the water table elevation never dropped 4 ft below the ground level when the average daily discharges ranged from 30 cfs to 40 cfs between Dec 19 and March 31. The discharges of proceeding four month period ranged between 15 and 50 cfs, and the flow was as low as 14.6 cfs before Dec 19, suggesting the water table elevation can be sustained within the “riparian threshold” by 40 cfs without prior recharge of the groundwater. Figure C-12 and C-13 also show the water table level being within 5 feet of the capillary fringe in 2008. Even if the water table elevation were to drop more than 5 feet from the ground level, the riparian vegetation should be able to survive. The 5 foot threshold presented in Figure C-6 may not accurately represent the depth to the water table in general; an actual value of the depth to the water table should be larger than that shown in Figure C-6. A steep hydraulic gradient between the main channel and piezometers is observed in the “representative reach” of Rush Creek (Channel 8 section). Thus, the horizontal plane extension does not represent what the water table elevation should be, and the depth to the water table should be greater than five feet for many patches shown in Figure C-6. This would explain why no dieback was observed during the average flow of 42.7 cfs during the would-be snow bench period of 2008 even though the water table or capillary fringe may have dropped 5 feet below the ground level.
Termination Criteria & Monitoring:
LADWP agrees with the Stream Scientists’ suggestion that “the current termination criteria specified in Order 98-07 have served their purpose ….” (Executive Summary page 3, 2nd paragraph). Also, LADWP understands and agrees that a monitor program will be necessary to determine the efficacy of the new flow regimes. However, we are concerned that the proposed monitoring program is more extensive than the existing program and that there is no sunset on the monitoring. LADWP's proposed changes to the monitoring described in the Synthesis Report are oulined in LADWP's cover letter.
Executive Summary
1 2 2The winter holding habitat in Lee Vining was greatest with the lowest discharge (12 cfs). The ice formation may not be a major problem in Lee Vining.
2 3 1"A minimum GLR elevation of 7,100 should be maintained during July, August, September of all runoff years" - This may be difficult/not possible during dry years.
SECTION 1: Introduction
3 10 last 1.3"LADWP then plans to submit a request to implement..presumably as early as 2011" - LADWP needs approx. 2 years to install all potentially required infrastructure after the agreement is finalized. There is only a 4-5 month construction work window with good weather
4 11 Table 2-1 1.3 The drainage area of Lee Vining Creek above the Intake is not 34.9 mi2, but 40.6 mi2. The gauge (10287900) near Lee Vining is actually way abovethe Intake, but the gauge (10288000) near Mono Lake is at the Intake.
SECTION 2: Stream Ecosystem and Flow
Recommendation5 11 Table 2.1 "*Source: USGS" at bottom of table. This data is from LADWP measuring stations.6 12 1 2.1 LADWP only occasionally diverts water from Parker/Walker creeks.
7 15 2 2.1"A radial gate exists in the LV Conduit" - The radial gate and stop logs have historically been used to block all flow through the conduit. Stop-logs crudely regulate the flow to the conduit, requiring manual installation/removal to regulate flows
8 15 1 2.1Stream Restoration Flows (SRFs) -- "flow can be diverted into the conduit or spilled over the weir to continue down the creek." It should say "flow can be diverted into the conduit or passed through the Langemann Gate to continue down the creek "
9 16 Table 2-3a Table heading columns should be wider to allow May and June to stay on the same line
10 32 Table 2-4 RY2009, if LADWP missed the peak how was 101% of the peak passed? Also the table needs to be a little wider it is cut off on the right side.
11 35 2.2.4"..current water export allocations.." - Sounds like this would change current export volumes, LADWP has concerns about no exports due to downstream needs.
12 36 1 2.3"Releases are constrained by the 380 cfs max capacity of MGORD" - Need to flow test the new structure at Mono Gate One. Need a 350 cfs max to prevent damage to return ditch. Also pages 42 and 61 state "..constrained by 380 cfs max of the MGORD" - this needs to be flow tested, but the limitation is the 371 cfs max design of the outlet pipe from Grant Shafthouse to MGORD
13 38 2 2.3"Grant lake at spillway elev for a 2 week period between June 15th and July 15th." - May not be possible if SCE operations and runoff year type requires them to hold back for storage per their FERC license requirements.
15 of 23 March 30, 2010

Mono Basin Stream Restoration & Monitoring Program: " Synthesis of Instream Flow Recommendations" Public Review Draft Report
NO. PAGE PARAGRAPH SECTION NO. COMMENTS SCIENTISTS RESPONSE/ACTIONS BY
EXHIBIT A. LADWP's SPECIFIC COMMENTS
14 38 2.3
A May 1 forecast would be impractical for several reasons: 1) our forecasting models with their polynomial equations and their associated constantsand coefficients, were developed using April 1st snow survey information; 2) in the past 60 years, there have been no May 1st snow surveys performed, with the exception of a couple of extremely wet years, so there exists no database with which to develop May 1st forecasting equations;3) even if May 1st runoff equations for Mono Basin could be somehow developed, like their April 1st forecast counterparts, they would depend on the snow courses in the Mono Basin, which are measured by Southern California Edison, and Southern California Edison does not perform May 1st snow surveys. Also, looking at appendix A-5 Table 2, the 38 year period from 1970 to 2008 the April 1 runoff forecast overestimated the runoff year only two years and underestimated the runoff year three years.
15 38 2.3
Last paragraph. "The threshold of 11,500 af is to protect Rush Creek from higher than normal turbidity and water temperatures." The turbidity that came from GLR when it was low was not a problem. The turbidity produced during a SEF peak will be much higher than turbidity from GLR Also, You have stated the turbidity is one of the issues, then why isn't there any number to show how bad the turbidity, such as temporal variation of the turbidity (any threshold value of GLR level which always result in high turbidity, duration and occurrence of the episode), spatial extent of the turbidi(how far down from Mono Gate 1 the turbidity extends), and evidence of fine accumulation in the stream bed (particularly where redds have been observed). Is it affecting fish population? Has it caused in aggradation? What are the turbidity values?
16 38 2 2.4.1"Fixed daily diversion rates are determined by the daily average flow for the Lee Vining Above - determined at 9 am ." Clarify to say "At 9 am the previous day's midnight to midnight average flow rate would be used to determine the flows to the conduit."
17 38 2 2.4.1Also, what happens when the flow dramatically changes from the 9:00 am flow? We could send a very small amount down Lee Vining. And wouldn't big flow changes down the creek (eg 50% or more ramp up or down due to sudden increase/decrease in incoming flow) be undesireable? Or is that fine?
18 40 2 2.4.1
Table 2-6: LADWP feels the diversion table (for April 1 to Sept 30) needs to be simplified to show cfs vs. diversions in 5 cfs increments as shown below: LV Above Conduit Flow30 - 34 035 -39 540 - 49 1050 - 79 1580 - 99 20100 - 129 25130 - 169 30170 - 199 35200 - 239 40240 - 249 45250+ 50This will allow for easier programming and troubleshooting of the final structures and help reduce wear and tear on LADWP facilities. With varying creek flow, the technology and accuracy of the control gates are within plus or minus 5% of the flow (or 1 cfs, whichever is greater).
19
In order to operate Lee Vining Creek Intake & Conduit as recommended, LADWP will need to install another Langemann Gate in the Lee Vining Conduit and perform programming to tie communications of both Langemann Gates back to the flume above. Other upgrades will be needed to replace the Lee Vining Conduit steel grizzlies, as they catch debris before it goes into the conduit and they are corroding. LADWP is willing to perform the upgrades in order to make the new operations work, but will need 2 years from when the new operations are finalized in order to complete the installation of the upgrades.
20 40 Table Table 2-6
Refer to previous LADWP recommended table showing 5 cfs flow change increments. Also, the Lee Vining Conduit needs an upgrade to allow flows to be set as specified with the new SEF flows. LADWP will attempt to operate without the upgrade in place during it's 1 year temporary permitbut setting constant flow rates down the conduit will be difficult and crude (meaning not very accurate) until the upgrades can be installed. Installation of a new Langemann Gate in the conduit to help manage flow in the conduit will take 2 years after the new operations agreement is finalized.
21 44 2.4.2.1During a dry runoff year, LADWP requests a snowmelt bench of 40 cfs instead of the recommended 70 cfs. Evidence shows the 40 cfs baseflow in runoff year 2009 maintained the riparian vegetation along Rush Creek. The lower snowmelt bench will maintain Grant Lake Reservoir water elevations. Also if Grant Lake Reservoir does fall below 11,500 af is a snowmelt bench required?
22 44 3 2.4.2.1Why isn't the winter baseflow adjusted to the runoff year type as in Lee Vining? The habitat study shows the winter holding habitat below the Narrows (County Road and Bottomlands) is highest at the lower flow of 22 cfs where most of the fishery concern resides. Can the baseflow be lowered to 22 cfs?
16 of 23 March 30, 2010

Mono Basin Stream Restoration & Monitoring Program: " Synthesis of Instream Flow Recommendations" Public Review Draft Report
NO. PAGE PARAGRAPH SECTION NO. COMMENTS SCIENTISTS RESPONSE/ACTIONS BY
EXHIBIT A. LADWP's SPECIFIC COMMENTS
23 46 2.4.2.2During a Dry-Normal runoff year, LADWP requests a snowmelt bench of 70 cfs instead of the recommended 80 cfs. (discussed further in the cover letter).
24 47 Table Table 2-9 The Spring Ascension has "30-70" cfs, should be "40-70".
25 50 3 2.4.2.4Is it reasonable to assume vigorous riparian vegetating reproduction during the normal year? The exceedance probability of 50% (average)? Each normal year has a different weather pattern, and summer precipitation and temperature is very important for successful establishment. Does vigorous riparian reproduction occur 50% of the time? Aren't we setting up the goal too high?
26 52 2 2.4.2.5For wet-normal years, the increase associated with the runoff is 130% comparing to the normal year while the peak is up by 145%. So there is a disproportional increase of peak. The geomorphic thresholds intended to exceed with 550cfs are achieved below that discharge (see comments on Section 5.7), so 490 cfs (130% of the normal) would suffice the objective.
27 52 3 2.4.2.5The ecological objectives are not very clearly stated except that the peak can be adjusted to maximum seed production and exceed the several geomorphic thresholds. What do you want to achieve? What geomorphic objectives do you intend to achieve?
28 54 3 2.4.2.6The flow below the Narrows ranges between 20 and 25 cfs for the fall/winter baseflows, but previous paragraphs the range was between 19 and 25 cfs. Is this because prolonged higher flows increase discharge rate resulting in lower loss? Is this measured or modeled?
29 55 Table 2-13 2.4.2.6 Medium Recession (node) should be "170-70" instead of "160-70".
30 56 2 2.4.2.7 "A snowmelt peak of 380 cfs may be released from the MGORD " - the pipe design capacity is 371 cfs.
31 58 1 2.5"An upgraded facility on Lee Vining Creek has made a daily diversion rate a viable alternative" - This is not stated correctly, we can set flows only to Lee Vining Below but do not have any flow control to Lee Vining Conduit to bypass flows to Grant. Lee Vining facility is designed to set a constant "bypass" flow not a constant "diversion" flow. Need upgrades to accommodate this.
32 58 2 2.5It states "as a rule of thumb, no greater than a 5% change in stage bracketing would be an acceptable margin" It should say "Typically 5% is a targeted acceptable margin of error". This statement should be eliminated because it makes it seem like we have inaccurate operations, the 5% is completely relative and unobtainable in lower flow ranges with any type of equipment.
33 58 2 2.5Stage/Flow bracketing needs to apply to all flow settings at the 3 stations on Lee Vining Creek, should say within 2 cfs plus or minus or 5% whichever is greater, or as recommended by the gate manufacturer.
34 59 2.6
The excess in average is 16,204 af (using Table 6-3 on page 114 with negative excess values being converted to zero) ranging from none during some dry years to 50,000 af during extreme wet years during the transitional period. This is more than a half of the Dry Year simulated Rush Creek annual runoff. Can Rush Creek alone handle all the excess flows just by prolonging snowmelt benches, but not by augmenting the flows? Simple calculations show in 8 out of 19 modeled years the bench will continue into the winter base flow (mainly wet years) and except Dry Year the bench will replace the summer baseflows completely. Are you planning to change diversion rates for Lee Vining Creek such as lowing the diversion upper limit from 250cfs to 200cfs to accommodate this excess water during the transition period? This issue needs to be addressed further.
35 59 2 2.6
Mono Lake may take more than 10 years to reach the 6,391 elevation. The difference in the simulations going from 30,000AF exports (the scenario under which the Rush Creek flows were set) a year to 16,000AF exports (the current and likely a more realistic value for a long time to come) a yeaamounts to an additional release of 40 cfs for a 6 month duration. Is this additional water going to be left at the discretion of LADWP for when it is released to Rush Creek from Grant Lake? What guidelines do we have regarding this additional release? If LADWP is supposed to just let Grant Lake spill the extra, then there will be concerns over increased damn stresses as Grant Lake will remain at or near full for most of the year during most years under the 16,000AF scenario.
36 59 2.6
Is there really no adverse condition when the excess flows are no longer available? Mono Lake won't reach the targeted height in a few years. Prolonged bench will elevate the summer base flows, maintain higher soil moisture availability through out the summer, and can result in expansion of the riparian patches to the places where the expansion would be typically checked by limited water availability. The prolonged benches can also cause different groundwater flowing patterns during summer months which riparian vegetation can adapt to. Therefore, when the target Mono Lake level is met, the dependence on the excess flows can shrink the riparian patches. If the riparian acreage increases as a result of the prolonged benches, then the shrinkage or die back afterward can be considered as a setback, and some interest parties may demand implementation of some management practices to increase the acreage back to the prolonged bench level.
37 59 2.6Can prolonged snowmelt bench and peak be used interchangeably? Does it have to be one or the other? How about decreasing the rate of recession limb during wet years (Wet-Normal to Extreme Wet) to alleviate a sharp decline of water table? Instead of using 20%, can the recession limb be prolonged by reducing the rate to, say, 12% or 15%?
17 of 23 March 30, 2010

Mono Basin Stream Restoration & Monitoring Program: " Synthesis of Instream Flow Recommendations" Public Review Draft Report
NO. PAGE PARAGRAPH SECTION NO. COMMENTS SCIENTISTS RESPONSE/ACTIONS BY
EXHIBIT A. LADWP's SPECIFIC COMMENTS
SECTION 3: General Analytical Strategy
38 61 2 3.1
Stage height can change over time. Channel geometry and hydraulic characters are not constant (erosion, aggradation, migration, narrowing, change in roughness, shear stress), and also hysteresis can lead to different stage height readings depending on the timing of reading (hopefully difference is within 5% of the error limit). Are you planning to survey the cross section every two years or so, or after the big flow to adjust the rating curve?
39 3.1
80 cfs threshold: This number is only based on 8 Channel section and there are some problems with generalized the results from this reach. First, the interpreation of the data shown in C-17 to C-21 may not be accurate as the drop of the watertable seems to be around 60 cfs rather than 80 cfsThere is a very little change around 80 cfs until the flow drops to 60 cfs. Figure C-17 shows that for RY2004, when 8 Channel was inundated for 14 days, the water table never dropped below 5 ft of the ground surface. Second, 8 Channel section is located in a losing reach. Tentatively drawn potentiometric surface indicates the section is losing water with very steep hydraulic gradient. One foot during peak discharge to more than 4 ft of elevation differences in 100 ft of distance as shown C-10. Third, the steepness is highly variable in time depending on a time of the year because of change in a volume of water stored in the aquifer as indicated in Appendix C (page 6), suggesting variable spatial flow patterns. Thus, groundwater flows are highly variable in both time and space.
Fourth, the data are too incomplete to draw any conclusion. The existence of the deeper water table or aquifer is mentioned in Appendix C-2 but no supporting evidence is presented. Kondolf (1988) mentioned gaining stream flow below the County Road. Thus, losing maybe a general trend between the Narrow and the County Road, but the creek can gain some water back below the County Road. However, there should be more complex losing and gaining pattern in finer scales, and those fine scale patterns can affect woody riparian species growth shown by Harner and Stanford (2003). Therefore, the well data from a losing reach should not be generalized over the entire section of Lower Rush Creek.
40 3.1
Another comment on 80 cfs threshold: Figure C-17 clearly shows different water table behaviors between pre- and post perennial flows of 8 Channel. Steep decline in the water table does not occur until around 60 cfs for all years shown in the figure, but the magnitude of the decline is much less for the post perennial flow as at 50 cfs the water table remains within 4 ft of the ground surface. Particularly in 2008 the water table remains within 4 ft of the ground surface all year long even with discharges as low as 20 cfs. Thus, by maintaining the opening of 8 Channel as long as possible, less water is needed to keep the water table high (<5ft of the ground surface as proposed in the report). This scenario contradicts with LADWP's plan to leave alone 8 Channel after 2012, but it sheds light on a benefit of maintaining the side channel in order to lower the summer baseflow.
41 63 2 3.2
The duration above the thresholds is irrelevant for geomorphic objectives as most of sediment transport and deposition accomplished in first few days. Avulsion and LWD transport and recruitment are highly episodic. There is no number provided for LWD transport in Appendix (just pictures, no mention of length, diameter, a distance traveled, etc). Does the experiment realistically reflect nature of LWD in both creeks? What type of LWD do we expect in Rush and Lee Vining creeks (willows, sage brush, cottonwood, etc.?). If smaller pieces are expected to be recruited, then the threshold should be adjusted accordingly. The distance the pieces traveled is not very relevant because recruitment is necessary in the first place. A jam can form at the point of recruitment if the recruited piece can withstand the force of moving water and small pieces are recruited upstream.
SECTION 4: Lee Vining Creek Analysis
42 4.2.1
Since 1990, there are four Dry Normal I and II years during which the discharge exceeded 300 cfs only once. The listed desired ecological outcomes are gravel mobilization, emergent floodplain deposition, channel maintenance, fine bed material transport, point bar extension, and minor riffle mobilization. The threshold for gravel mobilization is much lower flows than 300 cfs (150-200 cfs). The largest point bar deposition was observed during 103 cfs (0.3 ft). Channel maintenance normally coincides with bankfull discharge, which is approximately 200 cfs (the theoretical fit). Fine bed material transport only applies to Rush (even then it only applies during very low GLR storate level). Point bar extention is related to erosional processes, which can be achieve with flows below the bankfull. Minor riffle mobilization needs to clarified, but I assume not a total movement (100%). Some movements were observed for flows between 160 and 200 cfs. Therefore, the thresholds may be lower than listed in Table 3-1. Thus, for those dry years, the flow can be diverted up to 300 cfs without affecting any desired ecological outcomes.
43 76 1 4.2.3 It should be Figure 7 , not Figure 6 . If you include the conceptual model, then it should be Figure 5and Figure 7 .
44 76 1 4.2.3It sounds like the surface water elevation was obtained, but I don't see how you transform that data into the groundwater surface elevation. The way the sentence is written, the surface water elevation and groundwater elevation are synonymous. Which is very unlikely in this semi-arid environmenIn the Figure 4-7, it is explained, so clarification is necessary in the main text. What kind of the model was used to predict the water table elevation?
18 of 23 March 30, 2010

Mono Basin Stream Restoration & Monitoring Program: " Synthesis of Instream Flow Recommendations" Public Review Draft Report
NO. PAGE PARAGRAPH SECTION NO. COMMENTS SCIENTISTS RESPONSE/ACTIONS BY
EXHIBIT A. LADWP's SPECIFIC COMMENTS
45 79 Figure 4-8 or C-22 4.3
How was the 30 cfs elevation line determined? Is it the actual stage elevation of near by cross section? Or is it the water table elevation corresponding to when the flow was 30 cfs? If the line represents the gage elevation, then it is very confusing without knowing the exact location of the cross section relative to the well. Is the water table supposed to be equal to the stage height? There are some periods with the water table level dropping below 6510 ft. Did it really drop below that elevation or the data do not exist during those periods? What were corresponding discharges ostage heights? Why was the water table higher from 95 to 01, then all of sudden dropping below 6510 ft elevation from 02 to 10 after the growing seasons? Prolonged and high peak flows above 350 cfs were observed 2005 and 2006, but the water table did not respond to those prolonged and high peak flows as it did during 1995 and 1996. Why is there such a large discrepancy in the water table response to the high and prolonged flows?
46 80 3 4.3.1 The range used in Table E-1 to E-4 of Appendix E (E10) is 15-30cfs, not 15-25cfs.
47 81 Figure 4-9 4.3.2Why were two vertical dashed lines drawn between 15 cfs and 25 cfs? For the winter base flow, we are concerned about foraging habitat in primary pools, so foraging habitat in pocket pools is unnecessary information here. With dashed lines along with the pocket pool information, the table seems to support the flow range between 15 and 25 cfs for winter holding habitat.
SECTION 5: Rush Creek Analysis
48 85 Premise 4 5.1 Does the increase in the stage translate into larger inundation extent?
49 86 Premise 7 5.1 Even with high flows, there is always laminar or viscous sublayer at the stream bottom and hyporheic zone where macroinvertebrates can survive.
50 88 Figure 5-3 5.4After the reconstruction of the 8 Channel entrance, the drop of the water table seems to be around 60 cfs rather than 80 cfs. There is very little change around 80 cfs until the flow drops to around 60 cfs. The sharp drops around 60 cfs are also depicted in C-17.
51 88 4 5.4
It is true that the water table is higher for 80 cfs than for lower flows, and the water table must rise further. However, Figure C-10 shows that the water table closely follows or almost mimic the discharge and therefore the data is not supporting the snow melt bench. Why are higher snow benches necessary for wetter years? You have mentioned the deeper groundwater recharged by precipitation, then in wetter years there should be a greater amount of lateral flows to raise the deeper water. Therefore, the storage volume in the aquifer should be greater, and the groundwater is ready by itself for the peak.
52 89 1 5.4
The 80 cfs mechanics is only observed in the 8 Channel section! Kondolf (1989) said Rush gains water back below the county road due to change in the substrate type. Can this 80 cfs really be generalized? If the wording changes to something like "this section is most sensitive to the water table dynamic due to its recovery stage, and the water table needs to be maintained to such a level...", then it is more acceptable than talking as if this section represents the entire bottom section because there are no data to support it.
53 89 4 5.4
Yellow willow regeneration: As you mentioned, successful establishment event can be favored by a longer period of 100 cfs, but it needs to be accessed annually, either successful or unsuccessful, because there are other factors affecting seedlings, such as summer precip and temp. Did longer period of above 100 cfs result in successful establishment? Did successful riparian regeneration occur during the years with favorable NGD analysis result?
54 91 5.5At what cfs does the loss of foraging habitat and the cooler water from the higher flows become a wash? At a point it would be better to have more foraging habitat and warmer temps than to have not enough foraging habitat and cooler temps.
55 91 1 5.5It is confusing as it is stated "success in unregulated Dry/Dry Normal is uncertain " and "Die back has likely occurred ", but the end of the paragraph it is stated "To maintain vigor with similar success…". Is this objective during Dry/Dry Normal possible?
56 91 5 5.7Is continuous release of high peak flow sustainable considering of the fact that supply of coarse debris will decrease over time? With a dam blocking the coarse sediment, will narrowing and deepening of the channel be achieved by downcutting overtime? Can the positive loop of aggradation be replaced by the negative loop of downcutting, increasing bankfull flow, and decreasing floodplain aggradation?
57 92 5.7 RCT: this is the first time RCT (riffle crest thalweg) is used even though the term is used in Chapter 7 with a definition.
58 93 2 5.7
Point/lateral bar formation is set to between 500 and 550 cfs. But the bar formation is closely related to the sediment load, transport capacity, and erosion (in the case of point bar), and considering all those factors the bankfull discharge is regarded as the most effective flow to accomplish the bar formation. More than one foot of deposition was observed at 00-86 with 396cfs from Appendix B-2, Table 2, so the data show that the formation can occur with discharge way below 500cfs.
59 93 2 5.7LWD debris transport/jam formation: There are only figures presented in B-3, no numbers. So it is hard to know how 400 and 450 cfs numbers are determined.
19 of 23 March 30, 2010

Mono Basin Stream Restoration & Monitoring Program: " Synthesis of Instream Flow Recommendations" Public Review Draft Report
NO. PAGE PARAGRAPH SECTION NO. COMMENTS SCIENTISTS RESPONSE/ACTIONS BY
EXHIBIT A. LADWP's SPECIFIC COMMENTS
60 93 2 5.7.1
Fine bedload transport. This number is based on the 2005 bedload study, right? According to Table 12b in Appendix B, D84 barely exceeded 2 mm in the first day whose daily average was 298 cfs. Is this where the threshold based on? If so, then the data only show down to 298 cfs, but no beyond. There seems to exist a trend, but the fine bedload may be transported by the discharge lower than 250 cfs. Thus there is no data to support the lower limit of the threshold.
61 94 1 5.7.3 If Mono Lake reaches 6391 ft and LADWP is able to export 30,000 af per year, exports will need to begin before the snow melt peak.
62 95 Table 5-1 5.7.1 The discharge for 25 year recurrence interval should not be 100 cfs.
63 97 Table 5-2 5.9Did those NGYs result in the successful establishment? Have those geomorphic surfaces been converted into the patches of riparian species? Are those discharges and establishment events conceptual or observed in the field?
64 5.9 How much regeneration has occurred in the past 12 years? Is it enough to sustain a long term riparian maintenance?
65 5.10What is the cause of this high diurnal fluctuation? Is it something that can be alleviated by the SEFs except raising the GLR level and diverting off 5-Siphon?
66 5.10How much of temperature increase in Lower Rush is alleviated by canopy cover? Has canopy cover over the channel increased or decreased last 12 years? How much of channel complexity exist in Rush Creek, enhancing surface- and groundwater interactions? Will increase in channel length result in the channel complexity?
67 5.10The type of trees providing canopy cover does seem to matter as yellow willows (16 ft) and cottonwoods (40 to 100 ft) progressively provide more cover. It appears that cottonwoods are more abundant in Lee Vining than Rush. Are we somehow missing regeneration opportunities for cottonwoods in Rush? Or are cottonwoods historically less common in Rush?
68 5.10What is the lateral heat influx from the artificial side channels or the main channel in the 10 Channel section into the main stem (or 10 Channel)? Is this the primary cause of high diurnal fluctuation?
69 5.10 What is the microscale variability of temperature? Is there any thermally favorable spots for fish during very stressful summer months?
70 99 1 5.10.2 What is the temperature regime of Rush Creek above the dam?
71 Figure 5-8 to 5-10 5.10.2 What is the difference between Full-No and Empty-No? Where is the 5-Siphon scenario?
72 105 2 5.10.4
How would flow out of the 5 siphons be triggered? Would LADWP follow a guideline that if Grant Lake is below 25,000AF storage and diversions were available from Lee Vining Creek, then the 5 siphons should be turned on? Specific guidelines would be helpful for LADWP personnel in deciding whether upgrades are needed or not at the 5 siphons facility.
Due to the Grant Lake being at or near full under the recommended operations, the Conduit at the 5 Siphons will be somewhere near 3.5 feet deep at times when the 5 siphons is to be operated. We feel a permanent partial bulkhead needs to be installed covering the bottom 3.5 feet of the Conduit so when the 5 siphons is to be operated, the bulkhead will not have to be installed under the surface of the standing water in the Conduit.
73The 5 siphons structure was not designed to flow with flow also going into Grant Lake simultaneously. However, there is a bypass gate just downstream of 5 siphons (called Sand Trap #5) which can be used to flow approximately 5 cfs down the 5 siphons spillway while the rest of the Conduit flow goes into Grant Lake.
SECTION 6: Grant Lake Reservoir Simulation
74 110 Table 6-1 6.1 Why the number of days when GLR is above 7,090 ft is fewer than those when GLR is above 7,100 ft for the Scenario 3
75 110 Table 6-1 6.1 What is the difference between Scenario 4 and 7 as both say that Rush/Lee Vining SEF, 16K export, no curtailment?
76 109 Scenario 1 6.1There are some discrepancies between the actual and predicted levels. Did you do anything to reduce the discrepancies? What is the error for eacNGD analysis? What are the errors associated with the volume translated into in the terms of the surface elevation?
77 111 Scenario 4 6.1 An indentation for Scenario 5
78 112 6.1 Scenario 7?
20 of 23 March 30, 2010

Mono Basin Stream Restoration & Monitoring Program: " Synthesis of Instream Flow Recommendations" Public Review Draft Report
NO. PAGE PARAGRAPH SECTION NO. COMMENTS SCIENTISTS RESPONSE/ACTIONS BY
EXHIBIT A. LADWP's SPECIFIC COMMENTS
79 111 Scenario 6 6.1
Due to the fact that this is the scenario which is highly likely to occur for a long time, LADWP must make sure it is prepared to operate under the results of this scenario. From the graph of this scenario in the appendix (F9 - page 265) it is obvious Grant Lake will be at or near full for years at a time while scenario 6 is in effect.
Improvements to the Grant Lake spillway and the existing wooden vehicle bridge below the spillway will need to be made. The dam at Grant Lake is an earthen dam, just like others LADWP owns and operates. Three of LADWP’s dams (Tinemaha, Haiwee, and Bouquet) have had maximum water level restrictions placed on them from the state of California due to dam safety issues. Operating Grant Lake at or near full at all times has the possibility to stress the dam and cause issues in the future which could result in maximum water level restrictions below the spillway of the dam being put in place.
The final court accepted operations should reflect some sort of provision in the case of future water level operating restrictions being placed on the Grant Lake dam due to dam safety issues.
SECTION 7: Termination Criteria and Monitoring
80 118 7.1.2
Large diurnal fluctuations in Lower Rush can be attributable to low flows, a lack of shading, reduced channel complexity, lateral influx of heat, loss oflows, etc., but not so much to stream temperature except buffering capacity due to lower temp. How much daily fluctuations can stream flows with lower temp (same discharge) reduce? If the flow stays same, how much fluctuation can the 5-Siphon flows reduce? There must be some dysfunctional buffering and insulating processes.
81 7.1.2What would happen when no intervention will be made to ensure inflows into excavated channels and riparian plants start dying? Because of the acreage criteria of the riparian patches, are we going to enhance inflows even though it has detrimental effects on stream temperature?
82 7.1.5
Why no number on recruitment and survival over the years is not presented in the report? You mentioned that the riparian establishment is lagging behind. Do you mean lagging behind the termination criteria set for the reach? A large number of seedlings (>250 in 2005 report, 358 in 2006 report, 247 in 2007 report) were observed, and frequencies of woody species were somewhat stable, but there was no 3D riparian status in 2008 and 2009 reports. Was no monitoring done in RY 2007 and 2008? High germination rate and high mortality rate are typical of riparian community in the semi-arid regions. So are you assuming the same trend in the subsequent years? 2009 aerial photos show very little vegetation growing in the 3D floodplain. What was the reason to conclude the establishment is lagging behind? Is the ground elevation too high or is water table too low? Is the substrate too coarse? The reason is more likely for both, thus it sounds like successful establish can occur only during consecutive wet years with relatively cool and wet summers just like many other places in Rush Creek.
83 7.1.5
The 3D should not be kept open indefinitely, but should be left alone with no maintenance. The exposed 3D section can increase heat load to the main channel. The tentative potentiometric surface based on the well data (2005 Compliance Report) show main channel losing water. Some cross sectional overviews from subsequent reports confirm it. Thus, for the thermal regime, it is a setback as the main channel losing the flow (increasing the heat load concentration) and the side channel gaining the heat load by being exposed (and by losing water as well). Being a losing reach with very steep hydraulic gradient makes very difficult for successful riparian establish to occur. What is the purpose of keeping this side channel? When a big flow comes, it will wash out whatever on its way anyway and the coarse sediments will be redistributed below the Narrows.
84 124 7.1.6 Is the annual fisheries population monitoring going to continue indefinitely?
SECTION 8: Climate Change Implications for
Future Streamflow Recommendations and
Monitoring
85 8 If the trend of reduced snowpack and earlier snow melt is observed (which means lower peak flows), will the runoff years be recategorized?
APPENDIX
86 A54Table A-4
How did Lee Vining have a peak of 444 cfs above the intake and a peak 457 below in runoff year 2006?
87 B2 2 B-1
The mobility threshold at Upper Rush was defined as between 450 and 550 cfs. But the data only exist at around 400 cfs and around 550 cfs. At XS 12+95, the same numbers of largest rocks were moved by 400 and 550 cfs. There is no data between 200 and 550 cfs at XS 5+45. The number of largest rocks moved declined at XS 0+74 from 400 cfs to 550 cfs. Thus, threshold seems to fall somewhere between 400 and 500 cfs, rather than between 450 and 550 cfs.
21 of 23 March 30, 2010

Mono Basin Stream Restoration & Monitoring Program: " Synthesis of Instream Flow Recommendations" Public Review Draft Report
NO. PAGE PARAGRAPH SECTION NO. COMMENTS SCIENTISTS RESPONSE/ACTIONS BY
EXHIBIT A. LADWP's SPECIFIC COMMENTS
88 B17 2 B-3Hypothesis 3 cannot be right. Does one flow transport the all available bedload in a period of 8 days to deplete the sediment supply? The sediment transport can decrease or cease simply due to jerky rates of the bed load transports.
89 B27 3 3.3.4.3 There is no sediment rating curve presented (supposedly Figure 29) in the section. I found in the following section. It should be noted.
90 B40 Table 14 3.4.1 There is no Appendix G. Where are the figures?
91 B43 1 3.4.3It is said that the most deposition occurs in the first two days during the rising limb (200 to 400 cfs), so during the receding limb scouring can occur because of hysteresis you have mentioned. What are total accumulations of sediments before and after?
92 B-6Any text or numbers? It is hard to understand the figures without information such as length, diameter, orientation, and location of each LWD debrisand how far the pieces moved after what flow. Chanel width, slope, stage height, roughness, etc. are nice things to know as well. Is there any relationship between size/distance/number of LWD moved and discharge?
93 C3 C-3Figure C-4. Does the age structure of patches correspond to the consecutive wet years? Is it a high peak flow or relatively cooler and wet summer contributing to the success?
94 C4 C-4
Assumption 2 may not be accurate without knowing recharging and discharging patterns of groundwater along the channels. In the 8 Channel section, the stream is losing water according to the stage height and piezometer comparison shown in the Figure C-10 and C-11. Steepness of hydraulic gradient changes with discharge (lower the flow steeper the gradient). Even with 423 cfs in 2008, the piezometer does not show surface saturation (more than one foot below the ground level). When wells along the same cross section are compared (8C-5 and 8C-6), the water table is lower at 8C-6 most of the year even with perennial flows on 8 Channel, thus further supporting the non-horizontal plane of the water table (interestingly in Figure C-11, 8C-1 and 8C-3 are not presented to compare to 8C-2 and 8C-4 respectively for comparison along the same transect). Thus, the watertable should not be projected horizontally across, and the actual values of the depth to the water table for 91 cfs and 63 cfs should be larger in most of the riparian patches. The first paragraph in C-6 talks about the small change in stage height resulting in large change in water table level especially during low flows.
The change is more pronounced for the latter discharge change of 51 cfs to 21 cfs which resulting in the water table level change of 2.15 ft (page C6) than the former (101 cfs to 24 cfs which resulted in 0.56 ft of the water table drop even though C-10 shows the drop is more like 1.3 ft instead of 0.56 ft). This indicates that groundwater flow velocity is faster than the recharging rate of "the shallow aquifer", thus the hydraulic gradient is in part determined by storage of the aquifer. The aerial photos were taken after the peak during the receding limb (from Appendix A-1, a peak for Rush was in the beginning of June and a peak for Lee Vining was toward the mid June) with higher storage of the aquifers for both streams. Thus, the water table levels during 91 cfs and 63 cfs even with properly modeled water table elevation do only reflect the depth to the water table at these discharges during the receding limb, but not other time of the year, particularly in the mid to late summer. The depths should be greater than 3 ft and 5 ft for riparian patches.
95 C5 C-5The reasons for selecting 8 Channel for extensive groundwater studies are presented, but it is not justification to generalize the results from 8 Channel. We can study all we want at one study site, but we cannot generalize the results over the entire lower section creek without knowing the groundwater flow patterns in the other parts.
96 C6 C-6The primary mechanism for the relationships between stage height and groundwater level is not streamflow rate, but a combination of hydraulic conductivity, hydraulic gradient, sediment size and sorting (or porosity and connectivity), transmissivity, and storativy.
97 C8 C-6What is the root structure of the woody riparian species? How deep do root penetrate? Cottonwood, in particular, can grow their roots deeper into the substrate. Did the growth really cease under the condition described?
98 C8 C-6
The well data does not really support this point about snow bench. The data show extremely high hydraulic conductivity as the water table almost mimicking the stage height. So even without the bench the data suggest that the water table rises. C-12 and C-13 present confounding factors as the comparing 2006 to 2008, the surface areas of inundation has increased by switching 8 Channel to perennial. Can you achieve this spring bench preparation without opening a new channel? Is this trend of faster response observed in other wells near the main channel or other areas with wells without a side channel?
99 C15 C-6 How do you come up with these numbers (5 ft for Rush and 3 ft for Lee Vining)?100 C19 C-10 RY is 2008-2009, not 2009-2010. I assume the same for C-11.101 C19 C-10 Dates for dashed lines do not coincide with dates along the x-axis. It is confusing.
102 C20 C-11 Well data from 8C-1 and 8C-3 should be presented in the figure.
103 C21 C-12It is more informative if the flows during the same period are presented and periods during which water was flowing in 8 Channel are presented, particularly for 2003 to 2005 when the flows were not perennial, instead of having only a number of days.
22 of 23 March 30, 2010

Mono Basin Stream Restoration & Monitoring Program: " Synthesis of Instream Flow Recommendations" Public Review Draft Report
NO. PAGE PARAGRAPH SECTION NO. COMMENTS SCIENTISTS RESPONSE/ACTIONS BY
EXHIBIT A. LADWP's SPECIFIC COMMENTS
104 C26 C-17The figure shows that for pre perennial 8 Channel, the water table dropped dramatically around 60 cfs (I can see it starts dropping below 80 cfs), but for post perennial 8 Channel, the water table does not drop until the flow is below 50 cfs. Therefore, 80 cfs is not clear cut nor indicative of the data you are showing.
105 C31 C-22How was the 30 cfs elevation line determined? Is it the actual stage elevation of near by cross section? Or is it the water table elevation corresponding to when the flow was 30 cfs?
106 D4 D-2 The pool rating method by Platts and others was published in 1983, not 1987.
107 D-4GLR full is the best scenario for all years, and some years adding 5-Siphon does not make a large difference. Can you change a ratio of MGORD and 5-Siphon flowing into Rush? You have evaluated adding 5 and 10 cfs, but can you add more than that in the case GLR is not full? For instancefor 30 cfs summer baseflow, can you release 15 cfs from MGORD and 15 cfs from 5 Siphon?
108 D23 D-4.3 Why are a number of days falling outside the 52 and 67 range is greater for the smaller range (56 and 60) than the larger range (54 and 62.5).
109 D24 D-4.4 Lower the flow more cooling can take place according to the figures. Thus, if Rush is impaired at MGORD , then augmenting the flow is detrimental.
110 D29 D-4.4
The model result that lower flow with higher water temperature can cool down contradicts to the assumption made for the riparian vegetation. Well data from 8 Channel section was used to justify "80 cfs threshold" for the entire Lower Rush, and it is obvious that the section is losing water. Thus, the use of this 80 cfs threshold is admitting the entire Lower Rush is losing water. The loss of water through the channel should offset cooling by Parker and Walker, and the well data also show that the rate of loss is higher or hydraulic gradient is steeper for lower flows at least at 8 Channel section. So lower the flow, more water the creek should lose resulting greater offset of cooling by Parker and Walker. There are slight tendencies of increased temperature downstream from Walker, at least that is what the model says. How much of warming is attributable to heat gain or water loss? Or maybe Rush Creek gains back some water back or there are fine scale hyporheic flows in the Lower Rush section.
111 D49 D-4.18 and D-4.19 There is no horizontal line at 65°F. Did all the dates have the same discharge?
112 D49 D-4.20 and D-4.21 Where are actual values?
113 E10 E-1 to E-4Different terms are used for the last category of riparian growth and maintenance ("groundwater and saturating emergent floodplain surfaces" vs. "minimum streamflows recharging shallow groundwater and saturating emergent floodplain surface"). I think both describe the same thing, but it is confusing.
114 E10 E-1 to E-4
There are two years (1995 and 1996) whose discharges exceeded 500 cfs even under the SCE regulated flow regime (recurrence interval of 15 years or so). However, NGD for mainstem channel avulsion is zero for SCE regulated and SEF. Why are there no channel avulsion flow for those two scenarios? As matter fact, there is one actual day recorded in 1995 but that number does not appear on the average NGD section. 1996 event should appear here too, because a winter flood is as much as competent as a spring flood, and can be more competent because of high saturation of the soil.
115 E18 E-5 to E-12The title of the table should not contain "averages for each runoff year type, and average for all runoff years combined" since no such numbers are presented in those tables.
116 E34 E-13Why are some averages for all runoff years zero even though NGDs are non-zero for different runoff year types? How were the all runoff year values calculated?
117 F1 Appendix F Where is the description of scenario 7? I don't see any difference between scenario 4B and 7, yet they have slightly different numbers118 F2 Appendix F Table should be F-1, instead of E-1.119 Fig F-1 -F11 Appendix F Grant Lake spillway elevation should be updated to 47,171 af.
23 of 23 March 30, 2010