Embed Size (px)
Citation preview

Otaki River instream values and minimum flow assessment

1
Otaki River instream values and minimum flow assessment
Mike Thompson
Environmental Monitoring and Investigations Department
For more information, contact Greater Wellington:
Wellington PO Box 11646 T 04 384 5708 F 04 385 6960 www.gw.govt.nz
GW/EMI-T-11/133
September 2011
www.gw.govt.nz [email protected]
DISCLAIMER
This report has been prepared by Environmental Monitoring and Investigations staff of Greater Wellington Regional Council and as such does not constitute Council’s policy.
In preparing this report, the author has used the best currently available data and has exercised all reasonable skill and care in presenting and interpreting this data. Nevertheless, Council does not accept any liability, whether direct, indirect, or consequential, arising out of the provision of the data and associated information within this report. Furthermore, as Council endeavours to continuously improve data quality, amendments to data included in, or used in the preparation of, this report may occur without notice at any time.
Council requests that if excerpts or inferences are drawn from this report for further use, due care should be taken to ensure the appropriate context is preserved and is accurately reflected and referenced in subsequent written or verbal communications. Any use of the data and information enclosed in this report, for example, by inclusion in a subsequent report or media release, should be accompanied by an acknowledgement of the source.
The report may be cited as: Thompson, M. 2011. Otaki River instream values and minimum flow assessment. Greater Wellington Regional Council, Publication No. GW/EMI-T-11/133, Wellington.

Executive summary The Otaki River is one of the largest rivers emerging from the Tararua Range and has important ecological, recreational and cultural values. A wide range of fish species are supported in a variety of habitats from the upper catchment to the river mouth and the river is recognised as a regionally important trout fishery. Recreational activity, including rafting, swimming and angling is very popular in the upper reaches but very good water quality throughout the river leads to activity (mainly angling and swimming) in the lower reaches also. The river holds many important values for Maori – particularly relating to mauri, waahi tapu and mahinga kai. There is currently very little abstraction directly from the river, although irrigation water is taken from a tributary – the Waimanu Stream – and from shallow groundwater that is considered hydraulically connected to the river.
This report investigates flow requirements for sustaining important ‘instream’ values of the Otaki River and reviews the appropriateness of the existing minimum flow for the river specified in the Wellington Regional Freshwater Plan (RFP). While the Otaki River has a relatively high summer baseflow, it tends to naturally lose flow to groundwater before reaching the sea. Instream values in the lower reaches are likely to be under most threat during dry spells when this natural reduction in flows across the coastal plain is occurring. Existing shallow groundwater abstraction – as well as any increased future abstraction directly from the river – has the potential to further exacerbate low flows.
Two instream flow objectives relating to ecological values were determined to be of particular importance when reviewing the minimum flow of the Otaki River; maintenance of habitat (in particular, trout) and maintenance of passage for migratory fish. Instream habitat modelling and hydrological analysis found that a minimum flow of 4,120 L/s at the monitoring site ‘Pukehinau’ is expected to maintain fish habitat availability in the river as a whole by ensuring no more than 10% habitat loss compared with the mean annual low flow (MALF). This flow is also considered appropriate to ensure that the movement of large trout and migratory native fish in the lower river reaches is not unduly restricted for prolonged periods.
The recommended new minimum flow of 4,120 L/s is significantly higher than that in the existing RFP (2,550 L/s). It is suggested that core allocation is reviewed accordingly and that consideration be given to reviewing the flow at which consented water takes are restricted or prohibited to ensure that the minimum flow of the Otaki River is protected, particularly in the event that allocation in the catchment increases significantly. Additional recommendations are made relating to allocation including a suggestion that core allocation be applied to both direct surface water takes and groundwater takes in the catchment that are shown to deplete stream flows.

Contents
Executive summary i
1. Introduction 1 1.1 Report scope 1
2. Characteristics of the Otaki River catchment 2 2.1 Land use and vegetation cover 2 2.2 Channel morphology 4 2.3 Climate and hydrology 7 2.4 Water quality 10 2.4.1 RSoE site water quality and aquatic ecology 11 2.4.2 Recreational water quality and cyanobacteria 13
3. Water abstraction from the Otaki River 14 3.1 Water allocation and minimum flow policies 14 3.2 Current water allocation 15
4. Instream values of the Otaki River 17 4.1 Ecological values 17 4.2 Recreation and scenic values 19 4.3 Maori values 20 4.3.1 General values 20 4.3.2 The Otaki River 20 4.4 Effects of low flows on instream values 21
5. Reviewing minimum flow requirements of the Otaki River 22 5.1 Instream flow objectives 22 5.2 Instream flow requirements 23 5.2.1 General approach 23 5.2.2 Generalised habitat assessment 23 5.2.3 Fish passage 30 5.2.4 Regional approach to flow assessment 30 5.3 Effects of recommended minimum flows on other values 31 5.3.1 Effect on water levels at the river mouth 31 5.3.2 Recreational values 31 5.4 Summary 32
6. Implications for water allocation policies 33 6.1 Minimum flows and security of supply 33 6.2 Waimanu Stream 34 6.3 Other considerations: core and supplementary allocations 35 6.3.1 Core allocation scenarios 35 6.3.2 Consideration of groundwater abstractions in the core allocation 39 6.3.3 Supplementary allocation 39 6.4 Implication of the proposed new minimum flow for existing users 39
7. Conclusions and recommendations 41 7.1 Recommendations 42

References 43
Acknowledgements 46

Otaki River instream values and minimum flow assessment
WGN_DOCS-#800167-V1 PAGE 1 OF 46
1. Introduction The Otaki River has very good water quality and is considered to have relatively high ecological values. The river is regionally significant for its trout habitat and angling as well as providing for many other recreational pursuits such as picnicking, swimming, kayaking and rafting.
This report investigates flow requirements for sustaining key ‘instream’ values of the Otaki River. Instream values are the values relating to a river or stream’s environment and include ecological, recreational and Maori cultural values.
Abstractive demand on the river is currently very low with only about 3% of the core allocation specified in Greater Wellington’s (WRC 1999) Regional Freshwater Plan (RFP) utilised. While a significant increase in demand in the near future is considered unlikely, longer term allocation scenarios are harder to predict, especially given the projected population growth on the Kapiti Coast and the water supply needs that will potentially be associated with this.
The RFP also specifies minimum flow policies for the Otaki River, which require water abstraction to cease or reduce during times of low flow. The minimum flow has not been breached since records began in 1980 and restriction policies for surface water takes have rarely, if ever, been activated The policies are based on a combination of site-specific and ‘rule-of-thumb’ flow assessments completed in the mid-1990s.
A review of the RFP commenced early in 2010. This includes a review and update of the policies relating to water allocation and minimum flows for many rivers and streams in the Wellington region. Knowledge of the instream values of the Otaki River, and flow requirements for protecting those values, is important for checking the appropriateness of the existing water allocation and minimum flow policies for the river. The information gathered for this report will therefore inform the RFP review.
1.1 Report scope The report contains:
• A background description of the Otaki River’s characteristics;
• Information on consented water abstraction from the river;
• An assessment of the river’s instream values;
• An assessment of minimum flow requirements to achieve objectives that relate to the key instream values (known as an ‘instream flow assessment’); and
• Recommendations relating to the river’s water allocation and minimum flow policies to be considered during the review of the RFP.

Otaki River instream values and minimum flow assessment
PAGE 2 OF 46 WGN_DOCS-#800167-V1
2. Characteristics of the Otaki River catchment The Otaki River drains the central Tararua Range and has a catchment area of 345 km2. This is almost three times the area of the neighbouring Waikanae River catchment and the largest of all of the catchments draining the western side of the Range. Almost 90% of the catchment is mountain or steep hill country in the Tararua Forest Park. The river emerges from the Forest Park through a series of gorges onto the alluvial Kapiti Coast plain. It flows for about 10 km across this plain before discharging via an estuary to the Tasman Sea just south of Otaki township (Figure 2.1).
Figure 2.1: Location of the Otaki River catchment and the NIWA flow recorder site ‘Pukehinau’ (red triangle)
Within the Tararua Forest Park there are several significant tributary streams including the Waitewaiwai and Waitatapia streams to the north and Penn Creek and Waiotauru Stream to the south. Numerous minor gully streams also enter the main stem of the river. On the coastal plain there are some minor spring-fed channels that join the main river within 1-2 km of the Gorge but the only substantial tributary inflow is from Waimanu Stream (referred to by some people as Rahui Stream). This stream joins the river on its north bank approximately 2 km upstream of SH1.
2.1 Land use and vegetation cover Within the Tararua Range, the Otaki River catchment retains its natural forest cover (Figure 2.2); a mix of alpine scrub, beech, and broadleaf podocarp. On

Otaki River instream values and minimum flow assessment
WGN_DOCS-#800167-V1 PAGE 3 OF 46
the coastal plain, natural forest has been almost entirely cleared. Only small remnant pockets of forest remain (e.g., south of the river and east of SH1). While agriculture is the dominant land use by area on the wider plain, the Otaki River catchment comprises a patchwork of additional land uses including lifestyle blocks, urban settlement, horticulture and market gardens, and plantation forestry. Significant areas of farming include dairying, deer, sheep and beef in the upper catchment, particularly to the north of the river in the Waimanu Stream catchment, and beef and dairy farming in the lower catchment (below SH1). Directly adjacent to the river channel, riparian vegetation is highly modified and dominated by soil conservation plantings of willow and poplar. Scattered bushes of shrubby weeds such as gorse, lupin and wattle are common on the river and stop banks (Boffa Miskell 2001).
Figure 2.2: Land cover and use in the Otaki River catchment and surrounding coastal plain, compiled from data from AgriBase (AgriQuality 2002) and Land Cover Database 2 (Ministry for the Environment 2001)
Tidswell (2009) summarises changes in land use over the past 50 years on the wider coastal plain. Prior to 1960 much of the land on the plain was used for dairy farming. Conversion of dairy to market gardening began around the 1960s and in the 1980s there was rapid development of land into horticulture blocks of kiwifruit. There was a corresponding increase at this time in the number of groundwater bores drilled on the plain as dependence on groundwater for irrigation grew rapidly.
More recently there has been a conversion of kiwifruit orchards into other types of orchards, market gardens or back into dairy pasture. Dairy farming has

Otaki River instream values and minimum flow assessment
PAGE 4 OF 46 WGN_DOCS-#800167-V1
intensified with larger herds and more demand for water. There has also been an increase in the number of lifestyle blocks and an expansion of coastal settlements, which generally rely on shallow bore water to supplement public supply.
2.2 Channel morphology On leaving the Tararua Range at the gorge, the Otaki River bed gradient flattens for a short distance as the channel goes through an ‘S’ bend (Figure 2.3) and then steepens again as it takes a relatively direct path to the sea across the coastal plain. The gradient across the plain is fairly uniform, dropping about 5 m per km, until it flattens out in the last 500–800 m through the tidal estuarine zone near the river’s mouth.
Figure 2.3: Longitudinal section of the Otaki River bed (bold black line) and bank profiles compiled from 1991 Greater Wellington survey data (note vertical exaggeration)
The river takes the form of a semi-braided channel at moderate flows and a single thread channel with alternating gravel beaches during low flows. When the river first emerges from the gorge it is deeply entrenched in alluvial deposits with high gravel banks and terraces, particularly on the south bank (see bank profiles in Figure 2.3 and Figure 2.4). By Chrystalls Bend, about half way across the plain, bank height has markedly reduced and in the reach below SH1 the channel is confined by rock-lined stop banks. The river has a direct opening to the sea through a gravel spit formation, which is enlarged by flood flows, and then reduced by the coastal longshore movement of sediment. Large bed material (cobble to boulder) occurs throughout the lower river

Otaki River instream values and minimum flow assessment
WGN_DOCS-#800167-V1 PAGE 5 OF 46
channel to the sea but there is some reduction in average grain size moving downstream (WRC 1992) as well as an increasing proportion of fine sediment.
Distance from left bank survey point (m)
0 100 200 300 400
Ele
vatio
n ab
ove
sea
leve
l (m
)
0
20
40
60
80
1.5 km upstream from river mouth(lower study reach)
SH1 bridge
2 km downstreamfrom gorge(upper study reach)
Gorge near Pukehinau(flow monitoring site)
Figure 2.4: Selected Greater Wellington survey cross sections of the Otaki River channel from Pukehinau within the gorge (top section) to near the river mouth (bottom section). Elevation is metres above sea level and sections begin at the highest left bank survey point (note vertical exaggeration). Water levels on the date of survey (1 December 2005) are depicted by the blue lines.
Much of the river channel on the coastal plain has been modified over time by river ‘training’ (straightening and channelising) and other intensive flood management control works. In addition, the high sediment load of the river has led to periodic gravel extraction works in the lower reaches (e.g., Figure 2.5).
The photos in Figures 2.6 and 2.7 illustrate general channel and bank characteristics of the river at the head of the coastal plain and near the river mouth, respectively.

Otaki River instream values and minimum flow assessment
PAGE 6 OF 46 WGN_DOCS-#800167-V1
Figure 2.5: Gravel extraction and channel control works at Chrystalls Bend
Figure 2.6: Otaki River at the ‘S’ bend, about 2 km downstream from the gorge

Otaki River instream values and minimum flow assessment
WGN_DOCS-#800167-V1 PAGE 7 OF 46
Figure 2.7: Otaki River about 1.5 km upstream from the river mouth (looking downstream)
2.3 Climate and hydrology Rainfall in the Otaki catchment is strongly influenced by the Tararua Range. Mean annual rainfall varies from about 1,000 mm on the western coastal plain, to over 5,000 mm in the central Tararua Range. Rainfall within the Tararua Range is reasonably evenly distributed throughout the year; while summers are noticeably drier, mean monthly totals for the period January to April are still approximately two thirds of the mean totals in the winter months of July to October.
River level is continuously measured by NIWA1 at the site ‘Otaki River at Pukehinau’, a short distance upstream from where the river emerges onto the plains (refer to Figure 2.1). The channel bed at this site is mobile alluvial gravel and Greater Wellington undertakes regular spot flow gaugings to maintain a stage-to-flow rating. Records for the site begin in July 1980 and are considered suitable for use in low flow analyses. Prior to the Pukehinau site, river level was monitored for eight years (1972–1980) at a nearby site called ‘Tuapaka’. While it is not considered necessary to include the Tuapaka data in contemporary flow analyses (since there are now 30 years of record for Pukehinau), comparison of the flow recession curves for the two sites undertaken by WRC (1994) showed no indication of a significant change in river flow behaviour between the 1970s and 1980s.
Due to having its headwaters deep in the Tararua Range, and a large catchment area, the Otaki River is generally not subject to prolonged extreme low flows. Its 7-day mean annual low flow (MALF) of 5,220 L/s at Pukehinau (Table 2.1) equates to a specific flow of 17.1 L/s/km2. This is one of the highest specific discharges of rivers in the Wellington region and similar to the other major
1 National Institute of Water and Atmospheric Research Ltd.

Otaki River instream values and minimum flow assessment
PAGE 8 OF 46 WGN_DOCS-#800167-V1
rivers emerging from the central Tararua Range such as the Waingawa and Waiohine rivers in the Wairarapa (Harkness 1998). The Otaki River also falls into the ‘high baseflow’ category of Beca (2008); i.e., MALF is more than 1/20th of the mean flow (30,790 L/s) and occurs, on average, less than 4% of the time.
Table 2.1: Low flow statistics for Otaki River at Pukehinau, based on July 1980 to June 2009 low flow analysis (GEV fit) using all available data
Statistic 1-day MALF (L/s) 7-day MALF (L/s)
Mean annual low flow 4,770 5,220
5-year return period low flow 4,000 4,280
10-year return period low flow 3,590 3,800
There have been several concurrent (same day) flow gauging runs carried out in the last 20 years, and numerous other ‘spot’ gaugings at various locations. As shown by the concurrent gauging results from March 1994, March 1998, July 2000 and April 2003 (Figure 2.8), during low flow conditions there is an overall loss to groundwater2 between the Pukehinau monitoring site in the gorge and the river mouth (represented by the gauging site ‘500m above mouth’). The flow loss is in the order of 20% between Pukehinau and ‘Lower Transmission Lines’ (about 1.8 km upstream of the river mouth), and a further 5% to the river mouth. This is consistent with groundwater-related studies that have found a considerable flow loss between the gorge and SH1.
Puke
hinau
Top T
rans
miss
ion Li
nes
Crys
tals B
end
Shing
le Pl
ant
Stat
e High
way O
ne
Lowe
r Tra
nsm
ission
Line
s
500m
Abo
ve M
outh
Flow
(L/s)
2000
3000
4000
5000
6000
7000
80001/3/1994 23/3/1998 19/7/2000 15/4/2003
Figure 2.8: Same day low flow measurements at seven sites on the Otaki River from Pukehinau in the gorge (upstream) to 500 upstream from the river mouth
2 Direct abstraction from the river is effectively nil (see Table 3.2) so does not account for the loss of flow, although depletion from nearby groundwater takes may comprise some of the loss.

Otaki River instream values and minimum flow assessment
WGN_DOCS-#800167-V1 PAGE 9 OF 46
The flow loss to groundwater between Pukehinau and SH1 is thought to occur mainly at ‘Galloways Node’, a large shingle bar just downstream of where the river emerges from the gorge (WRC 1994). Some of this loss reappears as substantial spring flow nearer Otaki township, including the Waimanu Spring which re-enters the main river channel upstream of SH1 (via Waimanu Stream).
It is difficult to accurately estimate natural mean annual low flow statistics for various reaches of the Otaki River due to the lack of gaugings at a range of flows (and knowledge of the influence of water abstractions on those gaugings). Nevertheless, estimates can be made by assuming the concurrent flow gaugings shown in Figure 2.8 were representative of typical low flow behaviour of the river. These flow estimates are shown in Table 2.2 for most of the locations marked in Figure 2.9 and can be considered ‘natural’ flow estimates in the sense that direct abstraction from the river is very minor (i.e., ~1% of MALF at Pukehinau) and can effectively be discounted. However, it should be recognised that abstractions from shallow groundwater (discussed in more detail below), which may be a relatively significant component of total flow loss, have not been accounted for in estimating low flow statistics.
Table 2.2: Estimated mean annual low flows of the Otaki River based on correlation of spot gaugings at ‘Middle’ and ‘Upper’ sites with continuous flow data from the ‘Upper’ site Gorge at Pukehinau. Gaugings used in this analysis are shown in Figure 2.8.
River reach
Location Estimated 1-day MALF (L/s)
Estimated 7-day MALF (L/s)
Upper Gorge at Pukehinau 4,770 5,220
Upper Study Reach1 4,550 4,980 Middle
Top Transmission Lines 4,330 4,735
SH1 4,080 4,460
Lower Transmission Lines/Study Reach1 3,870 4,230
Lower
500 m above Mouth 3,870 4,230 1 ‘Study Reach’ refers to reaches of river in which instream habitat surveys were carried out in April 2010 as part of the assessment described later in this report. These surveys are discussed in more detail in Section 5.2.
There are no firm data or verified observations to indicate that the Otaki River dries up. However, WRC (1994) summarised anecdotal accounts of trout mortality due to low flows upstream of SH1 in the summer of 1974/75 and of dry river beds in 1929 and 1935 (there are no descriptions of where or for how long flow stopped). Historical drying of the river bed may have been related to a broader active channel and gravel accumulations (before the extensive river training and gravel extraction works began) rather than lower flows emerging from the gorge than have been observed in more recent times. However, while there is no justification for attempting to formally recognise these ‘events’ in low flow frequency analysis, the possibility that more extreme low flows have occurred prior to the available monitoring record should be acknowledged in river management plans.

Otaki River instream values and minimum flow assessment
PAGE 10 OF 46 WGN_DOCS-#800167-V1
Figure 2.9: Map of the Otaki River catchment on the coastal plain. Locations for which low flow statistics have been estimated in Table 2.2 are highlighted (black dots) as well as locations of surface water abstractions from Waimanu Stream that are considered part of the main river’s core allocation (blue pins).
There is a high degree of hydraulic connection between the Otaki River and the groundwater in the shallow unconfined gravel aquifer that runs the length of the river on the coastal plain (the ‘Otaki Groundwater Zone’). This connection is indicated by both the flow loss observed in the concurrent gauging results (noted above) and by the analysis of shallow groundwater level responses to river stage peaks (WRC 1994). It has been shown that bed leakage is likely to be induced as a result of shallow groundwater abstractions near the river (e.g., Cussins (1994) and Boffa Miskell (2000).
2.4 Water quality Information on water quality in the Otaki River is important for determining the condition and significance of instream values. Greater Wellington routinely monitors water quality at two sites on the river as part of the Rivers State of Environment (RSoE) monitoring programme; ‘Pukehinau’ (flow monitoring site) and ‘River Mouth’. A site at the SH1 road bridge is also sampled as part of the Recreational Water Quality (swimming sites) monitoring programme and some historical water quality data exists for another popular swimming site called ‘The Pots’ in the gorge near Pukehinau.
The RSoE sites are sampled on a monthly basis with water samples tested for a variety of physico-chemical and microbiological variables. Biological monitoring (of periphyton and macroinvertebrates) is also carried out annually at these sites. The SH1 swimming site is sampled on a weekly basis over summer (November to March inclusive) with water samples tested for E. coli, an indicator of the presence of harmful bacteria. Temperature and turbidity are also measured and riverbed periphyton cover is estimated.

Otaki River instream values and minimum flow assessment
WGN_DOCS-#800167-V1 PAGE 11 OF 46
2.4.1 RSoE site water quality and aquatic ecology A water quality index (WQI) is used to enable inter-site comparisons of water quality in rivers and streams in the Wellington region. The WQI, as outlined by Perrie (2007), is derived by comparing the median results of six variables with guidelines: dissolved oxygen, clarity, E. coli, nitrite-nitrate nitrogen, ammoniacal nitrogen, and dissolved reactive phosphorus (DRP). Application of the WQI to the Otaki River monitoring results found that in recent years (2006/07–2009/10) both sites had ‘excellent’ water quality (Table 2.3), ranking in the top 10 of the 56 sites in the monitoring programme (Perrie 2007, 2008 & 2009, Perrie & Cockeram 2010). The Otaki is one of very few rivers in the Wellington region that maintains such high water quality throughout its length.
Water quality was classed as ‘good’ at both sites for the sampling period 2003-2006 because visual clarity did not meet the guideline values. However, this was attributed to sampling coinciding with more wet weather (high flow) events than in previous or subsequent reporting periods rather than an actual change in water quality (Perrie 2007).
Table 2.3: Otaki River water quality index (WQI) grades and Macroinvertebrate Community Index (MCI) classification, 2003–2006
Guideline compliance (median values)
Diss
olve
d ox
ygen
Clar
ity
E.co
li
Nita
rte
nitro
gen
Amm
oniac
al ni
troge
n
Diss
olve
d ph
osph
orus
Overall WQI
grade MCI classification
2003– 06 median Good
Excellent (Pukehinau)
Good (Mouth)
2007/08 Excellent Excellent (Pukehinau)
Fair (Mouth)
2008/09 Excellent Excellent (Pukehinau)
Excellent ( Mouth)
2009/10 Excellent Excellent (Pukehinau)
Fair ( Mouth) The Macroinvertebrate Community Index (MCI) classification has been consistently ‘excellent’ for the Pukehinau site but more changeable for the River Mouth site with results ranging from ‘fair’ to ‘excellent’ over the period 2003–2010 (Table 2.3). Historical macroinvertebrate data collected by Boffa Miskell in 1992 indicate little change has occurred in the past 20 years; ‘excellent’ scores were found in the gorge and ‘good’ scores at SH1 and the river mouth (Boffa Miskell 2000).
The generally very good water quality in the mid and lower reaches of the Otaki River is a reflection of some favourable catchment features. Most

Otaki River instream values and minimum flow assessment
PAGE 12 OF 46 WGN_DOCS-#800167-V1
significantly, a large proportion of the catchment land cover remains as unmodified indigenous forest in the Tararua Range. On its short journey across the plain, the river is buffered to some extent from surrounding farmland runoff by wide vegetated banks and there are no highly impaired lowland tributary inputs or point source discharges entering downstream of the Tararua Forest Park. Nevertheless, MCI results for the River Mouth site suggest invertebrate community structure is impaired at times in the lowest reaches of the river; this is likely to be a function of reduced habitat diversity (the river is wide and shallow with uniformly coarse substrate in this area) rather than water quality.
Periphyton (algae) monitoring shows there has been general compliance with national guidelines (Perrie 2007, 2008 and 2009, Perrie & Cockeram 2010). No filamentous periphyton or algal mats have been observed in recent years at the Pukehinau site and periphyton biomass has been very low (see Table 2.4). However, biomass has been noticeably higher at the downstream River Mouth site and there have been a few occasions at this site when growth of filamentous algae or algae mat coverage has exceeded guidelines for aesthetic quality. The periodic tendency for nuisance periphyton growth in the lower reach of the river may be linked to favourable growth conditions such as relatively sluggish flow and the higher water temperatures that are common in shallow, unshaded reaches.
Table 2.4: Summary of compliance of periphyton cover at Otaki River RSoE sites with national guidelines (based on monthly sampling during the periods 2003–2006, 2007/08, 2008/09 and 2009/10)
Streambed cover (%)
Filamentous Mats Periphyton biomass
Number exceeded
Number of
samples
Number exceeded
Number of
samples
ADFM1
(g/m2)
Chla2
(mg/m2)
Pukehinau 0 32 0 32 0.73 2.26 2003–06
Mouth 0 30 3 29 5.57 6.38
Pukehinau 0 10 0 10 0.36 1.13 2007/08
Mouth 0 9 0 9 1.24 4.96
Pukehinau 0 11 0 11 0.36 0.7 2008/09
Mouth 1 12 1 12 1.25 2.5
Pukehinau 1 11 0 11 0.58 2.22 2009/10
Mouth 1 12 0 12 0.98 2.12 1ADFM = Ash-free dry weight 1Chla = Chlorophyll a
During the compilation of this report, no information was found on the quality of water in the estuary at the river mouth; Kapiti Coast District Council does undertake some water sampling in the estuarine reaches but the testing is limited to microbiological parameters only.

Otaki River instream values and minimum flow assessment
WGN_DOCS-#800167-V1 PAGE 13 OF 46
2.4.2 Recreational water quality and cyanobacteria Summer sampling at The Pots and SH1 provides further indication of excellent water quality in the Otaki River; only one significant exceedance of the Ministry for the Environment/Ministry of Health (2003) national microbiological guidelines3 has been measured at each site since 2001. However, mat-forming algae, including toxic cyanobacteria, of bed coverage that could present a nuisance (or health hazard) to swimmers has been observed by council staff during at least one recent summer (2005/06) in the lower river reaches (Milne & Watts 2007). While flows were not extremely low across this summer as a whole, consecutive months of below average rainfall in spring and record low flows (hovering around 7-day MALF) during November provided for ideal algae growth conditions. In general, cyanobacteria growth is not a significant issue in the Otaki River.
3 A sample result exceeding 550 E. coli per 100 mL and deemed to indicate an unacceptable microbiological risk to swimmers.

Otaki River instream values and minimum flow assessment
PAGE 14 OF 46 WGN_DOCS-#800167-V1
3. Water abstraction from the Otaki River 3.1 Water allocation and minimum flow policies
Greater Wellington’s RFP, which became operative in 1999, specifies the following water allocation and minimum flow policies for the Otaki River (summarised in Table 3.1):
• ‘Core allocation’ (the amount of water to be taken below a flow of 5,175 L/s at Pukehinau) shall not exceed 2,120 L/s;
• When the river flow drops to 4,375 L/s at Pukehinau, abstraction will reduce to 1,820 L/s;
• When the river flow drops to 3,975 L/s at Pukehinau, abstraction will reduce to 1,400 L/s;
• The minimum flow is 2,550 L/s at Pukehinau.
These policies were set using a combination of instream study results and ‘rule of thumb’ approaches based on best information available at the time.
Table 3.1: Flow limits and water allocation for the Otaki River in the Regional Freshwater Plan (1999). All flows are measured at the Pukehinau monitoring site.
Category Flow (L/s) Minimum flow 2,550 Core allocation 2,120 Supplementary allocation flow 5,175
Flow limit 4,375 First stepdown Allocation 1,820 Flow Limit 3,975 Second stepdown Allocation 1,400
The core allocation of 2,120 L/s was set based on the difference between low flow and minimum flow statistics in the gorge4. This was consistent with the approach taken in the RFP for other rivers where allocation was low at the time and could not be directly translated into an allocation cap. Step-downs in allocation during flow recession were also set arbitrarily in line with a regional approach.
The minimum flow was based on the results of an IFIM study by Jowett (1993). That study recommended a flow of 1,780 L/s (which was equal to 40% of MALF in the gorge) was required to maintain at least two thirds of adult brown trout habitat in this part of the river. Flow loss to groundwater across the coastal plain and minor input from Waimanu Stream was then taken into account and the IFIM minimum flow was adjusted upwards with the aim of ensuring that 1,780 L/s was maintained in all reaches across the plain. With flow losses and gains taken into account the adjusted IFIM minimum flow became 2,550 L/s.
4 There is some uncertainty as to the exact low flow statistics used but they are likely to have been derived from a combination of Tuapaka and Pukehinau flow monitoring records (both sites are located in the gorge) rather than just data from the existing Pukehinau site.

Otaki River instream values and minimum flow assessment
WGN_DOCS-#800167-V1 PAGE 15 OF 46
An analysis of the flow data for the ‘Otaki River at Pukehinau’ site (Figure 3.1) shows that the minimum flow of 2,550 L/s has never been breached since monitoring at the site began in 1980 and is roughly equivalent to a 1-in-100 year return period low flow (averaged over one day). The lowest recorded instantaneous flow at Pukehinau in the last 30 years was 3,143 L/s on 30 April 2003 at the end of a very dry summer. The 1-day and 7-day average low flows resulting from the same dry spell were also the lowest on record.
1980 1990 2000 2010
Mea
n da
ily fl
ow (L
/s)
0
2000
4000
6000
8000
10000
Current minimum flow 2,550 L/s
April / May 2003
Figure 3.1: Mean daily flow for the Otaki River over 1980–2010 (only low flow portion of hydrograph shown)
3.2 Current water allocation There are currently no resource consents for direct abstractions of water from the Otaki River, a unique situation when compared with other major rivers in the Wellington region. However, there are seven consented abstractions from tributary streams – mainly the Waimanu (Rahui) Stream – (Figure 2.9 and Table 3.2) that are considered part of the river’s core allocation. Together, these seven core allocation consents have a combined take of 68 L/s. This represents only 3% of the current allocable volume of water for the Otaki River and about 1% of MALF at Pukehinau.
In addition to the consented takes listed in Table 3.2 and just described, there are likely to also be un-consented (mainly ‘permitted activity’) water takes. Under Rule 7 of the RFP, the maximum allowable un-consented take volume is 20,000 litres per day (at maximum instantaneous rate 2.5 L/s). While the combined magnitude of un-consented water takes from the Otaki River catchment is unknown, a recent study commissioned by Greater Wellington (Beca 2010) estimated un-consented surface water takes in the neighbouring Mangaone and Waitohu catchments to comprise between 2% and 4% of 7-day MALF in the respective catchments. It is reasonable to extrapolate these
Otaki River instream values and minimum flow assessment
PAGE 16 OF 46 WGN_DOCS-#800167-V1
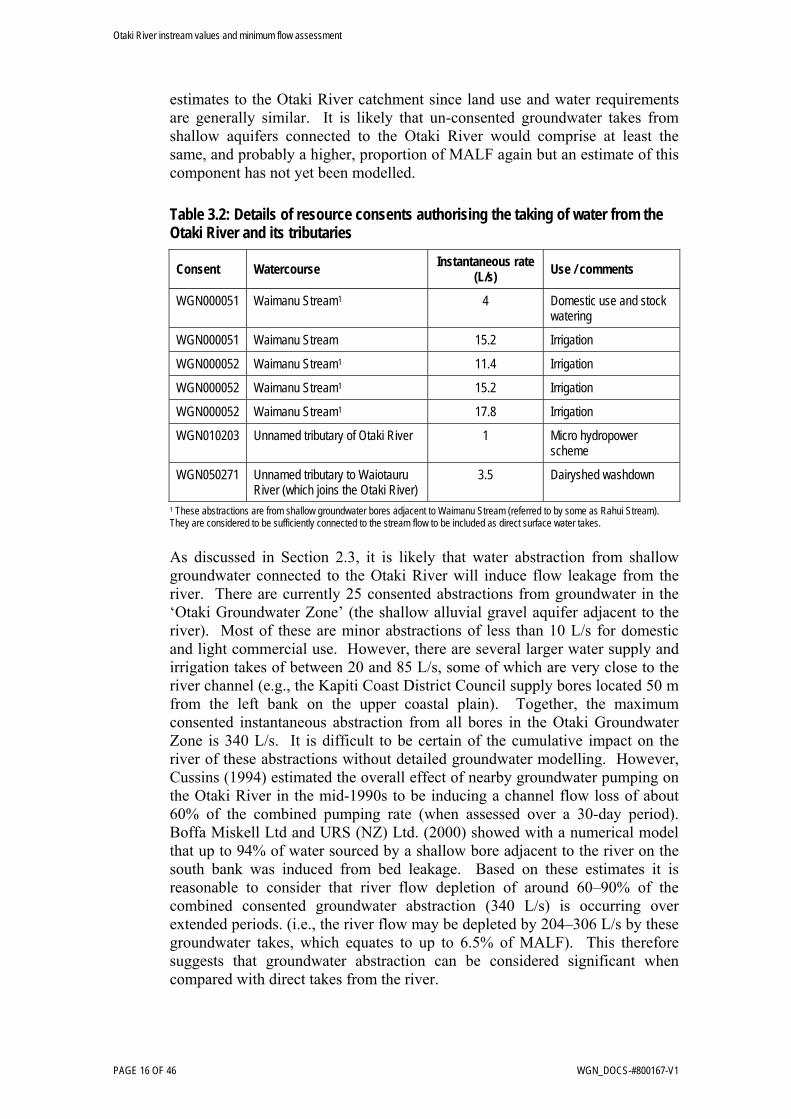
estimates to the Otaki River catchment since land use and water requirements are generally similar. It is likely that un-consented groundwater takes from shallow aquifers connected to the Otaki River would comprise at least the same, and probably a higher, proportion of MALF again but an estimate of this component has not yet been modelled.
Table 3.2: Details of resource consents authorising the taking of water from the Otaki River and its tributaries
Consent Watercourse Instantaneous rate (L/s) Use / comments
WGN000051 Waimanu Stream1 4 Domestic use and stock watering
WGN000051 Waimanu Stream 15.2 Irrigation
WGN000052 Waimanu Stream1 11.4 Irrigation
WGN000052 Waimanu Stream1 15.2 Irrigation
WGN000052 Waimanu Stream1 17.8 Irrigation
WGN010203 Unnamed tributary of Otaki River 1 Micro hydropower scheme
WGN050271 Unnamed tributary to Waiotauru River (which joins the Otaki River)
3.5 Dairyshed washdown
1 These abstractions are from shallow groundwater bores adjacent to Waimanu Stream (referred to by some as Rahui Stream). They are considered to be sufficiently connected to the stream flow to be included as direct surface water takes. As discussed in Section 2.3, it is likely that water abstraction from shallow groundwater connected to the Otaki River will induce flow leakage from the river. There are currently 25 consented abstractions from groundwater in the ‘Otaki Groundwater Zone’ (the shallow alluvial gravel aquifer adjacent to the river). Most of these are minor abstractions of less than 10 L/s for domestic and light commercial use. However, there are several larger water supply and irrigation takes of between 20 and 85 L/s, some of which are very close to the river channel (e.g., the Kapiti Coast District Council supply bores located 50 m from the left bank on the upper coastal plain). Together, the maximum consented instantaneous abstraction from all bores in the Otaki Groundwater Zone is 340 L/s. It is difficult to be certain of the cumulative impact on the river of these abstractions without detailed groundwater modelling. However, Cussins (1994) estimated the overall effect of nearby groundwater pumping on the Otaki River in the mid-1990s to be inducing a channel flow loss of about 60% of the combined pumping rate (when assessed over a 30-day period). Boffa Miskell Ltd and URS (NZ) Ltd. (2000) showed with a numerical model that up to 94% of water sourced by a shallow bore adjacent to the river on the south bank was induced from bed leakage. Based on these estimates it is reasonable to consider that river flow depletion of around 60–90% of the combined consented groundwater abstraction (340 L/s) is occurring over extended periods. (i.e., the river flow may be depleted by 204–306 L/s by these groundwater takes, which equates to up to 6.5% of MALF). This therefore suggests that groundwater abstraction can be considered significant when compared with direct takes from the river.

Otaki River instream values and minimum flow assessment
WGN_DOCS-#800167-V1 PAGE 17 OF 46
4. Instream values of the Otaki River This section outlines the ecological, recreational and tangata whenua values associated with the Otaki River with particular reference to the influence on these values of the river’s flow regime.
4.1 Ecological values The Otaki River and associated estuary at the river mouth provide a range of aquatic habitat types. This, along with very good water quality in the main stem of the river, means that the ecological values of the river are generally high.
The Otaki River is listed in both the operative Regional Freshwater Plan (RFP, Wellington Regional Council 1999) and the proposed Regional Policy Statement (pRPS, Greater Wellington 2010) as a water body with significant indigenous ecosystems and threatened indigenous fish. Records of fish observed in the catchment held in the New Zealand Freshwater Fish Database (NZFFD) are listed in Table 4.1. The following native fish species are listed as threatened and described as “at risk” by Allibone et al. (2010) and Townsend et al. (2008): longfin eel, giant kokopu, shortjaw kokopu, redfin bully, koaro, torrentfish and dwarf galaxias. All of these species are described as “declining” and the shortjaw kokopu has a relatively sparse population. For some of these species (e.g., dwarf galaxias and the kokopu species) it is the smaller tributaries in the Tararua Forest Park that are likely to provide more significant habitat rather than the main Otaki River.
Table 4.1: Fish species caught in the Otaki River catchment and recorded in the New Zealand Freshwater Fish Database (downloaded 15 May 2010). Threat status is derived from Allibone et al. (2010) and Townsend et al. (2008) and species are “non-threatened” unless otherwise stated. Underlined names indicate introduced species.
Where found Species Mainstem Tributary
Threat status
Brown trout Giant kokopu* At risk, gradual decline Banded kokopu* Shortjaw kokopu* At risk, sparse, declining Dwarf galaxias At risk, declining Common bully* Redfin bully* At risk, declining Longfin eel* At risk, declining Shortfin eel* Koaro* At risk, declining Torrentfish* At risk, declining Inanga**
* Migratory native species. ** Not listed in NZFFD but recorded by Boffa Miskell (2001).

Otaki River instream values and minimum flow assessment
PAGE 18 OF 46 WGN_DOCS-#800167-V1
Inanga have not been recorded from the Otaki catchment in the NZFFD, however, Boffa Miskell (2001) caught numerous individuals during a survey of the lower reach and estuary and the pRPS (Greater Wellington, 2010) identifies the tidally-influenced part of the river as inanga spawning habitat.
The Otaki River is also listed in the RFP as a water body with important trout habitat, and water quality is therefore to be managed for fishery and fish spawning purposes. Brown trout are listed in the NZFFD records as being present in both the main stem and tributaries. Trout angling is a significant recreational activity in the river catchment and the fishery resource is highly valued by the community (see Section 4.2).
The majority of the fish species found in the Otaki River are diadromous (i.e., migrate between freshwater and marine environments to complete their lifecycle). Thus maintaining passage is extremely important to sustain the existing fish community. Some of these diadromous species are not notable climbers (e.g., inanga) and their upstream penetration into catchments can be compromised by velocity barriers or by dry reaches. Neither of these are currently thought likely to occur in the lower reaches of the Otaki River but could be possible under extreme low flow conditions.
In the summer of 2001 Boffa Miskell (2001) conducted a broad baseline ecological survey of the lower river (downstream of SH1) and estuary. This was done for the Kapiti Coast District Council as part of their environmental investigations relating to a proposed river water supply scheme5. Some of their results are summarised here. The authors found “a relatively low abundance of freshwater fish compared with the neighbouring Waikanae River and Waitohu Stream” and suggested that this may reflect the rather low diversity of habitat available as a result of the high flow, uniformly coarse substrate and extensive flood control works in the lower river. The abundance and diversity of birdlife was considered to be typical of such estuarine areas and was consistent with populations recorded in the 1980s. Further up the Otaki River (e.g., inland from SH1), shifting shingle islets provide a relatively safe and sheltered resting place for sea and water birds (Boffa Miskell 1992) although these islets are not expected to offer attractive long-term habitat or breeding grounds. Aquatic macroinvertebrates in the lower reaches of the river were generally found to be abundant with high levels of diversity, and were suggested to be indicative of a fundamentally healthy river system. These results are consistent with Greater Wellington macroinvertebrate sampling at the river mouth (refer Section 2.4.1).
Boffa Miskell (2001) drew a general conclusion from their survey work that examples of poor biotic diversity in the lower river (e.g., freshwater fish) were probably related to a poor range of habitats rather than the effects of low flows. They also suggested that the habitats associated with the backwaters, drains and wetlands in the tidal zone are of greatest importance in the lower Otaki River environment as a whole.
A more recent assessment by Robertson and Stevens (2007) also concluded that habitat diversity in the estuary is relatively low (due to the absence of salt
5 The scheme was not granted resource consent.

Otaki River instream values and minimum flow assessment
WGN_DOCS-#800167-V1 PAGE 19 OF 46
marsh or intertidal flats), that the estuary is generally well-flushed by river flows and the authors gave the estuary an overall vulnerability rating of “low”. It is worth noting that the estuary at the Otaki River mouth is neither explicitly listed in the RFP for high ecological value nor targeted for habitat management.
4.2 Recreation and scenic values The Otaki River is listed in the RFP and the pRPS as having regionally significant amenity and recreational values. The river is known to support a wide range of recreational pursuits from its headwaters to the sea and possess areas of considerable scenic beauty. Community consultation on recreational and amenity values of the river has occurred in the past, mainly as part of the development of the Otaki River Floodplain Management Plan (WRC 1998). One of the main findings from past consultation – of relevance to this study – was that people who valued the river often did not consciously reflect on particular sites or attributes of importance but rather appreciated the river as an intrinsic part of the character of the Otaki district (Boffa Miskell 1992).
More recently, respondents to a survey on recreational values conducted by Greater Wellington (2009) indicated that the Otaki River supports fishing, swimming, kayaking, canoeing, rafting and walking activities. Picnic and swimming areas can be found at many locations along the length of the river, particularly at Otaki Forks within the Tararua Forest Park and at ‘The Pots’ in the lower gorge. Swimming is popular during summer in the vicinity of SH1 and the lower river is used year-round for kayaking and rafting. Attributes of the river that respondents valued most included good water quality, high flows, deep water and the presence of rapids.
The Otaki River is considered by the New Zealand Fish and Game Council to be a regionally important trout fishing destination (C. Jordan6 pers. comm. 2010). This is supported by angler survey data7 that indicate an average of about 580 ‘angler days’ are spent on the river each year (Unwin 2009). This places the Otaki River in the top 25% of recognised angling water bodies in the Wellington region. As noted earlier, the Otaki River is also listed in the RFP as a water body with important trout habitat, particularly in the reaches from the headwaters to SH1 bridge, although fishing is also noted by Greater Wellington (2009) to occur downstream of the SH1 bridge. The estuarine part of the river mouth has been characterised as a highly rated fishery resource (Boffa Miskell Ltd and URS Ltd 2000) and an important whitebaiting area (Greater Wellington 2009).
Scenic values associated with the river are highest in the Tararua Forest Park and gorge and diminish across the plains where flood protection works and gravel extraction have modified the channel and banks. However, planting and the creation of public access walkways at some locations on the lower river (e.g., the river mouth and Crystalls Bend) have restored some amenity value in recent years.
6 Corina Jordan, Resource Adviser, Wellington Fish and Game Council. 7 Surveys were conducted in 1994/95, 2001/02 and 2007/08.

Otaki River instream values and minimum flow assessment
PAGE 20 OF 46 WGN_DOCS-#800167-V1
4.3 Maori values
4.3.1 General values Some general Maori values relating to rivers are described below; these were drawn from documentation that has been provided to Greater Wellington by individuals, hapu and iwi as part of consultation on various council documents, regional plans and resource consent applications.
Ki Uta ki Tai (from the mountains to the sea): Water bodies are viewed holistically and cannot be distinguished from the surrounding land and catchments. Water provides cultural and spiritual sustenance and is viewed as the source of life with life giving properties.
Mahinga kai: The Otaki River and its tributary streams are used for mahinga kai (the gathering and processing of food). The gathering of food such as birds, eels, fish and plants enable iwi to provide manaakitanga (hospitality), a symbol of tribal mana. In particular, it is important that the waterbody sustains a healthy tuna (eel) population.
Mauri: Iwi try to protect the mauri (life force) which flows through all waterways. In particular, water from different catchments should not be mixed.
Kaitiakitanga: Iwi are charged with the responsibility to protect both the spiritual and physical waterways (including streams and rivers) within their rohe.
Waahi Tapu: Along the rivers are many ancestral sites and other sites of special value to iwi.
Recreational use: Rivers are important for recreational use by iwi, and water quality should be sufficient to enable safe swimming.
Recharge of groundwater: The ability of the water body to recharge aquifers.
Pollution: The water has clarity and is free from odour and discolouration, and is protected from all pollution whether chemical, human or animal waste.
4.3.2 The Otaki River The Otaki River is within the rohe (district) of iwi mana whenua Ngati Raukawa. There are five hapu (sub-tribes) of Ngati Raukawa with a direct interest in the river. Part of the community consultation during the development of the Otaki River Floodplain Management Plan (WRC 1998) was focussed on collating Maori values and points of view relating to the river. Interviews with hapu representatives were conducted and documented by Te Runanga o Ngati Raukawa (1992). Like members of the broader community, hapu representatives spoke often about the value of the river in its entirety and saw the river as a taonga (highly valued). Statements of some relevance to this instream flow study include:
• Historical reference to the Otaki River as a “food basket” with bountiful mahinga kai including whitebait (inanga), eel (tuna), freshwater crayfish

Otaki River instream values and minimum flow assessment
WGN_DOCS-#800167-V1 PAGE 21 OF 46
(koura), flounder (patiki), as well as other resources such as pingao and flax (harakeke); and
• Concern about deterioration in the state of the river, including the drying up of swamps, small creeks and other tributaries on the floodplain.
Sites considered to be of particular significance to Maori (waahi tapu) along the Otaki River have been identified and documented during past consultations (e.g., WRC 1998). Many are sites of ancestral settlement (such as pa) or burial that could potentially be inundated by floods but do not require consideration as part of this instream low flow assessment. Information on any particular sites / reaches of importance within the active river channel is scarce. Ngati Raukawa indicated during past consultation on the proposed Otaki Pipeline project that the river and the estuarine area at the mouth are important resources and this area has always provided kai moana and materials such as flax for various uses. As part of the same consultation, Ngati Raukawa were involved in scoping the design of an ecological survey of the lower river (Boffa Miskell Ltd 2001), the results of which are considered in this report.
At a governance level, the Proposed Ngati Raukawa Otaki River and Catchment Iwi Management Plan (Nga Hapu o Otaki 2000) states that “protection and enhancement of the mauri” of the river should be the common baseline when developing environmental principles to guide resource management in the catchment (e.g., including principles relating to flow regime such as abstraction and fisheries management).
4.4 Effects of low flows on instream values Low flows – either naturally occurring or exacerbated by water abstraction – in the Otaki River have the potential to threaten the instream values in the following ways:
• The wetted area of channel is reduced and hydraulic characteristics may change, which may reduce habitat availability and fish passage opportunities;
• Water temperatures may increase, which may directly threaten aquatic life and have a secondary effect of encouraging periphyton proliferations and reducing dissolved oxygen concentrations in the water;
• There is less water available for dilution of contaminants; and
• The water depth in swimming holes and reaches commonly used for rafting and kayaking may be reduced.
As mentioned in Section 2.3, the Otaki River loses flow to groundwater once it emerges from the gorge and the morphology of the active channel changes. It is therefore important to ensure that the minimum flow set largely on the basis of flow characteristics in the upper catchment is also appropriate to protect instream values in the lower reaches.

Otaki River instream values and minimum flow assessment
PAGE 22 OF 46 WGN_DOCS-#800167-V1
5. Reviewing minimum flow requirements of the Otaki River As part of the review of the RFP, Greater Wellington has carried out further investigations into the Otaki River’s minimum flow requirements. The investigations are described in this section and relate to protecting the instream values of the lower reaches of the Otaki River on the coastal plains. The upper reaches of the river are within the Tararua Forest Park and very unlikely to be modified by abstraction.
5.1 Instream flow objectives The instream flow objectives outline the specific values to be sustained by a minimum flow. The instream flow objectives do not replace the management objectives set out in the RFP. Rather, the intention is to have more specific objectives to provide technical guidance for reviewing the minimum flow.
Following the assessment of the instream values in Section 4, the instream flow objectives for the lower reaches of the Otaki River determined for this minimum flow investigation are:
• To maintain habitat for fish; and
• To maintain passage for migratory fish.
The first objective recognises the importance of the river for providing trout habitat and angling opportunities, and for providing habitat for native fish. The second objective recognises the importance of the Otaki River as a conduit for migratory fish; for example, for trout and kokopu species to gain access to spawning and rearing areas, including access to the upper Otaki River and tributaries such as the Waiotauru River and Pukehinau Stream.
As outlined in Section 4, the river holds important values for tangata whenua. Identified cultural values that are linked to flow levels – such as mauri, the maintenance of habitats, and mahinga kai – were considered to be catered for within the objectives relating to maintaining fish habitat and passage. The river also has importance for recreation other than angling in the lower reaches (e.g., swimming). However, given the mobility of the gravels and pools in the vicinity of the SH1 bridge, where most swimming on the lower river takes place, a measureable objective relating to swimming was not practical. Kayaking and rafting are known to occur in the lower reaches of the river although the most highly valued reaches, and most popular areas for boating, are in the catchment headwaters. While specific instream flow objectives relating to swimming and boating in the lower river have not been defined for this study, these activities are considered further in the next section.
The Otaki River contributes freshwater to the estuary and associated wetlands and drains near its mouth. However, water levels in these systems are thought to be largely controlled by tides and groundwater discharge. Low flows are not considered to be the most critical part of the flow regime for maintenance of the values of the river mouth and so an explicit flow objective relating to these environments has not been included. This is discussed more in Section 5.3.

Otaki River instream values and minimum flow assessment
WGN_DOCS-#800167-V1 PAGE 23 OF 46
5.2 Instream flow requirements
5.2.1 General approach The approach taken to assessing the minimum flow requirements for the Otaki River follows a methodology document produced by Greater Wellington (Watts 2006) to guide the region-wide review of flow-setting. While the guideline document does not rule out any particular methods it favours the use of RHYHABSIM8 and generalised habitat assessments for minimum flow setting (where preserving habitat quality is a primary objective). Such methods – which generally involve setting a minimum flow based on retaining a desired proportion of habitat at an ecologically relevant flow (see below) – are relatively widely applied and accepted in New Zealand.
There are limitations with habitat assessment approaches. One of the main ones, as noted by Hay (2010), is that our state of knowledge is often insufficient to predict (or measure) with certainty the actual consequence for instream values of percentage flow reductions. Other flow assessment frameworks (e.g., those more closely aligned with the “natural flow paradigm” approach (Poff et. al. 1997)9) strike the same problem. Acknowledgement of such limitations requires us to be both pragmatic and precautionary when recommending flow limits.
Mean annual low flow (MALF) is used in this study as the primary low flow statistic for benchmarking minimum flows. MALF has been shown to be ecologically relevant in New Zealand rivers and streams. For example, Jowett (1990, 1992) found that instream habitat for adult brown trout at MALF was correlated with adult brown trout abundance in New Zealand rivers. Furthermore, the return period of MALF, which is usually about 1.8 years for most rivers in the Wellington region, is indicative of the low flows likely to be experienced by trout – and therefore sets a lower limit to physical space likely to be available to them – before they begin making a reproductive contribution to the population (Hay 2010). It seems reasonable that the MALF should be similarly relevant to native fish species that also have generation cycles longer than a year. One-day MALF has been selected in favour of 7-day MALF for instream flow assessments in the past by Greater Wellington and this study takes the same approach for consistency. While the 1-day MALF is less conservative (i.e., lower) than the 7-day MALF, a comparison of the two flow statistics for rivers and streams in Wellington by Thompson (2011) indicates that the material difference to instream values from the use of one or the other to set the minimum flow is likely to be inconsequential.
5.2.2 Generalised habitat assessment In order to investigate flow requirements for maintaining instream habitat in the Otaki River, Generalised Habitat Modelling (GHM) was undertaken. The GHM method uses channel survey data to predict how width and depth will change with flow; this information is then used to predict how fish habitat availability will change with flow based on response curves statistically fitted
8 River Hydraulic Habitat Simulation 9 For example, the Range of Variability (RVA) approach and the associated Indicators of Hydrologic Alteration (IHA) allow an appropriate range of variation from natural flow, usually one standard deviation, in a set of 32 hydrologic parameters – some of which relate to low flow.
Otaki River instream values and minimum flow assessment
PAGE 24 OF 46 WGN_DOCS-#800167-V1
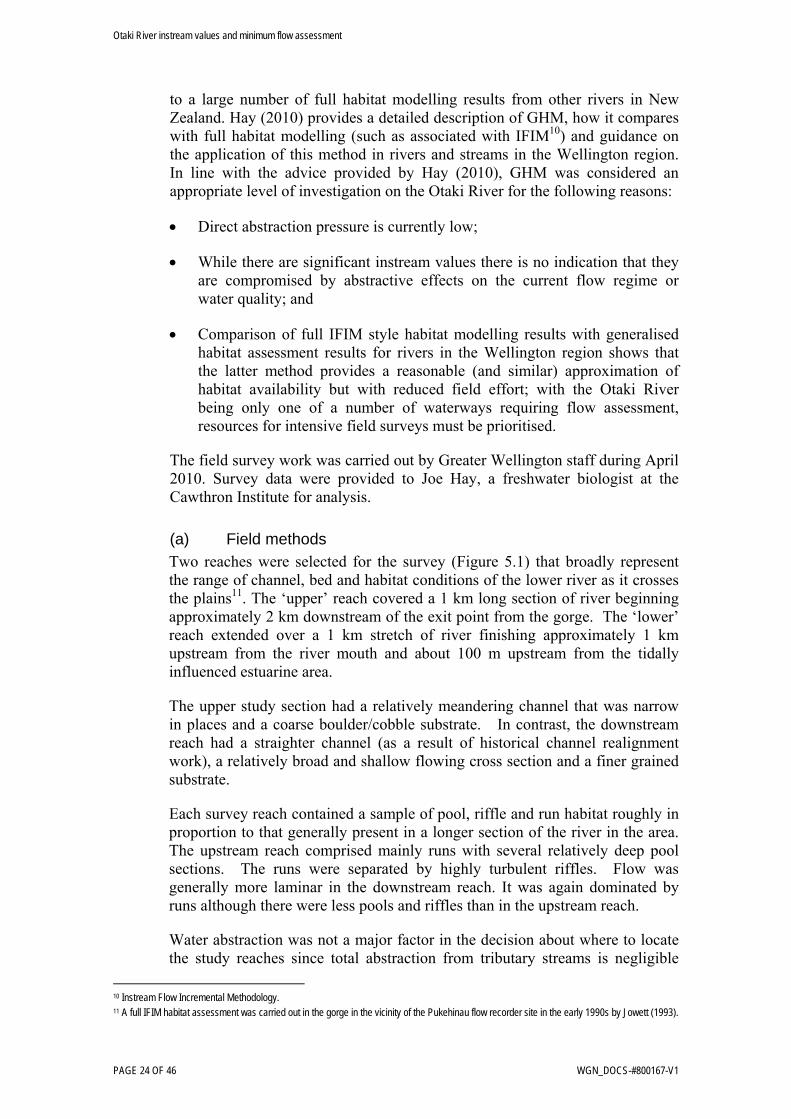
to a large number of full habitat modelling results from other rivers in New Zealand. Hay (2010) provides a detailed description of GHM, how it compares with full habitat modelling (such as associated with IFIM10) and guidance on the application of this method in rivers and streams in the Wellington region. In line with the advice provided by Hay (2010), GHM was considered an appropriate level of investigation on the Otaki River for the following reasons:
• Direct abstraction pressure is currently low;
• While there are significant instream values there is no indication that they are compromised by abstractive effects on the current flow regime or water quality; and
• Comparison of full IFIM style habitat modelling results with generalised habitat assessment results for rivers in the Wellington region shows that the latter method provides a reasonable (and similar) approximation of habitat availability but with reduced field effort; with the Otaki River being only one of a number of waterways requiring flow assessment, resources for intensive field surveys must be prioritised.
The field survey work was carried out by Greater Wellington staff during April 2010. Survey data were provided to Joe Hay, a freshwater biologist at the Cawthron Institute for analysis.
(a) Field methods Two reaches were selected for the survey (Figure 5.1) that broadly represent the range of channel, bed and habitat conditions of the lower river as it crosses the plains11. The ‘upper’ reach covered a 1 km long section of river beginning approximately 2 km downstream of the exit point from the gorge. The ‘lower’ reach extended over a 1 km stretch of river finishing approximately 1 km upstream from the river mouth and about 100 m upstream from the tidally influenced estuarine area.
The upper study section had a relatively meandering channel that was narrow in places and a coarse boulder/cobble substrate. In contrast, the downstream reach had a straighter channel (as a result of historical channel realignment work), a relatively broad and shallow flowing cross section and a finer grained substrate.
Each survey reach contained a sample of pool, riffle and run habitat roughly in proportion to that generally present in a longer section of the river in the area. The upstream reach comprised mainly runs with several relatively deep pool sections. The runs were separated by highly turbulent riffles. Flow was generally more laminar in the downstream reach. It was again dominated by runs although there were less pools and riffles than in the upstream reach.
Water abstraction was not a major factor in the decision about where to locate the study reaches since total abstraction from tributary streams is negligible
10 Instream Flow Incremental Methodology. 11 A full IFIM habitat assessment was carried out in the gorge in the vicinity of the Pukehinau flow recorder site in the early 1990s by Jowett (1993).

Otaki River instream values and minimum flow assessment
WGN_DOCS-#800167-V1 PAGE 25 OF 46
compared with main stem flow. However, natural flow loss across the plains is significant; approximately 20% of total river flow is lost to groundwater between the gorge and the river mouth. The lower study reach was therefore located to be representative of the reaches of the river where the cumulative impact of natural flow loss is greatest. Extensive gravel extraction and flood protection works occurring between the upper and lower transmission lines (Figure 5.1) meant these mid reaches of the river were unsuitable for establishing study sites as there was a high chance that cross sections would be disturbed between visits. However, it is not thought that these reaches are any more or less ‘critical’ from a low flow perspective than the reaches that were selected upstream and downstream.
Figure 5.1: Location of the two generalised habitat modelling study reaches on the Otaki River
An initial survey of the upper study reach was carried out on 1 April 2010. Flow at the Pukehinau recorder site in the gorge on this day was around 7,000 L/s which is above the 7-day MALF (5,220 L/s) but well below median flow (16,450 L/s). The river was about one week into a three week, uninterrupted, flow recession. Nine cross sections were pegged out along each reach and bed profiles, wetted channel width, and water depth in relation to a peg were measured at each cross section. Flow was measured at the upstream (see Figure 5.2) and downstream ends of each reach at suitable control sections. There was a flow difference of +7% between the upstream and downstream ends of the study reach. This may have been partly related to minor flow gain from a tributary on the right bank (estimated flow of 100–200 L/s), although it is within the error margins for current meter gauging (+/-8%).

Otaki River instream values and minimum flow assessment
PAGE 26 OF 46 WGN_DOCS-#800167-V1
Figure 5.2: Upstream cross section at the upper study reach on the day of the initial survey (1 April 2010)
A follow-up survey was done at the upper study reach on 11 April 2010 after 10 further days of flow recession. Flow on this day was around 4,500 L/s at the Pukehinau monitoring site which is just below the 1-day MALF (4,770 L/s). On this visit, wetted channel width and water depth measurements were made and flow measured at the upstream cross section of the reach.
The same field survey approach was taken at the lower study section and measurements were completed during the same April flow recession. The initial field survey at the lower reach was carried out on 8 April (see Figure 5.3) and the follow-up survey on 13 April 2010. Flow at Pukehinau on these two days was 5,000 and 4,200 L/s, respectively. There was a difference in flow between the upstream and downstream cross sections of the study reach of -11% on the initial visit. This is slightly more than the accepted margin of error for current meter gauging and is thought to indicate some bed leakage occurring through the reach. While this is not ideal when applying the GHM approach, the proportion of flow loss is small and there were no noticeable effects on the pattern of water level change with flow through the reach. This bed leakage is therefore not considered likely to compromise the overall survey results.

Otaki River instream values and minimum flow assessment
WGN_DOCS-#800167-V1 PAGE 27 OF 46
Figure 5.3: Upstream cross section at the lower study reach on the day of the initial survey (8 April 2010)
(b) Data analysis The estimated 1-day MALFs for the upper and lower study reaches are 4,550 L/s and 3,870 L/s, respectively. These can be considered natural flow estimates since abstraction is so minor (~1.5% and 1.75% of the respective MALFs in the upper and lower reaches), and compare with a 1-day MALF estimate at the gorge of 4,770 L/s.
Field survey data were used to fit average width-discharge relationships for each reach, which were used to predict habitat value (HV) for adult brown trout, longfin eel, shortfin eel, common and redfin bullies, shortjaw kokopu, torrentfish and inanga using the generalised habitat models. These generalised models were based on habitat suitability criteria drawn from a range of sources (as listed by Hay 2010). There are currently no generalised model coefficients available for the remaining fish species listed in Table 4.1 (banded and giant kokopu, dwarf galaxias and koaro). However, none of these galaxiid species are likely to have flow requirements as high as large adult trout (Jowett & Richardson 2008 c.f. Hayes & Jowett 1994), with the possible exception of koaro, and this species is largely restricted to the forested upper catchment.
The predicted HV at each flow was multiplied by wetted width at the respective flow to make this index equivalent to weighted usable area (WUA) from full (IFIM) habitat modelling. These predicted weighted HV curves were then used to calculate prospective minimum flows based on habitat retention relative to that at the MALF or the habitat optimum, whichever occurred at the lower flow.

Otaki River instream values and minimum flow assessment
PAGE 28 OF 46 WGN_DOCS-#800167-V1
The modelling showed that, in the two study reaches, habitat for adult brown trout is predicted to increase with flow, the optimum amount of habitat being available at flows considerably higher than MALF. In contrast, habitat for native fish species tended to decrease as flow increased above MALF. This implies that trout are the most flow demanding fish species in the Otaki River (i.e., they require higher flows than native fish to provide the optimum amount of habitat).
(c) Deriving a minimum flow In order to determine a minimum flow from generalised modelling results, a habitat retention level must be selected. This is a decision regarding what level of habitat availability should be maintained. In most cases, it is not practical to set a minimum flow to optimise habitat for the most flow-demanding fish species (in this case, trout) because that would preclude any abstraction from the river. A commonly-used approach for trout is to set a habitat retention level equal to a certain proportion of the habitat available at MALF. The MALF is deemed to be an ‘ecologically relevant’ statistic because it is indicative of the average annual minimum ‘living space’, and trout populations respond to annual limiting events because their cohorts (year classes) are annual (i.e., they reproduce only once per year). For rivers with high fishery value (e.g., the Waiohine and Ruamahanga rivers in the Wairarapa), the recommended appropriate retention level is 90% of the habitat available at MALF (e.g., Hay 2010). While the amount of habitat retention that is deemed appropriate for the Otaki River has not been formally defined, there is a good case for 90% habitat retention based on angler values; as noted in Section 4.2, the Otaki River ranks in the top 25% of water bodies in the Wellington region for ‘angler days’.
The recommended minimum flows for each study reach and their equivalent flows at the Pukehinau flow monitoring site12 are shown in Table 5.1 (all fish species, 90% habitat retention) and Table 5.2 (brown trout, 70% habitat retention13). Using a retention level of 90% of the habitat available at the 1-day MALF, the modelling showed that adult brown trout have the highest flow requirements. This is consistent with other studies in the Wellington region (e.g., Keenan 2009a, Hay 2008). Of the native fish species, torrentfish have the highest flow demand, approaching that of brown trout, while all other species have adequate habitat available at flows well below MALF (and below lowest recorded flows).
12 Equivalent flows at the Pukenhinau monitoring site have been estimated using the average between-site relationships defined by the low flow concurrent gaugings presented in Figure 2.8. The pattern and magnitude of flow loss across the plains have been fairly consistent over time and a range of flows giving confidence that the average relationships can be used to make reasonable predictions. 13 70% retention is an alternative threshold put forward by Hay (2010) that resource managers may want to consider if reduced levels of habitat protection are acceptable.

Otaki River instream values and minimum flow assessment
WGN_DOCS-#800167-V1 PAGE 29 OF 46
Table 5.1: Flows predicted to maintain 90% of fish habitat at MALF in the upper and lower study reaches of the Otaki River, and corresponding estimated flows at Greater Wellington’s flow monitoring site at Pukehinau
Reach Estimated
1-day MALF (L/s)
Species Required flow (L/s) in reach to retain
90% instream habitat at MALF
Estimated equivalent flow (L/s) at Pukehinau
monitoring site
Adult brown trout 3,850 4,035
Longfin eel <2,500 <2,620
Shortfin eel <2,500 <2,620
Common bully <2,500 <2,620
Redfin bully <2,500 <2,620
Torrentfish 3,580 3,750
Shortjaw kokopu <2,500 <2,620
Upper reach 4,550
Inanga <2,500 <2,620
Adult brown trout 3,340 4,120
Longfin eel <2,000 <2,470
Shortfin eel <2,000 <2,470
Common bully <2,000 <2,470
Redfin bully <2,000 <2,470
Torrentfish 3,140 3,870
Shortjaw kokopu <2,000 <2,470
Lower reach 3,870
Inanga <2,000 <2,470
Table 5.2: Flows predicted to maintain 70% of adult brown trout habitat at MALF in the upper and lower study reaches of the Otaki River, and corresponding estimated flows at Greater Wellington’s flow monitoring site at Pukehinau
Reach Estimated
1-day MALF (Ls)
Required flow (L/s) in reach to retain 70% of instream habitat
at MALF Estimated equivalent flow (L/s) at Pukehinau monitoring site
Upper reach 4,550 2,760 2,890
Lower reach 3,870 2,450 3,025
Assuming the reaches surveyed are representative of the Otaki River as a whole (once it has emerged from the Tararua Forest Park), a minimum flow of 4,120 L/s at the gorge is required to achieve 90% habitat retention (using brown trout as the indicator). This reduces to 3,025 L/s if 70% habitat retention is desired. These values equate to 85% of MALF and 63% of MALF at the gorge, respectively.

Otaki River instream values and minimum flow assessment
PAGE 30 OF 46 WGN_DOCS-#800167-V1
5.2.3 Fish passage An assessment of two riffle sections14 in the upper study reach indicated that movement of large trout up and downstream is unlikely to be impeded even at the lowest naturally occurring flows. It is estimated that at least 9–12 m of contiguous width of riffle channel would have adequate depth to allow for passage in this reach at a flow of about 3,000 L/s at Pukehinau (this is approximately equivalent to the lowest recorded flow). In the lower study reach passage may start to become restricted for very large trout (with a minimum passage depth of 25 cm) once flows at Pukehinau drop below 6,000 L/s. Modelling suggests that available riffle width for these large fish drops steeply from about 10 m at a flow of 6,000 L/s to zero at 4,000 L/s. Native fish generally have much lower depth requirements than trout and are not likely to experience movement restrictions at any naturally occurring low flows.
Overall, the proposed minimum flow of 4,120 L/s at Pukehinau that is based on trout habitat requirements (as in Table 5.1) is also considered appropriate to ensure that the movement of large sport and migratory native fish in the lower river is not unduly restricted for prolonged periods.
5.2.4 Regional approach to flow assessment In addition to considering the results of site specific habitat modelling, prospective minimum flows for the Otaki River can also be estimated by applying a ‘rule of thumb’ based on MALF. Hay (2010) analysed data from historical habitat assessments on 20 rivers in the Wellington region and confirmed, as expected, that the following general relationships hold for those rivers with a MALF of less than 5,000 L/s:
• A minimum flow of 87% of MALF will retain 90% of adult brown trout habitat; and
• A minimum flow of 69% of MALF will retain 70% of adult brown trout habitat.
The ‘rule of thumb’ minimum flow to retain 90% of adult brown trout is almost identical to that derived by GHM (85% of MALF). However, for retention of 70% of habitat, the ‘rule of thumb’ minimum flow is a little lower (69% of MALF) than that indicated by GHM (79% of MALF).
While estimations based on site-specific GHM data (described in the previous section) should supersede those derived from ‘rules of thumb’, in this case both methods produce similar estimates, and are in particularly good agreement when higher levels of habitat retention are sought. This provides confidence that the habitat modelling has produced reliable results.
14 Riffles are the shallowest sections of rivers and hence provide the best indication of critical depths for fish passage.

Otaki River instream values and minimum flow assessment
WGN_DOCS-#800167-V1 PAGE 31 OF 46
5.3 Effects of recommended minimum flows on other values
5.3.1 Effect on water levels at the river mouth It is difficult to say with certainty how low flows in the Otaki River affect water levels in the tidal backwaters and estuarine areas near the river mouth, and the consequences of any effects for aquatic life in these habitats. Detailed flow modelling encompassing shallow groundwater movement and tidal influence would be needed to make accurate determinations.
During dry spells it is known that water levels in the lower river and connected surface water systems (see Figure 5.4) rise and fall with tidal cycles and tidal influence is known to extend about 800 m upstream from the mouth under low flow conditions (Winterburn15 pers. comm. 2010). Preserving the moderate to high natural flow regime of the river, including the frequency and magnitude of flushing flows that keep the mouth open, is likely to be of more importance to maintaining general ecosystem condition than low flows. However, the lack of detailed understanding about the effect of low river flows on the estuary provides further justification for adopting a relatively precautionary minimum flow based on fish habitat protection in the main channel upstream (i.e. the recommendations in Section 5.2.1).
Figure 5.4: Aerial photo of the Otaki River mouth taken in 2009 showing the estuary, tidal backwaters and approximate extent of tidal influence upstream from the mouth
5.3.2 Recreational values The new recommended minimum flow will be more protective towards swimming and boating activities in the lower river than the existing minimum flow is. While it is not possible to accurately quantify the improvements in the level of protection, the riffle assessment described in Section 5.2.2 (on fish passage) indicates that raising the minimum flow from 2,550 L/s to 4,120 L/s
15 Graham Winterburn, Flood Protection Supervisor, Greater Wellington Regional Council (Otaki Depot).

Otaki River instream values and minimum flow assessment
PAGE 32 OF 46 WGN_DOCS-#800167-V1
may prevent riffles in the lowest reaches from becoming impassable (in the event that abstraction increases significantly); this is based on a minimum depth requirement for highly buoyant, non-powered craft of 0.25 m, a figure that has been used in similar discussions by others (e.g., Mosley 1982). For the riffles assessed in the lowest study reach, contiguous width of channel with greater than 0.25 m depth was estimated to increase from zero at a flow of 2,550 L/s (the existing minimum flow) to 3 m at the new recommended minimum flow of 4,120 L/s.
With respect to swimming, an assessment of the pool cross sections from the generalised habitat survey indicates that water levels at the recommended new minimum flow are likely to be around 5–10 cm higher than at the existing minimum flow. This is based on a comparison of depth in pool sections between the first and second surveys. Whether or not such a difference in water levels would have a material consequence for swimmers is unknown although the reduced residence time of water in swimming areas (associated with higher flow rates) is considered desirable.
5.4 Summary The instream habitat modelling work and subsequent hydrological analysis suggests that a flow of 4,120 L/s at Greater Wellington’s Otaki River at Pukehinau flow monitoring site is required to protect fish habitat in the Otaki River as a whole. This is predicted to ensure no more than 10% habitat loss compared to the habitat available during MALF conditions. This flow is also considered appropriate for ensuring minimal restriction to fish passage in the lower reaches.
The minimum flow investigations indicated that a slightly higher minimum flow is required at the Pukehinau monitoring site in order to meet instream habitat objectives for the lowest reaches of the river (4,120 L/s) compared to the upper coastal plain (4,035 L/s). This is due to the slightly different relationships between habitat and low flows that exist between reaches. Given that there is some uncertainty about which parts of the lower river are most favoured by fish for high quality habitat, particularly by trout, it is recommended that the higher of the two minimum flows be adopted. The recommendation of 90% habitat retention in the lower reaches is considered appropriate given that the Otaki River is recognised in the existing RFP as an important trout fishery resource as far downstream as SH1 and that angling is known to take place near the river mouth. The recommended new minimum flow will also afford greater protection to recreational activities such as swimming and canoeing in the lower river.
It is important that minimum flows are applied in combination with reasonable allocation levels, to maintain some ecologically relevant flow variability and ensure that the flow is not “flat-lined” at the minimum for excessively long periods. The allocation regime for the Otaki River is discussed next in Section 6.

Otaki River instream values and minimum flow assessment
WGN_DOCS-#800167-V1 PAGE 33 OF 46
6. Implications for water allocation policies In this section the potential implications of the instream flow study outlined in Section 5 on water allocation policies for the Otaki River are discussed. Actual implications will depend on the outcomes of the review of the RFP.
6.1 Minimum flows and security of supply The instream flow study proposes increasing the existing RFP minimum flow of 2,550 L/s at the Pukehinau flow monitoring site to 4,120 L/s. This revised flow represents an increase of about 60% but has been shown to have an explicit ecological basis and provide an appropriate level of ecological protection to the lower reaches of the river.
The existing RFP policies (outlined in Section 3.1) are applied so that restrictions in abstraction are to occur at flows of 4,375 L/s and 3,975 L/s at Pukehinau and non-essential water takes (e.g., irrigation) are required to cease by the time the current minimum flow of 2,550 L/s is reached. There are no ‘essential’ surface water takes (e.g., water races or water supply takes directly from the river) although Kapiti Coast District Council operates water supply bores that may well be subject to surface water take policies in the future. In practice, existing abstractions potentially affected by this policy (mainly on the Waimanu Stream – see Section 6.2) are currently so minor that restrictions on the basis of river flow are not actively applied. However, should the revised minimum flow be adopted, the flows at which restrictions and cessation of non-essential takes occur should be reviewed.
For the purposes of this report, a security of supply analysis was carried out to determine how often flow restrictions (including cessation of non-essential takes) might be expected under the recommended new minimum flow. The results are shown in Table 6.1. A nominal flow of 5,100 L/s has been chosen as a restriction trigger since the eventual value would be dependant on first determining core allocation (see Section 6.3). In the last 20 years a river flow of 5,100 L/s or less has occurred, on average, for about 12 days per irrigation season (October to April), although in some years well over 20 days of restriction would have occurred. A flow of 4,120 L/s has occurred on average for about three days per irrigation season. The nominal flow trigger and prospective minimum flow would have been breached in 12 and six of the past 20 years, respectively. The maximum number of consecutive days at, or under, the minimum flow would have been 16 in March and April of 2003. This analysis is based on the last 20 years of flow data; security of supply under future climate scenarios has not been assessed.

Otaki River instream values and minimum flow assessment
PAGE 34 OF 46 WGN_DOCS-#800167-V1
Table 6.1: Number of days per irrigation season when flow in the Otaki River at Pukehinau would have been below the recommended new minimum flow and a nominal future restriction level, during the last 20 years
Recommended new minimum flow
(4,120 L/s)
Nominal trigger flow for restrictions (5,100 L/s)
Irrigation season Total number of days below
flow
Maximum number of
consecutive days below
flow
Total number of days below
flow
Maximum number of
consecutive days below flow
1990/91 0 0 0 0
1992/93 0 0 3 3
1993/94 6 5 27 8
1995/96 0 0 3 3
1996/97 0 0 0 0
1997/98 0 0 0 0
1998/99 4 3 15 10
1999/00 0 0 9 4
2000/01 3 1 26 12
2001/02 0 0 0 0
2002/03 35 16 60 24
2003/04 0 0 0 0
2005/06 0 0 0 0
2006/07 0 0 11 5
2007/08 13 10 46 14
2008/09 11 8 30 12
2009/10 0 0 8 6
Average (per irrigation season)
3 12
6.2 Waimanu Stream All direct surface water abstractions included in the existing core allocation for the Otaki River are from the Waimanu Stream. The relatively high abstractive pressure on this stream, coupled with high ecological values (especially for native fish), means that it may be prudent to adopt a minimum flow and core allocation that relate directly to these values, rather than just those of the Otaki River. A recent preliminary assessment of the Waimanu Stream by Greater Wellington (Keenan 2009b) suggested a minimum flow for Waimanu Stream of 190 L/s, which equates to 90% of MALF. While a core allocation for the stream has not yet been recommended, Keenan (2009b) suggested abstractions from the stream should be managed according to this minimum flow as well as being counted as part of the Otaki River core allocation.
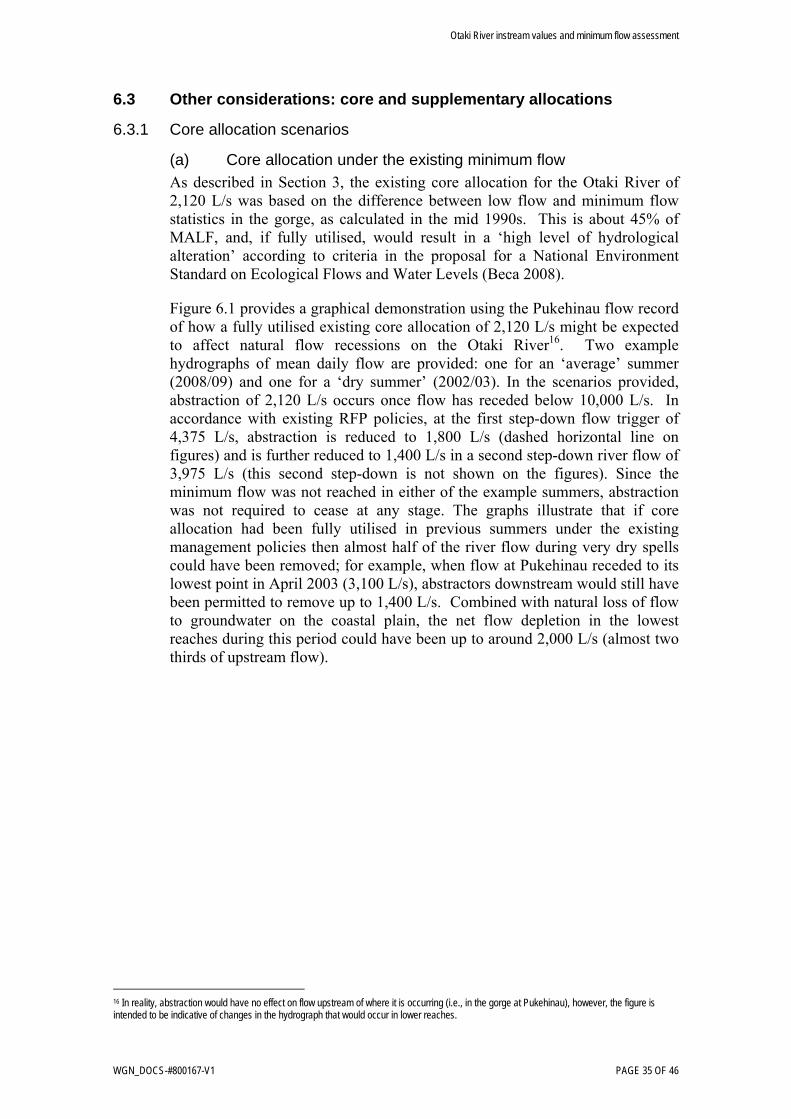
Otaki River instream values and minimum flow assessment
WGN_DOCS-#800167-V1 PAGE 35 OF 46
6.3 Other considerations: core and supplementary allocations
6.3.1 Core allocation scenarios
(a) Core allocation under the existing minimum flow As described in Section 3, the existing core allocation for the Otaki River of 2,120 L/s was based on the difference between low flow and minimum flow statistics in the gorge, as calculated in the mid 1990s. This is about 45% of MALF, and, if fully utilised, would result in a ‘high level of hydrological alteration’ according to criteria in the proposal for a National Environment Standard on Ecological Flows and Water Levels (Beca 2008).
Figure 6.1 provides a graphical demonstration using the Pukehinau flow record of how a fully utilised existing core allocation of 2,120 L/s might be expected to affect natural flow recessions on the Otaki River16. Two example hydrographs of mean daily flow are provided: one for an ‘average’ summer (2008/09) and one for a ‘dry summer’ (2002/03). In the scenarios provided, abstraction of 2,120 L/s occurs once flow has receded below 10,000 L/s. In accordance with existing RFP policies, at the first step-down flow trigger of 4,375 L/s, abstraction is reduced to 1,800 L/s (dashed horizontal line on figures) and is further reduced to 1,400 L/s in a second step-down river flow of 3,975 L/s (this second step-down is not shown on the figures). Since the minimum flow was not reached in either of the example summers, abstraction was not required to cease at any stage. The graphs illustrate that if core allocation had been fully utilised in previous summers under the existing management policies then almost half of the river flow during very dry spells could have been removed; for example, when flow at Pukehinau receded to its lowest point in April 2003 (3,100 L/s), abstractors downstream would still have been permitted to remove up to 1,400 L/s. Combined with natural loss of flow to groundwater on the coastal plain, the net flow depletion in the lowest reaches during this period could have been up to around 2,000 L/s (almost two thirds of upstream flow).
16 In reality, abstraction would have no effect on flow upstream of where it is occurring (i.e., in the gorge at Pukehinau), however, the figure is intended to be indicative of changes in the hydrograph that would occur in lower reaches.

Otaki River instream values and minimum flow assessment
PAGE 36 OF 46 WGN_DOCS-#800167-V1
Figure 6.1: Mean daily flow for the Otaki River at Pukehinau through the irrigation season for an ‘average’ year (2008/09, top graph) and a ‘dry’ year (2002/03). Abstraction assuming a fully utilised existing core allocation of 2,120 L/s is modelled as the grey area beneath the hydrograph. The first restriction trigger flow of 4,375 L/s is shown as the horizontal dashed line (where abstraction is reduced to 1,800 L/s) and the recommended minimum flow of 2,550 L/s is the solid horizontal line. Note the log-scale on the y-axis of each graph.

Otaki River instream values and minimum flow assessment
WGN_DOCS-#800167-V1 PAGE 37 OF 46
(b) Core allocation under a new recommended minimum flow While actual abstraction is currently only a very minor proportion of core allocation, the recommended new minimum flow of 4,120 L/s is significantly higher than that in place when the existing core allocation was set (2,550 L/s) and it is therefore suggested that core allocation is reviewed accordingly. Greater Wellington has not yet determined if there will be a ‘rule-of-thumb’ for proposing allocation limits in future. However, for illustrative purposes, if the proposed NES criteria (Beca 2008) were used to guide the setting of a limit that resulted in low to moderate hydrological alteration (i.e., to less than 30% of MALF at the river mouth) then the maximum core allocation available would be approximately 1,150 L/s.
Figure 6.2 shows how a fully utilised core allocation of 1,150 L/s might be expected to affect natural flow recessions on the Otaki River using the same two example hydrographs of mean daily flow presented in Figure 6.1. In the scenarios provided, abstraction of 1,150 L/s occurs once flow has receded below 10,000 L/s. At the nominal flow trigger (first step-down) of 5,100 L/s, abstraction is reduced to 600 L/s (dashed horizontal line on figures) and is further reduced to 300 L/s in a second step-down river flow of 4,700 L/s (this second step-down is not shown on the figures). When the prospective minimum flow of 4,120 L/s is reached, all abstraction ceases. The main consequence of the abstraction is that restriction trigger levels and minimum flows are reached earlier than would naturally occur and the duration of time spent at, or near, these flows increases. Modelling of the full prospective allocation for the particularly dry 2002/03 year shows that the first step-down and minimum flow would have been reached about one month earlier than under natural conditions.

Otaki River instream values and minimum flow assessment
PAGE 38 OF 46 WGN_DOCS-#800167-V1
Figure 6.2: Mean daily flow for the Otaki River at Pukehinau through the irrigation season for an ‘average’ year (2008/09, top graph) and a ‘dry’ year (2002/03). Abstraction assuming a full prospective core allocation of 1,150 L/s is modelled as the grey area beneath the hydrograph. Nominal restriction trigger flow of 5,100 L/s is shown as the dashed horizontal line (where abstraction is reduced to 600 L/s) and the recommended minimum flow of 4,120 L/s is the solid horizontal line. Note the log-scale on the y-axis of each graph.

Otaki River instream values and minimum flow assessment
WGN_DOCS-#800167-V1 PAGE 39 OF 46
6.3.2 Consideration of groundwater abstractions in the core allocation As discussed earlier in Section 3.2, there is a high degree of connection between shallow groundwater in the gravels along the river corridor and the active river channel. Abstractions from these gravels (the Otaki Groundwater Management Zone) have a flow depletion impact upon the river. With this in mind, it is important that groundwater abstractions are included within the review of core allocation and that a framework for treating / managing connected groundwater abstractions is developed. At the time of writing this report, Greater Wellington has work underway to develop such a framework.
6.3.3 Supplementary allocation The current RFP specifies a flow above which the core allocation may be exceeded, also referred to as a ‘supplementary allocation flow’. In other words, in addition to the core allocation, water may be taken from the river during medium-to-high flow conditions. The current supplementary allocation flow for the Otaki River is 5,175 L/s. This flow is exceeded about 95% of the time during the irrigation season, and is less than half the irrigation season median daily flow (approximately 15,000 L/s). Furthermore, it is only slightly higher than the flow at which restrictions may begin to be imposed if the higher recommended minimum flow is adopted.
The aim of a supplementary allocation flow is to allow water to be taken during times of higher flows, while seeking to maintain flow variability, such as flushing or disturbance flows that are essential to maintaining the instream ecosystem and channel structure (MWH 2008). The supplementary allocation flow is often set according to a rule-of-thumb; for example, equal to mean flow (Otago Regional Council, Environment Southland) or median flow (Horizons Regional Council).
At this stage, no work has been done to review supplementary allocation flows for rivers in the Wellington region. However, it is likely that the current supplementary allocation flow for the Otaki River is too low; if a large amount of water were to be allocated above this level it is possible that the natural flow regime might be substantially altered. This could have detrimental consequences for instream habitats and downstream receiving environments whose natural character is partially reliant on flushing flows (see Section 5.3). It is therefore recommended that an appropriate supplementary allocation flow for the Otaki River be set during the current review of the RFP. The range of variability (RVA) approach and the associated indicators of hydrologic alteration (IHA) could usefully be considered to help determine an appropriate supplementary allocation.
6.4 Implication of the proposed new minimum flow for existing users The preceding sections have considered what restrictions and security of supply might be expected for abstractors under the proposed new minimum flow assuming full utilisation of a core allocation (i.e., a potential scenario some way in to the future). Currently however, the level of allocation, with groundwater takes included, is around 7% of MALF and represents a degree of flow alteration that is not yet detectable using standard flow measurement

Otaki River instream values and minimum flow assessment
PAGE 40 OF 46 WGN_DOCS-#800167-V1
methods. Therefore, it may not be appropriate to apply the proposed minimum flow (and related restrictions) in the same manner as other catchments where the levels of allocation and low flow alteration are much higher. How the proposed Otaki River minimum flow should be applied in the management of existing water takes will depend on policy proposals made in advance of the next regional plan. One possible approach for the Otaki River is that restrictions relating to the minimum flow could be introduced in a staged process over time that is linked to changing overall levels of catchment allocation. Flow alteration as a result of abstraction generally becomes detectable (i.e., by measurement) once more than 10% of the natural flow has been removed; this may be an appropriate trigger point to consider for implementing minimum flow and restriction proposals.
Otaki River instream values and minimum flow assessment
WGN_DOCS-#800167-V1 PAGE 41 OF 46
7. Conclusions and recommendations The Otaki River has important ecological, recreational and cultural values. A wide range of fish species are supported in a variety of habitats from the upper catchment to the mouth and the river is recognised as a regionally important trout fishery. The river is highly valued for its very good quality water and supports a range of recreational activities including angling, rafting, kayaking and swimming. All of these activities are known to occur in the lower reaches as well as in the upper catchment.
Although some natural flow loss to groundwater occurs across the coastal plain, the Otaki River low flow regime is relatively unmodified by water users. There are no direct abstractions from the main stem and combined abstraction from tributary streams is only about 1% of MALF in the river. Cumulative abstraction from the Otaki Groundwater Zone is currently likely to be a more significant cause of river flow depletion across the irrigation season, however, it is still considered minor compared with natural baseflow (preliminary estimates are of up to about 6% of MALF).
The current minimum flow and core allocation for the Otaki River are based on a historical habitat assessment study in the gorge and ‘rule of thumb’ assignment of flow thresholds and allocation limits. The existing minimum flow has never been breached since records began in the 1970s but there have been some questions about how well it protects instream values of the lower reaches of the river, particularly if abstraction was to increase.
Generalised habitat modelling carried out at two study reaches on the lower river in autumn 2010 to determine flows for maintaining fish habitat found the species with the highest flow requirement is brown trout. Modelling found that a minimum flow of 4,120 L/s is expected to maintain habitat availability in the river as a whole, based on retaining 90% of the brown trout habitat available at MALF in the gorge. The flow required to protect instream habitat is predicted to be adequate for ensuring that the passage of native fish is not adversely affected.
Results from this assessment indicate that Greater Wellington’s existing RFP minimum flow for the Otaki River of 2,550 L/s at Pukehinau is too low and should be increased to 4,120 L/s. On average, a flow of 4,120 L/s or less has occurred for about three days per year over the past 20 years. Revising the minimum flow upwards will have implications for the existing core allocation and step-down flows and these should be reviewed accordingly. Given the relatively low level of existing allocation, it may be appropriate to introduce any restrictions in stages over time or consider catchment allocation thresholds above which restrictions are to apply. The supplementary allocation threshold should also be reviewed, not least because it appears to be set very low relative to other rivers in the region.
The results of this study should be taken into account during the current review of the RFP.

Otaki River instream values and minimum flow assessment
PAGE 42 OF 46 WGN_DOCS-#800167-V1
7.1 Recommendations The following recommendations are made based on the results of the instream flow study described in this report:
1. Increase the minimum flow for the Otaki River to 4,120 L/s (as measured at the Pukehinau flow monitoring site).
2. Undertake a more detailed investigation of the extent of connectedness between surface and ground waters in the lower river catchment.
3. Review the conditions in which consented surface water and hydraulically connected groundwater takes are restricted or prohibited, to ensure that the minimum flow of the Otaki River is appropriately protected.
4. Review the core allocation for the Otaki River in light of the significant increase in minimum flow being recommended.
5. Set a core allocation that applies to both direct surface water takes from the main river and tributaries (with the exception of the Waimanu Stream – see next recommendation) and shallow groundwater takes in the Otaki Groundwater Management Zone.
6. Adopt separate minimum flow and core allocation policies for the Waimanu Stream (based on the assessment already completed, but include abstraction from the Waimanu Stream as part of the Otaki River’s core allocation).
7. Review the supplementary allocation flow for the Otaki River.
Implementation of the recommendations will depend to a large extent on the outcome of related technical studies (e.g., on groundwater-surface water interaction) and policy decisions about general approaches to assignment of core allocation and flow thresholds.

Otaki River instream values and minimum flow assessment
WGN_DOCS-#800167-V1 PAGE 43 OF 46
References Allibone R, David B, Hitchmough R, Jellyman D, Ling N, Ravenscroft P and Waters J. 2010. Conservation status of New Zealand freshwater fish, 2009. New Zealand Journal of Marine and Freshwater Research.
ANZECC. 2000. Australia and New Zealand guidelines for fresh and marine water quality, Volume 2; the guidelines. Australian and New Zealand Environment and Conservation Council, Agriculture and Resource Management Council of Australia and New Zealand, Canberra.
Beca. 2008. Draft guidelines for the selection of methods to determine ecological flows and water levels. Report prepared by Beca Infrastructure Ltd. Ministry for the Environment, Wellington.
Beca. 2010. Modelling the magnitude of unconsented surface water use in the Wellington region. Draft unpublished report for client review, prepared for Greater Wellington Regional Council.
Boffa Miskell Ltd. 1992. Otaki Floodplain Management Plan Environmental Investigations. Report prepared for Wellington Regional Council by Boffa Miskell Partners, Christchurch.
Boffa Miskell Ltd. 2001. Lower Otaki River, ecological survey (final report). Report prepared for Kapiti Coast District Council. Boffa Miskell, Christchurch.
Boffa Miskell Ltd and URS (NZ) Ltd. 2000. Resource consent applications by Kapiti Coast District Council for a supplementary water supply project. Report prepared for Kapiti Coast District Council. Boffa Miskell, Christchurch.
Cussins AP. 1994. Estimation of safe aquifer yields for the Kapiti Coast area and Wainuiomata catchment. Wellington Regional Council, Publication No. WRC/CI-G-94/55, Wellington.
Greater Wellington Regional Council. 2009. Selection of rivers and lakes with significant amenity and recreational values. Greater Wellington Publication No. GW/EP-G-09/28, Wellington.
Greater Wellington Regional Council. 2010. Proposed Regional Policy Statement for the Wellington region 2009. Greater Wellington Regional Council, Publication GW/EP-G-08/200 (updated 18 May 2010), Wellington.
Harkness, M. 1998. Regional low flow estimation method. Wellington Regional Council, Publication No. WRC/RINV-T-98/20, Wellington
Hay, J. 2008. Instream flow assessment for the lower Ruamahanga River. Cawthron Report No. 1403 prepared for Greater Wellington Regional Council.
Hay J. 2010. Instream flow assessment options for Greater Wellington Regional Council. Cawthron Institute Report No. 1770 prepared for Greater Wellington Regional Council.

Otaki River instream values and minimum flow assessment
PAGE 44 OF 46 WGN_DOCS-#800167-V1
Hudson H. 2008. Hutt River instream flow assessment: Instream habitat flow requirements. Report prepared for Greater Wellington Regional Council by Environmental Management Associates.
Jowett I. 1990. Factors related to the distribution and abundance of brown and rainbow trout in New Zealand clear-water rivers. New Zealand Journal of Marine and Freshwater Research 24: 429-440.
Jowett I. 1992. Models of the abundance of large brown trout in New Zealand rivers. North American Journal of Fisheries Management 12: 417–432.
Jowett I. 2004. RHYHABSIM river hydraulics and habitat simulation (Software manual).
Keenan L. 2009a. Waiohine River instream values and minimum flow assessment. Greater Wellington Regional Council, Publication No. GW/EMI-T-09/276, Wellington.
Keenan L. 2009b. Waimanu Stream – minimum flow and allocation assessment. Greater Wellington Regional Council, unpublished internal memorandum, (Document reference #664178), Wellington.
Milne JR and Watts L. 2007. Toxic cyanobacteria proliferations in Wellington’s rivers in 2005/06. Greater Wellington Regional Council, Publication No. GW/EMI-T-07/72, Wellington.
Ministry for the Environment and Ministry of Health. 2003. Microbiological water quality guidelines for marine and fresh water recreational areas. Ministry for the Environment and Ministry of Health, Wellington.
Mosley P. 1982. Critical depths for passage in braided rivers, Canterbury, New Zealand. Journal of Marine and Freshwater Research, 16: 351–357.
MWH. 2008. Ngaruroro River high flow allocation. Report prepared for Hawke’s Bay Regional Council. MWH, Wellington.
Nga Hapu o Otaki. 2000. Proposed Ngati Raukawa Otaki River and Catchment Iwi Management Plan 2000. Prepared for Te Runanga o Raukawa by Nga Hapu o Otaki, Otaki.
Perrie A. 2007. The state of water quality in selected rivers and streams in the Wellington region, 2003-2006. Greater Wellington Regional Council, Publication No. GW/EMI-T-07/218, Wellington.
Perrie A. 2009. Annual freshwater quality monitoring report for the Wellington region, 2008/09. Greater Wellington Regional Council, Publication No. GW/EMI-G-09/235, Wellington.
Perrie A and Cockeram B. 2010. Annual freshwater quality monitoring report for the Wellington region, 2009/10. Greater Wellington Regional Council, Publication No. GW/EMI-G-10/163, Wellington.

Otaki River instream values and minimum flow assessment
WGN_DOCS-#800167-V1 PAGE 45 OF 46
Poff NL, Allan JD, Bain MB, Karr JR, Prestegaard KL, Richter, BD, Sparks RE and Stromberg JC. 1997. The natural flow regime. BioScience 47:769–784.
Robertson B and Stevens L. 2007. Kapiti, Southwest, South Coasts and Wellington Harbour risk assessment and monitoring recommendations. Report prepared for Greater Wellington Regional Council by Wriggle Ltd.
Te Runanga o Raukawa. 1992. Otaki Floodplain Management Plan Tikanga Maori. Report prepared for Wellington Regional Council by Te Ahukaramu Charles Royal, Otaki.
Thompson M. 2011. Comparison of Minimum Flow setting using 1-day and 7-day MALF for two rivers in the Wellington region. Greater Wellington Regional Council, unpublished internal communication (Document reference #938883), Wellington.
Tidswell S. 2009. Kapiti Coast groundwater quality investigation 2008. Greater Wellington Regional Council, Publication No. GW/EMI-T-09/246, Wellington.
Townsend C, Delange P, Duffy C, Miskelly C, Molloy J and Norton D. 2008. New Zealand threat classification system manual. Department of Conservation, Wellington.
Unwin M. 2009. Angler usage of lake and river fisheries managed by Fish & Game New Zealand: Results from the 2007/08 national angling survey. NIWA Client Report: CHC2009-046.
Watts L. 2006. Framework for instream flow assessment in the Wellington Region. Greater Wellington Regional Council, unpublished internal report, Wellington.
Wellington Regional Council. 1994. Hydrology of the Kapiti Coast. Wellington Regional Council, Publication No. WRC/CI-T/G-94/13, Wellington.
Wellington Regional Council. 1998. Otaki Floodplain Management Plan for the Otaki River and its environment. Wellington Regional Council, Publication No. WRC/FPSA-G-98/28, Wellington.
Wellington Regional Council. 1999. Regional Freshwater Plan for the Wellington region. Wellington Regional Council, Publication No. WRC/RP-G-99/31, Wellington.

Otaki River instream values and minimum flow assessment
PAGE 46 OF 46 WGN_DOCS-#800167-V1
Acknowledgements
Thanks to Joe Hay (Cawthron Institute) for advice on the habitat modelling, analysis of survey data and review of the report.
The generalised habitat assessment was carried out by Greater Wellington’s Environmental Monitoring and Investigations Department. This report was reviewed by, and has contributions from, Alton Perrie (Environmental Scientist), Juliet Milne (Team Leader, Environmental Science), Miranda Robinson (Team Leader, Environmental Policy), Murray McLea (Senior Advisor, Environmental Policy) and members of the Flood Protection Department. Sections of this report on recreational, scenic and cultural values were reviewed by Te Waari Carkeek (Tūmuaki of Te Rūnanga o Raukawa), Eric Matthews (President of the Otaki Recreational Fishing Club) and Max Lutz (President of Friends of the Otaki River). The Department of Conservation (DoC) and Wellington Fish and Game Council (F&G) were given an opportunity to review the report and Michel Dedual (DoC) and Corina Jordan (F&G) provided some helpful feedback.

Water, air, earth and energy – elements in Greater Wellington’s logo that combine to create and sustain life. Greater Wellington promotes Quality for Life by ensuring our environment is protected while meeting the economic, cultural and social needs of the community
For more information, contact Greater Wellington:
Wellington officePO Box 11646Manners StreetWellington 6142T 04 384 5708F 04 385 6960
Masterton officePO Box 41Masterton 5840 T 06 378 2484F 06 378 2146
September 2011GW/EMI-T-11/133
Follow Greater Wellington:
www.gw.govt.nz
Cover photo:Otaki River, courtesy of Flood Protection Department, Greater Wellington Regional Council. Photo taken on 15 January 2009