Embed Size (px)
Citation preview

Monitoring of X-ray binaries and novae with the Burst Alert
Telescope on board the Swiftsatellite
Fabio SenzianiPavia, February 1st 2008
Supervisors: Prof. Giovanni Fabrizio Bignami
Prof. Gerald Keith Skinner

Outline
1. The Burst Alert Telescope on board Swift
2. The BAT survey data exploitation: a pipeline for temporal and spectral analysis of known sources. Tests with the Crab and GRO J1655-40
3. Application to some astrophysical sources:
- IGR J08408-4503: a new recurrent supergiant fast X-ray
transient
- 4U 1954+319: a new symbiotic low mass X-ray binary
system
4. Search for prompt gamma-ray emission from novae:
- Detection of RS Ophiuchi
- Classical novae: expected rate of detection of novae with
BAT
5. Conclusions and plans for future work

The first aim of Swift is the detection
of Gamma-Ray Bursts (GRBs) and
the following multi-wavelength
study with all the instruments on
board (rapid follow-up)
GRBs are rapid (from a few milliseconds
up to several minutes) bright gamma-ray
transients uniformly distributed,
appearing at a rate of ~1/day
The Swift mission• Launched on November 2004
• USA / UK / ITALY collaboration

Other scientific objectives of Swift/BAT (SECONDARY SCIENCE):
1. The most sensitive all-sky survey ever made in the hard X-ray band2. Rapid reaction science
Gehrels et al. (2004), ApJ 611, 1005
The first aim of Swift is the detection
of Gamma-Ray Bursts (GRBs) and
the following multi-wavelength
study with all the instruments on
board (rapid follow-up)
The Swift mission

The Burst Alert Telescope on board Swift
BAT is a coded mask instrument: a mask is mounted ~1m above a detector plane
composed of 32768 CdZnTe elements (5200 cm2) sensitive in the 14-200 keV
band
4 mm x 4 mm x 2mmDetector Unit Size
32768Detection Elements
50 %Sky coverage / orbit
BAT in a nutshell
14-200 keVEnergy Range
20 arcmin (FWHM)Telescope PSF
1.4 sr (partially-coded)Field of View
Photon by photon (burst mode); Detector plane histogram (survey mode)
Detector Operation
CdZnTeDetector
5200 cm2Collecting Area
BAT is the key instrument to detect GRBs
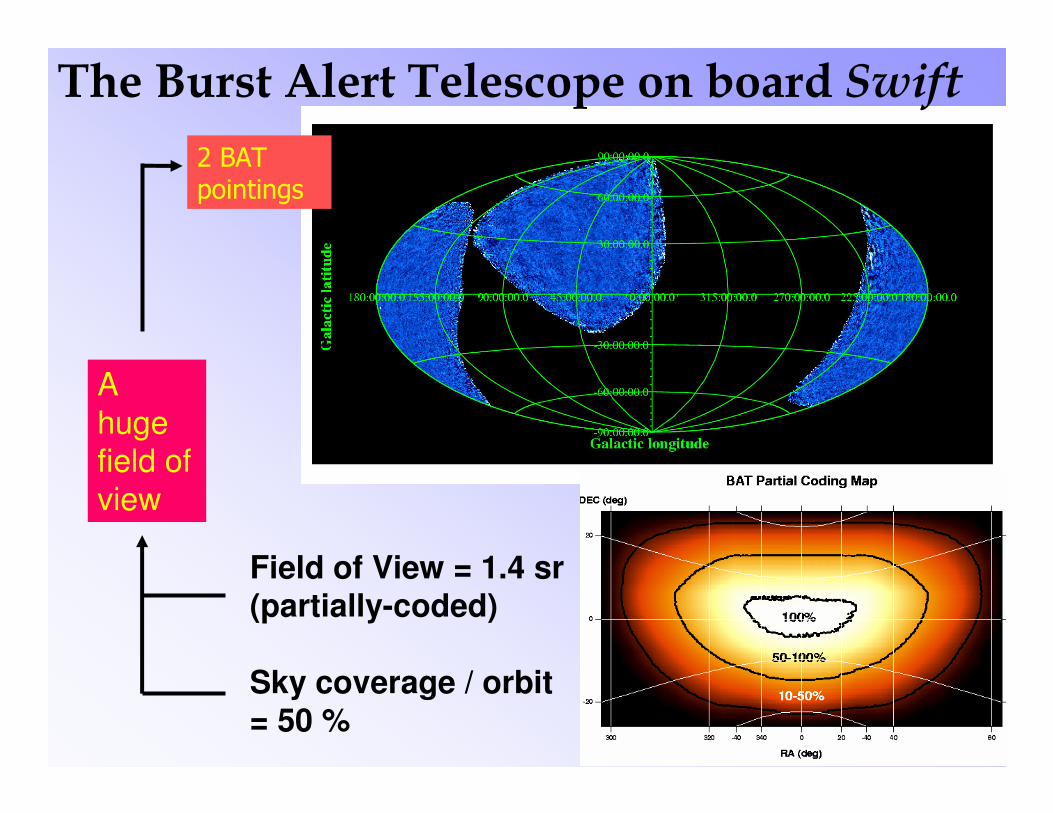
2 BAT pointings
A
hugefield of
view
Field of View = 1.4 sr(partially-coded)
Sky coverage / orbit = 50 %
The Burst Alert Telescope on board Swift

Outline of the BAT dataBAT pointing (survey mode)
Detector count rates searched on board for transients (ring buffer ~10 min, different timescale/energy bands)
Trigger
Image
GRB Alert
Interesting known source
BAT repointing
Event file
No triggers
DPH file
Detector Plane Histograms (DPHs):
• 3D histograms: 2 spatial dimensions
(detector plane) + 1 spectral (80
energy channels)
• Typical integration time of 450 s or
less, depending on operational reasons
(telemetry availability, slews, SAA …)
GRB Science Secondary Science

The Secondary Science
While waiting for a GRB (or performing a follow-up observation), BAT spends a large fraction of time observing the sky
in the 14-200 keV energy band (survey mode)
The survey database contains a HUGE amount of information of the hard X-ray sky
All-sky survey
Specific studies of many classes of hard X-ray sources, from detections of rapid transients
to long-term studies of the evolution of variable sources.
The possibility of using BAT for this purposewas substantially unexplored.

The BAT survey data exploitation: a pipeline for temporal and spectral analysis
This pipeline was successfully used to study:
1. The Crab and the microquasar GRO J1655-40 (calibration test): Senziani et al. (2007), A&A 476, 1297
2. The SFXT IGR J08408-4503: Gotz et al. (2007), ApJ 655L, 1013. The Symbiotic LMXB 4U 1954+319: Mattana et al. (2006), A&A 460L, 1M
Public tools for DPH analysis available at http://heasarc.nasa.gov/docs/swift/analysis/ but BAT survey data analysis is not supported
Implemented a pipeline which combines opportunely the public tools to reduce data and extract spectral information
of known sources

Good DPHselection
DPHpreparation
DPHstacking
Source countsextraction
Whole DPHdeconvolution
Sky image
Maskweighting
Spectrum+ RMF
Spectralparameters
Upperlimits
Archive
Sourcedetection
Spectralanalysis
The BAT survey data exploitation: a pipeline for temporal and spectral analysis

Evaluation of source flux: mask weighting
Select a position on the sky and extract a spectrum from DPH
1. Generate weighting map for selected direction
2. Extract bkg-subtracted spectrum
3. Generate ad-hoc response matrix
4. Include appropriate systematics
5. Spectral modelling (Xspec)

The Crab dataset
4626 DPHs retrievedfrom archive
2005/01/01 - 2005/06/31
~3600 good DPHs - 1.2 Ms total
~1000 DPHs discarded (~20%)
Good data
Discarded DPHs:
# detectors not enabled 36
Earth contamination + SAA 121
Star tracker unlocked 264
Pointing unstable 317
High bkg count rate 328
Earth/Moon/Sun source occultation 297

Mask weighting: results
10-100 keV Crab Flux
All data:Mean 2.29×10⁻⁸ erg cm-2 s-1
RMS 8.8%
Nominal flux:
2.25×10⁻⁸ erg cm-2 s-1
Pcoded>0.1:
Mean 2.30 ×10⁻⁸ erg cm-2 s-1
RMS 6.9%
Reliable down topcode<0.1
α−
=KEEA )(Spectrum :

Crab photon indexin 10-100 keV
Nominal 2.13
All data
Mean 2.14 – RMS 0.11
Pcode>0.1
Mean 2.14 – RMS 0.09
Mask weighting: results

A further step: DPH stacking
• Typical DPH exposure: ~5 min
• Good DPHs may be merged to increase statistics
• Careful check of attitude is crucial
7.7%2 arcmin0.1
19.4%4 arcmin0.5
5.2%2.7 arcmin0.5
5.7%5 arcmin1
1.9%3 arcmin1
Flux lossOffsetCodedFraction
A test with the Crab
To be conservative, we stack DPH
if coordinate differby <1.5 arcmin

The 2005 outburst of GRO J1655-40
Source strongly variable both in flux and in spectral shape
Monitoring campaign with RXTE: cross-calibration!
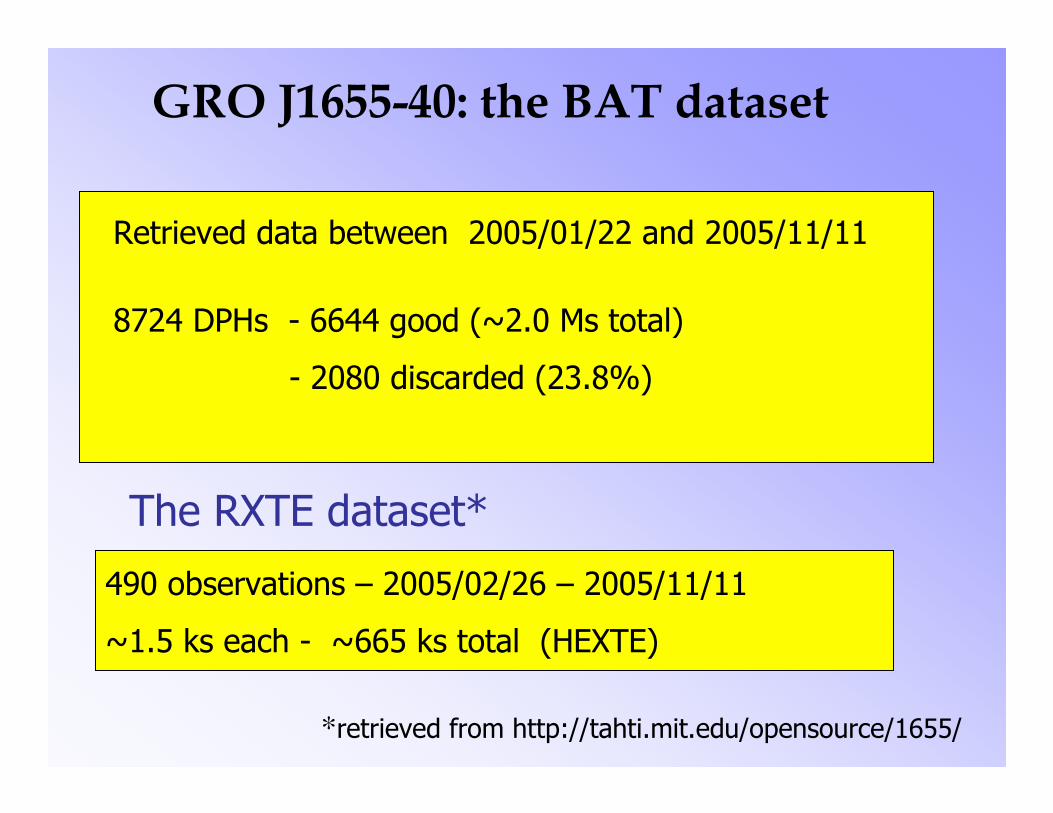
GRO J1655-40: the BAT dataset
Retrieved data between 2005/01/22 and 2005/11/11
8724 DPHs - 6644 good (~2.0 Ms total)
- 2080 discarded (23.8%)
490 observations – 2005/02/26 – 2005/11/11
~1.5 ks each - ~665 ks total (HEXTE)
The RXTE dataset*
*retrieved from http://tahti.mit.edu/opensource/1655/

BAT vs HEXTEFlux in 30-100 keV
Independent spectral analyses

The rise and the first peak
PCADetection
ASMdetection
• Source activity first noticed with PCA bulge scan (ATel 414)• BAT would have detected the source serendipitously ~3 days before• ASM detection ~20 days later
BAT detection

Flux difference
Max ~15%
BAT
HEXTE
PCA light curve
BAT and HEXTE light curves
The rise and the first peak

The veryhigh state
Flux difference~ 8%
BAT
HEXTE
PCA light curve
BAT and HEXTE light curves

The end of the outburst
BAT
HEXTE
PCA light curve
BAT and HEXTE light curves

• Generally, a good agreement (within errors) is found whenthe S/N in BAT spectra is greater than 4
• The actual flux yielding such a S/N obviously depends on the
position of the target within the FOV
• In one hour exposures, the 3σ sensitivity with our approach is
∼10−20 mCrab for an on-axis source, a factor ∼10 worse at acoded fraction of 0.2
• If the target lies within the half-coded region, our approach
yields significant spectral measurements (consistent with
HEXTE) in the 30–100 keV range down to (5−6) × 10−10 erg cm−2 s−1, or ∼50 mCrab
The pipeline sensitivity

Spectral shape: the very high state

We have a pipeline that can follow the evolution of both
the temporal and spectral behavior of a source
The huge amount of survey data serendipitously collected
while waiting for GRBs can be exploited using our pipeline
Monitoring of hard X-ray sources
• Probably next year the RXTE mission will finish, thus BAT will
continue the monitoring of the sky in the 14-200 keV energy band
• Although this project is part of the “Secondary Science” program of
Swift, it will be of great interest for hard X-ray astronomy
Monitoring of hard X-ray sources

IGR J08408-4503: a new recurrent supergiant fast X-ray transient
• Sporadic, aperiodic (except IGR
J11215-5952) outbursts, reaching
luminosities of 1036-1037 erg/s
• Strong flaring activities
characterized by very short
timescales (from minutes to hours)
• Origin of the outbursts unknown
(clumpy wind … )
• SFXTs have been discovered only recently as a new class of X-ray sources
• They consist of a wind-accreting compact object and an OB supergiant donor star
• Most of the time is spent in a quiescent state (X-ray luminosity of 1032-1033 erg/s)
The Supergiant Fast X-ray Transients (SFXTs)

IGR J08408-4503: a new recurrent supergiant fast X-ray transient
IGR J08408-4503
• We studied the 3rd flare with BAT and XRT
• No evidence for periodicity
• NH ∼1021cm-2 during the 3rd outburst, compatible with the total Galactic absorption in the same direction as estimated from the HI maps
Gotz et al. (2007), ApJ 655L, 101
• Not consistent with a clumpy wind scenario
• Probably sudden accretion onto the magnetic poles of matter previously stored in the magnetosphere during the quiescent phase

4U 1954+319: a new symbiotic low mass X-ray binary system
Mattana et al. (2006), A&A 460L, 1
4U 1954+319• The third LMXB hosting a NS and a late type giant companion:
Symbiotic X-ray binary, the probable progenitors of most wide-orbit LMXBs
• Detected a periodic signal (∼5.09 h) quasi-monotonically decreasing (Corbet et al. 2006)
BAT observations
• BAT lightcurve of ∼1yr in the 15-50
keV band used for timing analysis
• Periodic signal confirmed (∼5.17h):
THE SLOWEST NS SPIN PERIOD
OBSERVED
• Spin-up time scale (P/P_dot) of ∼25
years
• Local episodes of spin-down
• Using the standard accretion torque
models a value of B∼1012 G was derived
Interpretation• NS spin period of 5h can be reached in
∼8.5 × 10⁹ yr, the age of the companion star
• Spin-up trend coupled with the increase of
the accretion rate (red giant phase)

Search for prompt gamma-ray emission from novae
Originally novae were stars which became
visible to naked eye where no star was
known before and lasting some days before
vanishing
Thanks to the progress in
astronomical instrumentation
now we can study their
progenitors
However, a multi-wavelength study
of a nova depends
on its discovery which typically still
occurs at optical wavelengths
Amateurs astronomers are of crucial importance
V2275 Cyg

ModelNovae are grouped in the cataclysmic variables class (CVs)
Matter accumulates on top of the WD (envelope) until it reaches critical conditions and
consequently erupts (Thermonuclear Runaway) causing the emission of light
at different wavelengths and ejection of a fraction of the accreted mass
After that, the nova returns in its normal state until the accreted material
on top of the WD is enough to enable a further eruption
(104-105 yrs for CNe, tens of years for RNe).
Accreting
White Dwarf
Companion star

Credit: Dr Andrew Beardmore, University of Leicester

During a nova eruption the hydrogen
burning produces several short-lived
β+-unstable nuclei (13N, 14-15O, 17-18F).
The instruments used in the past did not detect
gamma-rays from novae mainly because none was
sufficiently sensitive and complete in coverage
Courtesy of M.Hernanz
Their decay results in:
• prompt gamma-ray emission (511
keV line + Comptonization down to
few tens of keV)
• envelope expansion
• mass ejection
13N (τ=862 s) and 18F (τ=158 min)
are the most important contributors
of the gamma-ray emission since
they decay when the envelope is
becoming transparent.
WE TRIED WITH BAT
Model

BAT is a suitable telescope to search for prompt gamma-rays from novae.
In survey mode BAT can monitor a given source about every day with a
time resolution which is typically 300s.
Performed a retrospective search in the BAT data archive for gamma-ray
emission from a sample of 18 novae detected visually from the Swift launch
(November 2004 – March 2007)
• BAT data selection: for each nova, all data having the nova in the FOV and
with time comprises between 20 days before and 20 days after the discovery time
• Data reduction performed with Prof. Skinner’s pipeline
(public tools + non-standard products)
• Energy bands: 14-25, 25-50, 50-100, 100-200 keV
• Timescales: “DPH by DPH”,1h,3h,6h,12h,24h
Search for prompt gamma-ray emission from novae
Search for new transients in the data
Retrospective search from the direction of known novae

RS Ophiuchi

Bode et al. (2006), ApJ 652, 629
We detected the Recurrent Nova
RS Ophiuchi in the 14-25 keV
energy band
Emission due to the shock between
the ejecta and the dense red-giant
wind from the companion
On day 3:
• kT ~ 8-9 keV
• vej ~ 2500 km/s
• NH ~ 5.5 x 1022 cm-2
XRT and PCA spectra well
described by a bremsstrahlung
model (emission from a high
temperature thermal
plasma), consistent with the
emission produced by the shock-
system
erg
s/c
m2/s
RS Oph

Results for the other 17 Classical Novae
• No evidence was found for prompt gamma-ray emission from any of the 17
classical novae
• The distribution of the complete ensemble of S/N measurements (750000
points) agrees very well with a random distribution around zero
We therefore conclude that in each case either the expected gamma-ray
emission from the novae occurred when the object was not in the BAT FOV
or the distance was too large for the predicted emission to be detected
• For each nova we estimated upper limits which were used to estimate the maximum
distance out to which they should have been detectable (for probabilities P that the
peak of emission occurred when BAT was observing the nova of P=10% and P=50%)
• We found that BAT can see up to a distance of 2-3 kpc (P=10%).
The distances estimated with the AAVSO lightcurves of each nova are too large compared with those estimated with BAT, thus the non
detections are not surprising

Senziani et al. , in progress
Expected rate of detection of novae with BATVirtual novae simulated with a Monte Carlo approach
assuming:
• 3 different models of the spatial distributions in the
Galaxy
• A rate of novae in the Galaxy of 35/y (Shafter, 1997)
If Swift will be operating for 10 yrs (as predicted), we expect to detect 2-5
novae during the mission
Expected rate of detection of novae with BAT
calculated with the simulated sample of novae
assuming:
• The predicted gamma-ray fluxes
• The ideal 5σ BAT sensitivity
• The real BAT observing sequence during the first
2.28 yrs

Conclusions
• Huge database of BAT "Survey" data substantially unexplored
• We developed an ad-hoc pipeline for BAT "Survey" data reduction and analysis,
aimed at spectral monitoring of bright sources
• Calibration of such pipeline with the Crab and with GRO J1655-40 shows that BAT
is a very powerful all-sky hard X-ray monitor, with a sensitivity (1 hour) of
20 mCrab for an on-axis source (or 50 mCrab half-coded)
• We used our pipeline to study two very peculiar Galactic accreting sources
- IGR J08408-4503 , a new member of the SFXTs
- the Symbiotic Low-mass X-ray Binary 4U 1954+319, hosting the neutron star
with the slowest spin period known
• A different pipeline for BAT Survey data analysis was developed by Prof.Skinner
at CESR. We used such a pipeline in order to study gamma-ray emission from novae
- we detected emission from RS Oph, but this is due to shocks between the ejecta
and the dense stellar wind from the red-giant companion
- we searched for emission from known novae, but only upper limits were obtained
- we estimated 2-5 new detections in 10 years of BAT data

Plans for future work
• We will start a systematic analysis of BAT Survey data using our pipeline
for spectral monitoring, focusing on different classes of Galactic sources
(peculiar objects; microquasars; standard LMXB)
• The search for prompt gamma-rays from novae will continue in the future both
by retrospectively searching in the BAT data once the novae are discovered
optically and by searching for new transients in the images of the whole archive
• We are implementing and testing a new pipeline aimed at stacking BAT
data with different pointings. This will allow to detect and study much fainter
sources (current capabilities: <5mCrab in 1 month)
• Such a new pipeline, coupled to our first one, will have very interesting
potentialities. In particular, we will use BAT for simultaneous follow-up studies
of high energy gamma-ray sources detected by AGILE and GLAST

Acknowledgments
• I would like to thank Gerry Skinner and all the CESR group not only for the scientific training but also for their helpfulness and friendship
• A special thank to Prof. Bignami and Dr. Caraveo for the possibility they offered me, Tomaso Belloni and all the friends of Milano
• I would like to address a special thank to the Pavia BAT team (ADL, Gio and Mario) and to all the astrophysicists of Pavia for the pleasant days spent all-together