Embed Size (px)
Citation preview

Molecular Simulation Approaches toProteins Structure and Dynamics
and to Ligand Design
Thesis submitted for the degree of
Doctor Philosophiæin Structural and Functional Genomics
Candidate: Supervisors:Marco Berrera Prof. Paolo Carloni
Dr. Sergio Pantano
October, 2006


Contents
1 Motivations and Summary 5
2 Introduction 92.1 Catabolite Activator Protein . . . . . . . . . . . . . . . . . . . . . . . . 9
2.1.1 Biological context . . . . . . . . . . . . . . . . . . . . . . . . . . 92.1.2 Structure . . . . . . . . . . . . . . . . . . . . . . . . . . . . . . 102.1.3 cAMP binding . . . . . . . . . . . . . . . . . . . . . . . . . . . . 112.1.4 DNA binding . . . . . . . . . . . . . . . . . . . . . . . . . . . . 112.1.5 Aims . . . . . . . . . . . . . . . . . . . . . . . . . . . . . . . . . 12
2.2 Ion channels . . . . . . . . . . . . . . . . . . . . . . . . . . . . . . . . . 132.2.1 Biological context . . . . . . . . . . . . . . . . . . . . . . . . . . 132.2.2 HCN Channels . . . . . . . . . . . . . . . . . . . . . . . . . . . 142.2.3 Structure . . . . . . . . . . . . . . . . . . . . . . . . . . . . . . 152.2.4 cAMP Modulation . . . . . . . . . . . . . . . . . . . . . . . . . 162.2.5 Aims . . . . . . . . . . . . . . . . . . . . . . . . . . . . . . . . . 17
2.3 Nerve Growth Factor . . . . . . . . . . . . . . . . . . . . . . . . . . . . 182.3.1 Neurotrophins . . . . . . . . . . . . . . . . . . . . . . . . . . . . 182.3.2 Biological context . . . . . . . . . . . . . . . . . . . . . . . . . . 182.3.3 Structure . . . . . . . . . . . . . . . . . . . . . . . . . . . . . . 192.3.4 The NGF receptors . . . . . . . . . . . . . . . . . . . . . . . . . 202.3.5 NGF / trkA interaction . . . . . . . . . . . . . . . . . . . . . . 202.3.6 Therapeutic applications . . . . . . . . . . . . . . . . . . . . . . 212.3.7 Aims . . . . . . . . . . . . . . . . . . . . . . . . . . . . . . . . . 21
3 Methods 233.1 Molecular dynamics . . . . . . . . . . . . . . . . . . . . . . . . . . . . . 23
3.1.1 Force Field . . . . . . . . . . . . . . . . . . . . . . . . . . . . . 243.1.2 Integration of the equation of motion . . . . . . . . . . . . . . . 263.1.3 Constraint algorithm . . . . . . . . . . . . . . . . . . . . . . . . 283.1.4 Periodic boundary conditions . . . . . . . . . . . . . . . . . . . 283.1.5 Long-range interactions . . . . . . . . . . . . . . . . . . . . . . . 293.1.6 Thermostats . . . . . . . . . . . . . . . . . . . . . . . . . . . . . 313.1.7 Barostats . . . . . . . . . . . . . . . . . . . . . . . . . . . . . . 333.1.8 Generalized Born model . . . . . . . . . . . . . . . . . . . . . . 343.1.9 Steered molecular dynamics . . . . . . . . . . . . . . . . . . . . 35

4 CONTENTS
3.1.10 Analysis of MD trajectories . . . . . . . . . . . . . . . . . . . . 363.2 Elastic network analysis . . . . . . . . . . . . . . . . . . . . . . . . . . 393.3 Electrostatic calculations . . . . . . . . . . . . . . . . . . . . . . . . . . 413.4 Hot spot binding energy prediction . . . . . . . . . . . . . . . . . . . . 42
4 Catabolite Activator Protein 434.1 Computational Details . . . . . . . . . . . . . . . . . . . . . . . . . . . 444.2 Results and discussion . . . . . . . . . . . . . . . . . . . . . . . . . . . 484.3 Concluding remarks . . . . . . . . . . . . . . . . . . . . . . . . . . . . . 554.4 Reference . . . . . . . . . . . . . . . . . . . . . . . . . . . . . . . . . . 55
5 cAMP modulation of the HCN2 channel 575.1 Computational details . . . . . . . . . . . . . . . . . . . . . . . . . . . 595.2 Results and discussion . . . . . . . . . . . . . . . . . . . . . . . . . . . 60
5.2.1 Holoprotein . . . . . . . . . . . . . . . . . . . . . . . . . . . . . 605.2.2 Apoprotein . . . . . . . . . . . . . . . . . . . . . . . . . . . . . 63
5.3 Concluding remarks . . . . . . . . . . . . . . . . . . . . . . . . . . . . . 645.4 Reference . . . . . . . . . . . . . . . . . . . . . . . . . . . . . . . . . . 65
6 Binding of NGF peptide mimics to trkA 676.1 Computational details . . . . . . . . . . . . . . . . . . . . . . . . . . . 68
6.1.1 Features of the N-term@NGF / trkA-d5 interactions . . . . . . 686.1.2 Molecular dynamics . . . . . . . . . . . . . . . . . . . . . . . . . 706.1.3 Steered molecular dynamics . . . . . . . . . . . . . . . . . . . . 72
6.2 Results and discussion . . . . . . . . . . . . . . . . . . . . . . . . . . . 726.2.1 Steered molecular dynamics . . . . . . . . . . . . . . . . . . . . 76
6.3 Concluding remarks . . . . . . . . . . . . . . . . . . . . . . . . . . . . . 806.4 Reference . . . . . . . . . . . . . . . . . . . . . . . . . . . . . . . . . . 80
7 Conclusions 81

Chapter 1
Motivations and Summary
Molecular simulations approaches are powerful tools for structural biology and drug
discovery. They provide additional and complementary information on structure, dy-
namics and energetics of biomolecules whose structures have been determined exper-
imentally [1, 2, 3, 4, 5, 6, 7]. In particular, Molecular Dynamics (MD) simulations [8],
along with elastic network analysis [9], offer insights into molecular fluctuations, confor-
mational changes and allosteric mechanisms. In addition, molecular simulation can be
used to design novel and potent ligands to a specific target (either a protein or DNA) as
well as to estimate ligands potency [10,11]. Attempts at predicting protein structures
using bioinformatics and MD are also increasingly successful [12, 13, 14, 15], as well as
approaches that use solely simulation tools [16]. The development of new algorithms
and the continuously growing computer power currently allow for the simulation of
more and more complex biological systems, such as protein aggregates [7,17,18,19,20]
and protein/DNA complexes [21].
In this context, a number of theoretical techniques (namely molecular dynamics
simulations, elastic network analysis, electrostatic modeling and binding energy pre-
dictions) have here been applied to the study of specific proteins. On the basis of
X-ray protein structures, molecular simulations have provided a detailed description of
internal motions and interactions, which are not evident from the experimental data
and have functional implications.
First, we have used MD to investigate structural features, focusing on the differences
between the solid state and the aqueous solution structures. Over 80% of data in the

6 Motivations and Summary
PDB [22] are X-ray structures, making protein crystallography the major resource in
structural biology. Nevertheless, in a few cases, the structural details might be affected
by environmental features, such as the presence of small compounds in the buffering so-
lution and/or crystal packing contacts due to the periodic lattice. Here, a comparative
MD study has been performed on the Catabolite Activator Protein (CAP), in both the
crystal phase and in the aqueous solution. CAP is a bacterial DNA-binding transcrip-
tion regulator whose activity is controlled by the binding of the intracellular mediator
cyclic Adenosine MonoPhosphate (cAMP). CAP is a homodimeric protein and each
subunit is formed by a cyclic nucleotide- and a DNA-binding domain. Inspection of
the available CAP X-ray structure within the crystal environment [23] suggests that
packing contacts do affect the native conformation of the ligand activated protein.
Anticipating our results, we have found that indeed the conformation of the protein
in solution is different, and that these differences may play a role for CAP biological
function.
Next, we have used molecular simulations to target structural flexibility. Confor-
mational fluctuations often play a key role for the protein function and MD simu-
lations can provide information on large-scale concerted motions of proteins [24, 25,
26]. We have addressed this point in the context of the Hyperpolarization-activated
Cyclic Nucleotide-modulated (HCN) cation channel. The tetrameric HCN channels are
opened by membrane hyperpolarization, while their activation is allosterically modu-
lated by the binding of cAMP in the cytoplasm. The cytoplasmic part of the HCN2
channel, which is responsible for the channel modulation, has been here investigated
by MD simulations and elastic network analysis, on the basis of the available X-ray
structure [27], to earn new insights into the molecular mechanism triggered by cAMP.
We have found that, in the presence of cAMP, the protein undergoes a quaternary
structure oscillation, in which each subunit moves as a rigid body. This fluctuation,
which is not observed in the absence of cAMP, could facilitate the channel opening
transition.
Finally, we have moved our attention to an issue relevant for structure-based drug
design. Within a long-standing collaboration with Prof. Cattaneo’s lab (SISSA and

Motivations and Summary 7
Layline Genomics), our group has been interested in the design of mimics of proteins
involved in the biochemical pathways that lead to the Alzheimer’s disease. Here, on the
basis of structural information [28], we have designed a peptide that could specifically
target trkA, the high affinity receptor of the Nerve Growth Factor (NGF), which is
a protein that plays a critical role for the development, survival and maintenance of
neurons in the vertebrate nervous system and activates signaling pathways related to
neuroprotection. The results of this research will be tested at the Prof. Cattaneo’s Lab
in order to validate the theoretical findings and assess the potency and the effects of
such a ligand.


Chapter 2
Introduction
As mentioned in chapter 1, in this thesis we have used MD simulations and other
computational tools to investigate structure and dynamics of proteins and to design
peptide mimics. Hereafter, we introduce the specific systems we have been focusing
on.
2.1 Catabolite Activator Protein
2.1.1 Biological context
The Catabolite Activator Protein (CAP), also known as the cyclic Adenosine MonoPhos-
phate (cAMP) Receptor Protein (CRP), is a bacterial activator of the transcription
of several operons, including those that code for enzymes involved in the metabolism
of sugars like lactose, maltose and arabinose, following the binding of the intracellu-
lar mediator cAMP [29, 30, 31, 32, 33]. As glucose level drops, the cell-surface enzyme
adenylyl cyclase is activated and converts ATP into cAMP molecules, which is re-
leased through the cell. Because of its role in delivering messages from the primary
glucose sensor (adenylyl cyclase) to the synthetic machinery, cAMP is often known as
a second messenger. When cAMP binds to CAP, it changes the conformation of the
protein [34, 31, 32], which thus binds to a specific DNA sequence [35] located next to
the genes that are activated. Therefore, the cAMP binding to the protein ultimately
results in transcription activation [36,31,37].
The selective DNA binding occurs at micromolar concentrations of cAMP and is
inhibited at higher ligand concentrations, although the nonselective DNA binding is

10 Introduction
not as greatly inhibited [38, 39, 35, 40], suggesting that CAP in the presence of low
cAMP concentrations is the active form [41, 35]. This biphasic behavior is due to the
presence of two cAMP binding sites for each protein subunit: the primary binding site
has high affinity for cAMP and is responsible for the protein activation; the secondary
binding site has lower ligand affinity and is responsible for the CAP features in case
of high ligand concentration [35]. Because of the different ligand affinity of the two
binding sites, the primary sites are preferentially ligand bound before the secondary
sites [42].
2.1.2 Structure
The structural basis of the allosteric mechanism activated by cAMP binding to CAP
before its interaction with DNA and a model of the DNA bending triggered by the
binding of the activated protein have been described on the basis of the X-ray structures
of the cAMP-bound CAP from Escherichia coli in the DNA-free and DNA-bound
states [43,44,41,23] and of the related protein CO-sensing transcription regulator from
Rhodospirillum rubrum [45], which controls the activation of the transcription of genes
involved in the oxidative metabolism of CO.
CAP is a homodimer of 22,500 molecular weight and the two subunits (namely
A and B, 209 amino acids each) are formed by two domains each: the N-terminal
Cyclic Nucleotide Binding Domain (CNBD, residues 1-137) and the C-terminal DNA-
Binding Domain (DBD, residues 138-209). The hinge interdomain region includes
residues located close to the homodimeric symmetry axis (residues 133-142).
The DNA-bound and DNA-free structures differ for the DBDs orientation: in the
first structure the DBDs are symmetrically arranged and are both packed against their
CNBDs (closed conformation); DNA is bent by ∼90◦ [41, 43, 44]. In the latter, one
domain is still in the closed conformation (A subunit) whilst the other (B subunit) is
separated from its corresponding CNBD by a cleft (open conformation) [23].

Introduction 11
2.1.3 cAMP binding
The CNBD includes an eight-stranded β-roll, which is flanked by the A-helix at its N-
term, and by the B- and C-helices at its C-term. cAMP binds in its anti -conformation
to the so called primary binding sites, which is located within the β-roll and is lined
by the C-helices of both subunits (Fig.1a). In fact, the CNBD is responsible for the
protein dimerization. cAMP forms H-bonds with the CAP side chains of residues
Glu-72, Arg-82, Ser-83, Thr-127 and Ser-128; additional H-bonds are formed with the
protein backbone of residues Gly-71 and Ser-83.
A comparative theoretical study has shown that the CNBD is a signaling module
that is found in different proteins with conserved structure and function [46]. Details
into the structural mechanism activated by cAMP in the CNBDs of the Protein Kinase
A (PKA) regulatory subunit and of the HCN2 ion channel has been previously obtained
by performing molecular simulation studies, which showed that a change in structural
and dynamic features of the secondary structure elements lining the binding site is
driven by the ligand [47, 48]. In CAP, the cAMP binding to the CNBDs triggers a
reorientation of the β4/β5 loops and of the C-helices, which allosterically leads to a
change in the hinges and, consequently, to a repositioning of the DBDs [49, 50, 51, 52,
53,54,55,23,45,56,57,46,58].
The low-affinity secondary binding sites are formed by residues from both domains
of the same subunit and from the hinge region of the opposite chain [44].
2.1.4 DNA binding
Each DBD includes a helix-turn-helix motif (E- and F-helices) involved in the specific
recognition of DNA, whose consensus sequence is 5’-AAATGTGATCT-3’ [59]. As a
consequence of the complexation, a kink in the DNA occurs between nucleotide base
pairs 5’-TG-3’ (bases 6 and 7 of the above consensus sequence) on both sides of the
dyad axis, as is observed in the DNA-bound CAP X-ray structure, in which the DNA
is bent by nearly 90◦ [43,60,61,62,63,64]. This sequence has been shown to favor DNA
flexibility and bending also in other systems [33,65].

12 Introduction
The DNA binding induces a change in the conformation of CAP, in particular
affecting regions of the protein which are involved in interactions with other members of
the transcription machinery [66,67,68,69,70], even away from the protein-DNA contact
region, as the B-helix [70]. This suggests that DNA binding may play a role in the
modulation of the protein-protein interactions of CAP. The regulation of transcription
factors activity by DNA-induced conformational changes has been documented in a
number of eukaryotic systems [71].
Following the CAP binding to DNA, RNA polymerase is recruited for transcription
activation. CAP contains activating regions that have been proposed to participate
in direct protein-protein interactions with RNA polymerase and/or other basal tran-
scription factors. Specifically, protein-protein interactions with RNA polymerase were
identified by mutagenesis experiments in the surface loop formed by residues 156-164
(residues Ala-156, Thr-158, His-159, and Gly-162) [66,67] and in residues His-19, His-
21, Glu-96 and Lys-101 [68].
2.1.5 Aims
The structure of the cAMP-activated form of CAP in aqueous solution and the effect
of crystal packing on the protein conformation are investigated by molecular dynamics
simulations. The relevance of the solution structural model for CAP biological function
is investigated.

Introduction 13
2.2 Ion channels
2.2.1 Biological context
The regulation of ion concentration and permeation is of crucial importance for a variety
of cellular functions, such as nervous signal transmission and osmotic regulation. These
functions are controlled by ion channels, which are proteins inserted in the membrane
lipid bilayer. They form aqueous pores through the cell membrane and provide a
feasible path for ion exchanges. By allowing ions to cross the hydrophobic barrier of
the core membrane, they control the cellular exchange of ionized particles. Several ionic
channels are known and they differ in functional, gating and selectivity properties [72].
In resting conditions, the internal side of a cell has a lower electrostatic potential
than the external side. When ions flow through the channels, they produce an electric
current and a change of the membrane potential. The conducting state of the channel
may be regulated by different factors that open and close the channel mouth, regu-
lating the ion current [72]. The gating mechanisms can be based on physical factors,
like the transmembrane potential difference in voltage-gated channels [73], which are
important for the transduction and the propagation of the electric signal in the hu-
man and animal nervous system [74,75], or the pressure-induced structural changes in
mechanosensitive channels [76]. In other classes of channels, chemical factors are also
regulators of the channel gating, as the presence of ligand molecules in, for example,
the cyclic nucleotide activated channels [77, 78], or pH variations in, for example, the
KcsA potassium channel [79].
An important property of the open channel is the selective permeability, which is
the ability to allow only to a restricted class of ions to flow through the channel pore
in large amount [80]. Channels may discriminate between ions with different valence
and charge, as in chloride channels [81], or between divalent cations over monovalent
cations, as in calcium channels [72].
Many human and animal diseases are associated to defects in ion channels function,
the majority of them arising from mutations in the genes that encode the channel pro-
teins [82,83,84,85,86,87,88]. Large effort is still necessary to connect these mutations

14 Introduction
to the structural and functional changes that cause the disorder.
2.2.2 HCN Channels
The Hyperpolarization-activated Cyclic Nucleotide-modulated (HCN) cation channels
belong to the voltage-gated channels superfamily. They are opened by membrane hy-
perpolarization, while the binding of cyclic Adenosine MonoPhosphate (cAMP) mod-
ulates their activity. The HCN channels family includes four members (HCN1–4) that
are expressed in cardiac and neuronal cells of vertebrates. [89,90,91,92,93,94,95,96,97,
98,99,100,101,102,103,104]. HCN channels control fundamental biological events such
as heart beat and neuronal rhythmic activity, providing the biophysical mechanism
for the pacemaker in these cells [105, 106, 107, 108]. Although these channels clearly
contribute to the determination of the resting potential of the cells in which they are
expressed, their role in dynamic signaling events is less well understood.
Hyperpolarization-activated cation currents (Ih) have puzzled physiologists since
their initial discovery 30 years ago [109]. Unlike most voltage-gated currents, Ih are
activated by transmembrane hyperpolarization, i.e. by potentials more negative than
the resting potential: this property earned them the designation of If for ‘funny’ [110] or
Iq for ‘queer’ [108]. Ih current plays a role in the generation of spontaneous pacemaker
activity both in the heart [105] and in the central nervous system [106]. The Ih current
that flows through HCN channels [111] is carried by a mixture of Na+ and K+ ions
[112,113] and is blocked by Cs+ ions in a voltage-dependent way [114].
The recent identification of a family of four mammalian genes that encode the
hyperpolarization-activated cation channels, HCN1-4 [99], gave the opportunity to ad-
dress the physiological function of Ih at the molecular level. All four isoforms have
been expressed in heterologous cells and form tetrameric, hyperpolarization-activated
cation channels that are directly modulated by cAMP. However, the four HCN isoforms
give rise to channels that differ in their kinetics, steady-state voltage dependence and
potency of modulation by cAMP [115]. Given the diversity of native Ih in different
cell types, a key goal is to relate the cellular heterogeneity to the molecular composi-
tion of the channel. This is complicated by the fact that native pacemaker currents

Introduction 15
exhibit greater diversity, for example with regard to voltage dependence, than the ex-
pressed isoforms [116]. In addition, on the basis of the amino acid sequence, these four
mammalian genes were shown to be members of the voltage-gated channels superfam-
ily [97].
Related HCN genes have been also characterized in invertebrate organisms and
have been cloned from the sea urchin Strongylocentrotus purpuratus sperm (spHCN)
[117], from the silkmoth insect Heliothis virescens antennae (hvHCN) [118], from the
Drosophila melanogaster antennae and eyes (DmHCN) [119] and from the olfactory
receptor neurons of the bee Apis mellifera (AmHCN) [120]. These channels show a
high sequence homology to the vertebrate counterparts in functionally relevant regions
like the membrane spanning domains, in particular the S4-voltage sensor and the pore
region, and the cyclic-nucleotide binding region. The most pronounced differences
between the channel sequences are found in the length of their N-terminal regions [120].
2.2.3 Structure
HCN channels are tetrameric and each monomer comprises three conserved domains
(Fig.2.1). The first is the transmembrane domain, which is formed by six transmem-
brane helices including a positively charged S4 voltage sensor, similar to the voltage
sensor of the depolarization-activated channels; this domain is responsible for the ion
selectivity and the channel gating. It is connected to the C-linker domain in the cyto-
plasm, which in turn is linked to the Cyclic Nucleotide Binding Domain (CNBD). These
three domains are highly conserved with 80-90% sequence identity [100]. However, the
genes products diverge in their N- and C-terminal cytoplasmic regions.
In a seminal article [27], Zagotta and co-workers have determined the X-ray struc-
ture of C-linker and CNBD of HCN2 from mouse in complex with four equivalents
of cAMP. The C-linker is composed by six α-helices (A’–F’), establishing a large
amount of intersubunit contacts and coupling the channel gating transmembrane part
to the CNBD [27, 121]. The CNBD includes four α-helices (A, P, B, C) and an eight-
stranded β-roll, arranged with the same fold observed in the CNBD of other pro-
teins [43, 122, 123, 124, 125, 126, 23, 127, 41]. cAMP binds in its anti -conformation to a

16 Introduction
Figure 2.1: Diagram of an HCN channel subunit. The intramembrane part includes 6 transmem-brane helices and is followed by the C-linker and the CNBD in the intracellular compartment.
highly conserved region lined by the β-roll, P- and C-helices. Its phosphate and OH
groups H-bond to a bunch of residues from position 581 to 593, which includes the
P-helix and the following loop. These residues constitute the signature motif of the
CNBDs, called the phosphate-binding cassette [46]. The purinic group of the ligand
forms contacts with the β-strands 4 and 5 (Val-564, Met-572, and Leu-574) and the
C-helix (Arg-632 and Ile-636) [27].
2.2.4 cAMP Modulation
In all four HCN isoforms, the 120-amino acid length CNBD mediates the channel
response to the intracellular cAMP. This domain is homologous to similar regions in
other cyclic nucleotide binding proteins, including the cAMP- and cGMP-dependent
protein kinases, the bacterial Catabolite Activating Protein (CAP) and the Cyclic
Nucleotide-Gated (CNG) ion channels of olfactory neurons and photoreceptors [46].

Introduction 17
HCN2 is the best characterized member of the family. In this channel, the CNBD
inhibits channel activity by a mechanism which depends on the C-linker/CNBD inter-
actions: binding of cAMP relieves this inhibition and shifts by ∼+17 mV the voltage
dependence to less negative values [103, 104]. In fact, the deletion of the CNBD mim-
ics the effect of cAMP by shifting the voltage dependence of HCN2 gating to more
positive voltages by an amount similar to the maximal shift due to saturating concen-
trations of cAMP [103, 104]. This indicates that cAMP enhances gating by relieving
the inhibitory effect of the CNBD, which shifts the gating in the absence of cAMP to
more negative potentials. Differences in the voltage dependence of gating and in the
potency of cAMP modulation between HCN1 and HCN2 were shown to result from
differences in the extent of inhibition produced by the CNBD, HCN2 having a much
greater inhibition than HCN1 [103,104].
2.2.5 Aims
The structural and dynamic features of the cytoplasmic part of the HCN2 channel in
the ligand bound and free states are investigated by molecular dynamics and elastic
network analysis, to gain insights into the allosteric mechanism of cAMP modulation
of the HCN2 channel.

18 Introduction
2.3 Nerve Growth Factor
2.3.1 Neurotrophins
Neurotrophins constitute a family of structurally related proteins, which promote and
regulate the survival of neurons in the vertebrate nervous system [128, 129, 130]. This
family includes the Nerve Growth Factor (NGF), the Brain-Derived Neurotrophic Fac-
tor (BDNF), the Neurotrophin-3 (NT-3) and the Neurotrophin-4/5 (NT-4/5) [131].
They bind with similar affinity to the receptor p75NTR, a member of the Tumor Necro-
sis Factor (TNF) receptor superfamily, and selectively to the members of the recep-
tor tyrosine kinase (trk) family, namely trkA, trkB and trkC, which are involved in
the activation of different intracellular signal transduction cascades [132,133,134,135].
Specifically, NGF binds with the highest affinity to trkA [136,137,138], which mediates
the survival-promoting and neurite-growth-promoting effects of NGF during develop-
ment [139,140,141,142] (Fig.2.2a).
Figure 2.2: (a) Neurotrophins bind to two classes of receptors: the low affinity receptor p75NTR
and specifically the members of the trk receptors family. (b) Diagram of the receptors subdomains.
2.3.2 Biological context
The Nerve Growth Factor (NGF) is the most studied and the first identified member
of the neurotrophins protein family [139]. NGF was initially found to be an essential
factor in the survival of sympathetic and embryonic sensory nerve cells [143], but its
Introduction 19
frame of activity was soon extended to many other functions. It is now very well
established that NGF plays a central role in the development, survival and repair of
peripheral and central nervous tissues of both embryos and adults [144]. In addition,
it has been endowed with roles in the immune and endocrine systems, autoimmune
disease and tissue inflammation [145].
The role of NGF in vivo has been defined to be trophic, differentiative and tropic
[146]: NGF exploits its trophic effect on sensory and sympathetic cells being necessary
for their survival; its differentiative effect is due to its role in the differentiation of the
same cells to mature nerve cells; finally, the tropic effect of NGF consists in its ability
to guide the growing axons or collaterals along its own concentration gradient.
An important feature of NGF is the retrograde transport: this neurotrophin, in fact,
was shown to be retrogradely transported within neurons in vivo, under physiological
conditions, allowing the communication of the body cell with the nerve terminal [147,
148]. The retrograde transport is a composite mechanism, involving a series of complex
events, like the release of the neurotrophin by the post-synaptic target cell, followed
by receptor binding on the nerve terminal pre-synaptic membrane. Subsequently, the
protein is internalized, targeted for transport and propelled along the axon toward the
cell body [148].
2.3.3 Structure
NGF is a dimeric protein and the dimer is held together by non-covalent interactions
[149]. Its 3D structure has been determined by X-ray crystallography, revealing a
compact β-structure protein [150, 28]. Three intrachain disulfide bridges form the so
called cysteine knot motif. The central core of the protein, formed by the facing β-
strands of the two monomers, gives rise to an extensive subunit interface with a largely
hydrophobic character, primarily because of aromatic residues. Three β-hairpin loops
in the structure of each monomer are composed by most part of the variable residues
in different species, while the compact core is conserved.

20 Introduction
2.3.4 The NGF receptors
The response of neurons to NGF is governed by two types of cell surface receptors: the
receptor tyrosine kinase p140trk, which is referred to as trkA [151], and p75NTR, which
is a member of the Tumor Necrosis Factor (TNF) receptor superfamily (Fig.2.2a).
TrkA activation is predominantly followed by survival signaling. On the contrary, the
p75NTR receptor, as other members of the TNF superfamily, was demonstrated to
modulate apoptotic responses.
The dimerization of the trk receptors upon binding to neurotrophin leads to trans-
autophosphorylation and to the activation of intracellular signaling cascades [152].
Signaling modules, such as the RAS/mitogen-activated protein (MAP) kinase cas-
cade and the phosphatidylinositol-3 (PI-3)-kinase/Akt pathway, have been identified
as downstream cellular events induced by trkA activation. When p75NTR and trkA are
expressed in the same cell, however, survival signaling dominates [151].
Historically, p75NTR was the first receptor of NGF to be identified [153], but a
lack of readily identifiable signal transduction modules within its cytoplasmic sequence
led to the assumption that the function of p75NTR was primarily to augment trkA
signaling [154,151]. Actually, pro-NGF, which is released as a soluble proneurotrophin
and is processed to a mature neurotrophin, is a high affinity proapoptotic ligand for
p75NTR [155]. The activation of p75NTR can initiate apoptosis when this receptor is
expressed independently of trk. Thus, p75NTR plays diametrically opposite roles in
promoting death and augmenting survival [156,151].
2.3.5 NGF / trkA interaction
The extracellular subdomains of trkA are Cys-rich 1 (d1), Leu-rich motif (d2), Cys-
rich 2 (d3), IgGL1 (d4) and IgGL2 (d5), where IgGL refers to the immunoglobulin-like
C2 folding motif [148] (Fig.2.2b).
The structural determinants of NGF binding to the fifth extracellular domain of
human trkA (trkA-d5) have been provided by the X-ray structure of the complex [28]
(Fig.2.2b). This study confirmed an extended surface of interaction of this domain with
NGF. The NGF/trkA-d5 interface involves two patches: one comprises residues of NGF

Introduction 21
core region and loops of the C-term@trkA-d5, the other includes the N-term@NGF
and the ’ABED’ β-sheet@trkA-d5 [157, 28]. The latter is known to determine the
affinity and specificity of the NGF binding to trkA, as indicated by experimental data
[158, 159, 160, 161, 162, 163, 164, 141] and further suggested by Molecular Dynamics
calculations [165]. Although only the fifth extracellular domain (d5) is present in the
structure, the contribution of the other subdomains to the binding cannot be excluded.
The structure of the mouse NGF alone [166] and that of the human NGF in com-
plex with trkA-d5 [28] display few differences. Apart from unconserved residues, the
most striking difference is at the N-terminus. While this segment is disordered in the
unbound structures [162, 166], it assumes a helical conformation in the NGF/trkA-d5
complex, forming an important part of the binding interface [28].
2.3.6 Therapeutic applications
Because of their crucial role for nervous system development, neurotrophins may re-
duce neuronal degeneration in neurodegenerative diseases, such as Alzheimer’s [167,
168, 169, 170, 171, 172, 173, 174]. However, the therapeutic efficiency of NGF has been
greatly limited by delivery problems and severe side effects [175, 176, 177]. A ma-
jor obstacle to the neurotrophin-based therapies is that significant protein concentra-
tions must be achieved in the target region to really counteract disease progression
and, simultaneously, this delivery must be hampered in other regions to prevent side-
effects [175,176,177].
A promising strategy involves the use of peptide mimics, i.e. molecules with either
agonist or competitive antagonist effect that retain the most essential elements of the
neurotrophic action, which may be useful in the treatment of several neurodegenerative
diseases and nerve injuries [178,179,180,181]. For NGF, such peptides have been shown
to exhibit neurotrophic effects by binding to trkA [182,183,184,185,186,187,188].
2.3.7 Aims
To identify peptide mimics of the neurotrophin NGF with high affinity and specificity
for trkA, several computational tools are first used to identify the residues of the N-

22 Introduction
terminal fragment of NGF forming significant interactions with the receptor in the
NGF/trkA-d5 complex; subsequently, the stability of the adduct is investigated by
molecular simulations approaches.

Chapter 3
Methods
We introduce here basic concepts of the techniques used in this thesis, namely molecular
dynamics simulations [8], elastic network analysis [9], electrostatics calculations [189]
and hot spot binding energy prediction [190, 191]. The specific features of each of the
studied systems are reported in the Computational Details section of the corresponding
chapters.
3.1 Molecular dynamics
The dynamics of proteins cannot be simulated quantum-mechanically due to their large
size. We can predict the evolution of such complex systems using Molecular Dynamics
(MD) simulations [8]. MD is based on the following assumptions: (i) the nuclei can be
treated as classical particles; (ii) the Born-Oppenheimer approximation holds; (iii) the
electronic degrees of freedom can be integrated out. Under these greatly simplifying
assumptions, the dynamics of the system can be described by the Newton second law:
mid2~ri
dt2= −∇~ri
Etot(~r1, ..., ~rN)
where ~ri is the position of the ith atom and Etot is the total energy of the system of
N particles. Thus, if one knows the initial structure (by experiments or by computer
modeling) and provides a velocity distribution consistent with the temperature simu-
lated, one can provides the time-evolution of the system. MD average values of several
properties can be evaluated from the resulting trajectory.

24 Methods
In the followings, the form of Etot used for proteins and some details of MD algo-
rithms are given.
3.1.1 Force Field
The potential energy function here used (Etot, also called force field) consists of additive
parameterized two-bodies terms that can be obtained by fitting experimental and/or
high-level quantum chemical data into simple functional forms. The AMBER [192,193]
and the TIP3P [194] force fields for the proteins and water respectively are used.
For large biological systems, the potential function frequently used takes the form
of the summation of different additive terms that correspond to bond distances Ebonds,
bond angles Eangles, bond dihedral Edihedrals, van der Waals Evdw and electrostatic Eelec
interactions (Fig.3.1).
Etot = Ebonds + Eangles + Edihedrals + Evdw + Eelec
Etot =∑bonds
1
2kr(r − req)
2 +
+∑
angles
1
2kθ(θ − θeq)
2 +
+∑
dihedrals
1
2Vn(1 + cos(nϕ− γ)) +
+atoms∑i<j
Aij
r12ij
− Bij
r6ij
+
+atoms∑i<j
qiqj
4πε0rij
Bond stretching and angle bending are represented as harmonic energy terms where
req and θeq refer to equilibrium bond lengths and angles, kr and kθ are the vibrational
constants. The equilibrium values of the bond and angle parameters are usually de-
rived from structural databases, while the force constants are derived from infrared
spectroscopy. In the third term, Vn is the torsional barrier corresponding to the nth
barrier of a given torsional angle with phase γ: dihedral parameters are calibrated

Methods 25
Figure 3.1: The potential energy of the system is expressed as a sum of pairwise additive terms:bond lengths, bond angles, torsional penalties, van der Waals and electrostatic interactions.

26 Methods
on small model compounds, comparing the energies with those obtained by quantum
chemical calculations. Improper dihedral angles are added to take into account quan-
tum effects that are not present in Etot as, for example, to preserve planarity in aromatic
rings. The last two terms refer to non-bonded van der Waals and electrostatic inter-
actions: the first are described by a Lennard-Jones potential, containing an attractive
and a repulsive term, and parameters are defined so as to reproduce chemical-physical
properties (e.g., densities, enthalpies of vaporization, solvation free-energies) in or-
ganic liquids. The electrostatic energy is evaluated by assuming the dielectric constant
ε equal to 1, and using the restrained electrostatic potential model (RESP [195, 196])
to define partial atomic point charges: in this model, charges are assigned to the atom-
centered points so as to fit the electrostatic potential derived from quantum chemistry
calculations for a set of small representative molecules. Van der Waals and electrostatic
interactions are calculated between atoms belonging to different molecules or for atoms
in the same molecule separated by at least three bonds.
3.1.2 Integration of the equation of motion
The GROMACS program [197] is here used to integrate the equations of motion. Dur-
ing the MD simulations, the system evolves according to the classical Newton equation
of motion:
d2~ri(t)
dt2=
~Fi(t)
mi
where ~Fi(t) = −dEtot(t)
d~ri
Computing the classical trajectory exactly would require to solve a system of 3N
second order differential equations, where N is the number of atoms. Actually, these
equations are never solved exactly but approximated by a suitable algorithm. For
instance, in the popular Verlet algorithm, the positions of each atom are expressed by
Taylor expansions whose combination yields an expression for ~ri(t + ∆t). The lack of
explicit velocities in the Verlet algorithm is remedied by the leap-frog algorithm [198].
Positions at times t + ∆t and t are given by the Taylor expansions around t + ∆t/2
below:

Methods 27
~ri(t + ∆t) = ~ri(t + ∆t/2) + ~vi(t + ∆t/2)∆t
2+
1
2~ai(t + ∆t/2)
∆t2
4+ ...
~ri(t) = ~ri(t + ∆t/2)− ~vi(t + ∆t/2)∆t
2+
1
2~ai(t + ∆t/2)
∆t2
4+ ...
whose difference gives:
~ri(t + ∆t) = ~ri(t) + ~vi(t + ∆t/2)∆t
Analogously, an expression for the velocities at half time step is obtained from the
expansions around t:
~vi(t + ∆t/2) = ~vi(t) + ~ai(t)∆t
2+ ...
~vi(t−∆t/2) = ~vi(t)− ~ai(t)∆t
2+ ...
whose difference gives:
~vi(t + ∆t/2) = ~vi(t−∆t/2) + ~ai(t)∆t
The leap-frog algorithm [198] updates both positions and velocities using the forces
~Fi(t) determined by the positions at time t:
~vi(t + ∆t/2) = ~vi(t−∆t/2) +~Fi(t)
mi
∆t
~ri(t + ∆t) = ~ri(t) + ~vi(t + ∆t/2)∆t
First, the velocities are calculated at half time step, then these are used to calculate
the positions at one time step. In this way, positions and velocities leap each other.

28 Methods
The advantage of this algorithm is that velocities are explicitly calculated, and the
disadvantage is that they are not calculated at the same time as the positions. As
a consequence, kinetic and potential energy cannot directly compute the total energy
at time t, but energy evaluation is possible using the following approximate value of
velocities at time t:
~vi(t) =~vi(t−∆t/2) + ~vi(t + ∆t/2)
2
3.1.3 Constraint algorithm
The time-step ∆t in the integration of the equations of motion is limited by the highest
frequency oscillations. These are the bond stretching vibrations, in particular those
involving hydrogen atoms, having the highest frequency and a relatively low amplitude.
Since these motions are of little interest in most cases, constraining these bond lengths
allows to increase ∆t with small affects on the accuracy of the simulation, under the
assumption that bonds are almost exclusively in their vibrational ground state. Since
bonds in molecules are coupled, resetting coupled constraints after an unconstrained
update is a nonlinear problem.
The LINCS algorithm satisfies a set of holonomic constraints by an efficient paral-
lelizable matricial representation of the equations [199].
3.1.4 Periodic boundary conditions
MD simulations are usually performed under periodic boundary conditions, to minimize
boundary effects and to mimic the presence of the bulk. In this approach, the system
containing the N atoms is replicated in all directions to yield an infinite periodic lattice
of identical cells (Fig.3.2). When a particle moves in the central cell, its periodic image
in every other cell moves accordingly. As one molecule leaves the central cell, its image
enters from the opposite side without any kind of interactions with the cell boundary.
Following the so called minimum image convention, only the nearest image of each
particle is considered when calculating non-bonded interactions. This implies that

Methods 29
the cutoff radius used to truncate non-bonded interactions must not exceed half the
shortest box vector, otherwise more than one image would be within the cutoff distance
of the force.
cutoff <min(a, b, c)
2
Figure 3.2: Periodic boundary conditions: the MD system is surrounded by translated copies ofitself.
3.1.5 Long-range interactions
In a many-particle computational system, interactions may be divided in two groups:
bounded (bonds, angles and dihedral) and non-bonded (vdW and electrostatics). While
the bonded interactions are intrinsically short-range, non-bonded terms extend to the
infinity (long-range interactions). Nevertheless, the vdW interactions can be treated
only as short-range interactions, because their energy function decays rapidly; in fact,
although these potential functions are not rigorously zero at any distance, the cutoff
truncation will result in a negligible systematic error. For Coulombic interactions,
on the contrary, the cutoff truncation introduces energetic discontinuities which cause
instabilities of the simulation, as the electrostatic potential function goes slowly to zero.
This problem has been faced with the use of smoothing functions or the twin-range
cutoff method. More rigorously, interactions with all periodic images must be explicitly

30 Methods
considered: the Ewald summation method [200] is used in classical MD to face this
computational task.
The total electrostatic energy of N particles and the periodic images is given by
V =1
8πε0
∗∑~n
N∑i=1
N∑j=1
qiqj
|~rij,~n|
where ~n is the box index vector and the star indicates that terms with i = j should
be omitted when |~n| = 0. This sum is conditionally convergent.
Ewald summation is a technique for computing the interaction of a set of charges
and all its periodic images. The charge distribution in the system is a set of point
charges, represented as delta functions:
ρ(~r) = Σiqiδ(~r − ~ri)
In the Ewald method, each qi charge of the distribution ρ(~r) is screened by a diffuse
charge distribution ρGi (~r) of the opposite sign, such that the total charge of this cloud
exactly cancels qi.
ρGi (~r) = −qi(α/
√π)3e−α2|~r−~ri|2
ρG(~r) =∑
i
ρGi (~r)
Each point charge qi is now surrounded by an isotropic Gaussian charge distribution
ρGi (~r) of equal magnitude and opposite sign, which screens the interaction between the
point charges, so that the interaction calculated using the screened charge distribution
ρ(~r) + ρG(~r) becomes short-ranged. The interaction energy reads:
E[ρ(~r)+ρG(~r)] =1
8πε0
∗∑~n
N∑i=1
N∑j=1
qiqj
|~rij,~n|f er(α|~rij,~n|)

Methods 31
where
f er(x) = 2π1/2
∫ ∞
x
e−y2
dy
To restore the initial system, an anti-screening Gaussian charge distribution−ρG(~r),
centered at the position of each atom i with the same charge of qi, is added. The
potential energy of this Gaussian charge distribution is calculated by a converging
Fourier series in the reciprocal space [200].
The parameter α is tuned in order to optimize convergence properties of both
summations. In particular, in the particle mesh Ewald method [201, 202, 203], α is
chosen sufficiently large so that interactions between atom pairs for which |~rij,~n| exceeds
a specified cutoff are negligible in the direct space sum and the reciprocal space sum
is approximated by an interpolation of the potential on a grid.
3.1.6 Thermostats
Among the several methods to control the temperature usually available in MD software
packages, the weak coupling method (Berendsen thermostat [204]) and the coupling to
an external bath algorithm (Nose Hoover thermostat [205,206]) are used here.
In the weak coupling method [204], the temperature of the system T (t) is kept close
to the target temperature T0 by the equation:
dT (t)
dt=
T0 − T (t)
τT
where T (t) is the instantaneous temperature, T0 is the reference temperature and
τ is the coupling time constant. The instantaneous temperature T (t) of a system with
Ndf degrees of freedom is related to the kinetic energy Ekin(t):
Ekin(t) =N∑
k=1
1
2mkv
2k(t) =
1
2NdfkBT (t)

32 Methods
The atomic velocities can then be scaled by a factor λ(t) as follows:
δEkin(t) = [λ(t)2 − 1]1
2NdfkBT (t)
Since:
δEkin(t) = NdfcV δT (t)
then:
λ(t) = 2
√1 +
2cV dt
kBτT
T0 − T (t)
T (t)
where cV is the heat capacity per degree of freedom. The factor λ(t) is used to scale
the velocities vk at each integration step dt, in order to relax the temperature toward
the target temperature value T0. The relaxation rate is controlled by the time coupling
constant τT , which should be small enough to achieve the required temperature and
large enough to avoid disturbance of the physical properties of the system by coupling
to the bath.
Even though the Berendsen weak coupling algorithm is efficient for relaxing the sys-
tem to the target temperature, it does not allow for a proper sampling of the canonical
ensemble. Canonical ensemble simulation is enabled by employing the Nose-Hoover
thermostat.
In the Nose-Hoover approach [205,206], the ensemble is extended by introducing a
thermal reservoir and a friction term in the equations of motion.
d2~ri
dt2=
~Fi
mi
− ξ(t)d~ri
dt
The friction force is proportional to the product of each particle’s velocity and a
friction parameter ξ(t). This friction parameter is a fully dynamic quantity with its
own equation of motion.

Methods 33
dξ(t)
dt=
T (t)− T0
Q
The time derivative is calculated from the difference between the current tempera-
ture T (t) and the reference temperature T0, and Q determines the strength of coupling
to the heat bath.
3.1.7 Barostats
To closer resemble biological systems, the pressure can be controlled by applying a
pressure coupling algorithm, as the Berendsen [204] and the Parrinello-Rahman meth-
ods [207].
The Berendsen algorithm scales the coordinates and the box vectors: the effect is
a first-order kinetic relaxation of the instantaneous pressure P(t) toward the reference
pressure P0, with a time constant τP that can be specified as an input parameter.
Similarly to the temperature weak coupling algorithm:
dP(t)
dt=
P0 −P(t)
τP
and the scaling factor µ(t) for atoms positions is:
µαβ = δαβ − βαβ∆t
3τP
[P0,αβ − Pαβ(t)]
where β is the isothermal compressibility, P(t) is the instantaneous pressure, P0 is
the target pressure and τP is the pressure coupling time constant.
In the Parrinello-Rahman algorithm, similarly to the Nose-Hoover temperature cou-
pling, the equations of motion are modified:
d2~ri
dt2=
~Fi
mi
−M(t)d~ri
dt

34 Methods
The coupling matrix M(t) is determined by providing the reference pressure P0, the
isothermal compressibility β and the pressure time constant τP as input parameters,
in the following way:
M(t) = b−1
[b
db′
dt+
db
dtb′
]b′−1
and:
db2
dt2= V W−1b′−1
(P−P0)
where V is the box volume and W is a matrix parameter that determines the
strength of the coupling:
(W−1)αβ =4π2βαβ
3τ 2p L
where L is the largest box matrix element.
3.1.8 Generalized Born model
The Generalized Born (GB) model is an implicit solvent model that can be used to
run significantly faster MD simulations than those which make use of explicit solvent
[208, 209]. However, due to the crucial role of the solvent, the GB approach usually
provides only qualitative insights.
In the GB model, the apolar contribution to the protein-solvent interaction is esti-
mated as linearly dependent on the solvent accessible surface area of the protein; the
polar term, which takes into account also salt effects, reads:
∆GGBpol = −1
2
∑i,j
qiqj
fGB(rij, αi, αj)(1− e−κfGB(rij ,αi,αj)
εw
)

Methods 35
where κ is the Debye-Huckel screening parameter; αi is the effective Born radius
of atom i, which reflects the degree of its burial inside the molecule; fGB is a function
that interpolates between the effective Born radius α when rij → 0 and an effective
pairwise interaction distance [209,210]:
fGB =√
r2ij + αiαj exp(−r2
ij/4αiαj)
3.1.9 Steered molecular dynamics
Many biological processes are characterized by high energy barriers and occur in time-
scales that are not feasible by current computational techniques. Nevertheless, their
study by means of MD simulations would provide valuable information. To overcome
the energy barriers and thus to speed up the simulations, an external force is applied
to a selected group of atoms to steer the system along a particular degree of freedom.
This allows to focus the simulation on a particular dynamic event, reducing the amount
of computational expense [211,212,213,214,215,216,217,218,219].
Steered Molecular Dynamics (SMD) is here applied to investigate the unbinding of
ligand/receptor complexes: the ligand is harmonically restrained to a point that moves
away from the receptor mass center with constant velocity ~vr . The force ~F r applied to
the ligand is:
~F r = kr · ( ~xr0 + ~vrt− ~xl
cm)
where kr is the restraint force constant, ~xr0 is the initial position of the restraint
point and ~xlcm is the position of the ligand mass center. It should be stressed that, in
general, only qualitative information about binding paths and intermediate states can
be obtained.

36 Methods
3.1.10 Analysis of MD trajectories
The general flowchart of an MD run is:
1. reading the initial conditions, i.e. the positions and velocities of the atoms;
2. reading the parameters of the simulation (temperature and pressure, control al-
gorithms, time step, special features);
3. computing the total force that acts on each atom;
4. updating the coordinates and the velocities of the atoms by the integration of
the Newton equation of motion;
5. back to point 3.
Data from MD trajectories can be used to calculate several structural and dynamic
properties.
Displacement
The conformational stability of a macromolecule can be estimated by the Root Mean
Square Displacement (RMSD). The RMSD of a set of N atoms at time t, with respect
to the initial conformation, reads:
RMSD(t) =
√∑Ni=0 |~ri(t)− ~r0
i|2N
where |~ri(t) − ~r0i| is the displacement of the ith atom at time t from the reference
position ~r0i. An increase of the RMSD indicates that the protein moves to a confor-
mation different from the initial structure and thus suggests an incomplete sampling
or a conformational change.
Fluctuation
The Root Mean Square Fluctuation (RMSF) is computed for each atom i:

Methods 37
RMSFi =√〈(~ri − 〈~ri〉)2〉
where ~ri is the position vector of the ith atom and the brackets stand for a temporal
average. This quantity can be compared to crystallographic B-factor Bi through the
relation:
Bi = 8π2RMSF2i /3
The RMSF analysis provides information about the atomic fluctuations throughout
the simulation and thus indicates the most flexible regions of the protein.
Contact surface
The Contact Surface (CS) between two groups of atoms is estimated as the difference
between the Solvent Accessible Surface Areas (SASA) of the two groups separated
and in the complex, assuming no conformational change. SASA is calculated using
the center-probe area definition [220] and 0.14 nm solvent probe radius [221, 222]. CS
provides a rough estimate of the non-polar contribution to the binding free energy [223].
Large-scale collective motions
The description of the protein dynamics in terms of collective motions is particularly
useful to dissect from an MD trajectory the structural low frequency vibrations, which
are often relevant for the protein function. To identify the concerted large-scale struc-
tural fluctuations occurring in a protein, the degree of correlation of pairs of residues
is calculated in the covariance matrix C, whose elements are:
Cij = 〈(~ri − 〈~ri〉) · (~rj − 〈~rj〉)〉
where ~ri is the ith atom position and the brackets indicate temporal average.

38 Methods
Large-scale motions can be calculated as eigenvectors of the Cα atoms covariance
matrix. The symmetric matrix can be diagonalized by an orthonormal coordinate
transformation R which transforms C into a diagonal matrix Λ of 3N eigenvalues λi:
RT CR = Λ
The columns of R are the eigenvectors or Essential Modes (EM) and the eigenvalues
λi are the variance in the direction of the corresponding EM. The covariance analysis
defines a new coordinate system for the data set, in which the new coordinates are
uncorrelated [224,225,226,227,228]. The six roto-translational degrees of freedom can
be eliminated by performing a RMSD fit between each MD snapshot and the initial
configuration before calculating C.
Eigenvectors are ordered with decreasing eigenvalues, which are proportional to the
percentage of total fluctuation the corresponding EM describes (λi/Tr Λ). Usually, it
turns out that most of the total motion is spanned over the first few eigenvectors. The
amount of motion covered by a subset of EMs is the summation of the corresponding
eigenvalues λi divided by the trace of Λ.
The principal component of a EM is the projection of the trajectory on the eigenvec-
tor. It has been proven that the principal components of random diffusion are cosines
with the number of periods equal to half the principal component index [227]. The
cosine content analysis is used to check whether the EMs obtained from the diagonal-
ization of the covariance matrix C resemble those of random diffusion.

Methods 39
3.2 Elastic network analysis
The capabilities of actual computer power allows, within a reasonable cost, to follow
the dynamic evolution of few hundred residues large proteins for tens of nanoseconds.
The large-scale dynamic features encountered in MD trajectories can be interpreted as
a superposition of independent harmonic modes that can be achieved by simply substi-
tuting detailed force-field interactions by harmonic couplings, provided that the protein
fluctuates around the initial conformation and that the protein does not undergo large
conformational changes toward a more stable structure [229].
In the coarse-grain Gaussian network model the protein is described at the residue
level and the interaction between couples of residues is described by simple harmonic
terms [230, 229, 231] (Fig.3.3). Here, the so-called β-Gaussian model is used: in this
model, centroids tethered to the Cβ atoms are introduced to mimic the side-chains.
This allows a better modeling of the directionality of pairwise interactions in the protein
and leads to an improved vibrational description [9]. The Etot of a protein is described
as an expansion in terms of deviations of the amino acids from their reference positions.
All couples of residues within a given cutoff value interact and, to account for the higher
strength of the peptide bonds with respect to non-covalent interactions between amino
acids, an explicit chain term has been added. By construction, the global minimum of
Etot coincides with the native state.
Figure 3.3: The protein structure is modeled as an elastic network in which pairs of Cα and Cβ
atoms are connected by springs

40 Methods
The elastic response of the system is uniquely dictated by the eigenvalues and
eigenvectors of the covariance matrix. The main observable quantity that can be cal-
culated within the Gaussian model is the correlation between displacements of pairs of
Cα’s atoms. The eigenvectors of the covariance matrix represent the three-dimensional
independent modes of structural distortion for the protein.

Methods 41
3.3 Electrostatic calculations
Insights into the electrostatic interactions in proteins can be obtained with the Poisson-
Boltzmann equation [189]. In this approach, the solvent is represented as continuum
and the electrostatic potential Ψ(r) can be determined by solving the following equa-
tion:
~∇ ·(ε(~r)~∇Ψ(~r)
)= −4πρf (~r)− 4π
∑i
c∞i ziq exp
(−ziqΨ(~r)
kBT
)λ(~r)
where ρf (~r) is the fixed charge distribution of the molecule, ε(~r) is the position
dependent dielectric constant, c∞i is the concentration of ion i at an infinite distance
from the molecule, zi is its valency, q is the proton charge, kB is the Boltzmann constant,
T is the temperature and λ(~r) describes the accessibility to ions at point ~r.
An analytical solution of the equation can be obtained only for very simple geome-
tries and charge distributions. For proteins, the equation can be solved numerically by
the finite difference methods on a grid. As a first step, the molecular surface is gener-
ated using a spherical probe of 1.4 A, which is the water radius. A grid is generated
and, according to the surface, a high dielectric constant value is then assigned to the
grid points that lie on the external side of the macromolecule, which are supposed to
belong to the solvent, and a low dielectric constant value is assigned to the remaining
grid points. Each atom charge is split to the nearest grid points of the mesh and a
smoothing algorithms is used to improve the results. The electrostatic potential is
finally numerically estimated for each grid point and the energy of the charged grid is
calculated. Since every atom charge is split to different grid points, different parts of
the charge of the same atom interact each other. The self-grid energy is removed in
the difference between energies obtained for the same protein conformation with the
same grid in different conditions.
Here, the Poisson-Boltzmann equation is numerically solved using the APBS pro-
gram [232].

42 Methods
3.4 Hot spot binding energy prediction
Residues at the protein/protein interface that contribute significantly to the complex
stability and whose mutation can affect the interaction are defined as hot spots binding
energy. With the Baker et al.’s computational alanine scanning procedure [190, 191]
we estimate the residues at the protein/peptide interface which form interactions im-
portant for the complex stability. To this aim, the predictor calculates the residues at
the interface which significantly destabilize the complex when mutated to alanine, esti-
mating both the van der Waals and the electrostatic contributions to the free energy of
binding, based on an all-atom rotamer description of the side chains together with an
energy function dominated by Lennard-Jones interactions, solvation effects and hydro-
gen bonding [190, 191]. Binding energy hot spots are here defined for residues whose
∆∆GhsB ≥ 2kT .

Chapter 4
Catabolite Activator Protein
The Catabolite Activator Protein (CAP, also called cAMP-Receptor-Protein) is a bac-
terial DNA-binding protein involved in the activation of the transcription of several
operons [30,37,33]. Cyclic Adenosine MonoPhosphate (cAMP) binding to CAP causes
a cascade of structural rearrangements that allows for selective binding to DNA (con-
sensus sequence is 5’-AAATGTGATCT-3’) [59, 31, 32]. This in turn induces DNA
bending [43, 60, 61, 63, 64] and a rearrangement of CAP [69, 70], which is followed by
the binding of the RNA polymerase enzyme [66,67,68].
The X-ray structures of DNA-bound and DNA-free states of CAP have provided
key insights on the molecular basis of DNA binding [41,43,44,23]. These studies show
that CAP is a homodimer whose subunits (namely “A” and “B”, Fig.1) are formed by
two domains. The first is the conserved signaling module N-terminal Cyclic Nucleotide
Binding Domain (CNBD, residues 1-137) [46], which includes an eight-stranded β-roll
flanked by an α-helix (A-helix) at its N-term, and by two helices (B and C helices) at
its C-term. A hinge region, which is close to the homodimeric symmetry axis (residues
133-142), connects the CNBD to the C-terminal DNA-Binding Domain (DBD, residues
138-209). The latter includes a helix-turn-helix motif that binds to DNA, inducing a
final bent of ∼90◦ [43]. Two cAMP binding sites for each subunit are present. The
primary binding site, which has a µM affinity for cAMP [35, 40], is located in the
CNBD, within the β-roll, and it is lined by the C-helices of both subunits: binding of
cAMP (in its anti conformation) triggers a reorientation of the β4/β5 loops and of the
C-helices, which leads to an allosteric change of the hinges that repositions the DBDs

44 Catabolite Activator Protein
and results in DNA binding [49, 50, 51, 52, 53, 54, 55, 23, 45, 56, 57, 46, 58]. Selectivity
toward the target DNA sequence is achieved by cAMP binding to the primary sites
[35]. The secondary binding site, with mM affinity for cAMP that binds in its syn
conformation, is formed by residues from both domains of the same subunit and from
the hinge region of the opposite subunit [44]. DNA binding to CAP depends on cAMP
concentration [38,39,35,40].
In the crystal phase, the structures of the subunits have been found to depend
on the state of the protein. In the DNA-bound state, the DBDs are symmetrically
arranged and are both packed against their CNBDs (closed conformation for both
subunits, Fig.4.1) [41, 43, 44]. In the DNA-free X-ray structure, one subunit is in the
closed conformation, whilst the other is separated from its corresponding CNBD by
a cleft (open conformation, Fig.4.1) [23]. It is well known that crystal packing forces
may induce structural modifications in proteins [233, 234]: therefore, the structure of
such subunits in aqueous solution might differ significantly from that in the crystal. As
shown in Fig.4.1, in the X-ray structure several DBD residues exhibit close contacts
with other proteins. Therefore the crystal packing could be responsible for possible
deviations from the biologically relevant protein conformation. Here we address this
issue by undertaking a comparative MD study of the protein in the crystal phase and
in aqueous solution.
Our MD calculations of the crystal turn out to reproduce the structure of the
protein experimentally observed (in particular the closed-open conformation, Fig.4.1),
suggesting that our computational setup provides a relatively accurate description of
the system. In addition, the ligand bound protein in solution assumes an open-open
symmetric conformation (Fig.4.1). Such conformation could play a key role for DNA
molecular recognition.
4.1 Computational Details
The following models are constructed: (i) CAPcryst is the X-ray structure from Es-
cherichia coli solved at a resolution of 2.10 A (pdb entry code 1G6N [23], Fig.4.1);
(ii) CAPaq is based on the same X-ray structure [23], although one asymmetric unit

Catabolite Activator Protein 45
is considered (Fig.4.1); (iii) CAP∗aq is the protein in aqueous solution obtained by re-
moving the DNA from the X-ray structure of the CAP-DNA complex from Escherichia
coli solved at a resolution of 2.80 A (pdb entry code 1O3T [44], Fig.4.1 and Fig.4.3).
In all systems, cAMP is bound to both CNBDs, acid and basic residues are assumed to
be ionized at the physiological conditions; hydrogens are added by assuming standard
bond lengths and angles. Sodium ions are added to achieve neutrality (Tab.4.1).
Solvation. CAPaq and CAP∗aq are solvated by adding a water model with
1.0 Kg/l density into the parallelepiped simulation boxes that contain the different
solutes. Solvent molecules are rejected if the distance between any solvent atom and
the closest solute atom is lower than the sum of their respective van der Waals radii.
This procedure generates around the solute small voids that are filled after a short sol-
vent simulation (i.e. 60 ps of MD using the Berendsen thermostat and barostat [204]
with T=300 K, P=1 atm and 1 ps time constants) with a reduction of the MD box vol-
ume. The protein in the crystal lattice solvated using the procedure described above
shows several cavities which could be filled by water. Test MD calculation on such
system results in a small shrinking of the cell lattice, although the protein structure is
maintained (see Supplementary Information). Thus, a different solvation procedure is
used for CAPcryst. We define a grid of v0.29 nm size spanning the entire unit cell and
water oxygens are placed at any grid point if the corresponding grid cell is empty, i.e.
if no solute atom is found in the given cell. The solvent equilibration dynamics (60 ps)
is sufficient to restore the normal water structure as confirmed by a comparison with
the crystal solvated with the standard procedure outlined above (Data not shown).
Complex based x y z n◦ of n◦ of n◦ of n◦ ofname on (nm) (nm) (nm) a.a. cAMP waters Na+
CAPaq 1G6N [23] 7.40 9.15 8.52 401 2 16,954 2CAP*aq 1O3T [44] 8.99 7.05 9.09 396 2 16,995 0CAPcryst 1G6N [23] 4.68 (=) 9.55 (-0.01) 10.54 (-0.01) 1604 8 8000 8
Table 4.1: Selected features from our MD calculations. The table shows the pdb entrycodes of the initial, X-ray structures, the mean dimensions of the MD unit cell after equilibration andthe number of amino acids, cAMP molecules, water molecules and sodium ions, which are added toneutralize the box. In CAPcryst, the differences between theoretical and experimental values of thecell parameters are reported in brackets.

46 Catabolite Activator Protein
Figure 4.1: Structures of CAP. The asymmetric unit of the DNA-bound CAP x-ray structure(CAP·DNA) [44], the unit cell of the DNA-free CAP in the crystal lattice (CAPcryst) [23] and CAPin aqueous solution (CAPaq) in the initial and in the final MD conformations are reported as ribbons.Water molecules are not shown for clarity. The CNBD and the DBD of subunit “A” are colored inblue and red, respectively, while the same domains of subunit “B” are colored in cyan and orange,respectively; the cAMP molecules are drawn in sticks and colored by the atom type; DNA (sequence5’-GCGAAAAATGCGATCTAGATCGCATTTTTCG-3’) is represented as gray double strand. InCAPcryst, one asymmetric unit, which is rotated with respect to the other panels, is colored asabove and the yellow spheres indicate the residues forming crystal packing contacts (interresiduedistance between non-hydrogen atoms smaller than 0.35 nm); the remaining three proteins are shownin different colors; the directions of the three cell vectors are also reported. Figures obtained with theVMD program [235].

Catabolite Activator Protein 47
Molecular dynamics. We use the AMBER94 force field [192, 193] for protein,
DNA and ions and the TIP3P force field [194] for water. The force field for cAMP
is developed in ref. [236] and is proven to reliably reproduce the molecule interactions
within several cAMP binding proteins [236,47,48].
Rectangular periodic boundary conditions are applied. The particle mesh Ewald
method is used to evaluate long range electrostatics [202,203,201]. A cutoff of 1 nm is
used for the real part of the electrostatic and for the van der Waals interactions. The
minimum distances between the periodic images of the complexes in solution turn out
to be always greater than the short range interactions cutoff. Constraints are applied
to all chemical bonds using the LINCS algorithm [199]. The integration time step is
set to 1.5 fs.
After an energy minimization and 60 ps of solvent simulation, using the Berendsen
thermostat and barostat [204] (T=300 K and P=1 atm), Molecular Dynamics (MD)
simulations are performed in the NPT ensemble, using the Nose-Hoover thermostat
[206, 237] and the Parrinello-Rahman procedure [207, 205] (T=300 K and P=1 atm);
the pressure coupling is isotropic. CAPaq, CAP∗aq and CAPcryst are simulated for 40,
15 and 15 ns of MD, respectively. The calculations are performed using the GROMACS
program [238,197].
Snapshots collected every 15 ps are analyzed to obtain the following properties:
(i) Root Mean Square Deviations (RMSD) of the Cα atoms are calculated after least
square fit to the respective X-ray structure [23, 44], if not otherwise specified; (ii)
Essential Mode (EM) analysis of the Cα atoms is used to identify large collective
motions [226,239,225,227,228].
Electrostatics. The Poisson-Boltzmann equation [189, 240] is used to calculate
the electrostatic potential on and outside the protein surface, using the APBS program
[232]: a 2 runs focusing procedure is applied with 0.06 nm final grid spacing; 100 mM
monovalent ionic concentration, 300 K temperature, protein dielectric constant εin = 1
and solvent dielectric constant εwat = 80 are assumed. The calculations are carried out
on the protein as in the initial conformation in the CAP∗aq MD system and as after
40 ns of MD in the CAPaq MD system (closed and open conformations, respectively).

48 Catabolite Activator Protein
4.2 Results and discussion
CAPcryst. In the X-ray structure of the DNA-free, cAMP-bound CAP [23], several
crystal packing contacts, i.e. contacts between residues from different asymmetric
units, are observed. They involve residues spread throughout the protein structure
(Tab.4.2 and Fig.4.1). Here we perform 15 ns of MD simulation to check whether
our computational setup (see Computational Details section) is able to reproduce the
determinants of the X-ray structure.
Residue Subunit Residue SubunitGLU 12 A ARG 185 BHIS 19 A GLU 55 BSER 27 A GLU 37 BTHR 28 A GLU 37 BVAL 43 A ARG 185 BGLU 55 A HIS 31 BGLU 81 A HIS 21 BGLN 104 A ASP 138 APRO 160 A ARG 180 BARG 169 A PRO 160 BARG 185 A GLN 107 BARG 185 A PRO 110 BGLY 200 A ASN 194 BLYS 201 A ASN 194 BLYS 201 A TYR 206 B
Table 4.2: Crystal packing contacts in CAPcryst [23]. Contacts are defined for couples ofresidues from different asymmetric units with non-hydrogen atoms closer than 0.35 nm.
To characterize the closed (subunit “A”, colored in blue and red in Fig.4.1) and
the open (subunit “B”, colored in orange and cyan in Fig.4.1) states, we monitor
the distances between the mass centers of the DBD and CNBD of the same subunit
(2.66 nm and 2.92 nm, respectively in the initial structure). The calculated values are
2.61 (0.06) nm and 2.98 (0.05) nm (Fig.4.2d), in good accord with the experimental
data. The RMSDs of the unit cell and for the four homodimers are 0.16 (0.03) nm and
0.13 (0.02) nm, respectively (Fig.4.2a). Finally, our calculations turn out to reproduce
the experimental unit cell parameters within 0.01 nm (Tab.4.1). 1 We conclude that
our calculations are able to reproduce the X-ray structure determinants.
1Notice that using a lower number of water molecules causes a decrease of the calculated unit cellparameters in the NPT MD simulation.

Catabolite Activator Protein 49
Figure 4.2: MD simulations. (a-c) RMSD of the CAPcryst, CAPaq and CAP∗aq plotted as a
function of the simulation time (black lines). In (a), the RMSD is also averaged over the four proteins inthe unit cell, considering each molecule separately, and extreme values are reported as dots (gray line).In (b), RMSD are also calculated using the structure after 13 ns of MD as the reference conformation(gray line); the inset shows the principal component of the EM with the highest eigenvalue. (d-f)Distances between CNBD and DBD mass centers in subunits “A” and “B” (solid and gray lines,respectively) of CAP in the CAPcryst, CAPaq and CAP∗
aq , plotted as a function of the simulationtime. Initial distances are indicated by the horizontal dashed lines. In (d), distances are averagedover the 4 asymmetric units of the unit cell and extreme values are indicated by dots.
CAPaq. We now relax the CAP structure in aqueous solution. One of the four
asymmetric units in the X-ray structure [23] is immersed in a v17,000 molecules water
box (Tab.4.1) with 2 sodium counterions. The system then undergoes 40 ns of MD
simulation. During the dynamics, the RMSD fluctuates at v0.2 nm in the first part of
the simulation and increases at v0.4 nm after 10 ns (Fig.4.2b), indicating the presence
of a transition. The protein moves to a conformation in which the DBD of subunit
“A” is separated from the respective CNBD by a cleft, as initially observed in subunit
“B”. To filter the large scale concerted structural rearrangements from small harmonic
fluctuations, we use Essential Mode (EM) analysis [226,239,225,227,228]. This method
consists in a diagonalization of the covariance matrix of atomic fluctuations: eigenvec-

50 Catabolite Activator Protein
tors are ordered with decreasing eigenvalues, which are proportional to the percentage
of total fluctuation the corresponding EM describes. Therefore, the eigenvector with
the highest eigenvalue describes the collective motion that most accounts for the struc-
tural fluctuations. In our case, the conformational transition featured by the DBD of
subunit “A” is described by the first EM, whose eigenvalue accounts for v 60% of the
total motion of the protein, with a cosine content of 0.69 [225, 227, 228]. Indeed, the
projection of this eigenvector on the Cartesian trajectory closely resembles the RMSD
trace. It reaches a plateaux within 13 ns (Fig.4.2, inset) and correlates with the increase
of the distance between the mass centers of the two domains of subunit “A” (Fig.4.2e
and animation at http://www.sissa.it/∼berrera/CAP.html). The protein then fluctu-
ates around the new symmetric open conformation: in fact, in the last 27 ns of MD, the
RMSD calculated using as the reference structure the conformation after 13 ns (avail-
able at http://www.sissa.it/∼berrera/CAP.html) is v0.2 nm (Fig.4.2b) and the mean
distances between intrasubunit DBD and CNBD mass centers are 3.01 (0.06) nm and
2.89 (0.10) nm for subunits “A” and “B”, respectively (Fig.4.2e). This indicates that
the protein fluctuates close to this symmetric open conformation (Fig.4.1) within this
time-scale (27 ns), which is more than twice the time needed for the conformational
change to occur (<13 ns of MD).
CAP∗aq. In order to check the dependence of our results from the initial model
used, we carry out an MD simulation of CAP in solution based on a different initial
conformation, the symmetric closed conformation of CAP that is observed in the X-ray
structure of the protein in complex with DNA [44] (Fig.4.1). The RMSD increases and
then oscillates around a value of v0.5 nm (Fig.4.2c). Very early in the simulation (at
v1 ns of MD), the DBD of subunit “A” reorients to the open conformation, and the
DBD of subunit “B” undergoes a similar change within the first 10 ns. After 15 ns of
MD, the distances between the mass centers of the DBD and the corresponding CNBD
are 3.11 nm and 3.03 nm for subunits “A” and B, respectively (Fig.4.2f), suggesting
that the protein in solution moves to the open conformation independently from the
initial structure (Fig.4.3).
In conclusion, our simulations suggest that the DNA-free ligand bound protein

Catabolite Activator Protein 51
Figure 4.3: Trace representation of the structure of CAP in aqueous solution (CAP∗aq) in the initial
conformation, i.e. as in the X-ray structure of the DNA-bound protein [44], and as after 15 ns of MD.The CNBD and the DBD of subunit “A” are colored in blue and red, respectively, while the samedomains of subunit “B” are colored in cyan and orange, respectively; the cAMP molecules are drawnin sticks and colored by atom type. Figures obtained with the VMD program [235].
in solution assumes an open conformation in aqueous solution, in which both DBDs
are separated from the respective CNBD by a large cleft (Fig.4.1). This result holds
true independently from two, rather different, initial structures used in the simulation.
Thus, the asymmetry of the experimental X-ray structure, which is reproduced by
our computational setup, is possibly caused by packing contacts within the crystal
environment (Fig.4.1 and Tab.4.2). Such open conformation could play a role for DNA
binding.
Electrostatic profiles. To provide further insights on DNA molecular recognition
by CAP, we carry out a comparative electrostatic analysis between the structure of the
CAP bound to DNA (closed conformation, Fig.4.1) and our model in solution (open
conformation, Fig.4.1).
When the protein is in the closed conformation, as in the DNA-bound complex [44]
(Fig.4.1), the DNA binding interface of the protein is characterized by a dominant
positive area, which provides electrostatic complementarity to DNA (Fig.4.4a,c). On
the contrary, the electrostatic potential on the same surface of the protein in the
open conformation (calculated here on CAPaq final MD structure, Fig.4.1) appears

52 Catabolite Activator Protein
qualitatively different in the proximity of the homodimeric symmetry axis, i.e. near
the hinge regions (Fig.4.4b,d). Since the reorientation of the hinges is a key step in the
allosteric mechanism coupling the two domains [51, 49, 23], differences in this region
might play a biological role. Charged residues in this region are Asp-138 and Arg-
142: in the open conformation, Arg-142 side chains are buried within the intersubunit
region (Fig.4.4f), while in the closed conformation they are exposed to the DNA binding
interface (Fig.4.4e). The differences in the electrostatic profiles are also due to Asp-
138, which is known to play a crucial role for transmitting the allosteric signal [51]:
in fact, Asp-138 are closer to the dimeric symmetry axis of the protein in the open
conformation (Fig.4.4e,f). Thus, when the protein is in the open conformation, the
dominant positive potential at the DNA binding interface is intercalated by a negative
region in the central part of the surface (Fig.4.4b,d).
Simulation of CAP with lower water content than in CAPcryst. 7,468
water molecules are added to the CAP in crystal condition by adding a water box with
1.0 Kg/l density. The water molecules are rejected if the distance between any solvent
atom and the closest solute atom is lower than the sum of their respective van der
Waals radii.
The RMSD for the whole unit cell increases during the first 5 ns and then fluctu-
ates at v0.24 nm, while the mean RMSD for the four asymmetric units is v0.16 nm
(Fig.4.5a). The mean distances between the mass centers of the CNBD and the DBD
are 2.56 (0.06) nm (2.41 nm minimum and 2.70 nm maximum) and 2.96 (0.04) nm
(2.83 nm minimum and 3.05 nm maximum) for subunits “A” and “B”, respectively
(Fig.4.5b); the initial values are 2.66 nm and 2.92 nm. The calculations do not fully re-
produce the X-ray unit cell parameters (a=4.68 nm, b=9.56 nm and c=10.55 nm, while
the mean dimensions of the MD simulation box are 4.62 nm, 9.44 nm and 10.42 nm).
Thus, the decrease of the unit cell volume is v4%.

Catabolite Activator Protein 53
Figure 4.4: Electrostatics properties. (a-b) van der Waals surface (colored in white) of theprotein in the closed (CAP·DNA, a) and open (CAPaq after 40 ns of simulation, b) conformations,view as in Fig.1. The electrostatic potential is plotted on the plane defined by the positions of Cα
atoms of Arg-180 from subunit “A” and “B”, and by the midpoint between Pro-110 Cα atoms, and iscolored in red at -125 mV and in blue at +125 mV. The pictures are obtained using the gOPENMOLprogram [241,242]. (c-f) View of the protein rotated by 90◦ relative to (a-b), which shows the DNA-binding interface region. Both the closed (c,e) and open (d,f) states are plotted as van der Waalssurface (c,d) or as cartoon (e,f). In (c,d), the electrostatic potential is plotted on the protein surfacedrawn by the center of a probe of radius 0.5 nm and colored in red at -20 mV and in blue for +20 mV,using the MOLMOL program [243]. In (e,f), helices are colored in violet and strands in yellow; Asp-138and Arg-142 are drawn in sticks and colored in red and blue, respectively.

54 Catabolite Activator Protein
Figure 4.5: (a) RMSD are plotted as a function of the simulation time (black line). The RMSDis also averaged over the four proteins in the unit cell and extreme values are reported as dots (grayline). (b) Distances between CNBD and DBD mass centers in subunits “A” and “B” (solid and graylines, respectively) averaged over the 4 asymmetric units of the unit cell and plotted as a function ofthe simulation time. Extreme values are indicated by dots and initial distances are indicated by thehorizontal dashed lines.

Catabolite Activator Protein 55
4.3 Concluding remarks
MD simulations are used here to investigate the structural features of the cAMP-
activated CAP in solution, providing complementary information that does not emerge
from the available X-ray structures and are of critical importance to describe the func-
tional mechanism of the protein [45,56,57].
Our calculations suggest that crystal packing contacts affects the DNA-free CAP
conformation and that the ligand-activated form of CAP is the symmetric open con-
formation (Fig.4.1).
The protein conformation obtained by our MD simulations in aqueous solution
(open conformation, Fig.4.1) differs from the conformation of the protein in the DNA-
bound X-ray structure (closed conformation, Fig.4.1) [43, 41, 44] not only for the ori-
entation of the DBDs, but also for the electrostatic potential at the DNA-binding
interface, as the latter conformation presents a large positive region, which in the open
conformation is interrupted in the proximity of the hinges (Fig.4.4). We speculate that
this electrostatic profile may mediate a first step in DNA bending. Before the molecules
get in direct contact, the positive regions of the DNA-binding interface of the protein
in the open conformation attract the DNA, while a kink is generated in DNA segments
prone to bending [33,65]. Subsequently, both macromolecules could enter in direct con-
tact and a mutually induced-fit mechanism could drive the complex from the open to
the closed conformation, which provides a larger complementary electrostatic surface
for the bound DNA (Fig.4.4). Furthermore, experimental and/or theoretical studies
are required to test this hypothesis.
4.4 Reference
The work reported in the present chapter will be published in the following article:
Marco Berrera, Sergio Pantano and Paolo Carloni ”Catabolite Activator Protein in
aqueous solution: a molecular simulation study” submitted.


Chapter 5
cAMP modulation of the HCN2channel
HCN2 is the most characterized member of the hyperpolarization-activated cyclic
nucleotide-modulated channels family. In this channel, CNBD inhibits channel ac-
tivity by a mechanism which depends on the C-linker/CNBD interactions: binding of
cAMP relieves this inhibition and shifts by ∼+17 mV the voltage dependence to less
negative values [103,104].
Recently, Molecular Dynamics (MD) simulations provided valuable insights in the
regulation mechanisms in different ionic channels (such as the nicotinic receptor and the
kir channel) under conditions that are difficult to achieve with experimental techniques
[13,14,244,245,246]. Based on the available structural information [27], here we study
the cytoplasmic part of HCN2 by means of MD simulations, to provide a description
of the molecular process driven by cAMP leading to channel modulation.
Based on our calculations, we propose that the allosteric mechanism of cAMP mod-
ulation originates from oscillations of CNBD quaternary structure around its average
structure, with a periodicity in the order of 10 ns. This large-scale breathing motion
is triggered by cAMP binding: in fact, in the absence of the ligand, CNBD assumes a
rather disordered and loose structure, similarly to what has been found in other CNBDs
with the same fold [247, 125, 122, 46, 47] and no quaternary structure oscillations are
observed.

58 cAMP modulation of the HCN2 channel
Figure 5.1: (a) Structure of C-linker and CNBD of HCN2 from mouse [27]: four subunits are ar-ranged around the four fold rotational symmetry axis, which is represented by the dashed line, formingthe homotetramer. C-linker are at the top and CNBDs at the bottom of the picture. Three subunitsare drawn in cartoons and in the fourth, which is drawn in trace, secondary structure elements arecolored in violet for helices and yellow for β-strands and one cAMP is shown. (b) Upper view of thecomplex: stars indicate mass centers of opposite couples of adjacent subunits. (c) Diagram of onesubunit of HCN2 C-linker and CNBD with cAMP in its binding site. (d) Cascade of helices rearrange-ments following ligand unbinding [125, 122, 46, 47]. (e) Representative snapshot of the apoprotein, tobe compared with c: balls represent residues whose B-factor in the apoprotein is at least 2 (orange)and 3 (red) times that in the holoprotein, which are spread in the CNBD and E’ and F’ helices,including residues forming the binding site. (f) The most relevant motions in the holoprotein are os-cillations of the quaternary structure, which are here identified by the distances between mass centersof opposite couples of adjacent subunits (stars as in b) and are plotted in Fig.2c-d. (g) B-factors in theholoprotein (black line) and in the apoprotein (red line) are plotted along the sequence. Secondarystructure elements are indicated in violet for helices and yellow for β-strands, and are labeled.

cAMP modulation of the HCN2 channel 59
5.1 Computational details
The holoprotein is the X-ray structure of the cytoplasmic domains of HCN2 channel
from mouse in complex with four equivalents of cAMP, solved at 2.30 A resolution
(residues 443 to 645, pdb entry 1Q5O [27, 22]). The protein is a homotetramer, with
a four fold rotational symmetry (Fig.5.1a-b). The apoprotein is obtained by removing
the four cAMPs. H atoms are added by assuming standard bond lengths and bond
angles. Histidines 463, 474, 479 and 559 are protonated respectively on their Nε, Nδ,
Nε and Nδ as this choice optimizes the formation of the H-bond network with their
surroundings. Acid and basic residues are assumed to be ionized at the physiological
conditions. The models are immersed in parallelepiped boxes whose edges are ∼10.0,
10.0 and 8.1 nm, containing ∼22,500 water molecules; 12 and 16 chlorine ions are added
to neutralize the boxes.
The AMBER99 [192, 248, 193] and the TIP3P [194] force fields are used for the
protein (and ions) and water respectively; parameters for cAMP are obtained from
Punta et al. [236]. Rectangular periodic boundary conditions are applied. Particle
mesh Ewald is used to evaluate long range electrostatics [202, 203, 201]. A cutoff of
1 nm is used for the real part of the electrostatics and van der Waals interactions. The
neighbor list is updated every 10 steps. Constraints are applied to the chemical bonds
using the LINCS algorithm [199]. The integration time step is set to 1.5 fs.
The GROMACS program is used [238, 197]. After energy minimization, 45 ps
of MD of the solvent and a gradual heating of the systems (8 runs, 22.5 ps each,
from 0 to 10, 30, 70, 100, 150, 200, 250, 300 K, using the Berendsen thermostat and
barostat [204]), the complexes undergo 2.3 ns of MD in the NPT ensemble at 300 K
and 1 atm pressure, using the Nose-Hoover thermostat [206, 237] and the Parrinello-
Rahman barostat [207, 205]; the pressure coupling is isotropic in all directions. After
about 2 ns, the average RMSD for single subunits fluctuates around 0.15 nm in both
systems (Fig.5.2a-b). Finally, 19.7 ns MDs are performed in the NVT ensemble, using
the Nose-Hoover thermostat [206,237].
The following properties are calculated: (i) Root Mean Square Deviations (RMSD)

60 cAMP modulation of the HCN2 channel
are calculated respect to the X-ray structure [238, 197]. (ii) B-factors are calculated
after fitting the four subunits to the starting conformation of one monomer [238,197].
(iii) Essential Modes (EM) are obtained diagonalizing the covariance matrix [249,226,
239,225,224,238,197]: cosine contents are calculated for the first 10 eigenvectors [227,
228, 238, 197]. (iv) Intersubunit contact surface is evaluated as the difference between
solvent accessible surface areas [220, 221, 238, 197] calculated for isolated subunits and
for the tetramer. (v) The secondary structure elements are identified by the DSSP
program [250]. Properties i-iii are calculated considering only Cα and properties ii-iv
are calculated for the last 20 ns of MD.
To complement the study of the protein dynamic properties, we perform elastic
network analysis by applying a modified version of the Gaussian model, which consider
also the Cβ atoms [9].
5.2 Results and discussion
5.2.1 Holoprotein
During the MD simulation, the RMSD of the ligand bound protein increases up to
nearly 0.2 nm within the first 2 ns; subsequently, the RMSD fluctuates between 0.2
and 0.3 nm (Fig.5.2a), with an overall oscillation in the ∼13 ns time-scale. Also the
distances between centers of mass of two complex halves (Fig.5.1b,f), which are perpen-
dicular to the homotetramer rotational symmetry, oscillate with the same period and an
amplitude of about 0.05 nm (Fig.5.2c and Fig.5.1b,f). The protein oscillates between a
configuration similar to that of the X-ray structure and a conformation where two oppo-
site intersubunit interface regions are more distant than the other two. The projection
of the first Essential Mode (EM) on the real space trajectory reproduces this movement
(Fig.5.3 and animation available at http://www.sissa.it/∼berrera/HCN2/movies.html).
The corresponding eigenvalue accounts for about 24% of the total fluctuations. No large
intrasubunit rearrangements are observed and the RMSD of single subunit is nearly
0.15 nm (Fig.5.2a). The cosine contents of the first 10 EMs are as small as 0.2, indi-
cating that the simulation is rather converged [227, 228]. A Gaussian elastic network
model [9] calculation provides a similar picture: the two slowest normal modes de-

cAMP modulation of the HCN2 channel 61
scribe conformational motions which evolve perpendicularly to the homotetramer axis
(animation at the address above), similarly to what obtained from the EM analysis of
the MD trajectory. The scalar product of the first EM with the first and the second
β-Gaussian normal modes are 0.5 both, and the subspace overlap of the first EM with
the first 10 β-Gaussian normal modes is 0.82, meaning that the first EM is well de-
scribed in the vibrations of the elastic network model. Moreover, the eigenvalues of the
first 10 EMs, which account for about 70% of the total fluctuations, correlate with the
corresponding eigenvalues of the β-Gaussian normal modes (Fig.5.4). In addition, the
secondary structure elements and the protein/ligand contacts observed in the X-ray
structure are fully maintained throughout the MD trajectory.
Figure 5.2: Cα RMSD plots (a-b) and distances between mass centers of opposite couples of adjacentsubunits (c-d) according to Fig.1b and f, in the holoprotein (a and c) and in the apoprotein (b andd). RMSD for the tetramer (black) and average RMSD for single chains (gray) are shown. For theholoprotein, distances and RMSD plots are correlated and display an oscillation that can be fitted bya sine function with an period of ∼13 ns and an amplitude of ∼0.03 nm for RMSD and ∼0.05 nm forboth centers of mass distances.
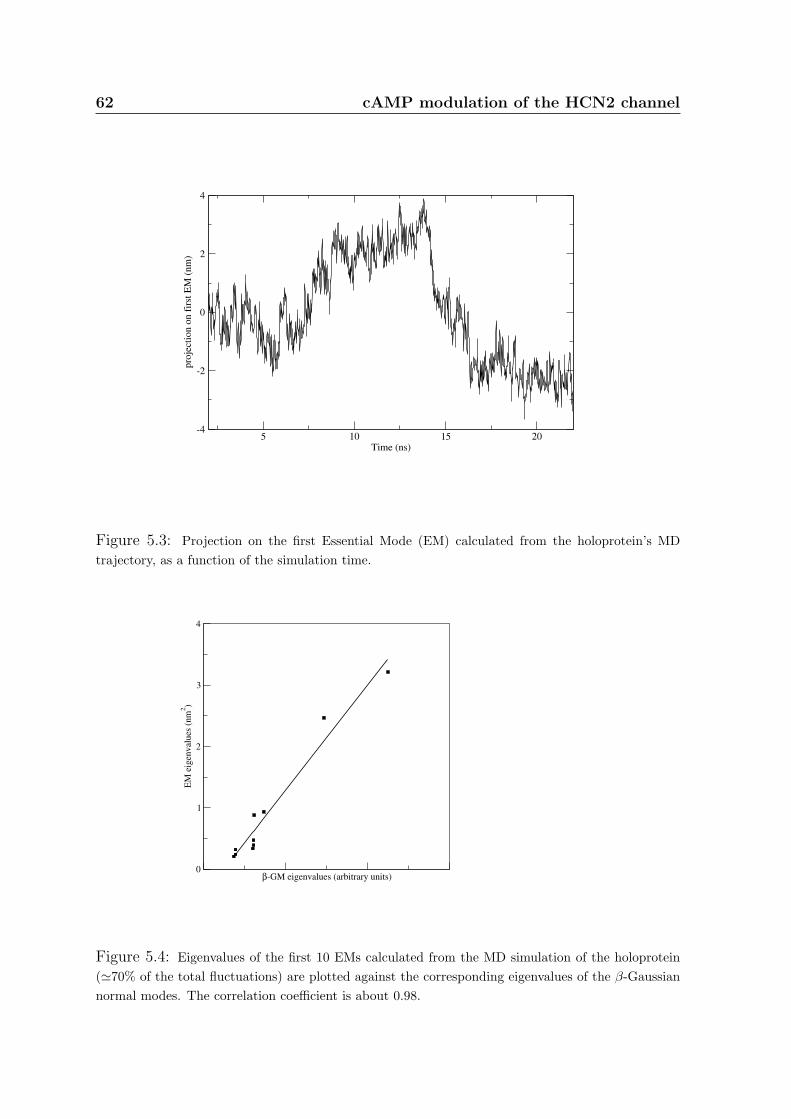
62 cAMP modulation of the HCN2 channel
Figure 5.3: Projection on the first Essential Mode (EM) calculated from the holoprotein’s MDtrajectory, as a function of the simulation time.
β-GM eigenvalues (arbitrary units)0
1
2
3
4
EM
eig
enva
lues
(nm
2 )
Figure 5.4: Eigenvalues of the first 10 EMs calculated from the MD simulation of the holoprotein('70% of the total fluctuations) are plotted against the corresponding eigenvalues of the β-Gaussiannormal modes. The correlation coefficient is about 0.98.

cAMP modulation of the HCN2 channel 63
5.2.2 Apoprotein
Also the RMSD of the ligand free protein increases up to nearly 0.2 nm within the
first 2 ns, and subsequently fluctuates between 0.2 and 0.3 nm without the oscillation
identified above (Fig.5.2b). A plot of the distances between the same centers of mass
defined above confirms that the quaternary structure does not oscillate as in the cAMP
bound system (Fig.5.2d). In addition, the motion of each subunit is uncorrelated to
that of the others. The RMSDs of each subunit fluctuate around 0.2 nm toward
the end of the simulation (Fig.5.2b), suggesting that in this case fluctuations within
single chains are more relevant. In fact, the absence of the ligand causes a cascade of
dramatic rearrangements first affecting C- and P-helices, which are elements forming
the binding pocket. These rearrangements have been already observed in CNBDs of
other proteins with the same fold [247, 125, 236, 122, 46, 47] and are here only briefly
summarized (Fig.5.1d). The C helix breaks, increasing the flexibility of its extremities.
This allows for a rotation of the P-helix around its longitudinal axis as observed in other
CNBDs [125, 122, 47]. The movements of the C- and P-helices are also transferred to
B-, A- and F’-helices, this last within the C-term part of the C-linker. F’-helix moves
closer to C-helix of CNBD and its secondary structure breaks. These rearrangements
are linked to residues bearing higher flexibility, as evidenced by a comparison of the B-
factors in the apoprotein with those of the holoprotein (Fig.5.1e,g). The cosine content
of the largest EM is 0.8 and those of the following 9 are as small as 0.2, probably
suggesting that the system has not reached yet a fully converged state.
Finally, the intersubunit interaction appears to be stronger in the apoprotein than
in the holoprotein, because the intersubunit contact surface is respectively 74 (2) nm2
and 69 (2) nm2 [251], compatible with the fact that, in the holoprotein, the subunits
undergo large oscillations one relative to the others.

64 cAMP modulation of the HCN2 channel
5.3 Concluding remarks
Protein fluctuations play a crucial role for a large variety of protein functions [252,
253]. In this work, we have shown that MD simulations provide complementary and
important information not emerging from the X-ray structure of the complex between
the cytoplasmic domains of HCN2 and cAMP. In fact, the motion of the holoprotein
is characterized by quaternary structure oscillation, hinged at the intersubunit contact
surface: two opposite edges of the complex go far and closer with a period of about 13
ns (Fig.5.1f, Fig.5.2c and animation at the address above). Elastic network analysis
supports these conclusions.
A reduction of the intersubunit interactions due to electrostatics has been proposed
to facilitate the opening transition of the C-linker [254, 255]. Thus, at the speculative
level, we propose that also the weakening of the van der Waals interactions can play
a role for gating. In fact, our calculations indicate that the cAMP binding induces a
reduction in the contact surfaces between subunits, i.e. it leads to a weakening of the
intersubunit van der Waals interaction.
The MD simulations provide also insights on the cytoplasmic domains in the ligand
free form, for which no structural information is available. CNBD experiences a cascade
of rearrangements of secondary structure elements: the repositioning of P-helix and the
increased flexibility of C-helix lead to a reorientation of B-helix, which in turn affects
A helix and the C-terminal part of C-linker (Fig.5.1d). Very similar cascades of events
have been seen previously in the context of CNBDs with the same fold in different
proteins [47], pointing to a ligand-dependent orientation of C-helix relative to the β-
roll [247, 236, 46] and to a conformational change in the PBC following ligand release
coupled to a reorientation of the B-helix by hydrophobic residues, which are conserved
in CNBDs from different proteins and corresponds in HCN2 to LEU585 of P helix and
PHE611 of B-helix [125, 122, 46]. In fact, in the apoprotein a rotation of the P-helix
turns LEU585 side chain to push PHE611 side chain.
In conclusion, MD simulations allow us to dissect important aspects of the mech-
anism for cAMP allosteric modulation in the HCN2 channel. We must note that the

cAMP modulation of the HCN2 channel 65
structural features reported here for the cAMP free and bound systems are confined
to the relatively short time-scale allowed by the state-of-the-art simulation techniques.
Nevertheless, our results are in agreement with a variety of experimental data present in
the literature and allow to formulate a molecular level model for the cAMP modulation
of the HCN2 channel.
5.4 Reference
The work reported in the present chapter has been published in the following article:
Marco Berrera, Sergio Pantano and Paolo Carloni. ”cAMP modulation of the cytoplas-
mic domain in the HCN2 channel investigated by molecular simulations” Biophysical
Journal (2006) 90:3428-3433.


Chapter 6
Binding of NGF peptide mimics totrkA
NGF binds with the highest affinity to the receptor trkA [136, 137, 138], which me-
diates the survival-promoting and neurite-growth-promoting effects of NGF during
development [139, 140, 141, 142]. The ligand/receptor interface involves two patches:
one comprises residues of NGF core region and loops of the C-term of the fifth extra-
cellular domain of trkA (trkA-d5), the other includes the N-terminal fragment of NGF
(N-term@NGF) and the ’ABED’ β-sheet of trkA-d5 [157, 28] (Fig.6.1a). The latter is
known to determine the affinity and specificity of the NGF binding to trkA, as indi-
cated by experimental data [158, 159, 160, 161, 162, 164, 141] and further suggested by
Molecular Dynamics (MD) calculations [165].
Here we attempt at identifying a short peptide as a trkA-d5 high affinity mimic of
the N-term@NGF. Our work is based on the X-ray [28] and the MD [165] structures
of the NGF/trkA-d5 complex (Fig.6.1a). First, we identify NGF residues exhibiting
significant contact surface, and thus non-polar interaction, with the receptor; among
those, we locate the residues forming significant electrostatic interaction and/or binding
energy hot spot as defined in ref. [190, 191]. Based on this analysis, we conclude that
residues from 4 to 13 (H4PIFHRGEFS13, according to the pdb 1WWW numeration
[28,22]), at the N-term, may have high affinity for trkA-d5.
Subsequently, under the assumption that the mode of binding of the peptide is
similar to that of the original protein, we investigate the conformational flexibility of the
adduct formed by the H4PIFHRGEFS13 peptide with trkA-d5 using MD (Fig.6.1b).

68 Binding of NGF peptide mimics to trkA
The stability of the “complementary” complex, i.e. the complex in which the same
peptide is removed from NGF, is also explored by MD (Fig.6.1d). Our calculations
confirm that most residues belonging to the 4-13 peptide are important for trkA-d5
binding, HIS8 and SER13 being the only groups not stabilizing the complex. Thus, we
modify the peptide mimic by deleting SER13 and mutating HIS8 to GLY, which ensures
a larger flexibility of the peptide. MD simulations carried out on the resulting peptide
(H4PIFGRGEF12 ) suggest that the latter, in spite of its shorter length, forms an
additional salt bridge with the receptor, besides those originally formed by ARG9 and
GLU11. Thus, we identify this peptide as a high affinity mimic of the N-term@NGF.
As a final step, we investigate the binding process by steered MD [211,212,213,217,214,
215, 216, 218, 219], and the aforementioned salt bridges turn to be the most persistent
interactions between the ligand and the receptor.
6.1 Computational details
6.1.1 Features of the N-term@NGF / trkA-d5 interactions
All the calculations presented here are based on the last snapshot (available at
http://www.sissa.it/∼berrera/NGF/NGF-trkAd5-t0.pdb) of our MD simulation of the
NGF/trkA-d5 complex [165]. Calculations based on the X-ray structure [28] yield very
similar results (Tab.6.2).
We focus on structural (i) and energetic (ii-iii) features associated with the binding
of chain Y of trkA-d5 to NGF homodimer in complex with the other receptor chain X:
trkA−d5(Y ) + NGF · trkA−d5(X) → trkA−d5(Y )·NGF · trkA−d5(X)
(i) We calculate the difference of the solvent accessible surfaces of NGF in the
presence and in the absence of trkA-d5(Y), which is here called Contact Surface (CS).
CS provides a rough estimate of the non-polar contribution to the binding free energy
[223]. We use the center-probe area definition [220] and set the solvent probe radius to
0.14 nm [221, 222]. The residues providing the largest CS in the NGF N-term region
turn out to be located between HIS4 and SER13 (sequence H4PIFHRGEFS13).
(ii) The Poisson-Boltzmann Equation (PBE) [189] is applied to calculate the elec-
trostatic contribution to the free energy of binding ∆GEB [256]:

Binding of NGF peptide mimics to trkA 69
Figure 6.1: (a) Cα trace of the NGF/trkA-d5 complex as obtained by the MD simulation of ref. [165].Each of the two NGF identical subunits (black) binds to a trkA-d5 subunit (gray). The trace isthicker for the residues involved in NGF/trkA-d5 molecular recognition. The trkA-d5/N-term@NGFregions are further marked with two ellipses. (b) Cα trace of the complex formed by trkA-d5 andH4PIFHRGEFS13 (c1). A second peptide in c2 differs from that in c1 for the replacement of HIS8with GLY and the removal of SER13. Both c1 and c2 are investigated here by MD simulations. (c)TrkA-d5/peptide interactions in c1 and c2. The van der Waals and H-bond interactions are depictedas continuous and dashed lines respectively. HIS4 is accommodated in a receptor’s pocket lined byHIS291, PRO302 and HIS343; at the bottom, HIS4 hydrogen bonds with PHE303 and GLY344. PRO5side chain interacts with HIS343 and LEU333. ILE6 is positioned in another receptor’s pocket linedby VAL294, MET296 and LEU333; at the bottom, ILE6 side chain forms van der Waals interactionswith the receptor surface exposed disulfide region between CYS345 and CYS300. PHE7 interacts withVAL294, ARG9 with GLU334, GLY10 with MET296, GLU11 with ARG347, PHE12 with MET296,SER13 with MET296. HIS8 does not interact with trkA-d5. GLU339, which is boxed, interacts withARG9 only in c2. (d) Cα trace of the trkA-d5/NGF complex without S2SHPIFHRGEFS13 residues(c3). Also this complex undergoes MD simulation. The initial structure (thick trace) is comparedwith the last c3 MD snapshot (thin trace) [235].

70 Binding of NGF peptide mimics to trkA
∆GEB = GE
trkA−d5(Y )·NGF ·trkA−d5(X) −GENGF ·trkA−d5(X) −GE
trkA−d5(Y )
Each molecule is assumed to adopt the same conformation in the complex and in
the isolated form. Then, the change of ∆GEB upon mutation of each residue R (except
GLY) to ALA is calculated from the formula:
∆∆GEB = ∆GE
B(R → ALA)−∆GEB(WT )
The structures of the mutated protein are obtained by deleting all the side chain
atoms of residue R except the Cβ, which is saturated. Then, the structures undergo
an energy minimization, using the standard pairwise generalized Born/surface area
model of solvation [208, 209] as implemented in the AMBER7 program [257]. We use
the AMBER99 force field [192,193], assuming 100 mM monovalent ionic concentration,
protein dielectric constant εin = 2 and solvent dielectric constant εwat = 78.5.
∆GEB is calculated using the APBS program [232] under the following conditions:
(i) the nonlinear PBE is solved; (ii) the temperature is set to 300 K; (iii) a 100 mM
monovalent ion concentration is assumed; (iv) the Connolly molecular surface definition
[258] is used; (v) a 2 runs focusing procedure is applied. First, we run the APBS
program with boundary conditions defined using a Debye-Huckel model for multiple
charged spheres, along with a grid spacing of 0.067 nm. Then, we run the program with
boundary conditions derived from the first run, with grid spacing as small as 0.047 nm.
Test calculation with a finer grid spacing, i.e. 0.045 nm, shows that the calculated free
energies differ by v0.2 kJ/mol ('0.1 kT).
(iii) We calculate which NGF residues at the NGF/trkA-d5(Y) interface contribute
significantly to the complex stability using Baker’s computational alanine scanning pro-
cedure [190,191]. The predictor locates the residues at the interface which significantly
destabilize the complex when mutated to alanine, estimating both the van der Waals
and the electrostatic contributions to the free energy of binding. Binding energy hot
spots are defined as residues whose ∆∆GhsB ≥ 2kT . The prediction is performed on
the entire NGF/trkA-d5 and on the N-term@NGF mimic/trkA-d5 complexes.
6.1.2 Molecular dynamics
We perform MD simulations on: (i) the complex formed by trkA-d5 and the N-

Binding of NGF peptide mimics to trkA 71
term@NGF derived peptide H4PIFHRGEFS13 (c1, Fig.6.1b). HIS4 and SER13 are
terminated by acetyl and N-methyl groups respectively. (ii) the trkA-d5/NGF complex
without such peptide, along with SER2 and SER3 (c3, Fig.6.1d). (iii) The complex
formed by trkA-d5 and the peptide of sequence H4PIFGRGEF12 (c2). c1, c2 and c3
are solvated in rectangular water boxes (Tab.6.1).
The same computational protocol is used for c1, c2 and c3. We use the AMBER99
force field [192, 193] and TIP3P [194] for the biomolecules and water, respectively.
Calculations are performed using the GROMACS program [197]. Periodic boundary
conditions are applied. Particle mesh Ewald is used to evaluate long range electrostatics
[202, 203, 201]. A cutoff of 1 nm is used for the real part of the electrostatics and for
the van der Waals interactions. Constraints are applied to the bonds using the LINCS
algorithm [199]. The integration time step is set to 1.5 fs.
Equilibration runs are carried out using the Berendsen thermostat and barostat
[204]. The solvent undergoes ∼50 ps of MD simulations keeping fixed the protein
atoms, in order to achieve the correct solvent density. Subsequently, the systems are
energy minimized and then gradually heated by 8 MD runs with increasing temperature
(22.5 ps each, from 0 to 10, 30, 70, 100, 150, 200, 250, 300 K). 5.7 ns MD simulations in
the NPT ensemble (T=300 K and P=1 atm) are then performed using the Nose-Hoover
thermostat [206, 237] and the Parrinello-Rahman procedure [207, 205]; the pressure
coupling is isotropic in all directions.
Root Mean Square Deviations (RMSD) are calculated for Cα atoms using the X-
ray structure [28] as the reference conformation. RMSD plots for c1 and c2 fluctuate
around 0.15 nm within the first 0.6 ns, which are discarded; on the contrary, the same
plot calculated for c3 displays increasing RMSD (Fig.6.2). The maximal distance al-
lowed for the existence of an H-bond between hydrogen and acceptor atom is 0.25 nm,
while the maximal supplement of the donor-hydrogen-acceptor angle is 60◦, 0◦ corre-
sponding to the extended conformation. Two oppositely charged residues are assumed
to form a salt bridge interaction when at least one H-bond can be detected between
their side chains.

72 Binding of NGF peptide mimics to trkA
6.1.3 Steered molecular dynamics
3 ns of Steered Molecular Dynamics (SMD) [211, 212, 213, 214, 215, 216, 217, 218, 219]
are carried out in the NPT ensemble with the same setup, based on the c2 MD last
snapshot, except that the peptide is harmonically restrained (force constant is 1,000
kJ/(mol·nm2) [211,217,215,219]). The restraint is initially applied at the peptide mass
center and moves away from the receptor mass center with a velocity of 0.5 nm/ns. An
additional 4 ns long SMD simulation is performed with the same setup but 0.25 nm/ns
restraint point velocity. Then, 5.4 ns of MD in the NPT ensemble, with the same setup
as above, are performed. Finally, the unbound peptide is immersed in a smaller water
box (up in Tab.6.1) and 25 ns of MD simulation in the NPT ensemble are performed.
Complex amino N-methyl Acetyl water Sodium Box edges (nm)name acids groups groups molecules ions x y zc1 111 2 2 9689 4 7.6 7.2 5.8c2 110 2 2 9538 4 7.3 7.2 6.3c3 407 4 4 24165 2 12.8 9.5 6.7up 9 1 1 2987 0 5.1 4.3 4.2
Table 6.1: Selected features of the three complexes (c1, c2 and c3, see also Fig.1b,d) and of theunbound peptide (up) systems investigated in this work.
6.2 Results and discussion
A calculation of the Contact Surface (CS) [220] between trkA-d5 and NGF suggests
that the NGF residues from HIS4 to SER13 form significant contacts with the receptor
(CS > 0.20 nm2), except HIS8 and GLY10. In particular, HIS4 and ILE6 form the
most extensive contacts with the receptor, being accommodated in specific pockets
(Fig.6.1c and Tab.6.2). Based on a solvent accessible surfaces calculation, CS-based
methods provide a rough estimate of the non-polar interaction [223] and thus of the
residues which are responsible for the most relevant hydrophobic contributions to the
overall free energy of binding. Only a few other NGF residues have such significant
CS: SER19, TRP21, TYR52, PHE54, ARG59, ILE145, LYS146, GLY147, THR197,

Binding of NGF peptide mimics to trkA 73
HIS198, ARG217 and VAL225. This indicates again the relevance of the N-term@NGF
for ligand/receptor interaction [158,159,160,161,162,164,141,165].
To dissect the most important electrostatic interactions between N-term@NGF and
trkA-d5, we perform electrostatic alanine scanning calculations [256]. We calculate the
electrostatic free energy of receptor binding to the ligand in which the residue R is
mutated to ALA and then we subtract the corresponding free energy calculated for
the native peptide. The larger is the resulting ∆∆GEB, the greater is the electrostatic
contribution of residue R side chain to the binding free energy. Here we distinguish H-
bonds from salt bridges, which are characterized by a larger desolvation penalty upon
formation and by a much stronger electrostatic attraction, involving two oppositely
charged groups [259]. HIS4, ARG9 and GLU11 turn out to provide the most negative
electrostatic free energies, presumably because of H-bond and salt bridge interactions
with the receptor (namely, with residues PHE303 and GLY344, GLU334, ARG347,
Fig.6.1c and Tab.6.2). A similar picture is obtained by applying the Baker et al.
binding energy hot spot predictor [190, 191]: within the N-term region, HIS4, ILE6,
ARG9, GLU11 and PHE12 significantly contribute to the complex stability (∆∆GhsB >
2kT , Tab.6.2).
We conclude that NGF residues from HIS4 to SER13 have good affinity for trkA-d5,
with the exception of HIS8. Thus, we may expect that the peptide which has the same
sequence (H4PIFHRGEFS13 ) might have good affinity for the receptor. To investigate
the stability of this peptide with trkA-d5 (c1, Fig1b), we perform an MD simulation
along with a complementary system, which comprises both receptors trkA-d5 and the
whole NGF without the N-terms (c3, Fig.6.1d). As for the peptide, we assume that
its mode of binding is similar to that of full length NGF.
The results of the simulation of c1 are summarized in Fig.6.2 and in Tab.6.3.
The RMSD fluctuates around a relatively small value (0.15 nm, Fig.6.2) and the pep-
tide/receptor contacts are maintained as in the full complex, with the notable exception
of SER13: this residue is much more solvated here than in the full complex (Tab.6.2
and 6.3) and it is not interacting with trkA-d5 as in the full complex. Our calculations

74 Binding of NGF peptide mimics to trkA
NGF CS (nm2) ∆∆GEB (kT) ∆∆Ghs
B (kT)residues 1WWW f. c. c1 c2 f. c. 1WWW f. c. c1 c2HIS4 1.03 1.06 1.00 1.19 2.99 5.40 4.60 5.18 3.44PRO5 0.47 0.51 0.57 0.36 1.47 / / / /ILE6 0.79 0.83 0.95 0.72 -0.55 2.10 2.06 2.95 2.47PHE7 0.39 0.49 0.54 0.25 -0.84 1.27 / 1.44 1.39
HIS8(GLY) 0 0 0 0 0 / 0.49 / /ARG9 0.44 0.57 0.53 1.06 2.52 0.29 2.11 2.06 2.99GLY10 0.02 0.08 0.04 0.07 / / / / /GLU11 0.65 0.68 0.90 0.83 6.33 0.69 2.50 1.83 2.82PHE12 0.30 0.29 0.45 0.38 -0.22 0.70 4.18 0.70 1.93SER13 0.34 0.39 0.10 # -2.13 0.35 0.35 -0.22 #
Table 6.2: TrkA-d5/N-term@NGF interactions. Contact Surface (CS) [220], electrostatic alaninescanning calculations (∆∆GE
B) [256] and binding energy hot spot predictions (∆∆GhsB ) [190,191] are
reported for NGF residues from HIS4 to SER13. The NGF/trkA-d5 full complex (f. c.) is the lastMD snapshot of the previously performed simulation [165] and the c1 and c2 conformations are thoseafter 5.7 ns of MD.
further confirm that HIS8 does not form interactions with the receptor. This suggests
that HIS8 can be substituted by a simpler residue like GLY or ALA. Since GLY allows
for a higher flexibility of the peptide, which in turn might assist trkA-d5 binding, we
substitute here HIS8 with GLY.
Based on these findings, we probe the stability of the peptide in which HIS8 is mu-
tated to GLY and SER13 is absent (H4PIFGRGEF12, c2). This peptide is expected
to interact with the receptor as strongly as H4PIFHRGEFS13, being one amino acid
shorter. The peptide interacts with trkA-d5 as in c1, except ARG9@NGF: the salt
bridge formed by this residue with GLU334@trkA is almost always broken and the
H-bond formed with the backbone of GLU334@trkA is strengthened. Moreover, a new
salt bridge, not present in c1, is observed between ARG9@NGF and GLU339@trkA
but only in 40% of the trajectory (Fig.6.1c and Tab.6.3): this interaction is therefore
weaker than the salt bridge between ARG9@NGF and GLU334@trkA in c1 (84%).
However, it is compensated by the formation of an H-bond between ARG9@NGF and
GLU334@trkA backbone (Tab.6.3). Both terminal residues are forming significant in-
teraction with the receptor, unlike in c1. The complex is stable, with the RMSD
fluctuating around 0.15 nm (Fig.6.2). The Baker’s binding energy hot spots predic-

Binding of NGF peptide mimics to trkA 75
tor [190,191], applied to the last c2 snapshot, suggests that all of the peptide residues,
except PRO5, GLY8 and GLY10, are significantly contributing to the complex sta-
bility (Tab.6.2). We conclude that the larger conformational flexibility of the peptide
caused by the HIS8 to GLY mutation might assist the formation of a new salt bridge
interaction.
NGF trkA-d5 c1 c2H-bonds (%)
HIS 4 Nε PHE 303 O 87 99HIS 4 Nε GLY 344 O 22 3ARG 9 sc GLU 334 O 4 72
Salt bridges (%)ARG 9 sc GLU 334 sc 84 1ARG 9 sc GLU 339 sc 0 40GLU 11 sc ARG 347 sc 100 100
hydrophobic contacts (nm)HIS4 PHE303 0.29 (0.02) 0.28 (0.01)HIS4 GLY344 0.33 (0.04) 0.35 (0.03)HIS4 HIS291 0.48 (0.13) 0.38 (0.04)HIS4 PRO302 0.36 (0.02) 0.36 (0.02)HIS4 HIS343 0.37 (0.03) 0.38 (0.03)PRO5 HIS343 0.36 (0.02) 0.36 (0.02)PRO5 LEU333 0.40 (0.03) 0.40 (0.04)ILE6 LEU333 0.40 (0.05) 0.38 (0.03)ILE6 CYS345 0.38 (0.03) 0.38 (0.03)ILE6 CYS300 0.41 (0.04) 0.44 (0.04)ILE6 MET296 0.35 (0.03) 0.41 (0.05)ILE6 VAL294 0.40 (0.04) 0.47 (0.05)PHE7 VAL294 0.43 (0.08) 0.41 (0.05)ARG9 GLU334 0.29 (0.05) 0.33 (0.10)ARG9 GLU339 1.14 (0.21) 0.45 (0.21)GLY10 MET296 0.44 (0.06) 0.63 (0.10)GLU11 ARG347 0.27 (0.01) 0.27 (0.01)PHE12 MET296 0.34 (0.02) 0.37 (0.04)SER13 MET296 0.42 (0.09) #
Table 6.3: Ligand-receptor interactions in c1 and c2 (sc = side chain). H-bonds, salt bridges andminimum distances between non-hydrogen atoms of couples of interacting residues, as described inFig.1c.
Very different results are obtained for the complex between trkA-d5 and the NGF
lacking the N-term segments (c3 in Fig.6.1d). In this case, although we start from the

76 Binding of NGF peptide mimics to trkA
bound conformation of the full complex, the receptor slowly detaches from the N-terms
deleted neurotrophin, as evinced from the RMSD that grows during the simulation and
the CS between NGF homodimer and the receptors that decreases, indicating an in-
crease of the solvation of the different subunits during the dynamics (Fig.6.1d and
Fig.6.2). The calculation is stopped after 5.7 ns of MD, as the previously described
simulations. Although the results strongly suggest a dissociation of the complex, ob-
serving such an event requires a time-scale which is currently not covered by MD
simulations.
We conclude that the interactions of the peptide in c2 with the receptor appear to
be far stronger than those formed by the rest of the neurotrophin.
6.2.1 Steered molecular dynamics
SMD is based on the final MD snapshot of c2 (Fig.6.3b). Although the investigation
of the entire molecular recognition process is beyond the domain of applicability of
molecular simulation methods, useful qualitative insights on the ligand/receptor bind-
ing process can be obtained by steering the ligand away from the receptor and observing
the applied force profile [211,212,213,214,217,215,216,218,219].
Here we apply such an approach to the case of c2, by monitoring the external
force and the distance between the mass centers of ligand and receptor as a func-
tion of the simulated time (Fig.6.3a). Until 0.8 ns the distance is almost constant,
no ligand/receptor interactions are broken and the force grows linearly as fast as
1.12 pN/ps. Then, at about 1 ns, the force is large enough to break almost simulta-
neously all intermolecular interactions except the salt bridges formed by ARG9@NGF
and GLU11@NGF. The breaking of all these interactions determines a sharp decrease
of the force, an increase of the receptor/peptide mass centers distance and of the sol-
vation of the NGF residues (Fig.6.3a). The force is now much smaller and does not
change on the disruption, at about 1.45 ns, of the salt bridge formed by ARG9, which
is observed in c1 and in c2 to be the least stable among the two peptide/receptor salt
bridges (Tab.6.3). In contrast, it decreases suddenly on the rupture of the last inter-
action, the salt bridge formed by GLU11, at about 2.15 ns (Fig.6.3a). The hydration

Binding of NGF peptide mimics to trkA 77
0.1
0.2
0.3
0.4c1
0.1
0.2
0.3
0.4
RM
SD (n
m)
c2
0.1
0.2
0.3
0.4c3
6
7
8
9
6
7
8
9
CS
(nm
2 )
0 1 2 3 4 5Time (ns)
15
20
25
0
0.1
0.2
Figure 6.2: RMSDs (black line) and CS between ligand and the receptor (gray line) calculatedfor the three complexes investigated here by MD. The insert shows the RMSDs of NGF and trkA-d5chains X and Y in c3 (continuous black line, dashed black line and continuous gray lines, respectively).

78 Binding of NGF peptide mimics to trkA
Figure 6.3: SMD of c2 moving the restraint point with a velocity of 0.5 nm/ns. (a) Distancebetween the mass centers of trkA-d5 and of the ACEHPIFGRGEFNME peptide (solid line) and forceon the peptide (dashed line) plotted as a function of the simulation time. The peptide/receptorinteractions are broken after 1.1 ns of SMD, except the salt bridges formed by the peptide residuesARG9 and GLU11, which break down at about 1.45 ns and 2.15 ns of SMD respectively. The insertshows the number of water oxygens within 0.45 nm of non-hydrogen atoms of the peptide residues, asa function of the simulation time. (b-c) Structure of c2 at the beginning (b) and at the end (c) of thesimulation: the Cα trace of the receptor is represented (green at 5.7 ns of MD, red after 3 ns of SMDand further 5.4 ns of MD), along with the sticks representation of the peptide, colored by atom type.(d) Separated fit of the peptide and of the receptor structures in the initial (green) and the final (red)conformations [235].

Binding of NGF peptide mimics to trkA 79
of the ligand increases at each of these disruptive events (insert in Fig.6.3a).
To check the reliability of our results, a second SMD simulation is performed by
applying an external force that increases slower: a qualitatively similar unbinding
process is observed (Fig.6.4).
0 0.5 1 1.5 2 2.5 3 3.5 4Time (ns)
1
1.5
2
2.5
3
3.5
Dis
tanc
e (n
m)
0 0.5 1 1.5 2 2.5 3 3.5 4Time (ns)
0
250
500
750
1000
Forc
e (p
N)
0 1 2 3 4Time (ns)
60
80
100
120no o
f wat
ers
Figure 6.4: SMD of c2. The restraint point is moved at a velocity of 0.25 nm/ns, which is halfthe velocity of the steered MD in Fig.3. (a) Distance between the mass centers of trkA-d5 and ofthe peptide (solid line) and force on the peptide (dashed line) plotted as a function of the simulationtime. The force increases with a rate of ∼0.61 pN/ps within the first 1.2 ns. All peptide/receptorinteractions are broken after 1.5 ns of SMD except those formed by the peptide residues ARG9 andGLU11, which break down at about 1.75 ns and 3.3 ns of SMD respectively. The insert shows thenumber of water oxygens within 0.45 nm of non-hydrogen atoms of the peptide residues, as a functionof the simulation time.
After a total of 3 ns of SMD, the peptide is unbound from the receptor and further
5.4 ns of MD are performed, without applying external force to the peptide (Fig.6.3c).
The mean RMSD calculated for the receptor is 0.14 (0.02) nm and the conformation
of the unbound trkA-d5 is very similar to that of the receptor bound to NGF [260];

80 Binding of NGF peptide mimics to trkA
the mean RMSD for the peptide is 0.30 (0.05) nm (Fig.6.3d).
By performing 25 ns of MD simulation of the peptide, we observe that the peptide
is folding into itself progressively: the RMSD is 0.26 nm at 0 ns and 0.20 nm at 25 ns.
ARG9 and GLU11 do not form an intra-peptide salt bridge neither here nor in the
previous complexes; two intra-peptide H-bonds, between ILE6 N and HIS4 Nδ and
between PHE7 N and HIS4 O are maintained during the dynamics. The side chains
are oriented as in the bound peptide, with the exception of GLU11 side chain, that
interacts with the backbone of the peptide C-term part.
6.3 Concluding remarks
Our simulations suggest that the ACEHPIFGRGEFNME peptide may provide high affinity
to the trkA-d5 receptor, as all the residues form interactions with the receptor except
the GLY8 and GLY10 residues; however, the latter provides conformational flexibility
which allows the peptide to form an additional interaction with the receptor.
SMD calculations suggest that the strengths of the contacts between the peptide
and its target are similar, with the exception of the salt bridges formed by ARG9
and GLU11 with trkA-d5 (Fig.6.1c). These interactions are the most persistent in the
SMD, possibly because of the large flexibility and length of the side chains involved,
which can rearrange so as to maintain the electrostatic interactions despite the increase
of the peptide/receptor distance, with respect to all the other residues at the interface.
The challenge is now to perform in vitro and in vivo experiments which may quan-
tify the actual efficacy of this peptide as an agonist or competitive antagonist [261,175].
6.4 Reference
The work reported in the present chapter has been published in the following article:
Marco Berrera, Antonino Cattaneo and Paolo Carloni. ”Molecular simulation of the
binding of nerve growth factor peptide mimics to the receptor tyrosine kinase A” Bio-
physical Journal (2006) 91:2063-2071.

Chapter 7
Conclusions
The calculations presented in this thesis have provided some examples of the use of
molecular simulation as a tool for structural biology and ligand design, complementary
to experimental techniques, such as X-ray crystallography and NMR.
First, we have used MD simulations to investigate the structural features of the
bacterial transcription activator protein CAP in aqueous solution. Our cal-
culations suggest that crystal packing contacts modify the conformation of CAP so
that the DNA Binding Domains (DBD) are differently arranged. On the contrary, the
homodimer in solution assumes a symmetric arrangement in which both DBDs are
separated from the respective Cyclic Nucleotide Binding Domain (CNBD) by a cleft.
We speculate that CAP in this open conformation is the ligand-activated form of the
protein, which is important to mediate the first step in the interaction with the target
DNA, and that the rearrangement to the closed conformation, which is observed in the
DNA-bound X-ray structures, is favoured by the larger electrostatic complementarity
with DNA of the protein in this state.
Subsequently, we have investigated the dynamic features of the intracellular part
of the HCN2 channel. The motion of the cAMP-bound intracellular part of the
HCN2 channel, which is responsible for the channel modulation upon binding of the
ligand cAMP, is characterized by a v10 ns quaternary structure oscillation hinged at
the intersubunit contact surface. Elastic network analysis supports these conclusions.
This large-scale oscillation is here proposed to play an important role for the protein
function, being coupled to a motion of the C-linker which, in turn, modulates the

82 Conclusions
gating of the channel. The MD simulations provide also insights on the cytoplasmic
domains in the ligand free form, for which no structural information is available. CNBD
experiences a cascade of rearrangements of secondary structure elements, starting from
the binding pocket, as similarly described for the CNBDs of other different proteins.
Thus, MD simulations allow us to dissect aspects of the mechanism for cAMP allosteric
modulation in the HCN2 channel.
The last part of this thesis deals with the structure-based design of a NGF pep-
tide mimic with high affinity for its target receptor trkA. The simulations
suggest that the ACEHPIFGRGEFNME peptide may specifically bind with high affinity
to trkA, as most residues form stabilizing interactions with the target. Steered MD
calculations suggest that the strengths of the contacts between the peptide and trkA
are similar, with the exception of two salt bridges formed by the arginine and the
glutamate residues with the receptor. These interactions turned out to be the most
persistent, possibly because of the large flexibility and length of the side chains in-
volved, which can rearrange so as to maintain the electrostatic interactions despite
the increase of the peptide/receptor distance. Experiments will be performed in the
laboratory of Prof. Cattaneo to measure the actual efficacy of this peptide as a trkA
binder.
In conclusion, computational techniques have been applied to the study of a variety
of biological systems, providing insights into their structural, dynamic and energetic
features. The theoretical analysis gives information about conformational changes,
fluctuations and ligand binding affinities, complementary to the strctural information
obtained by X-ray crystallography.

List of Figures
2.1 Domains of an HCN channel subunit . . . . . . . . . . . . . . . . . . . 162.2 Neurotrophins and receptors . . . . . . . . . . . . . . . . . . . . . . . . 18
3.1 Pairwise terms of the MD potential energy . . . . . . . . . . . . . . . . 253.2 Periodic boundary conditions . . . . . . . . . . . . . . . . . . . . . . . 293.3 Elastic network model . . . . . . . . . . . . . . . . . . . . . . . . . . . 39
4.1 Structures of CAP . . . . . . . . . . . . . . . . . . . . . . . . . . . . . 464.2 Plots of CAP . . . . . . . . . . . . . . . . . . . . . . . . . . . . . . . . 494.3 Structures of CAP (2) . . . . . . . . . . . . . . . . . . . . . . . . . . . 514.4 CAP electrostatics properties . . . . . . . . . . . . . . . . . . . . . . . 534.5 Plots of CAP (2) . . . . . . . . . . . . . . . . . . . . . . . . . . . . . . 54
5.1 MD of HCN2 . . . . . . . . . . . . . . . . . . . . . . . . . . . . . . . . 585.2 Plots of HCN2 . . . . . . . . . . . . . . . . . . . . . . . . . . . . . . . . 615.3 Projection of the first EM . . . . . . . . . . . . . . . . . . . . . . . . . 625.4 EM-MD and NM-βGM eigenvalues . . . . . . . . . . . . . . . . . . . . 62
6.1 NGF/trkA-d5 complex . . . . . . . . . . . . . . . . . . . . . . . . . . . 696.2 RMSD plots . . . . . . . . . . . . . . . . . . . . . . . . . . . . . . . . . 776.3 Steered MD . . . . . . . . . . . . . . . . . . . . . . . . . . . . . . . . . 786.4 Steered MD - test calculation . . . . . . . . . . . . . . . . . . . . . . . 79
List of Tables
4.1 CAP MD systems . . . . . . . . . . . . . . . . . . . . . . . . . . . . . . 454.2 CAP crystal packing contacts . . . . . . . . . . . . . . . . . . . . . . . 48
6.1 MD systems . . . . . . . . . . . . . . . . . . . . . . . . . . . . . . . . . 726.2 N-term@NGF/trkA-d5 interactions (1) . . . . . . . . . . . . . . . . . . 746.3 N-term@NGF/trkA-d5 interactions (2) . . . . . . . . . . . . . . . . . . 75


Bibliography
[1] Cheatham TE 3rd and Kollman PA. Molecular dynamics simulation of nucleic acids.Annu Rev Phys Chem, 51:435–471, 2000.
[2] Sansom MS, Shrivastava IH, Bright JN, Tate J, Capener CE, and Biggin PC. Potassiumchannels: structures, models, simulations. Biochim Biophys Acta, 1565(2):294–307,2002.
[3] Hansson T, Oostenbrink C, and van Gunsteren W. Molecular dynamics simulations.Curr Opin Struct Biol, 12(2):190–196, 2002.
[4] Karplus M and McCammon JA. Molecular dynamics simulations of biomolecules. NatStruct Biol, 9(9):646–652, 2002.
[5] Karplus M. Molecular dynamics simulations of biomolecules. Acc Chem Res, 35(6):321–323, 2002.
[6] Domene C, Bond PJ, and Sansom MS. Membrane protein simulations: ion channelsand bacterial outer membrane proteins. Adv Protein Chem, 66:159–193, 2003.
[7] Bond PJ and Sansom MS. The simulation approach to bacterial outer membraneproteins. Mol Membr Biol, 21:151–161, 2004.
[8] S A Adcock and J A McCammon. Molecular dynamics: survey of methods for simu-lating the activity of proteins. Chem Rev, 106(5):1589–1615, 2006.
[9] C Micheletti, P Carloni, and A Maritan. Accurate and efficient description of proteinvibrational dynamics: comparing molecular dynamics and gaussian models. Proteins,55:635–645, 2004.
[10] Wong CF and McCammon JA. Protein flexibility and computer-aided drug design.Annu Rev Pharmacol Toxicol, 43:31–45, 2003.
[11] Gervasio FL, Laio A, and Parrinello M. Flexible docking in solution using metadynam-ics. J Am Chem Soc, 127(8):2600–2607, 2005.
[12] Sansom MS. Models and simulations of ion channels and related membrane proteins.Curr Opin Struct Biol, 8:237–244, 1998.
[13] CE Capener, HJ Kim, Y Arinaminpathy, and MS Sansom. Ion channels: structuralbioinformatics and modelling. Hum Mol Genet, 11:2425–2433, 2002.
[14] A Giorgetti and P Carloni. Molecular modeling of ion channels: structural predictions.Curr Opin Chem Biol, 7:150–156, 2003.

86 BIBLIOGRAPHY
[15] Beckstein O, Biggin PC, Bond P, Bright JN, Domene C, Grottesi A, Holyoake J,and Sansom MS. Ion channel gating: insights via molecular simulations. FEBS Lett,555(1):85–90, 2003.
[16] Oldziej S, Czaplewski C, Liwo A, Chinchio M, Nanias M, Vila JA, Khalili M, ArnautovaYA, Jagielska A, Makowski M, Schafroth HD, Kazmierkiewicz R, Ripoll DR, Pillardy J,Saunders JA, Kang YK, Gibson KD, and Scheraga HA. Physics-based protein-structureprediction using a hierarchical protocol based on the unres force field: assessment intwo blind tests. Proc Natl Acad Sci U S A, 102(21):7547–7552, 2005.
[17] Bond PJ and Sansom MS. Insertion and assembly of membrane proteins via simulation.J Am Chem Soc, 128:2697–2704, 2006.
[18] Johnston JM, Cook GA, Tomich JM, and Sansom MS. Conformation and environmentof channel-forming peptides: a simulation study. Biophys J, 90:1855–1864, 2006.
[19] Arkhipov A, Freddolino PL, Imada K, Namba K, and Schulten K. Coarse-grainedmolecular dynamics simulations of a rotating bacterial flagellum. Biophys J, 2006.
[20] Pellarin R and Caflisch A. Interpreting the aggregation kinetics of amyloid peptides. JMol Biol, 360:882–892, 2006.
[21] Balaeff A, Mahadevan L, and Schulten K. Modeling DNA loops using the theory ofelasticity. Phys Rev E, 73:031919, 2006.
[22] H M Berman, J Westbrook, Z Feng, G Gilliland, T N Bhat, H Weissig, I N Shindyalov,and P E Bourne. The Protein Data Bank. Nucleic Acids Research, 28:235–242, 2000.
[23] J M Passner, S C Schultz, and T A Steitz. Modeling the cAMP-induced allosterictransition using the crystal structure of CAP-cAMP at 2.1 A resolution. J Mol Biol,304:847–859, 2000.
[24] Piana S, Carloni P, and Parrinello M. Role of conformational fluctuations in the enzy-matic reaction of hiv-1 protease. J Mol Biol, 319(2):567–583, 2002.
[25] Pang A, Arinaminpathy Y, Sansom MS, and Biggin PC. Comparative moleculardynamics–similar folds and similar motions? Proteins, 61(4):809–822, 2005.
[26] Carnevale V and Carloni P Raugei Sand Micheletti C and. Convergent dynamics inthe protease enzymatic superfamily. J Am Chem Soc, 128(30):9766–9772, 2006.
[27] WN Zagotta, NB Olivier, KD Black, EC Young, R Olson, and E Gouaux. Struc-tural basis for modulation and agonist specificity of HCN pacemaker channels. Nature,425:200–205, 2003.
[28] C Wiesmann, MH Ultsch, SH Bass, and AM de Vos. Crystal structure of nervegrowth factor in complex with the ligand-binding domain of the TrkA receptor. Nature,401:184–188, 1999.
[29] J L Botsford and J G Harman. Cyclic amp in prokaryotes. Microbiol Rev, 56(1):100–122, 1992.
[30] Kolb A, Busby S, Buc H, Garges S, and Adhya S. Transcriptional regulation by cAMPand its receptor protein. Annu Rev Biochem, 62:749–795, 1993.

BIBLIOGRAPHY 87
[31] S Adhya, S Ryu, and S Garges. Role of allosteric changes in cyclic AMP receptorprotein function. Subcell Biochem, 24:303–321, 1995.
[32] J G Harman. Allosteric regulation of the cAMP receptor protein. Biochim BiophysActa, 1547:1–17, 2001.
[33] Lawson CL, Swigon D, Murakami KS, Darst SA, Berman HM, and Ebright RH. Catabo-lite activator protein: DNA binding and transcription activation. Curr Opin StructBiol, 14:10–20, 2004.
[34] S Garges and S Adhya. Sites of allosteric shift in the structure of the cyclic AMPreceptor protein. Cell, 41:745–751, 1985.
[35] Scott SP and Jarjous S. Proposed structural mechanism of Escherichia coli cAMPreceptor protein cAMP-dependent proteolytic cleavage protection and selective andnonselective DNA binding. Biochemistry, 44:8730–8748, 2005.
[36] Krakow JS and Pastan I. Cyclic adenosine monophosphate receptor: loss of cAMP-dependent DNA binding activity after proteolysis in the presence of cyclic adenosinemonophosphate. Proc Natl Acad Sci U S A, 70:2529–2533, 1973.
[37] Busby S and Ebright RH. Transcription activation by catabolite activator protein(CAP). J Mol Biol, 293:199–213, 1999.
[38] Heyduk T and Lee JC. Escherichia coli cAMP receptor protein: evidence for threeprotein conformational states with different promoter binding affinities. Biochemistry,28:6914–6924, 1989.
[39] Heyduk T and Lee J C. Application of fluorescence energy transfer and polarizationto monitor escherichia coli cAMP receptor protein and lac promoter interaction. ProcNatl Acad Sci U S A, 87:1744–1748, 1990.
[40] Chattopadhyay R and Parrack P. Cyclic AMP-dependent functional forms of cyclicAMP receptor protein from Vibrio cholerae. Arch Biochem Biophys, 2006.
[41] J M Passner and T A Steitz. The structure of a CAP-DNA complex having two cAMPmolecules bound to each monomer. Proc Natl Acad Sci U S A, 94:2843–2847, 1997.
[42] Lin SH and Lee JC. Communications between the high-affinity cyclic nucleotide bindingsites in E. coli cyclic AMP receptor protein: effect of single site mutations. Biochemistry,41:11857–11867, 2002.
[43] S C Schultz, G C Shields, and T A Steitz. Crystal structure of a CAP-DNA complex:the DNA is bent by 90 degrees. Science, 253:1001–1007, 1991.
[44] Chen S, Gunasekera A, Zhang X, Kunkel TA, Ebright RH, and Berman HM. Indirectreadout of DNA sequence at the primary-kink site in the CAP-DNA complex: alterationof DNA binding specificity through alteration of DNA kinking. J Mol Biol, 314:75–82,2001.
[45] Lanzilotta WN, Schuller DJ, Thorsteinsson MV, Kerby RL, Roberts GP, and PoulosTL. Structure of the CO sensing transcription activator CooA. Nat Struct Biol, 7:876–880, 2000.

88 BIBLIOGRAPHY
[46] H M Berman, L F Ten Eyck, D S Goodsell, N M Haste, A Kornev, and S S Taylor.The cAMP binding domain: an ancient signaling module. Proc Natl Acad Sci U S A,102:45–50, 2005.
[47] S Pantano, M Zaccolo, and P Carloni. Molecular basis of the allosteric mechanism ofcAMP in the regulatory PKA subunit. FEBS Letters, 579:2679–2685, 2005.
[48] Berrera M, Pantano S, and Carloni P. cAMP modulation of the cytoplasmic domainin the HCN2 channel investigated by molecular simulation. Biophys J, 2006.
[49] Aiba H, Nakamura T, Mitani H, and Mori H. Mutations that alter the allosteric natureof cAMP receptor protein of Escherichia coli. EMBO J, 4:3329–3332, 1985.
[50] Kim J, Adhya S, and Garges S. Allosteric changes in the cAMP receptor protein ofEscherichia coli: hinge reorientation. Proc Natl Acad Sci U S A, 89:9700–9704, 1992.
[51] S Ryu, J Kim, S Adhya, and S Garges. Pivotal role of amino acid at position 138 inthe allosteric hinge reorientation of cAMP receptor protein. Proc Natl Acad Sci U SA, 90:75–79, 1993.
[52] N Baichoo and T Heyduk. Mapping conformational changes in a protein: applicationof a protein footprinting technique to cAMP-induced conformational changes in cAMPreceptor protein. Biochemistry, 36:10830–6, 1997.
[53] Krueger S, Gorshkova I, Brown J, Hoskins J, McKenney KH, and Schwarz FP. Deter-mination of the conformations of cAMP receptor protein and its T127L, S128A mutantwith and without cAMP from small angle neutron scattering measurements. J BiolChem, 273:20001–20006, 1998.
[54] Malecki J, Polit A, and Wasylewski Z. Kinetic studies of cAMP-induced allostericchanges in cyclic AMP receptor protein from Escherichia coli. J Biol Chem, 275:8480–8486, 2000.
[55] Won HS, Yamazaki T, Lee TW, Yoon MK, Park SH, Kyogoku Y, and Lee BJ. Structuralunderstanding of the allosteric conformational change of cyclic AMP receptor proteinby cyclic AMP binding. Biochemistry, 39:13953–13962, 2000.
[56] M. K. Chan. CooA, CAP and allostery. Nat Struct Biol, 7:822–824, 2000.
[57] Dong A, Malecki JM, Lee L, Carpenter JF, and Lee JC. Ligand-induced conforma-tional and structural dynamics changes in Escherichia coli cyclic AMP receptor protein.Biochemistry, 41:6660–6667, 2002.
[58] H Youn, R L Kerby, M Conrad, and G P Roberts. Study of Highly ConstitutivelyActive Mutants Suggests How cAMP Activates cAMP Receptor Protein. J Biol Chem,281(2):1119–1127, 2006.
[59] O G Berg and P H von Hippel. Selection of DNA binding sites by regulatory proteins.II. The binding specificity of cyclic AMP receptor protein to recognition sites. J MolBiol, 200(4):709–723, 1988.
[60] Kahn JD and Crothers DM. Protein-induced bending and DNA cyclization. Proc NatlAcad Sci U S A, 89:6343–6347, 1992.

BIBLIOGRAPHY 89
[61] Heyduk T and Lee JC. Solution studies on the structure of bent DNA in the cAMPreceptor protein-lac DNA complex. Biochemistry, 31:5165–5171, 1992.
[62] Kahn JD and Crothers DM. Measurement of the DNA bend angle induced by thecatabolite activator protein using Monte Carlo simulation of cyclization kinetics. J MolBiol, 276:287–309, 1998.
[63] Dixit S B, Andrews D Q, and Beveridge D L. Induced fit and the entropy of struc-tural adaptation in the complexation of CAP and lambda-repressor with cognate DNAsequences. Biophys J, 88:3147–3157, 2005.
[64] Dixit S B and Beveridge D L. Axis curvature and ligand induced bending in theCAP-DNA oligomers. Biophys J, 88:L04–L06, 2005.
[65] W K Olson, A A Gorin, X J Lu, L M Hock, and V B Zhurkin. Dna sequence-dependentdeformability deduced from protein-dna complexes. Proc Natl Acad U S A, 95:11163–11168, 1998.
[66] Y Zhou, X Zhang, and R H Ebright. Identification of the activating region of catabolitegene activator protein (CAP): isolation and characterization of mutants of CAP specifi-cally defective in transcription activation. Proc Natl Acad Sci U S A, 90(13):6081–6085,1993.
[67] R Jin, K A Sharif, and J S Krakow. Evidence for contact between the cyclic AMPreceptor protein and the delta 70 subunit of Escherichia coli RNA polymerase. J BiolChem, 270(33):19213–19216, 1995.
[68] W Niu, Y Kim, G Tau, T Heyduk, and R H Ebright. Transcription activation at classII CAP-dependent promoters: two interactions between CAP and RNA polymerase.Cell, 87(6):1123–1134, 1996.
[69] L Sogaard-Andersen, A S Mironov, H Pedersen, W Sukhodelets, and P Valentin-Hansen. Single amino acid substitutions in the cAMP receptor protein specificallyabolish regulation by the CytR repressor in Escherichia coli. Proc Natl Acad Sci U SA, 88(11):4921–4925, 1991.
[70] N Baichoo and T Heyduk. DNA-induced conformational changes in cyclic AMP recep-tor protein: detection and mapping by a protein footprinting technique using multiplechemical proteases. J MolBiol, 290(1):37–48, 1999.
[71] J A Lefstin and K R Yamamoto. Allosteric effects of DNA on transcriptional regulators.Nature, 392(6679):885–888, 1998.
[72] B Hille. Ion channels of excitable membranes. Sunderland, Mass. Sinauer Associates,2001.
[73] W A Catterall. From ionic currents to molecular mechanisms: the structure and func-tion of voltage-gated sodium channels. Neuron, 26:13–25, 2000.
[74] Z Sands, A Grottesi, and M S Sansom. Voltage-gated ion channels. Curr Biol, 15(2):44–47, 2005.
[75] F Bezanilla. Voltage-gated ion channels. IEEE Trans Nanobioscience, 4(1):34–48, 2005.

90 BIBLIOGRAPHY
[76] G Chang, R H Spencer, A T Lee, M T Barclay, and D C Rees. Structure of the MscL ho-molog from Mycobacterium tuberculosis: a gated mechanosensitive ion channel. Scince,282:2220–2226, 1998.
[77] J Bradley, J Reisert, and S Frings. Regulation of cyclic nucleotide-gated channels. CurrOpin Neurobiol, 15(3):343–349, 2005.
[78] K Matulef and W N Zagotta. Cyclic nucleotide-gated ion channels. Annu Rev Cell DevBiol, 19:23–44, 2003.
[79] L G Cuello, J G Romero, D M Cortes, and E Perozo. pH-dependent gating in theStreptomyces lividans K+ channel. Biochemistry, 37:3229–3236, 1998.
[80] B Corry and S H Chung. Mechanisms of valence selectivity in biological ion channels.Cell Mol Life Sci, 63(3):301–315, 2006.
[81] T J Jentsch, W Gunther, M Pusch, and B Schwappach. Properties of voltage-gatedchloride channels of the ClC gene family. J. Physiol, 482:19S–25S, 1995.
[82] A HStam, J Haan, R R Frants, M D Ferrari, and A M van den Maagdenberg. Migraine:new treatment options from molecular biology. Expert Rev Neurother, 5(5):653–661,2005.
[83] A L Jr George. Inherited disorders of voltage-gated sodium channels. J Clin Invest,115(8):1990–1999, 2005.
[84] D Corrado, C Basso, and G Thiene. Is it time to include ion channel diseases amongcardiomyopathies? J Electrocardiol, 38(4 Suppl):81–87, 2005.
[85] J C Mulley, I E Scheffer, L A Harkin, S F Berkovic, and L M Dibbens LM. Susceptibilitygenes for complex epilepsy. Hum Mol Genet, 14(Spec No 2):243–249, 2005.
[86] M Shah, F G Akar, and G F Tomaselli GF. Molecular basis of arrhythmias. Circulation,112(16):2517–2529, 2005.
[87] R Roberts and R Brugada. Genetics and arrhythmias. Annu Rev Med, 54:257–267,2003.
[88] S F Berkovic and I E Scheffer. Genetics of the epilepsies. Epilepsia, 42(Suppl 5):16–23,2001.
[89] P Mistrik, R Mader, S Michalakis, M Weidinger, A Pfeifer, and M Biel. The murineHCN3 gene encodes a hyperpolarization-activated cation channel with slow kineticsand unique response to cyclic nucleotides. J Biol Chem, 280:27056–27061, 2005.
[90] X Yu, KL Duan, CF Shang, HG Yu, and Z Zhou. Calcium influx throughhyperpolarization-activated cation channels (I(h) channels) contributes to activity-evoked neuronal secretion. Proc Natl Acad Sci U S A, 101:1051–1056, 2004.
[91] T Rosenbaum and S E Gordon. Quickening the pace: looking into the heart of HCNchannels. Neuron, 42:193–196, 2004.

BIBLIOGRAPHY 91
[92] J Stieber, S Herrmann, S Feil, J Loster, R Feil, M Biel, F Hofmann, and A Ludwig. Thehyperpolarization-activated channel HCN4 is required for the generation of pacemakeraction potentials in the embryonic heart. Proc Natl Acad Sci U S A, 100:15235–15240,2003.
[93] R B Robinson and S A Siegelbaum. Hyperpolarization-activated cation currents: frommolecules to physiological function. Annu Rev Physiol, 65:453–480, 2003.
[94] M Biel, A Schneider, and C Wahl. Cardiac HCN channels: structure, function, andmodulation. Trends Cardiovasc Med, 12:206–212, 2002.
[95] J Chen, DR Piper, and MC Sanguinetti. Voltage sensing and activation gating of HCNpacemaker channels. Trends in Cardiovascular Medicine, 12:42–45, 2002.
[96] EA Accili, C Proenza, M Baruscotti, and D DiFrancesco. From funny current to HCNchannels: 20 years of excitation. News Physiol Sci, 17:32–37, 2002.
[97] LY Jan and YN Jan. A superfamily of ion channels. Nature, 345:672, 1990.
[98] D DiFrancesco and P Tortora. Direct activation of cardiac pacemaker channels byintracellular cyclic AMP. Nature, 351:145–147, 1991.
[99] A Ludwig, X Zong, M Jeglitsch, F Hofmann, and M Biel. A family of hyperpolarization-activated mammalian cation channels. Nature, 393:587–591, 1998.
[100] B Santoro and G R Tibbs. The HCN gene family: molecular basis of thehyperpolarization-activated pacemaker channels. Ann N Y Acad Sci, 868:741–764,1999.
[101] R Seifert, A Scholten, R Gauss, A Mincheva, P Lichter, and U B Kaupp. Molecularcharacterization of a slowly gating human hyperpolarization-activated channel predom-inantly expressed in thalamus, heart, and testis. Proc Natl Acad Sci U S A, 96:9391–9396, 1999.
[102] A Ludwig, X Zong, F Hofmann, and M Biel. Structure and function of cardiac pace-maker channels. Cell Physiol Biochem, 9:179–186, 1999.
[103] BJ Wainger, M DeGennaro, B Santoro, SA Siegelbaum, and GR Tibbs. Molecularmechanism of cAMP modulation of HCN pacemaker channels. Nature, 411:805–810,2001.
[104] J Wang, S Chen, and SA Siegelbaum. Regulation of hyperpolarization-activated HCNchannel gating and cAMP modulation due to interactions of COOH terminus and coretransmembrane regions. J Gen Physiol, 118:237–250, 2001.
[105] D DiFrancesco. Pacemaker mechanisms in cardiac tissues. Annu. Rev. Physiol., 55:455–472, 1993.
[106] H Pape. Queer current and pacemaker: the hyperpolarization-activated cation currentsin neurons. Annu. Rev. Physiol., 58:299–327, 1996.
[107] H Brown and W Ho. The hyperpolarization-activated inward channel and cardiac pace-maker activity. Kluwer, Dordrecht, The Netherlands, molecular physiology and phar-macology of cardiac ion channels and transporters edition, 1996. 17-30.

92 BIBLIOGRAPHY
[108] J Halliwell and P Adams. Voltage-clamp analysis of muscarinic excitation in hippocam-pal neurons. Brain. Res., 250:71–92, 1982.
[109] A Noma and H Irisawa. Membrane currents in the rabbit sinoatrial node cell as studiedby the double microelectrode method. Pflugers Arch., 364:45–52, 1976.
[110] H F Brown, D DiFrancesco, and S J Noble. How does adrenaline accelerate the heart?Nature, 280:235–236, 1979.
[111] D Clapham. Not so funny anymore: pacing channels are cloned. Neuron, 21:5, 1998.
[112] L Wollmuth and B Hille. Ionic selectivity of ih channels of rod photoreceptors in tigersalamanders. J. Gen. Physiol ., 100:749–765, 1992.
[113] W Ho, H Brown, and D Noble. High selectivity of the If channels to Na+ and K+ inrabbit isolated sinoatrial node cells. Pflugers Arch., 426:68–74, 1994.
[114] G Fain, F Quandt, B Bastian, and H M Gerschenfeld. Contribution of a cesium-sensitiveconductance increase to the rod photoresponse. Nature, 272:466–469, 1978.
[115] S Chen, J Wang, and S A Siegelbaum. Properties of hyperpolarization-activated pace-maker current defined by coassembly of HCN1 and HCN2 subunits and basal modula-tion by cyclic nucleotide. J Gen Physiol, 117(5):491–504, 2001.
[116] U B Kaupp and R Seifert. Molecular diversity of pacemaker ion channels. Annu RevPhysiol, 63:235–257, 2001.
[117] R Gauss, R Seifert, and U B Kaupp. Molecular identification of a hyperpolarization-activated channel in sea urchin sperm. Nature, 393(6685):583–587, 1998.
[118] J Krieger, J Strobel, A Vogl, W Hanke, and H Breer. Identification of a cyclicnucleotide- and voltage-activated ion channel from insect antennae. Insect BiochemMol Biol, 29(3):255–267, 1999.
[119] T Marx, G Gisselmann, K F Strtkuhl, B T Hovemann, and H Hatt. Molecular cloningof a putative voltage- and cyclic nucleotide-gated ion channel present in the antennaeand eyes of Drosophila melanogaster. Invertebrate Neuroscience, 4(1):55–63, 1999.
[120] G Gisselmann, M Warnstedt, B Gamerschlag, A Bormann, T Marx, E M Neuhaus,K Stoertkuhl, C H Wetzel, and H Hatt. Characterization of recombinant and nativeIh-channels from Apis mellifera. Insect Biochem Mol Biol, 33(11):1123–1134, 2003.
[121] JP Jr Johnson and WN Zagotta. The carboxyl-terminal region of cyclic nucleotide-modulated channels is a gating ring, not a permeation path. Proc Natl Acad Sci U SA, 102:2742–2747, 2005.
[122] GM Clayton, WR Silverman, L Heginbotham, and JH Morais-Cabral. Structural basisof ligand activation in a cyclic nucleotide regulated potassium channel. Cell, 119:615–627, 2004.
[123] SS Taylor, J Yang, J Wu, NM Haste, E Radzio-Andzelm, and G Anand. PKA: aportrait of protein kinase dynamics. Biochim Biophys Acta, 1697:259–269, 2004.

BIBLIOGRAPHY 93
[124] J Wu, S Brown, NH Xuong, and SS Taylor. RI-alpha subunit of PKA: a cAMP-freestructure reveals a hydrophobic capping mechanism for docking cAMP into site B.Structure (Camb), 12:1057–1065, 2004.
[125] H Rehmann, B Prakash, E Wolf, A Rueppel, J De Rooij, J L Bos, and A Wittinghofer.Structure and regulation of the cAMP-binding domains of Epac2. Nat Struct Biol,10:26–32, 2003.
[126] T C Diller, N H Madhusudan Xuong, and S S Taylor. Molecular basis for regulatorysubunit diversity in cAMP-dependent protein kinase: crystal structure of the type IIbeta regulatory subunit. Structure (Camb), 9:73–82, 2001.
[127] Y Su, WR Dostmann, FW Herberg, K Durick, NH Xuong, L Ten Eyck, SS Taylor, andKI Varughese. Regulatory subunit of protein kinase A: structure of deletion mutantwith cAMP binding domains. Science, 269:807–813, 1995.
[128] G R Lewin and Y A Barde. Physiology of the neurotrophins. Annu Rev Neurosci,19:289–317, 1996.
[129] M Bibel and Y A Barde YA. Neurotrophines: key regulators of cell fate and cell shapein the vertebrate nervous system. Genes and Develpment, 14:2919–2937, 2000.
[130] R. Kalb. The protean actions of neurotrophins and their receptors on the life and deathof neurons. Trends Neurosci, 28:5–11, 2005.
[131] Dechant G and Neumann H. Neurotrophins. Adv Exp Med Biol, 513:303–334, 2002.
[132] J M Frade and Y A Barde. Nerve growth factor: two receptors, multiple functions.Bioessays, 20:137–145, 1998.
[133] Chao M, Casaccia-Bonnefil P, Carter B, Chittka A, Kong H, and Yoon SO. Neu-rotrophin receptors: mediators of life and death. Brain Res Brain Res Rev, 26:295–301,1998.
[134] Patapoutian A and Reichardt LF. Trk receptors: mediators of neurotrophin action.Curr. opinion Neurobiol., 11:272–280, 2001.
[135] E J Huang and L F Reichardt. Trk receptors: roles in neuronal signal transduction.Annu Rev Biochem, 72:609–642, 2003.
[136] D R Kaplan, B L Hempstead, D Martin-Zanca, M V Chao, and L F Parada. The trkproto-oncogene product: a signal transducing receptor for nerve growth factor. Science,252:554–558, 1991.
[137] R Klein, SQ Jing, V Nanduri, E O’Rourke, and M Barbacid. The trk proto-oncogeneencodes a receptor for nerve growth factor. Cell, 65:189–197, 1991.
[138] M Barbacid. The trk family of neurotrophin receptors. J Neurobiol, 11:1386–1403,1994.
[139] R Levi-Montalcini. The nerve growth factor: its mode of action on sensory and sym-pathetic nerve cells. Harvey Lect, 60:217–259, 1966.

94 BIBLIOGRAPHY
[140] R A Bradshaw, T L Blundell, R Lapatto, N Q McDonald, and J Murray-Rust. Nervegrowth factor revisited. Trends Biochem Sci., 18:48–52, 1993.
[141] C Wiesmann and A M De Vos. Nerve growth factor: structure and function. Cell. Mol.Life Sci., 58:748–759, 2001.
[142] A. Brancucci, N. Kuczewski, S. Covaceuszach, A. Cattaneo, and L. Domenici. Nervegrowth factor favours long-term depression over long-term potentiation in layer II-IIIneurones of rat visual cortex. J Physiol, 559:497–506, 2004.
[143] R Levi-Montalcini and B Booker. Destruction of the sympathetic ganglia in mammalsby an antiserum to a nerve-growth protein. PNAS Proceedings of the National Academyof Sciences USA, 46:384–391, 1960.
[144] P U Angeletti, R Levi-Montalcini, and F Caramia. Ultrastructural changes in sympa-thetic neurons of newborn and adult mice treated with nerve growth factor. J Ultra-struct Res, 36(1):24–36, 1971.
[145] R Levi-Montalcini, R Dal Toso, F della Valle, S D Skaper, and A Leon. Update of theNGF saga. J Neurol Sci, 130(2):119–127, 1995.
[146] P Calissano, A Cattaneo, S Biocca, L Aloe, D Mercanti, and R Levi-Montalcini. Thenerve growth factor. established findings and controversial aspects. Exp Cell Res,154(1):1–9, 1984.
[147] A J Reynolds, S E Bartlett, and I A Hendry. Molecular mechanisms regulating theretrograde axonal transport of neurotrophins. Brain Res Brain Res Rev, 33(2-3):169–178, 2000.
[148] K E Neet and R B Campenot. Receptor binding, internalization, and retrograde trans-port of neurotrophic factors. Cell Mol Life Sci, 58:1021–1035, 2001.
[149] D E Timm and K E Neet. Equilibrium denaturation studies of mouse beta-nerve growthfactor. Protein Sci, 1:236–244, 1992.
[150] N Q McDonald, R Lapatto, J Murray-Rust, J Gunning, A Wlodawer, and T L Blundell.New protein fold revealed by a 2.3-A resolution crystal structure of nerve growth factor.Nature, 354(6352):411–414, 1991.
[151] K K Teng and B L Hempstead. Neurotrophins and their receptors: signaling trios incomplex biological systems. Cell Mol Life Sci, 61:35–48, 2004.
[152] M V Chao. Neurotrophins and their receptors: a convergence point for many signallingpathways. Nat Rev Neurosci, 4:299–309, 2003.
[153] M V Chao, M A Bothwell, A H Ross, H Koprowski, A A Lanahan, C R Buck, andA Sehgal. Gene transfer and molecular cloning of the human NGF receptor. Science,232:518–521, 1986.
[154] B L Hempstead, D Martin-Zanca, D R Kaplan, L F Parada, and M V Chao. High-affinity NGF binding requires coexpression of the trk proto-oncogene and the low-affinity NGF receptor. Nature, 350:678–683, 1991.

BIBLIOGRAPHY 95
[155] R Lee, P Kermani, K K Teng, and B L Hempstead. Regulation of cell survival bysecreted proneurotrophins. Science, 294:1945–1948, 2001.
[156] B L Hempstead. The many faces of p75NTR. Current Opinion in Neurobiology, 12:260–267, 2002.
[157] Urfer R, Tsoulfas P, O’Connell L, Hongo JA, Zhao W, and Presta LG. High resolutionmapping of the binding site of TrkA for nerve growth factor and TrkC for neurotrophin-3on the second immunoglobulin-like domain of the Trk receptors. J Biol Chem, 273:5829–5840, 1998.
[158] P Kahle, L E Burton, C H Schmelzer, and C Hertel. The amino terminus of nervegrowth factor is involved in the interaction with the receptor tyrosine kinase p140trkA.J Biol Chem, 267:22707–22710, 1992.
[159] C F Ibanez, L L Ilag, J Murray-Rust, and H Persson. An extended surface of bind-ing to trk tyrosine kinase receptors in NGF and BDNF allows the engineering of amultifunctional pan-neurotrophin. EMBO J, 12:2281–2293, 1993.
[160] Shih A, Laramee GR, Schmelzer CH, Burton LE, and Winslow JW. Mutagenesisidentifies amino-terminal residues of nerve growth factor necessary for trk receptorbinding and biological activity. J Biol Chem, 269:27679–27686, 1994.
[161] Treanor JJ, Schmelzer C, Knusel B, Winslow JW, Shelton DL, Hefti F, Nikolics K, andBurton LE. Heterodimeric neurotrophins induce phosphorylation of trk receptors andpromote neuronal differentiation in PC12 cells. J Biol Chem, 270:23104–23110, 1995.
[162] N Q McDonald and M V Chao. Structural determinants of neurotrophin action. J BiolChem, 270:19669–19672, 1995.
[163] C McInnes and B D Sykes. Growth factor receptors: strcture, mechanism and drugdiscovery. Biopolymers, 43:339–366, 1997.
[164] M J Banfield, R L Naylor, A G Robertson, S J Allen, D Dawbarn, and R L Brady.Specificity in Trk receptor:neurotrophin interactions: the crystal structure of TrkB-d5in complex with neurotrophin-4/5. Structure, 9:1191–1199, 2001.
[165] G Settanni, A Cattaneo, and P Carloni. Molecular dynamics simulations of the NGF-TrkA domain 5 complex and comparison with biological data. Biophys J, 84:2282–2292,2003.
[166] D R Holland, L S Cousens, W Meng, and B W Matthews. Nerve growth factor indifferent crystal forms displays structural flexibility and reveals zinc binding sites. JMol Biol, 239(3):385–400, 1994.
[167] F Hefti. Pharmacology of neurotrophic factors. Annu. Rev. Pharmacol. Toxicol.,37:239–267, 1997.
[168] T Hagg, M Manthorpe, H L Vahlsing, and S Varon. Delayed treatment with nervegrowth factor reverses the apparent loss of cholinergic neurons after acute brain damage.Exp Neurol, 101:303–312, 1988.

96 BIBLIOGRAPHY
[169] Apfel SC, Kessler JA, Adornato BT, Litchy WJ, Sanders C, and Rask CA. Recombinanthuman nerve growth factor in the treatment of diabetic polyneuropathy. NGF studygroup. Neurology, 51:695–702, 1998.
[170] M E Jonhagen. Nerve growth factor treatment in dementia. Alzheimer Dis AssocDisord, 14 Suppl 1:31–38, 2000.
[171] M. H. Tuszynski, L. Thal, M. Pay, D. P. Salmon, H. S. U, R. Bakay, P. Patel, A. Blesch,H. L. Vahlsing, G. Ho, G. Tong, S. G. Potkin, J. Fallon, L. Hansen, E. J. Mufson, J. H.Kordower, C. Gall, and J. Conner. A phase 1 clinical trial of nerve growth factor genetherapy for Alzheimer disease. Nature Medicine, 11:551–555, 2005.
[172] S. Capsoni, G. Ugolini, A. Comparini, F. Ruberti, N. Berardi, and A. Cattaneo.Alzheimer-like neurodegeneration in aged antinerve growth factor transgenic mice. ProcNatl Acad Sci U S A, 97:6826–6831, 2000.
[173] S. Capsoni, S. Giannotta, and A. Cattaneo. Nerve growth factor and galantamineameliorate early signs of neurodegeneration in anti-nerve growth factor mice. Proc NatlAcad Sci U S A, 99:12432–12437, 2002.
[174] R. De Rosa, A. A. Garcia, C. Braschi, S. Capsoni, L. Maffei, N. Berardi, and A. Catta-neo. Intranasal administration of nerve growth factor (NGF) rescues recognition mem-ory deficits in AD11 anti-NGF transgenic mice. Proc Natl Acad Sci U S A, 102:3811–3816, 2005.
[175] K. G. Halvorson, K. Kubota, M. A. Sevcik, T. H. Lindsay, J. E. Sotillo, J. R. Ghilardi,T. J. Rosol, L. Boustany, D. L. Shelton, and P. W. Mantyh. A blocking antibody tonerve growth factor attenuates skeletal pain induced by prostate tumor cells growingin bone. Cancer Res, 65:9426–9435, 2005.
[176] Poduslo JF and Curran GL. Permeability at the blood-brain and blood-nerve barriersof the neurotrophic factors: NGF, CNTF, NT-3, BDNF. Brain Res Mol Brain Res,36:280–286, 1996.
[177] F. F. Hefti, A. Rosenthal, P. A. Walicke, S. Wyatt, G. Vergara, D. L. Shelton, and A. M.Davies. Novel class of pain drugs based on antagonism of NGF. Trends Pharmacol Sci,27:85–91, 2005.
[178] Saragovi HU, Greene MI, Chrusciel RA, and Kahn M. Loops and secondary structuremimetics: development and applications in basic science and rational drug design.Biotechnology (N Y), 10:773–778, 1992.
[179] H U Saragovi and K Gehring. Development of pharmacological agents for targetingneurotrophins and their receptors. Trends Pharmacol Sci, 21:93–98, 2000.
[180] S J Pollack and S J Harper. Small molecule trk receptor agonists and other neurotrophicfactor mimetics. Curr Drug Target CNS Neurol Disord, 1:59–80, 2002.
[181] S M Massa, Y Xie, and F M Longo. Alzheimer’s therapeutics: neurotrophin domainsmall molecule mimetics. J Mol Neurosci, 20:323–326, 2003.

BIBLIOGRAPHY 97
[182] L LeSauteur, L Wei, B F Gibbs, and H U Saragovi. Small peptide mimics of nervegrowth factor bind TrkA receptors and affect biological responses. J Biol Chem,270:6564–6569, 1995.
[183] L LeSauteur, N K Cheung, R Lisbona, and H U Saragovi. Small molecule nerve growthfactor analogs image receptors in vivo. Nat Biotechnol, 14:1120–1122, 1996.
[184] Xie Y, Tisi MA, Yeo TT, and Longo FM. Nerve growth factor (NGF) loop 4 dimericmimetics activate ERK and AKT and promote NGF-like neurotrophic effects. J BiolChem, 275:29868–29874, 2000.
[185] N Beglova, S Maliartchouk, I Ekiel, M C Zaccaro, H U Saragovi, and K Gehring. Designand solution structure of functional peptide mimetics of nerve growth factor. J MedChem, 43:3530–3540, 2000.
[186] S Maliartchouk, Y Feng, L Ivanisevic, T Debeir, A C Cuello, K Burgess, and H USaragovi. A designed peptidomimetic agonistic ligand of TrkA nerve growth factorreceptors. Mol Pharmacol, 57:385–391, 2000.
[187] S Maliartchouk, T Debeir, N Beglova, A C Cuello, K Gehring, and H U Saragovi.Genuine monovalent ligands of TrkA nerve growth factor receptors reveal a novel phar-macological mechanism of action. J Biol Chem, 275:9946–9956, 2000.
[188] M. C. Zaccaro, H. B. Lee, M. Pattarawarapan, Z. Xia, A. Caron, P. J. L’Heureux,Y. Bengio, K. Burgess, and H. U. Saragovi. Selective small molecule peptidomimeticligands of TrkC and TrkA receptors afford discrete or complete neurotrophic activities.Chem Biol, 12:1015–1028, 2005.
[189] F Fogolari, A Brigo, and H Molinari. The Poisson-Boltzmann equation for biomolecularelectrostatics: a tool for structural biology. J. Mol. Recognit., 15:377–392, 2002.
[190] T. Kortemme and D. Baker. A simple physical model for binding energy hot spots inprotein-protein complexes. Proc Natl Acad Sci U S A, 99:14116–14121, 2002.
[191] T. Kortemme, D. E. Kim, and D. Baker. Computational alanine scanning of protein-protein interfaces. Sci. STKE, 2004:pl2, 2004.
[192] J Wang, P Cieplak, and PA Kollman. How well does a restrained electrostatic potential(RESP) model perform in calcluating conformational energies of organic and biologicalmolecules? J. Comput. Chem., 21:1049–1074, 2000.
[193] J W Ponder and D A Case. Force fields for protein simulations. Adv Protein Chem,66:27–85, 2003.
[194] WL Jorgensen, J Chandrasekhar, J Madura, and ML Klein. Comparison of simplepotential functions for simulating liquid water. J. Chem. Phys., 79:926–935, 1983.
[195] C I Bayly, P Cieplak, W D Cornell, and P A Kollman. A well-behaved electrostaticpotential based method using charge restraints for deriving atomic charges - The RESPmodel. J of Phys Chem, 97(40):10269–10280, 1993.
[196] W D Cornell, P Cieplak, C I Bayly, and P A Kollman. Application of RESP chargesto calculate conformational energies, hydrogen-bond energies, and free-energies of sol-vation. J of the American Chemical Society, 115(21):9620–9631, 1993.

98 BIBLIOGRAPHY
[197] E. Lindahl, B. Hess, and D. van der Spoel. Gromacs 3.0: A package for molecularsimulation and trajectory analysis. J. Mol. Mod., 7:306–317, 2001.
[198] W F van Gunsteren and H J C A Berendsen. A leap-frog algorithm for stochasticdynamics. Mol Sim, 1:173–185, 1988.
[199] B Hess, H Bekker, HJC Berendsen, and JGEM Fraaije. LINCS: A linear constraintsolver for molecular simulations. J of Comp Chem, 18:1463–1472, 1997.
[200] P Ewald. Die berechnung optischer und elektrostatischer gitterpotentiale. Ann Phys,64:253–287, 1921.
[201] C Sagui and TA Darden. Molecular dynamics simulations of biomolecules: long-rangeelectrostatic effects. Annu Rev Biophys Biomol Struct, 28:155–179, 1999.
[202] T Darden, D York, and L Pedersen. Particle mesh Ewald: an Nlog(N) method forEwald sums in large systems. J Chem Phys, 98:10089–10092, 1993.
[203] U Essmann, L Perera, ML Berkowitz, T Darden, H Lee, and LG Pedersen. A smoothparticle mesh Ewald method. J Chem Phys, 103:8577–8593, 1995.
[204] H J C Berendsen, J P M Postma, A DiNola, and J R Haak. Molecular dynamics withcoupling to an external bath. J. Chem. Phys., 81:3684–3690, 1984.
[205] S Nose and ML Klein. Constant pressure molecular dynamics for molecular systems.Mol. Phys., 50:1055–1076, 1983.
[206] S Nose. A molecular dynamics method for simulations in the canonical ensemble. Mol.Phys., 52:255–268, 1984.
[207] M Parrinello and A Rahman. Polymorphic transitions in single crystals: a new molec-ular dynamics approch. J. Appl. Phys., 52:7182–7190, 1981.
[208] D Bashford and D A Case. Generalized Born models of macromolecular solvationeffects. Annu Rev Phys Chem, 51:129–152, 2000.
[209] Tsui V and Case DA. Theory and applications of the generalized Born solvation modelin macromolecular simulations department of molecular biology. Biopolymers (NucleicAcid Sciences), 56:275–291, 2001.
[210] Still WK, Tempczyk A, Hawley RC, and Hendrickson T. Semianalytical treatment ofsolvation for molecular mechanics and dynamics. J. Am. Chem. Soc., 112:6127–6129,1990.
[211] H. Grubmuller, B. Heymann, and P. Tavan. Ligand binding: molecular mechanicscalculation of the streptavidin-biotin rupture force. Science, 271:997–999, 1996.
[212] B. Isralewitz, S. Izrailev, and K. Schulten. Binding pathway of retinal to bacterio-opsin:a prediction by molecular dynamics simulations. Biophys J, 73:2972–2979, 1997.
[213] S. Izrailev, S. Stepaniants, M. Balsera, Y. Oono, and K. Schulten. Molecular dynamicsstudy of unbinding of the avidin-biotin complex. Biophys J, 72:1568–1581, 1997.

BIBLIOGRAPHY 99
[214] B. Isralewitz, M. Gao, and K. Schulten. Steered molecular dynamics and mechanicalfunctions of proteins. Curr Opin Struct Biol, 11:224–230, 2001.
[215] D. Kosztin, S. Izrailev, and K. Schulten. Unbinding of retinoic acid from its receptorstudied by steered molecular dynamics. Biophys J, 76:188–197, 1999.
[216] M. V. Bayas, K. Schulten, and D. Leckband. Forced detachment of the CD2-CD58complex. Biophys J, 84:2223–2233, 2003.
[217] S. J. Marrink, O. Berger, P. Tieleman, and F. Jahnig. Adhesion forces of lipids in aphospholipid membrane studied by molecular dynamics simulations. Biophys J, 74:931–943, 1998.
[218] H. Grubmuller. Force probe molecular dynamics simulations. Methods Mol Biol,305:493–515, 2005.
[219] A. C. Lorenzo and P. M. Bisch. Analyzing different parameters of steered moleculardynamics for small membrane interacting molecules. J Mol Graph Model, 24:59–71,2005.
[220] B Lee and F M Richards. The interpretation of protein structures: estimation of staticaccessibility. J Mol Biol, 55:379–400, 1971.
[221] F Eisenhaber, P Lijnzaad, P Argos, C Sander, and M Scharf. The double cube latticemethod: Efficient approaches to numerical integration of surface area and volume andto dot surface contouring of molecular assemblies. J. Comp. Chem., 16:273–284, 1995.
[222] G Vriend. WHAT IF: a molecular modeling and drug design program. J Mol Graph,8:52–56, 1990.
[223] Sitkoff D, Sharp KA, and Honig B. Accurate calculation of hydration free energiesusing macroscopic solvent models. J.Phys.Chem., 98:1978–1988, 1994.
[224] R Kazmierkiewicz, C Czaplewski, B Lammek, and J Ciarkowski. Essential dynam-ics/factor analysis for the interpretation of molecular dynamics trajectories. J ComputAided Mol Des, 13:21–33, 1999.
[225] A Amadei, A B Linssen, and H J Berendsen. Essential dynamics of proteins. Proteins,17:412–425, 1993.
[226] T Ichiye and M Karplus. Collective motions in proteins: a covariance analysis of atomicfluctuations in molecular dynamics and normal mode simulations. Proteins, 11:205–217,1991.
[227] B Hess. Similarities between principal components of protein dynamics and randomdiffusion. Phys Rev E, 62:8438–8448, 2000.
[228] B Hess. Convergence of sampling in protein simulations. Phys Rev E, 65:031910, 2002.
[229] A R Atilgan, S R Durell, R L Jernigan, M C Demirel, O Keskin, and Bahar I. Anisotropyof fluctuation dynamics of proteins with an elastic network model. Biophys J, 80:505–515, 2001.

100 BIBLIOGRAPHY
[230] I Bahar, A R Atilgan, and B Erman. Direct evaluation of thermal fluctuations inproteins using a single-parameter harmonic potential. Fold Des, 2(3):173–181, 1997.
[231] P Doruker, R L Jernigan, and I Bahar. Dynamics of large proteins through hierarchicallevels of coarse-grained structures. J Comput Chem, 23(1):119–127, 2002.
[232] N A Baker, D Sept, S Joseph, M J Holst, and J A McCammon. Electrostatics ofnanosystems: application to microtubules and the ribosome. Proc Natl Acad Sci U SA, 98:10037–41, 2001.
[233] W. F. van Gunsteren and M. Karplus. Effect of constraints, solvent and crystal envi-ronment on protein dynamics. Nature, 293:677–678, 1981.
[234] A J Oakley, K V Loscha, P M Schaeffer, E Liepinsh, G Pintacuda, M C Wilce, G Otting,and N E Dixon. Crystal and solution structures of the helicase-binding domain ofescherichia coli primase. J Biol Chem, 280:11495–11504, 2005.
[235] W. Humphrey, A. Dalke, and K. Schulten. VMD - Visual Molecular Dynamics. J MolecGraphics, 14:33–38, 1996.
[236] M Punta, A Cavalli, V Torre, and P Carloni. Molecular modeling studies on CNGchannel from bovine retinal rod: a structural model of the cyclic nucleotide-bindingdomain. Proteins, 52:332–338, 2003.
[237] WG Hoover. Canonical dynamics: equilibrium phase-space distributions. Phys. Rev.A, 31:1695–1697, 1985.
[238] H. J. C. Berendsen, D. van der Spoel, and R. van Drunen. GROMACS: A message-passing parallel molecular dynamics implementation. Comp. Phys. Comm., 91:43–56,1995.
[239] AE Garcia. Large-amplitude nonlinear motions in proteins. Phys Rev Lett, 68:2696–2699, 1992.
[240] K A Sharp and B Honig. Electrostatic interactions in macromoleculaes: Theory andapplications. Annu. Rev. Biophys. Biophys. Chem., 19:301–332, 1990.
[241] L Laaksonen. A graphics program for the analysis and display of molecular dynamicstrajectories. J Mol Graph, 10:33–34, 1992.
[242] D L Bergman, L Laaksonen, and A Laaksonen. Visualization of solvation structures inliquid mixtures. J Mol Graph Model, 15:301–306, 1997.
[243] R Koradi, M Billeter, and K Wthrich. MOLMOL: a program for display and analysisof macromolecular structures. J Mol Graphics, 14:51–55, 1996.
[244] RH Henchman, HL Wang, SM Sine, P Taylor, and JA McCammon. Ligand-inducedconformational change in the α7 nicotinic receptor ligand binding domain. Biophys J,88:2564–2576, 2005.
[245] RJ Law, RN Henchman, and JA McCammon. A gating mechanism proposed from asimulation of a human α7 nicotinic acetylcholine receptor. Proc Natl Acad Sci U S A,102:6813–6818, 2005.

BIBLIOGRAPHY 101
[246] S Haider, A Grottesi, BA Hall, FM Ashcroft, and MS Sansom. Conformational dynam-ics of the ligand-binding domain of inward rectifier K channels as revealed by molecu-lar dynamics simulations: toward an understanding of Kir channel gating. Biophys J,88:3310–3320, 2005.
[247] K Matulef, GE Flynn, and WN Zagotta. Molecular rearrangements in the ligand-binding domain of cyclic nucleotide-gated channels. Neuron, 24:443–452, 1999.
[248] D.A. Case, D.A. Pearlman, J.W. Caldwell, T.E. Cheatham III, J. Wang, W.S. Ross,C.L. Simmerling, T.A. Darden, K.M. Merz, R.V. Stanton, A.L. Cheng, J.J. Vincent,M. Crowley, V. Tsui, H. Gohlke, R.J. Radmer, Y. Duan, J. Pitera, I. Massova, G.L.Seibel, U.C. Singh, P.K. Weiner, and P.A. Kollman. Amber 7. University of California,San Francisco, 2002.
[249] T Horiuchi and N Go. Projection of Monte Carlo and molecular dynamics trajectoriesonto the normal mode axes: human lysozyme. Proteins, 10:106–116, 1991.
[250] W Kabsch and C Sander. Dictionary of protein secondary structure: pattern recognitionof hydrogen-bonded and geometrical features. Biopolymers, 22:2577–2637, 1983.
[251] TM Raschke, J Tsai, and M Levitt. Quantification of the hydrophobic interaction bysimulations of the aggregation of small hydrophobic solutes in water. Proc Natl AcadSci U S A, 98:5965–5969, 2001.
[252] M Karplus and GA Petsko. Molecular dynamics simulations in biology. Nature,347:631–639, 1990.
[253] T W Allen, O S Andersen, and B Roux. On the importance of atomic fluctuations,protein flexibility, and solvent in ion permeation. J Gen Physiol, 124:679–679, 2004.
[254] K B Craven and W N Zagotta. Salt bridges and gating in the COOH-terminal regionof HCN2 and CNGA1 channels. J Gen Physiol, 124:663–677, 2004.
[255] X Zong, C Eckert, H Yuan, C Wahl-Schott, H Abicht, L Fang, R Li, P Mistrik, A Ger-stner, B Much, L Baumann, S Michalakis, R Zeng, Z Chen, and M Biel. A novelmechanism of modulation of hyperpolarization-activated cyclic nucleotide-gated chan-nels by Src kinase. J Biol Chem, 280:34224–34232, 2005.
[256] I Massova and P A Kollman. Computational alanine scanning to probe protein-proteininteractions: a novel approch to evaluate binding free energies. J of American ChemicalSociety, 121:8133–8143, 1999.
[257] V Tsui and DA Case. Molecular dynamics simulations of nucleic acids with a generalizedBorn solvation model. J. Am. Chem. Soc., 122:2489–2498, 2000.
[258] ML Connolly. Solvent-accessible surfaces of proteins and nucleic acids. Science,221:709–713, 1983.
[259] A. Fersht. Structure and mechanism in protein science: a guide to enzyme catalysisand protein folding. New York Freeman W.H., 1999.
[260] M H Ultsch, C Wiesmann, L C Simmons, J Henrich, M Yang, D Reilly, S H Bass, andA M de Vos. Crystal structures of the neurotrophin-binding domain of TrkA, TrkBand TrkC. J Mol Biol, 290:149–159, 1999.

102 BIBLIOGRAPHY
[261] S. Covaceuszach, A. Cattaneo, and D. Lamba. Neutralization of NGF-TrkA receptorinteraction by the novel antagonistic anti-TrkA monoclonal antibody MNAC13: Astructural insight. Proteins, 58:717–727, 2005.