Embed Size (px)
Citation preview
1Research Article
IntroductionIntegrin-mediated adhesion to the extracellular matrix (ECM)plays a pivotal role in the regulation of tissue integrity, cellmigration and transmembrane signaling. These adhesions areformed in specialized sub-cellular sites, known as focaladhesions (Burridge and Chrzanowska-Wodnicka, 1996;Geiger et al., 2001) where matrix-attached integrin receptorsinteract with the actin cytoskeleton via a submembrane,multimolecular plaque. Many of the known plaque proteinscontain binding sites for multiple (sometimes, over ten) partnermolecules (Zamir and Geiger, 2001). For example, paxillin,one of the most prominent plaque proteins, can bind directlyto integrins, vinculin, Crk, actopaxin, FAK and more (Turner,2000a; Turner, 2000b). Based on extensive biochemicalstudies, models of ‘interaction networks’ of focal adhesionswere proposed, where the potential intermolecular interactionswere depicted (Zamir and Geiger, 2001). However, thehierarchy of these multiple interactions and the mechanismsregulating their formation and turnover in the living cell arestill poorly understood.
One of the mechanisms regulating the formation anddynamics of focal adhesions involves tyrosinephosphorylation. Focal adhesions contain several tyrosine-specific kinases and phosphatases, as well as their substrates(Geiger et al., 2001) whose phosphorylation creates docking
sites for phosphotyrosine (PY) binding domains [e.g. Srchomology-2 (SH2)] on appropriate partner molecules (Pawsonet al., 2001). The main kinases responsible for thesephosphorylation events are FAK and pp60src, whose absence orinhibition affects focal adhesion dynamics (Ilic et al., 1995;Richardson and Parsons, 1996; Volberg et al., 2001) andadhesion-mediated signaling (Schaller, 2001). The majorsubstrates of these enzymes are the adapter proteins paxillin,CrkII and CAS, as well as Src and FAK themselves. Thephosphorylation of these proteins can generate docking sitesfor SH2-containing adapter and signaling molecules (Bellis etal., 1995; Harte et al., 1996; Panetti, 2002; Schaller andParsons, 1995), and thereby affect focal adhesion compositionand dynamics. Paxillin phosphorylation is induced by FAK andSrc upon stimulation with growth factors (Abedi et al., 1995;Rankin and Rozengurt, 1994) or activation of Rho A (Barryand Critchley, 1994; Flinn and Ridley, 1996). Tyrosinephosphorylation of CAS is mediated by Src upon complexformation with FAK (Ruest et al., 2001) and its localization tofocal adhesions is largely dependent on its Src binding and itsSH3-mediated interaction with FAK (Nakamoto et al., 1997).To date, however, only little is known about the formation anddynamics of Paxillin-CAS-FAK complexes in live cells.
In this study, we used fluorescence resonance energy transfer(FRET) measurements to probe tyrosine phosphorylation and
Microscopy-based fluorescence resonance energy transfer(FRET) provides an opportunity to monitor molecularprocesses in the natural environment in live cells. Here westudied molecular interactions and tyrosinephosphorylation of paxillin, Crk-associated substrate(CAS), and focal adhesion kinase (FAK) in focal adhesions.For that purpose, these focal adhesion phosphoproteins,fused to cyan or yellow fluorescent proteins (CFP or YFP)were expressed in cultured fibroblasts. To assess thedynamics of tyrosine phosphorylation we used YFP- orCFP-tagged SH2 domain of pp60src (dSH2), whichspecifically binds to phosphotyrosine residues. FRETmeasurements, combined with immunolabeling withphosphospecific antibodies revealed that FAK, CAS andpaxillin are tyrosine phosphorylated in early matrixadhesions and that FAK is in FRET proximity to CAS andpaxillin in focal complexes and focal adhesions. Data
suggest that paxillin incorporation into nascent focalcomplexes precedes its tyrosine phosphorylation, whichthen gradually increases. In cells treated with Rho-kinaseinhibitors or expressing constitutively active Rac, focalcomplexes showed similar levels of paxillin tyrosinephosphorylation as seen in mature focal adhesions.Dynamic FRET-based examination indicated that paxillinphosphorylation occurs in specific areas (hotspots) withinfocal adhesions, whereas FAK phosphorylation is broadlydistributed.
Supplementary material available online athttp://jcs.biologists.org/cgi/content/full/119/??/????/DC1
Key words: Focal adhesions, FRET, Paxillin, FAK, CAS,Phosphorylation
Summary
Molecular mapping of tyrosine-phosphorylatedproteins in focal adhesions using fluorescenceresonance energy transferChristoph Ballestrem, Noam Erez, Joachim Kirchner, Zvi Kam, Alexander Bershadsky and Benjamin Geiger* Department of Molecular Cell Biology, The Weizmann Institute of Science, 76100 Rehovot, Israel*Author for correspondence (e-mail: [email protected])
Accepted 14 November 2005Journal of Cell Science 119, 000-000 Published by The Company of Biologists 2006doi:10.1242/jcs.02794
Page nos Page total Colour pages: Facing pages: Issue Ms order

2
the consequent molecular interactions between the focaladhesions proteins vinculin, paxillin, p130Cas and FAK in livecells. For this purpose we expressed different combinations ofthese focal adhesions molecules, fused to cyan and yellowfluorescent proteins (CFP and YFP) as FRET donor andacceptor pairs. As a probe for phosphotyrosine (PY) we usedCFP or YFP, fused to a tandem repeat of the SH2 domain(dSH2) of pp60src, which specifically binds to tyrosine-phosphorylated sites on proteins associated with focaladhesions (Kirchner et al., 2003). The SH2 domain of Src wasshown to have a broad specificity to tyrosine-phosphorylatedtargets (Nollau and Mayer, 2001) and to localize to focaladhesions (Kirchner et al., 2003). Analyses of cells expressingdSH2-GFP showed that at low expression levels the intensityof this probe is linearly correlated with the density of tyrosine-phosphorylated sites, detected by antibody labeling. Highexpression of dSH2 induced elevated tyrosine phosphorylation,probably by interfering with dephosphorylation (Kirchner etal., 2003).
Our primary approach for measuring molecular proximitiesis microscope-assisted FRET, based on the stimulation ofacceptor fluorescence emission. It has been shown that FRETis a powerful approach for measuring molecular proximities ata range of ~10 nm and is thus capable of exploring protein-protein interactions (Jares-Erijman and Jovin, 2003; Miyawakiand Tsien, 2000). FRET is based on the principle that two closefluorophores with overlapping excitation and emission spectra,interact via dipole-dipole coupling, causing the excitationenergy of the ‘donor’ to be transferred to the ‘acceptor’,resulting in light emission as longer-wavelength fluorescence(Jares-Erijman and Jovin, 2003; Miyawaki and Tsien, 2000).Here we present, for the first time, data on the dynamics oftyrosine phosphorylation of paxillin, CAS and FAK in focaladhesions and focal complexes of live cells. We show that alarge fraction of the three proteins is tyrosine phosphorylatedin focal complexes and remains phosphorylated during focaladhesion formation. The phosphorylation state of paxillin infocal complexes, induced by active Rac1, is similar to thephosphorylation state in focal adhesions induced by RhoA. Thethree major tyrosine-phosphorylated proteins in adhesion sites,CAS, paxillin and FAK colocalize in focal complexes and focaladhesions, and FAK displays FRET proximity to both CAS andpaxillin. Taken together, these data map molecular proximitiesin adhesion complexes of live cells shedding light on both PY-dependent and PY-independent protein associations duringfocal adhesion development.
ResultsFRET analysis of protein tyrosine phosphorylation inliving cellsVinculin and paxillin are two prominent focal adhesioncomponents that were shown to interact in vitro (Turner et al.,1990; Wood et al., 1994). In contrast to vinculin, paxillincontains multiple tyrosine-phosphorylation sites, of which four(PY31, PY40, PY118, PY181) were shown to be prominentSH2-binding sites (Brown and Turner, 2004; Nakamura et al.,2000). As previously described (Kirchner et al., 2003), SH2-binding sites can be visualized in vivo, using GFP fused to atandem repeat of the SH2 domain of Src. In order to map thePY sites relative to total paxillin and vinculin, donor-acceptorpairs of either of the two proteins and of dSH2, were expressed
in NIH 3T3 cells. Intensity ratio images revealed an extensivespatial overlap between dSH2 and each of the two proteins,though dSH2 intensity was not always correlated with highvinculin or paxillin fluorescence (Fig. 1A).
FRET, expressed as the ‘FRET index’ (FI) (see Materialsand Methods) for paxillin and dSH2 was usually very high,reaching average FI values of >30.0 (Fig. 1A,B). This was thecase when paxillin was expressed as donor (fused to CFP) andSH2 expressed as acceptor (fused to YFP) and vice versa.These results indicate that tyrosine-phosphorylated residuesare located at ‘FRET range’ from the paxillin-fusedfluorophores. To biochemically probe the interaction ofpaxillin with the dSH2 reporter we immunoprecipitated YFP-dSH2 and showed that a large number of tyrosine-phosphorylated proteins, including paxillin, were co-immunoprecipitated (Fig. 1C). In contrast to the high FI valuesfor paxillin and dSH2, the values obtained for the vinculin-dSH2 pair, were low (average FI<5) irrespective of whichprotein was selected as donor and acceptor (Fig. 1A,B),suggesting that there were essentially no available SH2-docking sites on vinculin or within FRET range from it. Thiswas further corroborated by immunoprecipitation experiments,showing that vinculin fails to co-precipitate with dSH2 (seeFig. S1 in supplementary material).
To assess directly the FRET efficiency, as measured bysensitized emission, we used an alternative approach forquantifying FRET, namely, the ‘dequenching of the donor’following acceptor photobleaching (Siegel et al., 2000).Photobleaching of the YFP-dSH2 induced a 7% increase ofCFP-paxillin fluorescence (Fig. 2), but had no significant effecton CFP-vinculin fluorescence (data not shown).
To test whether the high paxillin/dSH2 FRET values dependon direct phosphorylation of the fluorescently-tagged paxillin,we performed FRET experiments with cells expressing atruncated YFP-paxillin construct devoid of the major PY sitesat positions 31, 40, 118, 181 (denoted pax �1-314) and CFP-dSH2. FI values in these experiments were about half of thosedetected with full-length paxillin. It is noteworthy that thesevalues were still significantly higher that those obtained withthe dSH2/vinculin pair (Fig. 1D), suggesting that the measuredpaxillin-dSH2 FRET was partly attributable to intramolecularcross-talk and partly to FRET between paxillin and tyrosinephosphorylated proteins located near by.
FI measurements between dSH2 and focal adhesioncomponents were extended to other tyrosine-phosphorylatedcomponents of the submembrane plaque, including FAK andCAS. For that purpose we expressed each of these moleculesfused to YFP, with dSH2-CFP and measured the FI. High FIvalues for both dSH2-FAK and dSH2-CAS were obtained (Fig.3). These values were similar or even higher than thosemeasured for dSH2-paxillin (Fig. 3B). Intensity ratio imagesof dSH2/FAK and dSH2/CAS showed a largely homogeneousdistribution, indicating their almost identical localization infocal adhesions. Moreover, both molecules co-immunoprecipitated with dSH2-CFP (Fig. 3C), indicating thatboth FAK and CAS can associate with dSH2.
Tyrosine phosphorylation of paxillin, CAS and FAK infocal complexesDuring cell migration, small dot-like adhesions, known as focalcomplexes, form at the leading edge. Some of these adhesions
Journal of Cell Science 119 ()

3Molecular interactions in focal adhesions of living cells
eventually grow and ‘mature’ into focal adhesions (Ballestremet al., 2001; Clark et al., 1998). Focal complexes are tyrosinephosphorylated and contain paxillin and other focal adhesioncomponents (Nakamura et al., 2000; Zaidel-Bar et al., 2003).
To test whether paxillin, FAK and CAS are alreadyphosphorylated in focal complexes, we stained cells withantibodies directed against the major phosphorylated sites ofthese molecules. Antibodies directed against paxillin PY118,FAK PY397 and CAS PY165 all readily labeled focalcomplexes at the cell periphery (Fig. 4). It was, however,noticed that there was a large heterogeneity in the level ofphosphorylation of these proteins in focal complexes.Moreover, the antibody directed against paxillin shows strongcytoplasmic staining, whereas the phosphospecific antibodieslabeled mainly the adhesion structures (not shown). Thissuggests that these proteins become phosphorylated only afterthey become incorporated into adhesion complexes.
To study tyrosine phosphorylation of paxillin in live cells inreal time, we plated NIH 3T3 fibroblasts, co-expressing CFP-paxillin and YFP-dSH2 on fibronectin and monitored thedevelopment of new adhesion sites under the advancinglamellipodium. The recruitment of paxillin to focal adhesionsprecedes the local increase in PY levels (Fig. 5) (see alsoKirchner et al., 2003). As soon as we detected dSH2-YFP infocal complexes we were also able to detect modest, butsignificant FRET values that increased during transformation
of focal complexes to focal adhesions (Fig. 5A, see ellipse).Since values of intermolecular FRET depend on both distanceand concentration of donor and acceptor fluorophores, theincrease of FRET between paxillin and dSH2 could beattributed to changes in donor/acceptor ratio. Indeed, analysisof the fluorescence intensities, confirmed that thedonor/acceptor ratio changes during the transition from focalcomplexes to focal adhesions, whereas intensities in maturefocal adhesions remain rather constant over time (Fig. 5B). Inall cases, the donor-acceptor combination and relativeintensities were selected and optimized to provide images ofadequate dynamic range and high signal-to-noise ratio.
To determine whether the changes in paxillin and PY in
Fig. 1. Tyrosine phosphorylation of focaladhesion components. A construct consistingof two consecutive SH2 domains (dSH2) fusedto CFP or YFP was used as a reporter for PYresidues. For FRET measurements betweenPY and vinculin or paxillin, dSH2 (fused toCFP or YFP) was co-transfected with paxillinor vinculin, fused to the complementaryfluorophore. (A) Single-color images, ratioimages and FRET images are displayed for theindicated pairs. Note high CFP-paxillin/YFP-dSH2 (pax-dSH2) and low FRET for CFP-vinculin/YFP-dSH2 (vin-dSH2). Bar, 2 �m.(B) Quantification of FI measurements withthe indicated FRET pairs. The data arepresented as mean ± standard error of FI infocal adhesions of 15 to 32 cells. (C) Westernblots showing, on the left,immunoprecipitation of YFP and YFP-dSH2from cells expressing these constructs. Theblot on the upper right shows that a largenumber of tyrosine phosphorylated proteinsco-immunoprecipitate with the YFP-dSH2domain expressed in NIH 3T3 cells. One ofthe proteins that co-precipitated is paxillin(lower right blot). No tyrosine-phosphorylatedproteins co-precipitated from control lysatesfrom NIH 3T3 cells expressing YFP only. (D)Quantification of FRET measurements withthe indicated FRET pairs. Note that FRETbetween dSH2 and a truncated form of paxillindevoid of major tyrosine phosphorylation sitesis reduced by half compared with FI valuesbetween dSH2 and full-length paxillin, butstill significantly higher than between dSH2and vinculin.
4
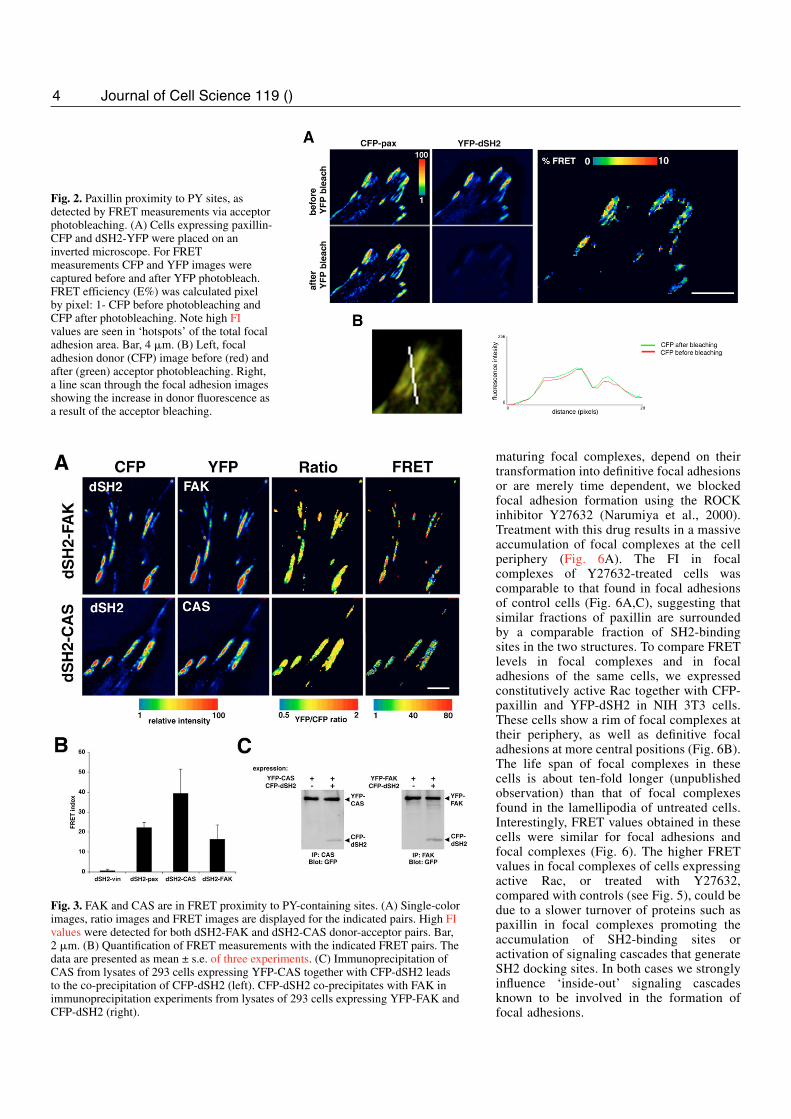
maturing focal complexes, depend on theirtransformation into definitive focal adhesionsor are merely time dependent, we blockedfocal adhesion formation using the ROCKinhibitor Y27632 (Narumiya et al., 2000).Treatment with this drug results in a massiveaccumulation of focal complexes at the cellperiphery (Fig. 6A). The FI in focalcomplexes of Y27632-treated cells wascomparable to that found in focal adhesionsof control cells (Fig. 6A,C), suggesting thatsimilar fractions of paxillin are surroundedby a comparable fraction of SH2-bindingsites in the two structures. To compare FRETlevels in focal complexes and in focaladhesions of the same cells, we expressedconstitutively active Rac together with CFP-paxillin and YFP-dSH2 in NIH 3T3 cells.These cells show a rim of focal complexes attheir periphery, as well as definitive focaladhesions at more central positions (Fig. 6B).The life span of focal complexes in thesecells is about ten-fold longer (unpublishedobservation) than that of focal complexesfound in the lamellipodia of untreated cells.Interestingly, FRET values obtained in thesecells were similar for focal adhesions andfocal complexes (Fig. 6). The higher FRETvalues in focal complexes of cells expressingactive Rac, or treated with Y27632,compared with controls (see Fig. 5), could bedue to a slower turnover of proteins such aspaxillin in focal complexes promoting theaccumulation of SH2-binding sites oractivation of signaling cascades that generateSH2 docking sites. In both cases we stronglyinfluence ‘inside-out’ signaling cascadesknown to be involved in the formation offocal adhesions.
Journal of Cell Science 119 ()
Fig. 2. Paxillin proximity to PY sites, asdetected by FRET measurements via acceptorphotobleaching. (A) Cells expressing paxillin-CFP and dSH2-YFP were placed on aninverted microscope. For FRETmeasurements CFP and YFP images werecaptured before and after YFP photobleach.FRET efficiency (E%) was calculated pixelby pixel: 1- CFP before photobleaching andCFP after photobleaching. Note high FIvalues are seen in ‘hotspots’ of the total focaladhesion area. Bar, 4 �m. (B) Left, focaladhesion donor (CFP) image before (red) andafter (green) acceptor photobleaching. Right,a line scan through the focal adhesion imagesshowing the increase in donor fluorescence asa result of the acceptor bleaching.
Fig. 3. FAK and CAS are in FRET proximity to PY-containing sites. (A) Single-colorimages, ratio images and FRET images are displayed for the indicated pairs. High FIvalues were detected for both dSH2-FAK and dSH2-CAS donor-acceptor pairs. Bar,2 �m. (B) Quantification of FRET measurements with the indicated FRET pairs. Thedata are presented as mean ± s.e. of three experiments. (C) Immunoprecipitation ofCAS from lysates of 293 cells expressing YFP-CAS together with CFP-dSH2 leadsto the co-precipitation of CFP-dSH2 (left). CFP-dSH2 co-precipitates with FAK inimmunoprecipitation experiments from lysates of 293 cells expressing YFP-FAK andCFP-dSH2 (right).

5Molecular interactions in focal adhesions of living cells
Molecular interactions between paxillin,FAK and CAS in mature focal adhesionsFAK is a pivotal focal adhesion molecule,which is involved not only in tyrosinephosphorylation in these sites, but alsoprovides docking sites for several focaladhesion molecules, including paxillin andCAS (Parsons et al., 2000; Schaller andParsons, 1994). Indeed, FAK, CAS and paxillinco-localize within focal adhesions and focalcomplexes in NIH 3T3 cells (Fig. 7, see alsoFig. 4). Ratio images of CFP-FAK and YFP-CAS indicate an almost identical distribution ofthe two proteins in mature focal adhesions,whereas the distribution of paxillin and FAK issomewhat less overlapping, suggesting anenrichment of FAK in discrete areas of focaladhesions, compared with paxillin, which ismore widely distributed (Fig. 7A). FRETvalues for FAK-CAS and FAK-paxillin werehigh in both mature focal adhesions and infocal complexes (FI>16; Fig. 7A,B,C).Although we detected colocalization of CASwith paxillin (Fig. 4), we were not able tomeasure FRET between them becauseoverexpression of paxillin apparently inhibitedCAS localization to focal adhesions, renderingFRET measurements unreliable, owing to highdifferences in fluorescence intensity(paxillin>>CAS) in focal adhesions (notshown).
Taken together, these FRET data, showingclose association of FAK with paxillin andCAS in focal complexes, suggest thatphosphorylation of the two proteins via FAK
Fig. 5. Paxillin phosphorylation during focaladhesion development. (A) First two rows of thetime-lapse recording show localization of CFP-paxillin and YFP-dSH2 along the lamellipodium ofNIH 3T3 fibroblast; for better visualization blackand white inverted-contrast images are shown. Thethird row shows calculated FI between CFP-paxillinand YFP-dSH2. Note that during the developmentof focal adhesions, paxillin accumulation precedesthe increase in PY levels (compare encircled areasin rows one and two). FRET values of focalcomplexes in the encircled area increase steadilyuntil reaching a level of FI>20, as in mature focaladhesions. High FRET values in mature focaladhesions (ellipse) remained at FI>20 during theentire period of time-lapse recording. (B)Measurements of fluorescence intensity maximaduring transition of focal complexes to focaladhesions (black lines; encircled area in A)compared with those in focal adhesions (grey lines;ellipse area in A) during the period of observation.Note that during the transition of focal complexesto focal adhesions, acceptor fluorescence intensity,although initially below donor intensity, rises abovethe donor intensity at 8 minutes. In focal adhesions,acceptor intensity remains in excess of the donorintensity.
Fig. 4. Paxillin, CAS, and FAK phosphorylation in focal complexes and focaladhesions. NIH 3T3 cells were fixed and labeled for paxillin (A,D,G);phosphospecific antibody to paxillin PY118 (B); phosphospecific antibody against theFAK autophosphorylation site PY397 (E); phosphospecific antibody directed againstCAS PY165 (H). Merged images are shown in the right-hand column (C,F,I). Notethat paxillin, FAK and CAS are phosphorylated on the specific PY sites in focalcomplexes and focal adhesions. Bars, 2 �m.

6
occurs at early stages of focal adhesions maturation. The lowamount of CAS fluorescence in paxillin co-expressing cellsmight be due to a competition of the two on the binding toFAK.
Phosphorylation dynamics in focal adhesionsThe direct measurement of protein incorporation and tyrosinephosphorylation in focal adhesions of live cells allowed us toprobe the dynamics of these processes. For these experimentswe chose better probe combinations to minimizephotobleaching effects. Intensity ratios and the correspondingFRET images of the same temporal series of paxillin-dSH2 andFAK-SH2 pairs were recorded at one-minute intervals over aperiod of 4 minutes (Fig. 8). To reduce noise, pixels weresmoothed in these images to a kernel size of 2.
Intensity ratios between paxillin and dSH2, revealed localvariations, however, the overall pattern remained rather stableover a period of several minutes (Fig. 8). As shown above (Fig.1), areas with especially high concentrations of PY were foundwithin homogeneously distributed paxillin-rich areas. Regionswith high dSH2-to-paxillin ratios usually also displayed higherFI values (Fig. 8; supplementary material Fig. S2), suggestingthat there are relatively stable ‘hot spots’ with high kinaseactivity within the focal adhesions. For the FAK-dSH2 pair,ratio images were more homogeneous owing to the high spatialcorrelation between the localization of the two in the focaladhesion area. FI values were usually high throughout the
overlap area of the two probes during the entire recording time(Fig. 8). This suggests that FAK localizes in specific areas offocal adhesions where it undergoes auto-phosphorylation andfurther phosphorylates its major targets including paxillin andCAS.
To explore the functional significance of the highlyphosphorylated ‘hot spots’ within focal adhesions we haveused time-lapse video microscopy of cells expressing dSH2-YFP to monitor local changes in focal adhesions structure.Such observations suggest that highly phosphorylated areas offocal adhesions are particularly dynamic and tend to undergoturn-over and disassembly (Fig. 9). Since long-term FRETimaging of live cells is not compatible with cell survival andgrowth, more extensive studies will be required to address thisquestion using combined transmitted light/fluorescence moviesof live cells.
DiscussionThe use of FRET enables the mapping of intermoleculardistances of a few nanometers between a donor and an acceptorfluorophore (Jares-Erijman and Jovin, 2003; Miyawaki andTsien, 2000) shedding light on the formation of molecularcomplexes both in vitro and in vivo. In this study we haveapplied microscopy-based FRET measurements for studyingmolecular interactions in cell-matrix adhesion complexes. Thismicroscopy-based measurement in live cells has temporal andspatial resolution lacking from biochemical data. Specifically
Journal of Cell Science 119 ()
Fig. 6. Paxillin phosphorylation in focalcomplexes and focal adhesions. (A) Single-colorimages, ratio and FRET image of CFP-paxillin anddSH2-YFP in NIH 3T3 cells treated with theROCK inhibitor Y27632 to induce accumulationof focal complexes. Note the high FI in focalcomplexes between CFP-paxillin and YFP-dSH2indicating high tyrosine phosphorylation ofpaxillin in these structures. (B) A cell expressing adominant-active form of Rac in addition to thedonor-acceptor pair paxillin-dSH2. Note the co-existence of focal complexes at the cell peripheryand the larger focal adhesions behind the cell edge.Single-color images of CFP-paxillin and YFP-dSH2 are presented as inverted black and whiteimages for better visualization. High FI values infocal adhesions and focal complexes suggest that alarge and comparable fraction of paxillin istyrosine phosphorylated in both structures. (C)Quantification of FRET between the indicateddonor-acceptor pairs in focal adhesions, in focalcomplexes of Y27632-treated cells, in focaladhesions plus focal complexes in cells expressingdominant-active Rac1 (daRac) and in focaladhesions of cells expressing active RhoA(daRho). The data are presented as mean ± s.d. ofFI in focal adhesions or focal complexes measuredin five to ten cells.

7Molecular interactions in focal adhesions of living cells
it has the spatial resolution to detect the molecularproximity to phosphorylation sites in individual focaladhesion of individual cells, or even subdomains ofthese adhesion sites. This information can be retrievedcontinuously, thus detecting local or global changesand fluctuations. Given that such processes are notsynchronized in different cells or cellular regions, thisspatio-temporal information would be missed by abiochemical approach.
It is noteworthy that FRET data provide high-resolution information about molecular distancesbetween the labeled fluorophores, but cannot provedirect binding between the modified proteins. Thislimitation is particularly significant when the donorand acceptor fluorophores are large molecules whoseexact position, relative to the respective fusion partneris usually poorly defined. Nevertheless, high FRETvalues for the dense aggregation of components atadhesion sites reflect average proximities that setsspatial and dynamic constraints on the multi-proteincomplex assembly. For example, the fact that FRETbetween wild-type paxillin and dSH2 is significantlyhigher than that obtained with the paxillin mutantlacking a major phosphorylation site strongly suggeststhat direct molecular interactions have a majorcontribution to the measured FRET values.Furthermore, all proteins tested that are known to betyrosine phosphorylated (i.e. paxillin, FAK and CAS)show high FI values with the dSH2 probe whereasproteins that are devoid of such sites [i.e. vinculin(Fig. 1) zyxin and actin], did not show significant FIlevels, despite extensive spatial overlap at theresolution of the microscope. The direct interaction ofpaxillin, CAS and FAK (but not vinculin) with thedSH2 probe is also corroborated by the co-
Fig. 7. FRET for FAK together with either paxillin or CAS.NIH 3T3 cells were transfected with cDNA encoding pairsof CFP- and YFP-fusion proteins as indicated. (A) Imagesare displayed in spectral scale for the CFP and YFP fusionproteins, for their fluorescence ratio, and for the calculatedFRET between the co-expressed molecules. CFP-paxillin/YFP-FAK (pax-FAK) and CFP-FAK/YFP-CAS(FAK-CAS) pairs display relatively high FRET values. (B)FRET of indicated donor/acceptor pairs in focalcomplexes. First image displays the localization of theacceptor in inverted grey levels (C) Quantitative FRETanalysis of the indicated pairs. The data are presented asmean ± s.e. of FI in focal adhesions measured in 8 to 15cells. Bar, 2 �m.
Fig. 8. Dynamic changes of fluorescence intensity ratio andof FRET of paxillin-dSH2 and FAK-dSH2 pairs. Thefluorescence measurements were taken at 1-minuteintervals. The color scales on the right indicate thefluorescence ratio or FI values. Note that the temporalvariation in the ratio of both donor/acceptor pairs isrelatively stable. FI values for the FAK-SH2 pair showedsome local fluctuations, whereas high values for paxillin-dSH2, mostly restricted to areas with high PY remainedstable over time. Bar, 2 �m.

8
immunoprecipitation experiment. It is interesting to note thehigh ‘self-FRET’ values obtained at focal adhesions with thepair dSH2-CFP/dSH2-YFP (supplementary material Fig. S3).This phenomenon is attributable either to the presence ofclustered phosphorylated sites on the same molecules (Panetti,2002), or on closely interacting ones. The dynamic analysisdescribed here indicates that local PY levels located at FRETrange from paxillin, gradually increase during focal adhesionsdevelopment from focal complexes, either by the localphosphorylation of the different plaque proteins, or by thecontinuous recruitment of phosphorylated molecules to thesesites.
Our main objective in this study, was to elucidate the spatialand temporal relationships between the major tyrosinephosphorylated focal adhesions molecules, paxillin, CAS andFAK and characterize their phosphorylation during focaladhesions formation and maturation. The phosphorylation ofthese proteins triggers their interaction with several SH2-bearing (mostly tyrosine-phosphorylated) partners (O’Neill etal., 2000; Panetti, 2002; Schaller, 2001; Turner, 2000b) thatfurther regulate cell adhesion and migration. Using FRETexperiments combined with immunolabeling forphosphorylated paxillin (PY 118), FAK (PY397) and CAS (PY165), using phospho-specific antibodies, we show that tyrosinephosphorylation of these proteins occurs in focal complexesalong the lamellipodium, and remains high during transition offocal complexes into focal adhesions. We were not able to seea clear hierarchy in the phosphorylation status of the threeproteins. However, it was reported that phosphorylation ofCAS and paxillin occurs via Src binding to phosphorylatedFAK at position PY397 (Ruest et al., 2001; Vuori et al., 1996)suggesting that FAK auto-phosphorylation might occur first. Itis noteworthy that high FAK-paxillin and FAK-CAS FRET isalready detected in focal complexes, suggesting that both themolecular interactions and phosphorylation of FAK, CAS andpaxillin occur at an early stage of adhesion. We were unableto reliably measure FRET between CAS and paxillin becauseoverexpression of the latter resulted in a marked reduction inCAS fluorescence in focal adhesions (not shown). Although itis known that CAS and paxillin bind to different domains onFAK we speculate that these two proteins actually compete forbinding to FAK.
Another feature offered by quantitative microscopy-basedanalysis and FRET is the possibility to visualize and measuredynamic molecular events. In this study we show that instationary focal adhesions, the areas of high phosphorylationmaintaining high FRET relationships with paxillin are ratherstable over time. The regions with the highest FI values werethose that also contain the highest levels of the PY probe dSH2.Paxillin, on the other hand, was more widely distributed withinthe focal adhesion. Interestingly, FAK and dSH2 distributed
almost identically in focal adhesions, which suggests thatFAK-containing ‘hotspots’ define sub-domains within focaladhesions, exhibiting a particularly high density of SH2-binding sites.
Another intriguing aspect of this study is the functionalsignificance of the tyrosine phosphorylation hotspots in focaladhesions. Time-lapse experiments using cells expressing thedSH2 domain suggest that these hotspots may play a role instimulating focal adhesion turnover. This is in line with aprevious report showing that FAK- or Src-null cells formabnormally stable focal adhesions, whereas expression ofderegulated Src greatly increases focal adhesion turnover (Katzet al., 2003). This phenomenon can be attributed, at least inpart, to the activation of the Rho-family GTPase Rac1following phosphorylation-dependent activation of the CAS-DOCK180/ELMO (Zaidel-Bar et al., 2005) or the Tiam1 (Erezet al., 2005; Mertens et al., 2005) exchange factor systems,eventually leading to dispersal of focal adhesions.
In conclusion, the findings described in this article shed newlight on the molecular and functional diversity of adhesioncomplexes. Earlier studies showed that different forms ofintegrin-mediated adhesions (e.g. focal adhesions, focalcomplexes and fibrillar adhesions) display distinct molecularcomposition, morphology and subcellular distribution anddynamics (Ballestrem et al., 2001; Zaidel-Bar et al., 2003;Zamir et al., 1999). Furthermore, even individual adhesion siteswere often shown to be non-homogeneous with regards to theirmolecular composition, with distinct ‘sub-domains’,displaying distinct molecular characteristics (Kirchner et al.,2003; Zamir et al., 1999). The significance of these variationsis still poorly understood, and further studies addressing theunderlying functional significance are currently underway. Inthis work we show another level of molecular diversity withinfocal adhesions, manifested by the presence of ‘hot-spots’ ofhigh local levels of tyrosine phosphorylation within theadhesion sites. In view of the central importance of tyrosinephosphorylation for focal adhesion assembly, turnover andsignaling, the molecular mechanisms regulating the formationand dynamics of these phosphorylated sub-domains may playa major role in controlling cell migration, matrix attachmentand adhesion-mediated signaling.
Materials and MethodsCells and reagentsNIH 3T3 cells were cultured in DMEM, supplemented with antibiotics and 10%FCS (complete medium). Transient transfections were performed withLipofectAMINE PLUS (Invitrogen, Carlsbad, CA), according to the manufacturer’sinstructions. YFP- and CFP-actin constructs were derived from GFP-actin (Choidaset al., 1998). Paxillin cDNA (kindly provided by K. Yamada, National Institute ofDental and Craniofacial Research, NIH, Bethesda, MD) and vinculin cDNA werecloned into ECFP-C1 and EYFP-C1 (Clontech, Palo Alto, CA). CFP-and YFP-FAKwas obtained from R. Horwitz (University of Virginia, School of Medicine, VA)and YFP-p130Cas was a gift from A. Bouton (University of West Virginia,
Journal of Cell Science 119 ()
Fig. 9. A highly tyrosine phosphorylated focaladhesion at the retracting edge of a cell displays adynamic reshaping, including a disconnectedregion (area indicated by asterisk) that movestowards the cell center.

9Molecular interactions in focal adhesions of living cells
Morgantown, VW). The PY reporter used here consisted of two repeats of the SH2domain of pp60src (dSH2), fused to YFP or CFP as described elsewhere (Kirchneret al., 2003). The transfection conditions were selected so that the expression levelof the acceptor fluorophores (YFP-tagged proteins) over the donor (CFP-taggedproteins) was kept between 2:1 and 1:2 in focal adhesions, to minimize the bleed-through corrections in FI (see below). For FRET imaging, cells expressing donorand acceptor proteins for 24 hours were plated in serum-free F12 medium, bufferedwith 25 mM HEPES, on fibronectin-coated (20 �g/ml) glass-bottom dishes (MatTekcorporation, Ashland, MA).
Digital microscopyImages were recorded on an Axiovert 100 TV inverted microscope (Zeiss,Oberkochen, Germany) equipped with an incubation chamber, a 100 W mercurylamp, a 100�/1.4 oil Plan-Apochromat objective (Zeiss, Oberkochen, Germany),excitation and emission filter wheels and a CCD Camera (CH300/CE 350,Photometrics, Tucson, AZ) with KAF1400 CCD chip, controlled by a DeltaVisionsystem (Applied Precision, Issaquah, WA). The filters used were for the CFPchannel: 29379 excitation filter (Chroma, VT), 455DCLP dichroic mirror, and F32-044 emission filter (AHF Analysentechnik, Tübingen, Germany); for the FRETchannel (CFP excitation and YFP emission): 29379 CFP excitation filter (Chroma),455DCLP dichroic mirror (AHF Analysentechnik) and 27203 YFP emission filter(Chroma); and for the YFP channel: 24000 excitation filter with a BS28311 dichroicmirror and the 27203 emission filter (Chroma). For FRET analysis a sequence ofthree images was recorded every minute, for 6-10 minutes, starting with the CFPchannel, then the FRET, and finally the YFP. The three images were acquired withinless than 5 seconds, a time sufficiently short to make any adhesion structures motionnegligibly small, as established by second imaging at the end of the sequence thefirst color. In every session ‘bleed-through’ coefficients of YFP and CFP in theFRET channel (corresponding to � and � in the equation below) were determined(Zamir et al., 1999).
To measure FRET via de-quenching of CFP, photobleaching of YFP wasperformed using a D535/50 emission filter, 565DLCP beamsplitter, and E590LPemission filter (all AHF Analysentechnik). For FRET measurements CFP imagewas acquired before and after YFP photobleaching. FRET efficiency (E%) wascalculated: E%=(1–CFP before photobleaching/CFP after photobleaching)�100.
Image analysisFRET analysis was performed as previously described (Kam et al., 1995) with slightmodifications. To obtain FRET values, regions containing focal adhesions at the cellperiphery were high-pass filtered and focal adhesions structures in the differentchannels were aligned to correct for emission filter shifts. The FRET index (FI) wascalculated for all pixels above threshold in both the CFP and the YFP channels byapplying the equation below, pixel-by-pixel, to the image intensities recorded in thethree channels. Threshold is set by the background level, and does not affect theratio images where both denominator and numerator values are above it, butsuppresses the undefined ratios otherwise. The fluorescence of CFP and YFP in theFRET channel was directly measured and subtracted from the total FRET values.The calculated net FRET was then normalized to donor fluorescence intensity(bleaching of CFP fluorescence was negligible):
FI = 100(FRET–�YFP–�CFP) / CFP ,
where � and � are the measured ‘bleed-through coefficients’ of YFP and CFPfluorescence through the FRET channel. FI values were calculated based on threeto ten consecutive time-lapse images and averaged for 11-32 cell samples. Ratioimages of two components were calculated as previously described (Zamir et al.,1999). Briefly, images showing localization of CFP and YFP fusion proteins werehigh-pass filtered and the images were aligned. YFP/CFP ratio values werecalculated for each pixel above threshold in both YFP and CFP channels. Ratioimages were displayed using a spectral color look-up table ranging from 0.5 (blue)to 2 (red). To compensate for different expression levels and the different photonyields of CFP- and YFP-fusion proteins, the ratios were normalized by a constantthat shifted their average values towards 1. For the presentation of ratio and FRETdynamics in Fig. 8, images were ‘smoothed’ by averaging 2�2 pixels in order tobetter visualize dynamic alterations avoiding fluctuating background noise. This wasparticularly useful for the high magnification used in the present study, where thepixel size (0.13 �m) is below the light microscope resolution.
ImmunoprecipitationNIH 3T3 cells were transfected with cDNA constructs as indicated, usingLipofectaminePLUS. Cells were washed, 24 hours post transfection, with TBS (50mM Tris-HCl, 150 mM NaCl) and lysed with NP40-lysing buffer (1% NP40, 50mM Tris-HCl pH 7.4, 120 mM NaCl, 2.5 mM EGTA 7.4, 1 mM NaF, 10 mM MgCl2,1 mM Na3VO4, and protease inhibitor cocktail (Roche, Mannheim, Germany). Celllysates were centrifuged for 10 minutes at 15,000 g to remove insoluble material.The supernatant was used for immunoprecipitation using protein A/G beads (SantaCruz Biotechnology, Santa Cruz, CA) and anti-GFP antibodies (Roche, Mannheim,Germany), anti-p130CAS, or anti-FAK antibodies (both from TransductionLaboratories) for 2 hours at 4°C. The immunoprecipitates were separated by 10%
SDS-PAGE gel electrophoresis and transferred to nitrocellulose. Non-specificbinding sites on the membrane were blocked using 5% BSA in TBS-T (50 mM Tris-HCl, 150 mM NaCl, and 0.1% Tween 20); membrane was then probed for 1 hourat RT using anti-GFP (Roche), anti-PY (4G10) or anti-paxillin antibodies (both fromTransduction Laboratories). After washing three times with TBS-T the membraneswere incubated for 1 hour with horseradish-peroxidase-linked secondary antibodiesand then developed using enhanced luminescence detection.
We would like to thank M. Shtutman for the cloning of vinculinand paxillin-CFP and -YFP constructs, E. Zamir for his valuableadvice in image quantifications and Michael Grant for critical reviewof the manuscript. This study was supported by the MinervaFoundation, the Israeli Science Foundation, and the US-Israel Bi-National Foundation. B. G. holds the E. Neter Chair in Cell AndTumor Biology. A. B. holds the J. Moss chair of biomedical research.Z. K. is the Israel Pollak Professor in Biophysics. C. B. was supportedby a postdoctoral fellowship from the Minerva foundation.
ReferencesAbedi, H., Dawes, K. E. and Zachary, I. (1995). Differential effects of platelet-derived
growth factor BB on p125 focal adhesion kinase and paxillin tyrosine phosphorylationand on cell migration in rabbit aortic vascular smooth muscle cells and Swiss 3T3fibroblasts. J. Biol. Chem. 270, 11367-11376.
Ballestrem, C., Hinz, B., Imhof, B. A. and Wehrle-Haller, B. (2001). Marching at thefront and dragging behind: differential alphaVbeta3- integrin turnover regulates focaladhesion behavior. J. Cell Biol. 155, 1319-1332.
Barry, S. T. and Critchley, D. R. (1994). The RhoA-dependent assembly of focaladhesions in Swiss 3T3 cells is associated with increased tyrosine phosphorylation andthe recruitment of both pp125FAK and protein kinase C-delta to focal adhesions. J.Cell Sci. 107, 2033-2045.
Bellis, S. L., Miller, J. T. and Turner, C. E. (1995). Characterization of tyrosinephosphorylation of paxillin in vitro by focal adhesion kinase. J. Biol. Chem. 270,17437-17441.
Brown, M. C. and Turner, C. E. (2004). Paxillin: adapting to change. Physiol. Rev. 84,1315-1339.
Burridge, K. and Chrzanowska-Wodnicka, M. (1996). Focal adhesions, contractility,and signaling. Annu. Rev. Cell Dev. Biol. 12, 463-518.
Choidas, A., Jungbluth, A., Sechi, A., Murphy, J., Ullrich, A. and Marriott, G. (1998).The suitability and application of a GFP-actin fusion protein for long-term imaging ofthe organization and dynamics of the cytoskeleton in mammalian cells. Eur. J. CellBiol. 77, 81-90.
Clark, E. A., King, W. G., Brugge, J. S., Symons, M. and Hynes, R. O. (1998). Integrin-mediated signals regulated by members of the rho family of GTPases. J. Cell Biol. 142,573-586.
Erez, N., Bershadsky, A. and Geiger, B. (2005). Signaling from adherens-type junctions.Eur. J. Cell Biol. 84, 235-244.
Flinn, H. M. and Ridley, A. J. (1996). Rho stimulates tyrosine phosphorylation of focaladhesion kinase, p130 and paxillin. J. Cell Sci. 109, 1133-1141.
Geiger, B., Bershadsky, A., Pankov, R. and Yamada, K. M. (2001). Transmembranecrosstalk between the extracellular matrix–cytoskeleton crosstalk. Nat. Rev. Mol. Cell.Biol. 2, 793-805.
Harte, M. T., Hildebrand, J. D., Burnham, M. R., Bouton, A. H. and Parsons, J. T.(1996). p130Cas, a substrate associated with v-Src and v-Crk, localizes to focaladhesions and binds to focal adhesion kinase. J. Biol. Chem. 271, 13649-13655.
Ilic, D., Furuta, Y., Kanazawa, S., Takeda, N., Sobue, K., Nakatsuji, N., Nomura, S.,Fujimoto, J., Okada, M. and Yamamoto, T. (1995). Reduced cell motility andenhanced focal adhesion contact formation in cells from FAK-deficient mice. Nature377, 539-544.
Jares-Erijman, E. A. and Jovin, T. M. (2003). FRET imaging. Nat. Biotechnol. 21,1387-1395.
Kam, Z., Volberg, T. and Geiger, B. (1995). Mapping of adherens junction componentsusing microscopic resonance energy transfer imaging. J. Cell Sci. 108, 1051-1062.
Katz, B. Z., Romer, L., Miyamoto, S., Volberg, T., Matsumoto, K., Cukierman, E.,Geiger, B. and Yamada, K. M. (2003). Targeting membrane-localized focal adhesionkinase to focal adhesions: roles of tyrosine phosphorylation and SRC family kinases.J. Biol. Chem. 278, 29115-29120.
Kirchner, J., Kam, Z., Tzur, G., Bershadsky, A. D. and Geiger, B. (2003). Live-cellmonitoring of tyrosine phosphorylation in focal adhesions following microtubuledisruption. J. Cell Sci. 116, 975-986.
Mertens, A. E., Rygiel, T. P., Olivo, C., van der Kammen, R. and Collard, J. G. (2005).The Rac activator Tiam1 controls tight junction biogenesis in keratinocytes throughbinding to and activation of the Par polarity complex. J. Cell Biol. 170, 1029-1037.
Miyawaki, A. and Tsien, R. Y. (2000). Monitoring protein conformations andinteractions by fluorescence resonance energy transfer between mutants of greenfluorescent protein. Methods Enzymol. 327, 472-500.
Nakamoto, T., Sakai, R., Honda, H., Ogawa, S., Ueno, H., Suzuki, T., Aizawa, S.,Yazaki, Y. and Hirai, H. (1997). Requirements for localization of p130cas to focaladhesions. Mol. Cell. Biol. 17, 3884-3897.
Nakamura, K., Yano, H., Uchida, H., Hashimoto, S., Schaefer, E. and Sabe, H. (2000).

10
Tyrosine phosphorylation of paxillin alpha is involved in temporospatial regulation ofpaxillin-containing focal adhesion formation and F-actin organization in motile cells.J. Biol. Chem. 275, 27155-27164.
Narumiya, S., Ishizaki, T. and Uehata, M. (2000). Use and properties of ROCK-specificinhibitor Y-27632. Methods Enzymol. 325, 273-284.
Nollau, P. and Mayer, B. J. (2001). Profiling the global tyrosine phosphorylation stateby Src homology 2 domain binding. Proc. Natl. Acad. Sci. USA 98, 13531-13536.
O’Neill, G. M., Fashena, S. J. and Golemis, E. A. (2000). Integrin signalling: a newCas(t) of characters enters the stage. Trends Cell Biol. 10, 111-119.
Panetti, T. S. (2002). Tyrosine phosphorylation of paxillin, FAK, and p130CAS: effectson cell spreading and migration. Front. Biosci. 7, D143-D150.
Parsons, J. T., Martin, K. H., Slack, J. K., Taylor, J. M. and Weed, S. A. (2000). Focaladhesion kinase: a regulator of focal adhesion dynamics and cell movement. Oncogene19, 5606-5613.
Pawson, T., Gish, G. D. and Nash, P. (2001). SH2 domains, interaction modules andcellular wiring. Trends Cell Biol. 11, 504-511.
Rankin, S. and Rozengurt, E. (1994). Platelet-derived growth factor modulation of focaladhesion kinase (p125FAK) and paxillin tyrosine phosphorylation in Swiss 3T3 cells.Bell-shaped dose response and cross-talk with bombesin. J. Biol. Chem. 269, 704-710.
Richardson, A. and Parsons, T. (1996). A mechanism for regulation of the adhesion-associated proteintyrosine kinase pp125FAK. Nature 380, 538-540.
Ruest, P. J., Shin, N. Y., Polte, T. R., Zhang, X. and Hanks, S. K. (2001). Mechanismsof CAS substrate domain tyrosine phosphorylation by FAK and Src. Mol. Cell. Biol.21, 7641-7652.
Schaller, M. D. (2001). Biochemical signals and biological responses elicited by the focaladhesion kinase. Biochim. Biophys. Acta 1540, 1-21.
Schaller, M. D. and Parsons, J. T. (1994). Focal adhesion kinase and associated proteins.Curr. Opin. Cell Biol. 6, 705-710.
Schaller, M. D. and Parsons, J. T. (1995). pp125FAK-dependent tyrosine
phosphorylation of paxillin creates a high-affinity binding site for Crk. Mol. Cell. Biol.15, 2635-2645.
Siegel, R. M., Chan, F. K., Zacharias, D. A., Swofford, R., Holmes, K. L., Tsien, R.Y. and Lenardo, M. J. (2000). Measurement of molecular interactions in living cellsby fluorescence resonance energy transfer between variants of the green fluorescentprotein. Sci. STKE 2000, L1.
Turner, C. E. (2000a). Paxillin and focal adhesion signalling. Nat. Cell Biol. 2, E231-E236.
Turner, C. E. (2000b). Paxillin interactions. J. Cell Sci. 113, 4139-4140.Turner, C. E., Glenney, J. R., Jr and Burridge, K. (1990). Paxillin: a new vinculin-
binding protein present in focal adhesions. J. Cell Biol. 111, 1059-1068.Volberg, T., Romer, L., Zamir, E. and Geiger, B. (2001). pp60(c-src) and related
tyrosine kinases: a role in the assembly and reorganization of matrix adhesions. J. CellSci. 114, 2279-2289.
Vuori, K., Hirai, H., Aizawa, S. and Ruoslahti, E. (1996). Introduction of p130cassignaling complex formation upon integrin- mediated cell adhesion: a role for Srcfamily kinases. Mol. Cell. Biol. 16, 2606-2613.
Wood, C. K., Turner, C. E., Jackson, P. and Critchley, D. R. (1994). Characterisationof the paxillin-binding site and the C-terminal focal adhesion targeting sequence invinculin. J. Cell Sci. 107, 709-717.
Zaidel-Bar, R., Ballestrem, C., Kam, Z. and Geiger, B. (2003). Early molecular eventsin the assembly of matrix adhesions at the leading edge of migrating cells. J. Cell Sci.116, 4605-4613.
Zaidel-Bar, R., Kam, Z. and Geiger, B. (2005). Polarized downregulation of the paxillin-p130CAS-Rac1 pathway induced by shear flow. J. Cell Sci. 118, 3997-4007.
Zamir, E. and Geiger, B. (2001). Molecular complexity and dynamics of cell-matrixadhesions. J. Cell Sci. 114, 3583-3590.
Zamir, E., Katz, B. Z., Aota, S., Yamada, K. M., Geiger, B. and Kam, Z. (1999).Molecular diversity of cell-matrix adhesions. J. Cell Sci. 112, 1655-1669.
Journal of Cell Science 119 ()