Embed Size (px)
Citation preview

MODIFIED STRUCTURAL INSULATED PANELS USING THREE-DIMENSIONAL
HOLLOW-CORE WOOD-STRAND COMPOSITE SANDWICH
PANEL STRUCTURAL SKINS
By
BAILEY RAE BROWN
A thesis submitted in partial fulfillment of
the requirements for the degree of
MASTER OF SCIENCE IN CIVIL ENGINEERING
WASHINGTON STATE UNIVERSITY
Department of Civil and Environmental Engineering
May 2012

iii
ACKNOWLEDGMENTS
I would like to thank Dr. Bender for providing me with the opportunity to work on
this project and for encouraging my specialization within building envelopes, Dr.
Richards for being the heat transfer guru, Liv for her enthusiasm and kindness, and
the USDA Wood Utilization Research Program for the funding that made this
investigation possible. I would also like to thank Mom and Wayne for their
unconditional love and support and Aaron for his love, patience, and inspiration.
iv
MODIFIED STRUCTURAL INSULATED PANELS USING THREE-DIMENSIONAL
HOLLOW-CORE WOOD-STRAND COMPOSITE SANDWICH
PANEL STRUCTURAL SKINS
Abstract
by Bailey Rae Brown, M.S.
Washington State University
May 2012
Chair: Donald A. Bender
In 2010, the United States was the largest energy consumer of the world with 40 percent of this
energy consumed by the building sector. In an effort to curb this consumption, legislation has
continued to restrict building energy codes, some of which affect the design and construction of
the building envelope. If improperly designed for these new code restrictions, exterior envelopes
may promote moisture entrapment and/or microbial growth on or within the structure, harming
not only the structural integrity, but creating a dangerous environment for indoor inhabitants. In
the essence of striving for a more energy efficient and higher quality indoor environmental
conditions, this study investigates the traditional structural insulated panel (SIP) with a modified
three-dimensional hollow-core wood-strand composite sandwich panel (HCP) structural skin.
This high performance building panel capitalizes on the known benefits of SIPs, while aiming to
enhance thermal and moisture behavior.
Investigations of this modified SIP demonstrated that through passive ventilation of the exterior
structural skin cores, drying capabilities were increased. Parametric analysis between the
traditional SIP construction (with solid OSB skins) and the modified construction (with HCP
v
structural skins) revealed that the unique core of the HCP increased the surface area from which
to relieve moisture to circulating air. Results demonstrated that during hygrothermal modeling
simulations at ventilation flow rates of 0.2 L/s to 1.6 L/s, the modified construction significantly,
in not entirely eliminated, normalized microbial growth potential over standard construction.
A second case study focused on exterior and interior cores of the HCP skin filled with form
stable phase change material (PCM). The modified panel (with PCM at exterior cores or without
PCM entirely) was able to curb peak heat flux at the interior assembly surface by 6 to 35 percent.
Results also demonstrated potential moisture problems due to the impermeable nature of the
PCM. Even at heightened infiltration rates, entrapment of initial moisture content could not be
relieved and a potential for fungal decay was present. In the configuration studied, the potential
thermal benefits of PCM were outweighed by the increased risk of moisture entrapment and
associated microbial growth and decay risks.
vi
TABLE OF CONTENTS
ACKNOWLEDGEMENTS.....................................................................................................iii
ABSTRACT ........................................................................................................................... iv
LIST OF TABLES .................................................................................................................. x
LISTOF FIGURES ................................................................................................................. xi
CHAPTER 1: INTRODUCTION OF STRUCTURAL INSULATED PANELS WITH
THREE-DIMENSIONAL HOLLOW-CORE WOOD-STRAND COMPOSITE SANDWICH
PANEL SKINS
INTRODUCTION ........................................................................................................ 1
SANDWICH PANEL AND PREFABRICATED PANELIZED
CONSTRUCTION HISTORY ...................................................................................... 2
THREE-DIMENSIONAL HOLLOW-CORE WOOD-STRAND COMPOSITE
SANDWICH PANELS ................................................................................................. 4
MOISTURE RELATED BUILDING ENVELOPE FAILURE ..................................... 5
MOISTURE DESIGN CRITERIA – MINIMIZING MICROORGANISM
GROWTH POTENTIAL .............................................................................................. 7
ENERGY CONCERNS ................................................................................................ 7
HYGROTHERMAL MODELING ............................................................................... 9
OBJECTIVES AND APPROACH.............................................................................. 11
REFERENCES ........................................................................................................... 13
FIGURES ................................................................................................................... 17
CHAPTER 2: PARAMETRIC EVALUATION OF THE DRYING POTENTIAL OF
STRUCTURAL INSULATED PANELS WITH THREE-DIMENSIONAL HOLLOW-CORE
WOOD-STRAND COMPOSITE SANDWICH PANEL SKINS
ABSTRACT ............................................................................................................... 18

vii
INTRODUCTION ...................................................................................................... 19
Structural Insulated Panel Construction and Traditional Wood Framing .......... 19
Three-Dimensional Hollow-Core Wood-Strand Composite Sandwich Panels ......
....................................................................................................................... 20
Drying Potential ............................................................................................. 21
Objectives and Approach ................................................................................ 21
LITERATURE REVIEW ........................................................................................... 22
MATERIALS AND ENVELOPE ASSEMBLIES ...................................................... 24
HYGROTHERMAL MODELING ............................................................................. 25
Internal Calculations: Heat and Moisture Source ............................................. 26
Air Exchange Rates ......................................................................................... 28
Climate Zones and Weather Data .................................................................... 28
MOISTURE DESIGN CRITERIA.............................................................................. 29
ANALYSIS, RESULTS, AND DISCUSSION ........................................................... 30
Microbial Growth Potential ............................................................................. 31
SUMMARY AND CONCLUSIONS .......................................................................... 34
REFERENCES ........................................................................................................... 36
TABLES .................................................................................................................... 41
FIGURES ................................................................................................................... 42
CHAPTER 3: EVALUATION OF INTEGRATING FORM STABLE PHASE CHANGE
MATERIAL WITH THREE-DIMENSIONAL HOLLOW-CORE WOOD-STRAND
COMPOSITE STRUCTURAL INSULATED PANELS
ABSTRACT ............................................................................................................... 49
INTRODUCTION ...................................................................................................... 50

viii
Three-Dimensional Hollow-Core Wood-Strand Composite Sandwich Panel .. 51
Phase Change Materials .................................................................................. 51
Objectives and Approach ................................................................................ 53
LITERATURE REVIEW ........................................................................................... 54
MATERIALS AND ENVELOPE ASSEMBLIES ...................................................... 57
HYGROTHERMAL MODELING ............................................................................. 58
Internal Calculations: Transport Equations ...................................................... 60
Climate Zones and Weather Data .................................................................... 61
MOISTURE DESIGN CRITERION ........................................................................... 62
RESULTS AND DISCUSSION ................................................................................. 63
SUMMARY AND CONCLUSIONS ......................................................................... 66
REFERENCES ........................................................................................................... 68
TABLES ................................................................................................................... 71
FIGURES ................................................................................................................... 73
CHAPTER 4: SUMMARY AND CONCLUSIONS ............................................................... 78
APPENDIX
A. UNIT CONVERSION TABLE ................................................................................... 83
B. WUFI Pro 5.1 ............................................................................................................. 84
C. CLIMATE SIMULATION DATA ............................................................................. 86
D. MATERIAL PROPERTIES ....................................................................................... 95
E. SURFACE TRANSFER COEFFICIENTS ............................................................... 109
F. UNITED STATES REGULATIONS TO PROMOTE ENERGY SAVINGS IN
BUILDINGS ............................................................................................................ 113

ix
G. CHAPTER 2 RESULTS ........................................................................................... 116
H. CHAPTER 3 RESULTS ........................................................................................... 121
I. APPENDICES REFERENCES................................................................................. 122
x
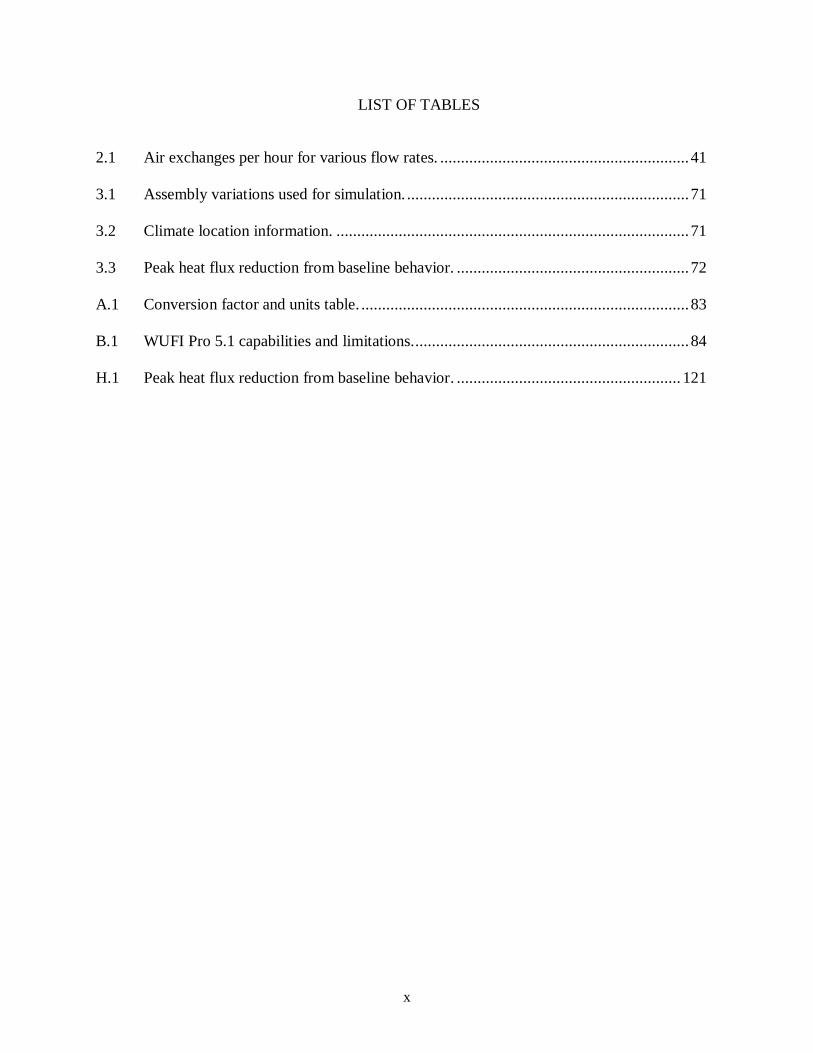
LIST OF TABLES
2.1 Air exchanges per hour for various flow rates. ............................................................ 41
3.1 Assembly variations used for simulation. .................................................................... 71
3.2 Climate location information. ..................................................................................... 71
3.3 Peak heat flux reduction from baseline behavior. ........................................................ 72
A.1 Conversion factor and units table. ............................................................................... 83
B.1 WUFI Pro 5.1 capabilities and limitations. .................................................................. 84
H.1 Peak heat flux reduction from baseline behavior. ...................................................... 121

xi
LIST OF FIGURES
1.1 Exploded view of the hollow core panel. .................................................................... 17
2.1 Exploded view of the hollow core panel ..................................................................... 42
2.2 Increased drying potential depiction............................................................................ 43
2.3 Baseline envelope assembly developed for analysis. ................................................... 43
2.4 Proposed envelope assembly developed for analysis. .................................................. 44
2.5a Top view of hollow core panel. ................................................................................... 44
2.5b Core variations used for one-dimensional analysis. ..................................................... 45
2.6 Houston normalized microbial growth potential for warm year simulations. ............... 45
2.7 Houston normalized microbial growth potential for cold year simulations. ................. 46
2.8 Chicago normalized microbial growth potential for warm year simulations................. 47
2.9 Seattle normalized microbial growth potential for cold year simulations. .................... 48
3.1 Exploded view of the hollow core panel. .................................................................... 73
3.2 Baseline envelope assembly one-dimensional cross-section. ....................................... 73
3.3 Proposed envelope assembly one-dimensional cross-section. ...................................... 74
3.4 Example peak heat flux shift and reduction for Chicago, warm year simulations. ........ 74
3.5 Heat flux data for Phoenix, warm year simulation. ...................................................... 75
3.6 Heat flux data for Phoenix, cold year simulations ....................................................... 75
3.7 Seattle heat flux for baseline and proposed assemblies. ............................................... 76
3.8 Houston heat flux during summer (warm). .................................................................. 76
3.9 Moisture content levels of OSB layers trapped by impermeable materials. .................. 77
C.1 Chicago, Illinois. Zone 5A External Boundary Conditions: Warm Year ..................... 87
C.2 Chicago, Illinois. Zone 5A External Boundary Conditions: Cold Year ....................... 88

xii
C.3 Houston, Texas. Zone 2A External Boundary Conditions: Warm Year ...................... 89
C.4 Houston, Texas. Zone 2A External Boundary Conditions: Cold Year. ........................ 90
C.5 Seattle, Washington. Zone 4C External Boundary Conditions: Warm Year. ................ 91
C.6 Seattle, Washington. Zone 4C External Boundary Conditions: Cold Year. .................. 92
C.7 Phoenix, Arizona. Zone 2B External Boundary Conditions: Warm Year. .................... 93
C.8 Phoenix, Arizona. Zone 2B External Boundary Conditions: Cold Year. ..................... 94
D.1 Material properties for fiber cement siding................................................................ 101
D.2 Material properties for 13mm air layer. ..................................................................... 102
D.3 Material properties for spun bonded polyolefine membrane. ..................................... 103
D.4 Material properties for oriented strand board............................................................. 104
D.5 Material properties for 20mm air layer. ..................................................................... 105
D.6 Material properties for form-stable phase change material. ....................................... 106
D.7 Material properties for expanded polystyrene insulation. .......................................... 107
D.8 Material properties for gypsum board. ...................................................................... 108
E.1 WUFI Pro 5.1 surface transfer coefficient screen shot. .............................................. 109
G.1 Microbial growth potential for Chicago, IL (cold year). ............................................ 117
G.2 Microbial growth potential for Chicago, IL (warm year). .......................................... 117
G.3 Microbial growth potential for Chicago, IL (cold year). ............................................ 118
G.4 Microbial growth potential for Houston, TX (warm year). ........................................ 118
G.5 Microbial growth potential for Houston, TX (cold year). .......................................... 119
G.6 Microbial growth potential for Seattle, WA (warm year). ......................................... 119
G.7 Microbial growth potential for Seattle, WA (cold year). ............................................ 120
G.8 Microbial growth potential for Seattle, WA (warm year). ......................................... 120
xiii
Dedication
This thesis is dedicated to my gpa, the late David R. Stone. Because of
you and for you, I will always explore the serenity held within nature,
savor the gift of the written word, and simply take time for myself.

1
Chapter 1:
INTRODUCTION OF STRUCTURAL INSULATED PANELS WITH
THREE-DIMENSIONAL HOLLOW-CORE WOOD-STRAND
COMPOSITE SANDWICH PANEL SKINS
INTRODUCTION
The recent development of a wood composite sandwich panel with a hollow three-dimensional
core has created many opportunities for new high performance building panels and assemblies
(Shilo W. Weight and Yadama 2008a; Shilo W. Weight and Yadama 2008b; S.W. Weight 2007;
C. R. Voth 2009; C. Voth and Yadama 2010; White 2011). In this study, the proposed building
envelope assembly is constructed of an insulated core and three-dimensional hollow-core wood-
strand composite sandwich panel (HCP) structural skins that combine the benefits of traditional
structural insulated panels (SIP) with added strength, sustainability, and versatility. As a whole,
the panel system has less embodied energy, uses renewable raw materials, and has high specific
strength and stiffness that add to the panels’ core geometry capable of improving drying
potential, housing utilities, or increasing thermal storage. This study specifically focuses on a
parametric analysis of a proposed modified SIP (with HCP skins) versus a commercially
available SIP (with solid OSB skins) to reveal the benefits of either passively venting/ventilated
the uniquely design three-dimensional hollow-core or instead filling these voids with form stable
phase change material (PCM).
2
SANDWICH PANEL AND PREFABRICATED
PANELIZED CONSTRUCTION HISTORY
Following the Great Depression, the stimulation of the United States construction industry
became a strong culmination of societal and governmental factors. The growing trends inspired
by European housing design of the 1920’s followed through the years preceding World War II to
meet the growing desire for affordable housing and stimulus money set forth by the New Deal.
During this time both architects and engineers rushed to meet the demand for simple and budget
friendly homes for the mass majority, resulting in a push for prefabrication and panelized
construction techniques (Rosenbaum 1993). The influences of this era fashioned many homes
that were simplistic, easily constructible and site unspecific – characteristics similar to those of
the growing housing trends seen today in the United States.
Some of the first sandwich panels came from within the organic architecture of Frank Lloyd
Wright’s Usonian homes. Finished in 1936 on the Jacobs House, Usonian sandwich panels made
their debut as board and batten siding screwed to both sides of a plywood core sandwiched
between two layers of building paper (Wright and Sergeant 1976). These walls were said to
have provided adequate thermal insulation along with durability, strength, and aesthetic
simplicity with only drawbacks in acoustical performance and difficulties related to the ease of
electrical wiring. Some seventy years later, the USDA Forest Products Laboratory is still
building upon the idea of sandwich panels (Hunt et al., 2004). Most recently, three-dimensional
engineered fiberboard sandwich panels have been developed for potential use as temporary
building structures for military or emergency shelter applications (Winandy et al. 2005). Similar
to those housing remedies amongst the Great Depression, these temporary structures are

3
envisioned as kits that are light, easily transported, and constructed on site requiring few tools
and a minimal number of workers.
As for panelized construction, prefabrication efforts of the Great Depression era were pioneered
by the USDA Forest Products Laboratory (Allen and Thallon 2011). The first panelized
products in 1935 were un-insulated and constructed of 1 x 3 framing members sandwiched
between two layers of plywood. Limited by not only energy efficiency, these panels, thus the
home structure, was strongly governed by transportation and installation considerations such as
delivery truck size and craning fees. However, in 1952 the progression of panelized construction
again peaked with the integration of insulation to create a sandwich panel considerably similar to
the modern SIP (Allen and Thallon 2011). The stressed-skin panels were constructed by Alden
B. Dow, an apprentice of Frank Lloyd Wright, and were constructed of oriented strand board
(OSB) skins adhered with phenolic glue to a 3 ½” core insulation of expanded polystyrene or
extruded polystyrene insulation. Produced at the size of a typical material sheet, these panels
developed by Dow alleviated the transportation, housing design, and thermal constraints that
earlier prefabricated walls had faced.
Today, structural insulated panels with OSB skins have penetrated the single and multifamily
residential and light commercial construction market as exterior wall, roof, and floor components
(Structural Insulated Panel Association and APA - The Engineered Wood Association 2007).
Commonly, SIP structures are known to reduce labor intensity, construction time, and provide
cost savings for its inhabitants. The reduction of thermal bridging, air infiltration, and increase
in thermal resistance, when comparing SIP construction with typical two-by-four wood framed
construction, demonstrates a great reduction in building energy consumption. According to the
Structural Insulated Panel’s Design Guide (Structural Insulated Panel Association and APA -

4
The Engineered Wood Association 2007), this reduction is so great that SIP construction is now
being targeted as a net zero energy option when used with other energy saving strategies and
mechanisms. Research performed on 4” SIP construction has shown that infiltration may be
decreased by 90 percent and whole wall thermal resistance value may increase from 9.6 to 14
percent compared to traditional two-by-four construction at 16 inches on center with batt
insulation (Structural Insulated Panel Association and APA - The Engineered Wood Association
2007).
THREE-DIMENSIONAL HOLLOW-CORE WOOD-STRAND
COMPOSITE SANDWICH PANELS
The selection of the HCP, as shown in Figure 1.1, for research in building envelope performance
was based on the physical and environmental benefits as presented by Voth (2009). Voth (2009)
presented that each HCP has a specific bending stiffness 88 percent greater than commercially
produced OSB and 71% stiffer than commercially available plywood, both of comparable
thickness. Therefore, use of the HCP as structural skins in a SIP application would provide not
only additional strength and stiffness to the structural integrity of SIP design, but the three-
dimensional form of the corrugated-like core was shown by White (White 2011) to provide an
opportunity to house additional energy saving technologies. It has been suggested that the cores
of each HCP provide a unique opportunity to house electrical, plumbing, heating or ventilation
components. As for environmental effects, this panel has a value-added opportunity for utilizing
small diameter timber with little commercial value. By creating an economically viable use for
these small timbers from forest thinning, the risk of wildfire is reduced and forest health is
improved.

5
HCP is also a product that offers savings in energy and water usage during production. Each
panel uses only 40% of the wood-strands and resin required to construct an OSB panel of
comparable thickness (Voth 2009). Its thin walled core uses less energy and water during the
mold pressing process by utilizing a dry (rather than wet) formed pressing process (Voth 2009).
As mentioned previously, the USDA Forest Products Laboratory (FPL) is still building upon the
idea of their sandwich panels, known as 3DEF, for potential military and emergency shelter
applications (Hunt et al. 2004). The 3DEF product can be made of any biofiber which capitalizes
on adding value to waste materials such as small diameter trees, corrugated paperboard, and
paper mill waste. The hollow-cores may be used for electrical, heating, ventilation, insulation, or
plumbing purposes. The FPL has suggested that the core design may be stacked for added
stability and may be faced with such materials as gypsum board, intumescent paints, or
cementitious materials for fire protection (Hunt et al. 2004).
MOISTURE RELATED BUILDING ENVELOPE FAILURE
Most building envelope failures are related to moisture. The causes of building dampness are
ubiquitous, with a recent increase in building dampness related to an influx of inadequate
envelope design, poor material performance, inferior workmanship, urbanization, and climate
change related weather pattern variability (World Health Organization 2009). Regardless of the
cause, moisture intrusion and damp indoor spaces instigate the transport and/or growth of spores,
toxins, volatile organic compounds, or other pollutants known to damage the health of
inhabitants. In 2004, it was estimated that asthma caused by dampness and mold in homes
affected 4.6 million people, costing 3.5 billion dollars annually (Mudarri and Fisk 2007). A
summary from the Institute of Medicine's, Damp Indoor Spaces and Health (Institute of
6
Medicine Committee on Damp Indoor Spaces and Health 2004) showed sufficient evidence has
associated upper respiratory tract symptoms, coughing, wheezing, and asthma exacerbation with
exposure to damp indoor environments. Similarly, hypersensitivity pneumonitis, severe
respiratory infections, fungus related illnesses, and potential lung infections of individuals with
compromised immune systems has been associated with exposure to microbial agents in damp
indoor spaces (Institute of Medicine Committee on Damp Indoor Spaces and Health 2004).
Not only is there potential harm to inhabitants, but the presence of microbial growth on wood
based product can impact the structural integrity if wood decaying fungi are given the
opportunity to germinate. Whereas mold and non-decaying fungi feed from the contents within
and on cells, thus not damaging the wood structure, wood decaying fungi feed on the wood cells
and significantly degrade strength and stiffness. At relative humidity values nearing 100 percent,
wood based products meet a fiber saturation point at which cells are holding the maximum
bound water possible without the presence of free water. At this point, moisture content of the
wood material can be between low twenty to mid thirty percent, below which mold growth can
occur, and above which decay fungi can thrive. The growth of both mold and fungi require the
presence of moisture, oxygen, favorable temperatures, and a food source to survive.
The first step in preventing biological growth and degradation issues within the building
envelope is to address moisture issues during the design phase to avoid replacement, remediation
or litigation in the future. Of the three major factors affecting building envelope performance,
environment and occupant usage are the most difficult to control, while material selection may
be the easiest. Therefore, the development of the HCP as a building envelope material will
require extensive investigation to minimize moisture infiltration that carries the potential to
harbor microbial growth.

7
MOISTURE DESIGN CRITERIA – MINIMIZING
MICROORGANISM GROWTH POTENTIAL
Microbial growth criteria for the testing of the HCP for a structural skin application should be
developed through consideration of the minimum water activity required for saprophytic
microorganisms to germinate. Currently, ANSI/ASHRAE Standard 160-2009 Criteria for
Moisture Control Design Analysis in Buildings is a suggested standard that aims at reducing
growth of microorganisms, such as mold (American Society of Heating, Refrigerating and Air-
Conditioning Engineers, Inc. 2009). ASHRAE Standard 160 focuses on appropriate testing
parameters to be used for design specific testing and includes recommendations on initial
moisture content for materials, temperature regulation of indoor environments, and hygrothermal
software simulation requirements. ASHRAE Standard 160 will be the basis for which
simulations of the HCP are based.
ENERGY CONCERNS
In 2008, the United States was the largest consumer of energy in the world (D&R International,
Ltd. 2011). Commercial buildings consumed 18.4 percent of the total energy demand – the
majority of which was consumed by office structures (D&R International, Ltd. 2011). It is
estimated that heating, lighting, and cooling of spaces represented half of the energy exhausted in
the commercial building sector (D&R International, Ltd. 2011). As the United States realizes the
importance of reducing energy consumption, the government has strongly begun to influence
federal construction projects, state energy legislation, and the private sectors.
On the federal government level, Executive Order 13423 signed on January 24, 2007 and enacted
on February 17, 2009 mandated that federal departments play an active role in energy and water

8
efficiency and reduction of greenhouse gas emissions. This order has led to the Guiding
Principles for Federal Leadership in High Performance and Sustainable Buildings Memorandum
of Understanding (MOU) which demands new federal government buildings to perform at 30
percent below the baseline building standards of ASHRAE Standard 90.1-2004 (United States
Federal Government 2006). An even more demanding Order was released on October 5, 2009,
Executive Order 13514, which has declared federal buildings built after 2020 to perform as net
zero structures by 2030 (Federal Energy Management Program 2011).
Affecting a more local sector, the Department of Energy State Energy Program (SEP) serving to
promote energy efficiency among the states and territories of the United States (U.S. Department
of Energy 2011) was provided with 3.1 billion dollars through the American Reinvestment and
Recovery Act (U.S. Department of Energy 2011). This additional funding heightened the
financial incentive of state interest in energy efficiency concerns and encouraged numerous
states to begin adopting the most recent IECC and ASHRAE 90.1-2007 due to the strict
requirements for receiving the second funding phase of each awarded grant (Eldridge et al.
2009). Several dozen states began the adoption of the grant requiring codes between the 2009
and 2010 year (Molina et al. 2010).
To encourage the private commercial sector, the Better Buildings Initiative was declared in
February 2011 with the goal of increasing efficiency of commercial buildings by 20 percent by
the year 2020 (U.S. Department of Energy 2012). This announcement sparked the development
of such programs as the Better Building Challenge and the Better Buildings Neighborhood
Program, but has also rallied the Department of Energy to team with Congress, the Appraisal
Foundation, Small Business Administration, and the National Institute of Standards and
Technology to promote energy efficiency within the private sector. Propositions for the fiscal
9
year 2012 have demanded more money for state energy code adoption aid and loans for
commercial energy investments.
Such orders, acts, and development of the incentives to conserve energy provide a strong
initiative to increase the energy saving benefits currently available with standard SIP
construction. Given that the majority of energy consumed by the United States is by the
commercial energy sector, the development of a stronger more thermally robust SIP, such as the
proposed assembly of this investigation, could provide a strong opportunity to meet the strict
codes and regulations quickly approaching. Appendix D contains an expanded discussion of
U.S. energy codes and related legislation.
HYGROTHERMAL MODELING
Given the early development stage of the proposed wall assembly, natural exposure test facilities
were not pursued for the investigations of this research. This decision was based on the financial
and time convenience that other investigative opportunities could offer. Therefore, in this study,
hygrothermal modeling was employed to perform the long-term energy and moisture
performance investigations of each specified wall construction.
To investigate the complex coupled heat and moisture analyses demanded by this research, a
computer simulation based program was selected over a simplified tool, such as the Glaser
method, for many reasons – two of which are discussed here:
The use of computer simulations allowed for a transient state analysis rather than the
steady state analysis provided by a simplified tool. Transient state considerations opened
the door for the use of time variable meteorological data and consideration of the driving
potential effects on material property variability.
10
The inclusion of more transport mechanisms within each wall analysis provides for a
more realistic response of the construction. Hygrothermal investigation considers both
heat and moisture transport. Simplified tools account for a limited number of transport
mechanisms such as thermal conduction and vapor diffusion. The use of hygrothermal
computer based simulations allowed for thermal conduction, enthalpy flow, and both
short wave and long wave radiation for heat transport and vapor diffusion, capillary
conduction and surface diffusion for moisture transport.
There are numerous hygrothermal modeling programs on the market today, however, for this
investigation WUFI Pro 5.1, a development of the Fraunhofer Institute for Building Physics, was
chosen (Fraunhofer Institute for Building Physics 2011). WUFI (or rather Wärme- Und
Feuchtetransport Instationär which stands for “transient heat and moisture transport” (Fraunhofer
Institute for Building Physics 2011)) stands as one of the most highly validated and
professionally respected models. The basis of WUFI is defined by Künzel (1995) in
Simultaneous Heat and Moisture Transport in Building Components and has since been
validated by Künzel (1998), Gatland et al (2007), and Fraunhofer Institute for Building Physics
(Anon. 2010). Karagiozis (2004), a leading researcher within hygrothermal investigation and
simulation software development, identifies the WUFI software family multiple times for the
models’ simulation capabilities and recommends the use of the software for a new approach to
wall design.
A summary of the many capabilities, along with limitations of WUFI Pro 5.1 may be found in
Appendix B. The limitations of the hygrothermal model were identified and considered – the
specific impact these limitations may have had on various investigation objectives are discussed
in the following chapters.

11
OBJECTIVES AND APPROACH
Novel wall envelope constructions are needed to mitigate moisture related failures such as
microbial growth and decay, and to meet energy reduction goals and legislation. Through the
integration of the HCP, form stable PCM, and manipulation of the popular SIP, this research is a
thermal and moisture related investigation of a newly proposed wall system. This research
focuses primarily on a parametric analysis of the behavior of two wall systems:
Baseline SIP: a standard structural insulated panel wall system constructed of an
expanded polystyrene insulation core and solid oriented strand board structural skins
Proposed SIP: a modified structural insulated panel wall system constructed of an
expanded polystyrene insulation core and hollow core panel structural skins
Specific study objectives include:
1. Determine the drying capability of the proposed SIP and compare this behavior to the
drying capability of the baseline SIP.
2. Determine the thermal capabilities and moisture related affects of the proposed SIP, with
and without the incorporation of phase change material, and compare this behavior to the
thermal capabilities of the baseline SIP.
Objective 1 and Objective 2 are discussed in Chapter 2 and Chapter 3, respectively. The
approach for accomplishing each objective is very similar and involves integrating each of the
above noted wall systems into an identical rainscreen clad wall assembly. Hygrothermal
modeling is then employed to simulate the wall assemblies within selected United States climate
zones and results are analyzed based on criteria specific to each objective. A parametric analysis

12
is performed for each objective to compare the behaviors of the baseline assembly and proposed
assembly.

13
REFERENCES
Allen, Edward, and Rob Thallon. 2011. Fundamentals of Residential Construction. Hoboken,
New Jersey: John Wiley and Sons, March 10.
American Society of Heating, Refrigerating and Air-Conditioning Engineers, Inc. 2009.
ANSI/ASHRAE Standard 160-2009 Criteria for Moisture-Control Design Analysis in
Buildings. Atlanta, GA.
Anon. 2010. IBP / Software / WUFI. April 30. http://www.wufi-pro.com/.
Bush, G. W. 2007. Executive Order 13423 - Strengthening Federal Environment, Energy, and
Transportation Management. Vol. 72. Federal Register 17. United States of America,
January 26.
Eldridge, Maggie, Michael Sciortino, Laura Furrey, Seth Nowak, Shruti Vaidyanathan, Max
Neubauer, Nate Kaufman, et al. 2009. The 2009 State Energy Efficiency Scorecard.
American Council for an Energy-Efficient Economy, October.
Federal Energy Management Program. 2011. Executive Order 13514 - Federal Leadership in
Environmental, Energy, and Economic Performance. U.S. Department of Energy, July.
Fraunhofer Institute for Building Physics. 2011. WUFI Pro. Stuttgart, Germany: Fraunhofer
Gesellschaft.
Gatland, SD, AN Karagiozis, C. Murray, and K. Ueno. 2007. “The Hygrothermal Performance
of Wood-Framed Wall Systems Using a Relative Humidity-Dependent Vapour Retarder
in The Pacific Northwest.” ASHRAE Transaction.

14
Hunt, J.F., D.P. Harper, and K.A. Friedrich. 2004. Three-Dimensional Engineered Fiberboard:
Opportunities for the Use ofLow Valued Timber and Recycled Material. In 38th
International Wood Composites Symposium, 207-216. Pullman, Washington: Washington
State University, April 6.
Institute of Medicine Committee on Damp Indoor Spaces and Health. 2004. Damp indoor spaces
and health. Washington, D.C.: National Academies Press.
D&R International, Ltd. 2011. 2010 Buildings Energy Data Book. U.S. Department of Energy,
March.
Karagiozis, A. 2004. Application of advanced tools to develop energy efficient building
envelopes that are durable. In Proceedings of Performance of the Exterior Envelopes of
Whole Buildings IX International Conference. Clearwater Beach, FL.
Künzel, H. M. 1998. “Effect of interior and exterior insulation on the hygrothermal behaviour of
exposed walls.” Materials and Structures 31 (2): 99–103.
Künzel, H.M. 1995. Simultaneous heat and moisture transport in building components.
Fraunhofer IRB Verlag Suttgart.
Molina, Maggie, Max Neubauer, Michael Sciortino, Seth Nowak, Shruti Vaidyanathan, Nate
Kaufman, and Anna Chittum. 2010. The 2010 State Energy Efficiency Scorecard.
American Council for an Energy-Efficient Economy, October 13.
Mudarri, D., and WJ Fisk. 2007. “Public health and economic impact of dampness and mold.”
Indoor Air 17 (3): 226–235.

15
Rosenbaum, Alvin. 1993. Usonia : Frank Lloyd Wright’s design for America. Washington, D.C.:
Preservation Press, National Trust for Historic Preservation.
Structural Insulated Panel Association, and APA - The Engineered Wood Association. 2007.
“Structural Insulated Panels Product Guide.” Form No. H650 (December).
U.S. Department of Energy. 2011. Weatherization and Intergovernmental Program: State Energy
Program. July 19. http://www1.eere.energy.gov/wip/sep.html.
———. 2012. Better Buildings. January 4.
http://www1.eere.energy.gov/buildings/betterbuildings/.
United States Federal Government. 2006. Federal Leadership in High Performance and
Sustainable Buildings Memorandum of Understanding. January.
Voth, C., and V. Yadama. 2010. Sustainable Lightweight Wood-Strand Panels for Building
Construction. In International Convention of Society of Wood Science and Technology
and United Nations Economic Commission for Europe - Timber Committee. Geneva,
Switzerland, October 11.
Voth, C.R. 2009. Lightweight Sandwich Panels Using Small-diameter Timber Wood-strands and
Recycled Newsprint Cores. Washington State University.
Weight, S.W. 2007. A novel wood-strand composite laminate using small-diameter timber.
Washington State University.
Weight, Shilo W., and Vikram Yadama. 2008a. “Manufacture of laminated strand veneer (LSV)
composite. Part 2: Elastic and strength properties of laminate of thin strand veneers.”
Holzforschung 62 (6) (November): 725-730.

16
———. 2008b. “Manufacture of laminated strand veneer (LSV) composite. Part 1: Optimization
and characterization of this strand veneers.” Holzforschung 62 (6) (November): 718-724.
White, Nathan. 2011. Strategies for Improving Thermal and Mechanical Properties of Wood-
Strand Composites. Washington State University, December.
Winandy, J.E., J.F. Hunt, C. Turk, and J.R. Anderson. 2005. Emergency Housing Systems from
Three-Dimensional Engineered Fiberboard. USDA Forest Service, Forest Products
Laboratory. General Technical Report No. GTR-FPL-166.
World Health Organization. 2009. WHO Guidelines for Indoor Air Quality: Dampness and
Mould. WHO.
Wright, Frank Lloyd, and John Sergeant. 1976. Frank Lloyd Wright’s usonian houses: the case
for organic architecture. New York, N.Y.,: Watson-Guptill.

17
FIGURES
Figure1.1. Exploded view of the hollow core panel. The three-
dimensional hollow- core wood- strand composite sandwich panel was
used as structural skins for this study. This sandwich panel took the place of the oriented strand board structurally skins typical used for SIPs.
Photo courtesy of the Composite Materials and Engineering Center –
Washington State University.

18
Chapter 2:
PARAMETRIC EVALUATION OF THE DRYING POTENTIAL OF STRUCTURAL
INSULATED PANELS WITH THREE-DIMENSIONAL HOLLOW-CORE WOOD-
STRAND COMPOSITE SANDWICH PANEL SKINS
ABSTRACT
Priority to conserve energy in buildings has the potential to increase microbial growth and decay
within the building envelope if improperly designed to exhibit drying capabilities of initial or
intruding moisture. One common method of managing moisture is the inclusion of ventilated
cladding at the exterior envelope. The effectiveness of this application as a moisture reducing
mechanism for structural insulated panel (SIP) construction, although recommended by most SIP
manufacturers, lacks published research. Recently, the Composite Materials and Engineering
Center at Washington State University has developed a new high performance building panel
that utilizes three-dimensional hollow-core wood-strand composite sandwich panel skins that
provide a means for additional ventilation, insulation, or utility placement. A parametric analysis
was performed between traditional SIP construction (with solid OSB skins) and the proposed
assembly from results of simulated exposure to various ventilation flow rates at the exterior
structural skins. The moisture design and analysis criterion performed was defined by
ANSI/ASHRAE Standard 160-2009: Criteria for Moisture-Control Design Analysis in Buildings,
and the results demonstrated the proposed assembly significantly decreased or eliminated the
potential for microbial growth when compared to traditional SIP panels.

19
INTRODUCTION
An unintended consequence of energy conservation efforts in building design can often lead to
moisture accumulation by reducing the drying capabilities of wall assembly materials. These
inadequacies in design can lead to costly negative effects on both the structure and its
inhabitants. In recent years, the issue of microbial growth and dampness has created asthma-
related problems in 4.6 million people costing 3.5 billion dollars annually (Mudarri and Fisk
2007). The issue has also sparked related federal legislative proposals such as the Melina Bill
(H.R. 1269) and initiated high cost litigation over microbial growth damages to indoor
environmental quality or structural integrity (Conyers 2005).
Structural Insulated Panel Construction and Traditional Wood Framing
A popular energy saving envelope design for low rise commercial and many residential
applications is the structural insulated panel (SIP) that contains oriented strand board (OSB)
structural skins and an expanded polystyrene foam insulation core. SIP panel construction is
gaining market share over traditional two-by framed construction which, in terms of moisture,
responds much differently than the SIP. When properly designed, two by framed wall envelopes
breathe from interior boundary climate to exterior boundary climate and vice versa depending on
various driving potentials, due to an absence of impermeable material layers. The SIP, on the
other hand, contains layers of increasing permeability from the central insulating core outward.
Therefore, SIPs dry from the closed-cell insulating core to either the interior boundary climate or
exterior boundary climate. The drying capability is well understood for two-by framed wall
assemblies of traditional envelope materials due to popularity for many years, however, less is
known about the hygrothermal performance of SIP construction.

20
Due to the air tightness of the envelope design, the indoor air quality relating to SIP envelopes is
strongly dictated by the internal ventilation system of the structure. Indoor heating, ventilating,
and air conditioning systems have the ability to control indoor air humidity, freshness, and
temperature when employed with SIP construction. However, as well managed and controlled as
the indoor environment may be, the exterior environment is strongly governed by local climate
behavior. In regions of high rainfall (20 inches and greater annually), an air cavity and water
resistant barrier is recommended by the Structural Insulated Panel Association (2011) for the
purpose of providing drying potential at the exterior side of the SIP panel. This recommendation
for a vented/ventilated cavity and drainage plane for SIP construction is not supported by
published research confirming its effectiveness.
Three-Dimensional Hollow-Core Wood-Strand Composite Sandwich Panels
As discussed in Chapter 1, a recent development of the Composite Materials and Engineering
Center at Washington State University is the three-dimensional hollow-core wood-strand
composite sandwich panel (HCP) shown in Figure 2.1 (Shilo W. Weight and Yadama 2008a;
Shilo W. Weight and Yadama 2008b; S.W. Weight 2007; C. R. Voth 2009; C. Voth and Yadama
2010). The implementation of this panel as the structural skins for a SIP application has the
potential to capitalize on sustainability, structural robustness, energy savings, and drying
capabilities. As a product of low-value small-diameter-timber strands and a hollow three
dimensional core that utilizes less resin and processing energy, the embodied energy of this panel
is significantly lower than materials of comparable strength or size. Mechanical testing has also
demonstrated that the specific bending stiffness of the HCP exceeds a solid panel of the same
dimensions and material (Voth 2009).

21
Drying Potential
The use of this newly developed panel as structural skins for a SIP application could help to
relieve moisture accumulated at layers closest to the impermeable expanded polystyrene core for
two reasons:
1. SIP construction is often furred to provide a vented/ventilated air layer behind exterior
cladding. Drying potential of the exterior structural skin toward the exterior boundary
(away from the impermeable core) can be retarded by the water resistant barrier for layers
between the air cavity and impermeable insulation core. Inclusion of the HCP as an
exterior structural skin would introduce an additional layer of ventilation behind the
water resistant barrier.
2. The unique geometry of the HCP creates a greater amount of surface area in which
ventilated air may wick away moisture from the structural skin. As shown in Figure 2.2b,
the surface area exposed for drying is tripled in this one-dimensional case compare to the
single surface of OSB expected to dry from behind the water resistant barrier in Figure
2.2a.
Objectives and Approach
One objective of this study was to determine the long-term drying capabilities of the proposed
modified SIP using the HCP for structural skins by passively venting/ventilating the exterior
structural skin cores with a range of ventilation flow rates. The second objective was to perform
a parametric analysis of the response the proposed wall to that of a standard SIP wall
construction to determine the advantages and disadvantages of the implementation. The approach
followed to accomplish these goals included:

22
Determine the materials and construction to be investigated to represent a standard SIP
exterior envelope construction and a modified SIP with HCP structural skins.
Determine ventilation flow rates to be applied as exterior ventilation to the
vented/ventilated air cavities of each assembly.
Employ hygrothermal modeling to simulate the long-term response of each assembly
when subjected to external and internal boundary loadings.
Determine moisture design criteria to be used for evaluating both the microbial growth
potential and decay potential of the simulated assemblies.
Perform a sensitivity analysis on the biological growth potential at the most critical layer
of the assembly to evaluate drying capability as a function of ventilated air exchange rate.
Perform a parametric analysis within each climate zone between the modified SIP using
HCP skins and the traditional SIP using OSB skins to determine the advantages and
disadvantages of either construction.
LITERATURE REVIEW
Every building envelope is susceptible to moisture intrusion; therefore, mechanisms to reduce
moisture are typically integrated into the assembly, such as vertically strapped exterior cladding.
The intentions of this cavity are to act as a capillary break, provide a drainage plane when paired
with a water resistant barrier, reduce moisture bridging, and pressure equalize the cladding. This
cavity also has the potential to act as a ventilated space (Salonvaara et al. 2007). However,
whether inclusion of an air cavity as a moisture removal mechanism is advantageous or
disadvantageous is highly debated.

23
In some situations, a fully ventilated cavity may provide beneficial moisture control benefits.
Drying capabilities of the assembly can be increased by reducing the pressure differential across
the exterior cladding or by introducing convective air movement behind the cladding to reduce
moisture at the water resistant barrier. As presented in The Envelope Drying Rate Analysis Study
released by the Canada Mortgage and Housing Corporation (Building Envelope Research
Consortium 2001), the drying capabilities of twelve wood frame wall panels under steady
environmental conditions showed ventilated panels experienced a greater drying potential than
panels without ventilated cavities. Results from this same study (Building Envelope Research
Consortium 2001) demonstrated that thicker ventilation cavities, ventilated panels, or panels with
plywood sheathing all favored greater drying capabilities over thinner cavities, vented panels, or
OSB sheathing. Also, similar drying potential between sheathing covered in two layers of
asphalt impregnated building paper or spun bonded polyolefine house wrap was demonstrated.
In 2009, Karagiozis and Künzel published results paralleling conclusions made by the Canada
Mortgage and Housing Corporation, but for hygrothermal research performed for a brick wall
(Building Envelope Research Consortium 2001). Results from the hygrothermal modeling
software WUFI 4.1 demonstrated that OSB sheathing behind brick exhibited a greater drying for
ventilated air layers rather than vented layers.
The disadvantages, or even indifference, about ventilated assemblies has also been demonstrated.
Research performed by TenWolde et al (1995) suggested that ventilating a wall cavity with air of
high relative humidity did not always promote drying potential. During a series of tests, the only
walls to remain dry when exposed to high humidity indoor conditions (45 percent relative
humidity) were those that did not experience infiltrating air from the interior and contained
sheathing with a ¼ inch ventilated cavity behind waferboard cladding. Research conducted by
24
Hansen et al. (2002) on a series of non-ventilated and ventilated full scale wall tests exposed to
the natural climate of Denmark and high indoor humidity revealed inconsistent results for
justifying a preference toward ventilation or non-ventilation. Some wall tests performed
identically to support ventilated cavities, while other test walls revealed a greater drying potential
for non-ventilated cavities.
Some research even supports both sides of the vented/ventilated cavity debate such as ASHRAE
1091 Report #11 (Karagiozis 2004). In the investigation of ventilated drying and sheathing
membrane performance of the study, it was found that incorporating ventilation within an air
cavity behind a brick veneer wall system resulted in drying capabilities. Ventilation during the
fall season of some climates introduced moisture to the assembly from the circulation of
moisture rich air; however, this infiltration was still considered at a safe durability level. This
same study also reinforced that unvented cladding assemblies promote a greater hygric load on
the envelope and in some cases caused long-term durability issues.
MATERIALS AND ENVELOPE ASSEMBLIES
For this study, one baseline envelope design and two variations of the proposed wall assembly
were developed. Each consisted of 6 mm cement fiber board cladding furred with a 13 mm air
cavity backed by a spun bonded polyolefine water resistant barrier, a 140 mm closed cell
expanded polystyrene insulation core, and a 16 mm gypsum wallboard interior. The baseline
envelope assembly was constructed of 1 layer of 13 mm OSB at either side of the expanded
polystyrene core as shown in Figure 2.3. Each proposed assembly was of the same wall
construction as the baseline, however the interior and exterior skins used HCP as shown in
Figure 2.4.

25
The HCP structural skins investigated in this study were a three-dimensional form; however, the
modeling software used for investigation was limited to one-dimension. Therefore, the core of
the HCP was modeled twice to consider the core material placement due to maximum inflections
of the core ribbing. These core rib inflections are shown in Figure 2.5a which depicts a top view
of the HCP and Section A and Section B. The one-dimension section used for modeling for the
two variations of the HCP wall are shown in Figure 2.5b. Section A represents the proposed
assembly with core material toward the interior boundary. This section is referred to as the
“proposed right” assembly. Section B represents the proposed assembly with core material
toward the exterior boundary. This section is referred to as the “proposed left” assembly.
Material properties for each element were either calculated or taken from the material database
provided by the hygrothermal modeling software WUFI Pro 5.1 (Fraunhofer Institute for
Building Physics 2011) and are listed in Appendix D.
HYGROTHERMAL MODELING
Hygrothermal modeling was employed for the moisture performance evaluation of the HCP
skins for a number of reasons. Moisture within the building envelope stems from initial moisture
content levels of the materials or moisture introduced to the assembly by the interior or exterior
boundary conditions. However, introduction from the boundaries, especially the exterior
boundary, does not occur at a steady state. Use of hygrothermal modeling was able to account
for the transient introduction of moisture such as wind driven rain and the moisture properties of
inflow and outflow air of the ventilated air layers. These introductions of moisture were based
on meteorological data to simulate conditions for a more realistic drying and wetting response
that would be expected in actual field settings. Additional considerations for transient thermal

26
properties of the exterior boundary were also of importance for determining drying potential
created by the environment.
The simulations of this study were employed using the hygrothermal model WUFI Pro 5.1
(Fraunhofer Institute for Building Physics 2011), developed by Fraunhofer Institute of Building
Physics. The software selected had the ability to compute the coupled behavior of heat, air, and
moisture while utilizing real climate and material data to simulate the response of the multi-
layered envelope acting as one unit. Important characteristics of WUFI for this study included
the ability to account for wind driven rain and user defined moisture sources, sinks, and
generation rates, all which could provide a greater control of the moisture in the envelope as well
as a more realistic response. As demonstrated by Pankratz and Holm (2004), the use of a
hygrothermal model is a tremendous aid in the development of new building envelope design
construction and materials. Although hygrothermal modeling cannot replace laboratory or
natural climate exposure testing, the ability to quickly gauge the response of complex assemblies
over a range of conditions can save considerable time and money.
Internal Calculations: Heat and Moisture Source
WUFI Pro 5.1 uses an iterative calculation process to satisfy two transport equations that
converge to describe the coupled heat and moisture behavior of the programmed assembly at an
instance in time. For air flow related calculations, WUFI accounts for air exchange sources with
one heat source equation and one moisture source equation that consider both the ambient
conditions of infiltrating air and the air layer of interest. These equations are as follows
(Fraunhofer Institute for Building Physics 2011):
Equation 1

27
heat source strength [W/m2]
exterior air density [kg/m3]
ACH = air change rate of the ventilated layer [1/h]
thickness of ventilated layer [m]
specific heat capacity of dry air at constant pressure [J/kg K]
exterior air temperature [K]
ventilated layer temperature [K]
Equation 2
moisture source strength [kg/m2s]
exterior air water vapor concentration [kg/m3]
ventilated layer mean water vapor concentration [kg/m3]
The primary limitation of the WUFI model selected for this investigation is the one dimensional
analysis. This analysis excluded the effects for moisture bridging and the additional drying
capabilities that would have resulted from additional surface area of the HCP core exposed to
ventilation. For the parametric analyses of this study, constant air change rates were assumed at
the vented cavities as a mixture of exterior air and vent air. Therefore, convective transports
were completely eliminated from the analysis and comparison of all wall constructions.
However, the reduction to a one-dimensional analysis was to provide conservative results for the
performance of the assemblies of interest and the exclusion of convective transport was
compensated for with the consideration of buoyancy affects within the ventilation flow rates
used for simulation. For this reason, the use of WUFI Pro 5.1 was deemed appropriate for

28
gauging the response and comparison of behavior between the envelopes of different structural
skins.
Air Exchange Rates
Air exchange sources were included at both the cladding cavity and at the HCP exterior skin
cores (where applicable) for each envelope assembly investigated. Currently, characteristics of
ventilation flow for various wall assemblies have not been well quantified; however, ventilation
rates can be calculated through average cavity air flow rate estimations and environmental
assumptions such as performed by Salonvarra et al (1998). Variability in wind speed, inlet/outlet
geometry, ventilation slot height, temperature, and other environmental factors can all affect the
ventilation rate through an air layer cavity, therefore, this study used a common ventilation
modeling approach of subjecting each assembly to a range of rates frequently used in published
literature. The values selected for simulation were 1.6 L/s, 0.8 L/s, 0.4 L/s and 0.2 L/s and
represented the wind pressures, thermal buoyancy, and moisture buoyancy forces most prevalent
of the forces driving ventilation (Schumacher, Shi, and E. Burnett 2004; X. Shi, Schumacher,
and Burnett 2004; VanStraaten and Straube 2004). Calculations for air flow rates through both
the drainage plane cavity and HCP core cavity considered a 1.2m by 2.4m wall surface area
section (values based on common panel sizes) and volumes were calculated against the
volumetric flow rates to find a constant air change rate per hour. These air change rates used for
simulation are described in Table 2.1.
Climate Zones and Weather Data
Each wall assembly design was modeled in three separate climate zones as defined in the 2009
International Energy Conservation Code (International Code Council 2009). The zones were
29
selected to represent warm and cool climates with relatively high humidity conditions. The
climates zones simulated included Zone 2A: Houston, Texas; Zone 5A: Chicago, Illinois; Zone
4C: Seattle, Washington (International Code Council 2009). A graphical description of the
meteorological data used for simulations may be found in Appendix C.
WUFI ASCII climate format files supplied with WUFI Pro 5.1 were used to simulate the external
boundary conditions. Two separate simulation periods, each three years in length, were
performed for each climate. One simulation period represented a warm year (10% probability)
for the specific climate and the other a cold year (10% probability). Orientation of the assembly
was determined by analyzing the climate file for each climate zone to determine the most critical
direction of wind driven rain.
MOISTURE DESIGN CRITERIA
The criterion outlined in ANSI/ASHRAE Standard 160-2009: Criteria for Moisture-Control
Design Analysis in Buildings (American Society of Heating, Refrigerating and Air-Conditioning
Engineers, Inc. 2009), was used as guidance to define the interior boundary conditions, initial
moisture conditions of materials, moisture generation for occupancy, exterior boundary rain
loads, and rain penetration recommendations. The dynamic interior boundary conditions were a
function of the exterior climate and an interior air conditioning option was selected for a
temperature shift of 2.8 °C greater than the 24 hour running average outdoor temperature, a set
point for heating at 21.1 °C, and a set point for cooling at 23.9 °C. The indoor humidity input
was based on the ANSI/ASHRAE Standard 160-2009 intermediate method of indoor design
humidity. Moisture generation of the interior was based on occupancy use of the building as a
commercial office structure where the average moisture generation served as the design rate and

30
was determined from occupant densities maintained over a 10 hour work day at a moisture
generation rate of 3.5 kg/day/person. For simulation, the total moisture generation during the 10
hour work day was taken as an average rate over 24 hours. Initial moisture content of each
material was also in accordance with ANSI/ASHRAE Standard160-2009 and incorporated two
times the equilibrium moisture content at 80 percent relative humidity for each building material.
To account for possible leakage due to workmanship or durability failures, incidental wetting
was accounted for by applying a 1 percent rain penetration at the exterior surface of the water
resistant barrier.
ANALYSIS, RESULTS, AND DISCUSSION
For microbial growth to germinate and thrive, four conditions must be met and include the
presence of moisture, oxygen, adequate thermal conditions, and a food source - all of which are
present in a building envelope assembly. Oxygen, temperature, and building materials are very
difficult, if even possible, to control for wood based framed structures within natural outdoor
environments; therefore, the most effective mechanism for alleviating biological growth
responsible for structural damage and health hazards is to limit the moisture properties of the
environment. For microbial growth commonly known as mold, which grows on the surface of
almost any material, including wood, wallpaper, tile, insulation, etc., the relative humidity of the
material’s environment is to be considered.
Many sources of variability, such as interior moisture generation rates, interior ventilation rates,
variability in exterior wind properties, can dramatically affect the instigation of microbial
development and growth. Therefore, realistic but extreme moisture cases were used to simulate
and exemplify the variability in performance for each construction. Results of this investigation

31
are not presented in a quantitative manner of the data provided by simulations but rather a
qualitative comparison of moisture behavior for assemblies subjected to identical simulation
parameters.
Microbial Growth Potential
Analysis of the moisture performance was based on evaluation criteria defined by ASHRAE
Standard 160-2009 (American Society of Heating, Refrigerating and Air-Conditioning
Engineers, Inc. 2009). The standard criteria applied was initially defined by the IEA Annex 24
and used both the a-value (a water activity onset required for germination based on microbial
growth species, temperature, and substrate) and experimental data to determine the critical water
content a microbial growth spore requires for the onset of germination (Sanders 1966; IEA
Annex XIV: Condensation and Energy 1990). The IEA Annex recognizes that over 130,000
different microbial growth species exist, making it impractical to check for the development of
all species, therefore, a threshold defining a relative humidity greater than 80 percent and a
monthly running temperature average between 5 and 40C was considered as a requirement to
foster microbial growth (Sanders 1966).
Of the three year period simulated for each assembly, year one was considered as a neutralization
phase in which the initial moisture content of the construction materials adjusted to reach an
equilibrium within the system. Therefore, only the last two years were analyzed for predicting
long-term behavior. The hourly behavioral response at each monitoring position (shown in
Figure 2.3 and Figure 2.4) within the wall assembly was calculated for a 30-day running average
relative humidity and temperature window analyzed at every 24 hours. The days in which
microbial growth potential were present were added over the course of the two year assembly

32
behavior data for each monitoring position. Values were then normalized to the baseline
performance at 0.2 L/s for each weather year simulated within each climate zone. This provided
a normalized estimate of microbial growth potential.
Figure 2.6 depicts the normalized microbial growth potential for each Houston warm year
simulation at a range of ventilation flow rates when monitored at the water resistant barrier and
OSB interface of each wall case. As expected, as ventilation rates increase, the microbial growth
potential for all wall constructions reduces. This is apparent in the baseline case, in which the
baseline (ventilation only at the drainage plane) growth potential reduces by 70 percent when
ventilation flow rates increase from 0.2 to 1.6 L/s. Comparing baseline and proposed assembly
performance, the greatest reduction achieved was at 0.8 L/s. Here, the baseline was at a
normalized potential of 73 percent and the proposed (right) at 0 percent. Overall, ventilation
flow rates of 0.2 L/s showed the greatest microbial growth potential for all assemblies. At this
same ventilation flow rate, both the left and right rib assemblies showed a reduction from the
baseline behavior by 10 and 25 percent, respectively. Similar results were demonstrated for
Seattle simulations and may be found in Appendix G.
For the cold year simulation of Houston, the reduction in microbial growth potential for the
proposed construction was not as significant and is shown in Figure 2.7. Trends of decreasing
potential with increasing flow rate were still present and the baseline assembly still exhibited the
most potential; however the proposed assembly (left and right) only showed a reduction in
normalized growth potential of 6 and 19 percent, respectively, at 0.2 L/s. The maximum
reduction from the baseline potential occurred at 0.4 L/s with a 63 percent reduction in
performance for the proposed right ribbed assembly.
33
Simulations for Houston using the cold year simulation are thought to produce less reduction in
growth potential then simulations using the warm year because of reductions in temperature at
the exterior boundary. Observations of the year long exterior temperature profiles (warm year
and cold year) used to simulate the Houston cases showed that a greater time period for the cold
year simulation during the winter season maintained temperatures below the 5 C to 40 C
threshold adequate for microbial growth. In addition, a reduction in temperatures also reduced
the kinetic energy within the ventilating air reducing the amount of moisture that could be
carried away from the water resistant barrier and OSB interface. The proposed assembly still
showed a reduction from the additional ventilation received at the core voids; however, the
reduction was not as great due to cooler circulating air.
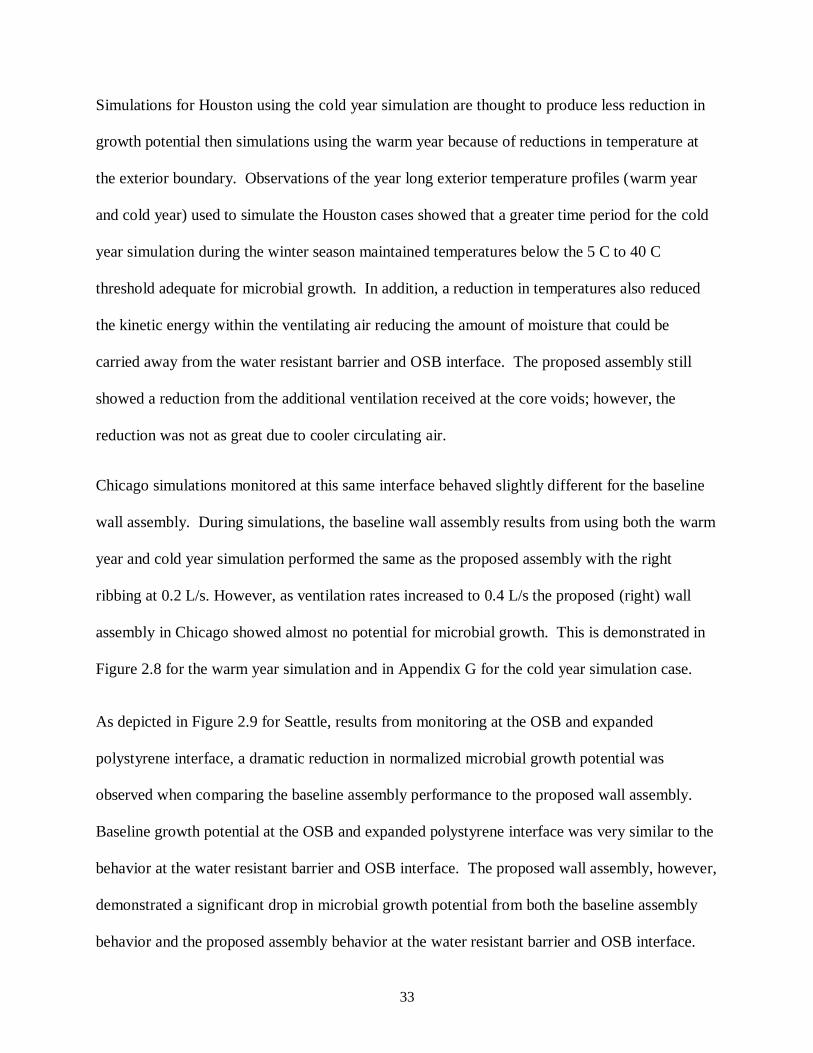
Chicago simulations monitored at this same interface behaved slightly different for the baseline
wall assembly. During simulations, the baseline wall assembly results from using both the warm
year and cold year simulation performed the same as the proposed assembly with the right
ribbing at 0.2 L/s. However, as ventilation rates increased to 0.4 L/s the proposed (right) wall
assembly in Chicago showed almost no potential for microbial growth. This is demonstrated in
Figure 2.8 for the warm year simulation and in Appendix G for the cold year simulation case.
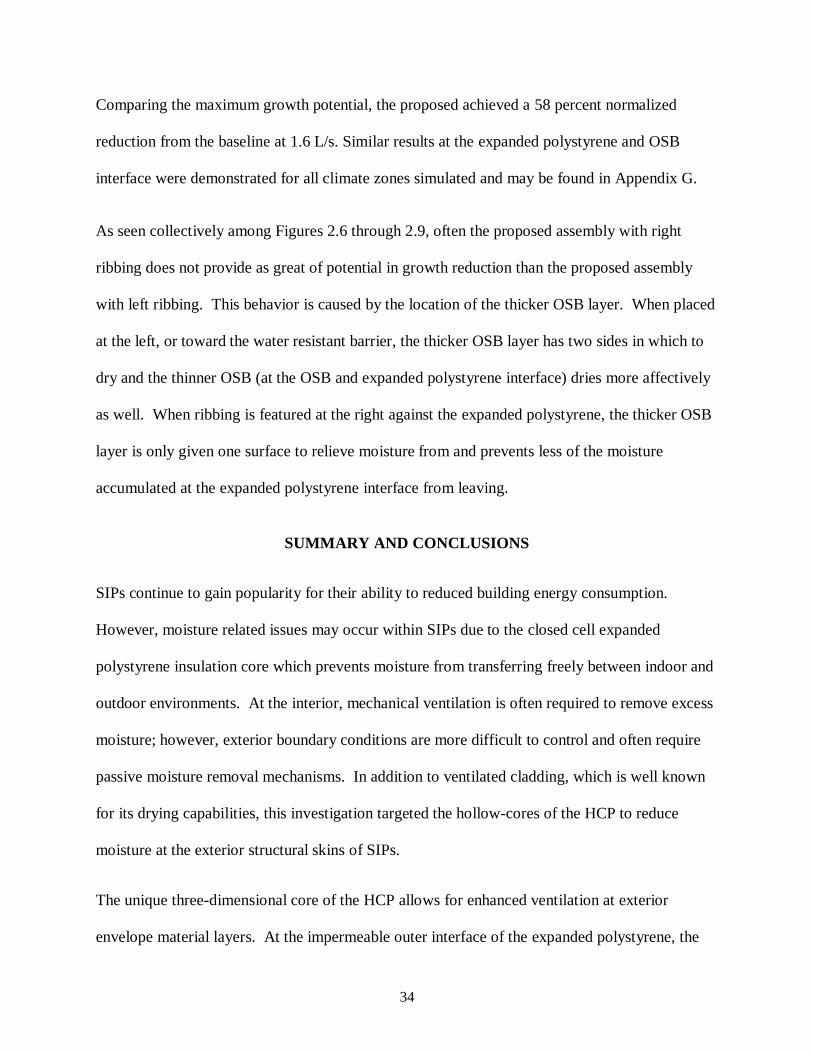
As depicted in Figure 2.9 for Seattle, results from monitoring at the OSB and expanded
polystyrene interface, a dramatic reduction in normalized microbial growth potential was
observed when comparing the baseline assembly performance to the proposed wall assembly.
Baseline growth potential at the OSB and expanded polystyrene interface was very similar to the
behavior at the water resistant barrier and OSB interface. The proposed wall assembly, however,
demonstrated a significant drop in microbial growth potential from both the baseline assembly
behavior and the proposed assembly behavior at the water resistant barrier and OSB interface.
34
Comparing the maximum growth potential, the proposed achieved a 58 percent normalized
reduction from the baseline at 1.6 L/s. Similar results at the expanded polystyrene and OSB
interface were demonstrated for all climate zones simulated and may be found in Appendix G.
As seen collectively among Figures 2.6 through 2.9, often the proposed assembly with right
ribbing does not provide as great of potential in growth reduction than the proposed assembly
with left ribbing. This behavior is caused by the location of the thicker OSB layer. When placed
at the left, or toward the water resistant barrier, the thicker OSB layer has two sides in which to
dry and the thinner OSB (at the OSB and expanded polystyrene interface) dries more affectively
as well. When ribbing is featured at the right against the expanded polystyrene, the thicker OSB
layer is only given one surface to relieve moisture from and prevents less of the moisture
accumulated at the expanded polystyrene interface from leaving.
SUMMARY AND CONCLUSIONS
SIPs continue to gain popularity for their ability to reduced building energy consumption.
However, moisture related issues may occur within SIPs due to the closed cell expanded
polystyrene insulation core which prevents moisture from transferring freely between indoor and
outdoor environments. At the interior, mechanical ventilation is often required to remove excess
moisture; however, exterior boundary conditions are more difficult to control and often require
passive moisture removal mechanisms. In addition to ventilated cladding, which is well known
for its drying capabilities, this investigation targeted the hollow-cores of the HCP to reduce
moisture at the exterior structural skins of SIPs.
The unique three-dimensional core of the HCP allows for enhanced ventilation at exterior
envelope material layers. At the impermeable outer interface of the expanded polystyrene, the
35
HCP was more effective at relieving moisture from this interface than compared to traditional
SIP construction. Observations showed that this interface for traditional SIP construction
behaved much like the interface of the water resistant barrier and OSB. The incorporation of the
HCP as a structural skin, allows this OSB skin layer to be opened up, reducing thickness of the
absorptive OSB, the most critical layer for microbial development.
Results from previous research have identified the numerous benefits of SIP construction.
However, this investigation has shown how to further optimize the potential of this popular panel
by minimizing microbial growth to reduce or eliminate health hazards and structural decay. The
incorporation of the HCP for SIP applications does not stop at moisture reduction, however. An
increase in strength and stiffness, reduction in energy transfer, and interior core availability for
utility placement further improves SIP technology when paired with this new hollow-core skin.
Results of this investigation were produced through computer simulations employed by the
WUFI Pro 5.1. This simulation tool is widely used by both practicing design professionals and
researchers alike (Salonvaara et al. 2007; A. Karagiozis and Künzel 2009; H. M. Künzel 1995;
H. M. Künzel 1998; A. Karagiozis et al. 2001). The purpose of this study was to gauge the
response of a proposed and developing envelope system and to perform parametric analyses to
guide further research decisions for this high performance wall assembly. Based on the positive
results of this study, it is recommended that the HCP SIP system be further studied in a natural
exposure facility to validate the results and provide important technical details required to
optimize the venting, air flow, and drying capabilities of the proposed panel.

36
REFERENCES
American Society of Heating, Refrigerating and Air-Conditioning Engineers, Inc. 2009.
ANSI/ASHRAE Standard 160-2009: Criteria for Moisture-Control Design Analysis in
Buildings. Atlanta, GA.
Building Envelope Research Consortium. 2001. The Envelope Drying Rates Analysis Study
(CMHC Canada Mortgage and Housing Corporation). Technical Series 01-139.
Research Highlights. Ottawa, Ontario: Canada Mortgage and Housing Corporation.
Carll, C.G., and T.L. Highley. 1999. “Decay of wood and wood-based products above ground in
buildings.” Journal of testing and evaluation 27: 150–158.
Cartwright, Kenneth Thomas St. George, and Walter Philip Kennedy Findlay. 1946. Decay of
timber and its prevention. H. M. Stationery Office.
Conyers, John. 2005. H.R. 1269: Melina Bill. March 14.
Fraunhofer Institute for Building Physics. 2011. WUFI Pro. Stuttgart, Germany: Fraunhofer
Gesellschaft.
Hansen, M., A. Nicolajsen, and B. Stang. 2002. On the influence of ventilation on moisture
content in timber framed walls. In Building Physics Conference–6th Nordic Symposium.
Humphrey, CJ, and PV Siggers. 1933. “Temperature relations of wood-destroying fungi.” J.
agric. Res 47 (12): 947–1008.
IEA Annex XIV: Condensation and Energy. 1990. Guidelines and Practices. International
Energy Agency, August.

37
International Code Council. 2009. International Energy Conservation Code. Cengage Learning.
Karagiozis, A. 2004. RP-1091 Report #11 - Parametric Evaluation of Ventilation Drying &
Sheathing Membrane Performance. ASHRAE 1091 - Development of Design Strategies
for Rainscreen and Sheathing Membrane Performance in Wood Frame Walls. ASHRAE.
Karagiozis, A., and H. M Künzel. 2009. “The Effect of Air Cavity Convection on the Wetting
and Drying Behavior of Wood-Frame Walls Using a Multi-Physics Approach.” Journal
of ASTM International 6 (10).
Karagiozis, A., H. Künzel, and A. Holm. 2001. WUFI-ORNL/IBP—A North American
Hygrothermal Model. In Mat. Konf.“Performance of Exterior Envelopes of Whole
Buildings VIII: Integration of Building Envelopes. Clearwater Beach, FL, December 2.
Kehrer, Manfred. 2011. WUFI Modeling. June 7.
Künzel, H. M. 1995. Simultaneous heat and moisture transport in building components. IRB-
Verl.
———. 1998. “Effect of interior and exterior insulation on the hygrothermal behaviour of
exposed walls.” Materials and Structures 31 (2): 99–103.
Mudarri, D., and W.J. Fisk. 2007. “Public health and economic impact of dampness and mold.”
Indoor Air 17: 226-36.
Owen, Mark S., and Heather E. Kennedy. 2009. 2009 ASHRAE handbook: fundamentals.
Atlanta, GA: American Society of Heating, Refrigeration and Air-Conditioning
Engineers, July 1.
38
Pankratz, Oskar, and Andreas Holm. 2004. Designing and Testing a Structural Insulated Panel
(SIP) with the Help of Hygrothermal Model. In Proceedings of Performance of the
Exterior Envelopes of Whole Buildings IX International Conference. Clearwater Beach,
FL.
Salonvaara, M. H., A. N. Karagiozis, M. Pazera, and W. Miller. 2007. Air Cavities Behind
Claddings - What Have We Learned? In Clearwater Beach, FL: ASHRAE Special
Publications, December 2.
Salonvaara, M.H., T. Ojanen, E. Kokko, and A.N. Karagiozis. 1998. “Drying capabilities of
wood frame walls with wood siding.” Thermal Performance of the Exterior Envelopes of
Buildings VII: 165–177.
Sanders, C. 1966. Environmental Conditions. Belgium, KU Leuven, Laboratorium Bouwfysica,
Departement Burgerlijke Bouwkunde: ECBCS Annex Publications - Annex 24 Heat, Air
and Moisture Transfer in Insulated Envelope Parts.
Schumacher, C., Xing Shi, and E. Burnett. 2004. Ventilation Drying in Screen-type Wall
Systems: a Physical Demonstration. Final. ASHRAE 1091 - Development of Design
Strategies for Rainscreen and Sheathing Membrane Performance in Wood Frame Walls.
Pennsylvania Housing Research/Resource Center: Pennsylvania State University, June.
Shi, X., C. Schumacher, and E. Burnett. 2004. Ventilation Drying under Simulated Climate
Conditions. Final Report. ASHRAE 1091 - Development of Design Strategies for
Rainscreen and Sheathing Membrane Performance in Wood Frame Walls. Pennsylvania
Housing Research/Resource Center: Pennsylvania State University, September.

39
Structural Insulated Panel Association. 2011. FAQs. SIPA: Structural Insulated Panel
Association. http://www.sips.org/technical-information-2/faqs.
TenWolde, A., C. Carll, and V. Malinauskas. 1995. Airflows and moisture conditions in walls of
manufactured homes. In Airflow performance of building envelopes, components and
systems, 137–55. Fredericksburg, Virginia: ASTM International, September.
Thevenard, D., and K. Haddad. 2006. “Ground reflectivity in the context of building energy
simulation.” Energy and buildings 38 (8): 972–980.
VanStraaten, R., and J. Straube. 2004. Field Study of Airflows behind Brick Veneers. Final
Report. ASHRAE 1091 - Development of Design Strategies for Rainscreen and
Sheathing Membrane Performance in Wood Frame Walls. June.
Voth, C., and V. Yadama. 2010. Sustainable Lightweight Wood-Strand Panels for Building
Construction. In International Convention of Society of Wood Science and Technology
and United Nations Economic Commission for Europe - Timber Committee. Geneva,
Switzerland, October 11.
Voth, C.R. 2009. Lightweight Sandwich Panels Using Small-diameter Timber Wood-strands and
Recycled Newsprint Cores. Washington State University.
Weight, S.W. 2007. A novel wood-strand composite laminate using small-diameter timber.
Washington State University.
Weight, Shilo W., and Vikram Yadama. 2008a. “Manufacture of laminated strand veneer (LSV)
composite. Part 1: Optimization and characterization of this strand veneers.”
Holzforschung 62 (6) (November): 718-724.

40
———. 2008b. “Manufacture of laminated strand veneer (LSV) composite. Part 2: Elastic and
strength properties of laminate of thin strand veneers.” Holzforschung 62 (6)
(November): 725-730.
White, Nathan. 2011. Strategies for Improving Thermal and Mechanical Properties of Wood-
Strand Composites. Washington State University, December.

41
TABLES
Table 2.1. Air exchanges per hour for various flow rates. Rates were calculated for the ventilated air cavities within each assembly. The air exchange rate was calculated
by dividing each volumetric flow rate by the volume of the air cavity for one 1.2m by
2.4m panel.
Flow Rate (L/s) Air Exchange Per Hour (1/h)
13 mm Cavity 3D OSB
1.6 158 113
0.8 79 57
0.4 39 28
0.2 20 14

42
FIGURES
Figure 2.1. Exploded view of the hollow core panel. This photo depicts an exploded view of the HCP used as structural skins for the proposed wall assembly.
The panel consists of a three-dimensional corrugated like hollow-core adhered to
thin OSB skins. The continuous longitudinal ribbing shown can provide housing for utilities, insulation, or ventilation. Photo courtesy of the Composite Material
and Engineering Center at Washington State University.

43
(a) (b)
Figure 2.2. Increased drying potential depiction. Traditional SIP construction at the
exterior layers is shown with a ventilated air cavity in (a). The proposed SIP construction at the exterior layers is shown with a ventilated air cavity at both the
drainage plane and HCP core in (b). The vertical arrows shown depict the movement
of air. The inclusion of the HCP core allows for greater surface area exposure to the drying affects of ventilated air and a greater drying potential at the OSB and
expanded polystyrene interface by reducing the thickness of the OSB material against
the expanded polystyrene.
Figure 2.3. Baseline envelope assembly developed for analysis. Monitoring positions
were added for hygrothermal modeling purposes and allowed for more data collection during simulations at the interfaces of the water resistant barrier and OSB interface
and the OSB and expanded polystyrene interface.

44
Figure 2.4. Proposed envelope assembly developed for analysis. The proposed wall assembly was represented by two separate variations to perform the one dimensional hygrothermal analysis. The
vertical arrow within the HCP layers depicts the inflection of the hollow-core modeled and is described
more in Figures 2.5a and 2.5b. Monitoring positions were added for modeling purposes to collect additional data at the water resistant barrier and hollow core panel interface and the HCP and
expanded polystyrene interface.
Figure 2.5a. Top view of the hollow core panel. The longitudinal rib inflection is shown in the
photograph above. The one-dimensional analysis for this investigation considered the three-
dimensional form of the corrugated core through two variations. One variation is shown as Section A and the other is shown at Section B. The sections are represented in Figure 2.5b.

45
Section A – proposed assembly Section B – proposed assembly
with right ribbing with left ribbing
Figure 2.5b Core variations used for one-dimensional analysis. A core rib when modeled toward the
right, toward the interior boundary, is shown in Section A. A core rib inflection when modeled to the left, toward the exterior boundary is shown in Section B. For all considerations of this investigation, the
exterior boundary is oriented at the left and the interior boundary is oriented at the right. Both Section A
and Section B reference Figure 2.5a.
Figure 2.6. Houston normalized microbial growth potential for warm year simulations. This figure
depicts the normalized microbial growth potential against the modeled air flow ventilation rate in L/s when observed at the water resistant barrier and OSB interface for each wall assembly in climate zone
2A Houston, Texas (warm year).

46
Figure 2.7. Houston normalized microbial growth potential for cold year simulations. This figure
depicts the normalized microbial growth potential against the modeled air flow ventilation rate in L/s for
observations at the water resistant barrier and OSB interface for each wall assembly in climate zone H2A Houston, Texas. Trends exhibit a reduction in microbial growth potential with an increase in air flow
rate; however, reductions of the proposed assemblies from the baseline were not as significant as warm
year simulations.

47
Figure 2.8. Chicago normalized microbial growth potential for warm year simulations. This figure
demonstrates the normalized microbial growth potential against the modeled air flow ventilation rate in
L/s for observations at the water resistant barrier and OSB interface for each wall assembly in climate zone 5A Chicago, Illinois. Trends exhibit almost identical behavior between assemblies at 0.2 L/s,
however, the proposed assemblies greatly reduce the microbial growth potential at 0.4 L/s and greater.

48
Figure 2.9. Seattle normalized microbial growth potential for cold year simulations. This figure
demonstrates the normalized microbial growth potential against the modeled air flow ventilation rate in
L/s for observations at the OSB and expanded polystyrene interface for each wall assembly in climate zone 4C Seattle, Washington. The baseline behavior was very similar to the water resistant barrier and
OSB interface results; however, the proposed assembly reduced growth potential even further,
eliminating all possibilities at 1.6 L/s.

49
Chapter 3:
EVALUATION OF INTEGRATING FORM STABLE PHASE CHANGE MATERIAL
WITH THREE-DIMENSIONAL HOLLOW-CORE WOOD-STRAND
COMPOSITE STRUCTURAL INSULATED PANELS
ABSTRACT
Rise in energy prices and growing concern for environmental impacts due to high energy
consumption practices has encouraged stricter energy codes and created a demand for energy
saving building materials and products. This study combines several energy saving materials
and technologies including form stable phase change materials (PCM), structural insulated
panels (SIP), and the three-dimensional hollow-core wood-strand composite sandwich panel to
demonstrate energy savings and peak demand reductions beyond those for traditional SIPs.
WUFI Pro 5.1 was employed to investigate the long-term thermal and moisture response of SIP
assemblies that were modified to include PCM within the skin panels. Analysis of these results
showed that an average 6 to 30 percent peak heat flux reduction was simulated for proposed
assemblies without and with PCM. However, these results demonstrated that latent heat
temperature range of the PCM and the climate in which placed must align for optimum energy
savings. Moisture performance was also considered and revealed that the PCM layer tended to
trap moisture between the PCM and the expanded polystyrene foam core, causing the potential
for biological growth and decay.
50
INTRODUCTION
There is a significant and still growing movement within the United States to reduce energy
consumption considering that the United States was the largest consumer of energy in the world
in 2010, with 40 percent of this demand consumed by buildings (D&R International, Ltd. 2011).
Commercial buildings consumed 18.4 percent of this total energy demand with office structures
alone as the top consumer. Heating, lighting, and cooling of spaces are estimated to represent
half of the energy exhausted (D&R International, Ltd. 2011).
As released by the United States Department of Energy (2008), trends in the commercial
building energy sector suggest a direct correlation between restrictive energy code adoption and
energy consumption reduction. From the conception of the American Society of Heating
Refrigeration and Air Conditioning Engineers (ASHRAE) and ASHRAE Standard 90-75, energy
use has been restricted to 25 percent less usage compared to ASHRAE Standard 90.1-2004,
resulting in an almost identical decline in commercial energy consumption over this time period
(U.S. Department of Energy 2008). As the strictness of these energy codes continues to
heighten, new energy savings technologies are in demand to meet such expectations.
One wall system growing in popularity due to its outstanding thermal insulation properties is the
structural insulated panel (SIP). SIPs are typically constructed with an expanded polystyrene
foam core sandwiched between skins made from OSB and sometimes gypsum board. SIPs
reduce thermal transmittance and reduce air infiltration when properly installed, yet these
lightweight panels have relatively low thermal mass. One way to improve the thermal storage
capacity of SIP panels is to incorporate phase change materials (PCM) into the assembly.
Carbonari et al (2006) and Medina et al (2008) demonstrated that the addition of PCM to

51
prefabricated wall assemblies and SIP panels can result in reducing heat flux across an envelope
of low thermal mass by incorporating PCM within the interior materials layers of the wall
assembly. This study builds upon Carbonari et al (2006) and Medina (2008) to demonstrate how
a form-stable PCM can be incorporated within three-dimensional hollow-core wood-strand
composite sandwich panel (HCP) technology to enhance energy storage capabilities of SIP
technology.
Three-Dimensional Hollow-Core Wood-Strand Composite Sandwich Panel
The HCP technology applied in this study was developed at Washington State University (S.W.
Weight 2007; Shilo W. Weight and Yadama 2008a; Shilo W. Weight and Yadama 2008b). An
exploded view of this panel is shown in Figure 3.1.
The implementation of the HCP as the structural skins for SIP application has the potential to
capitalize on sustainability, structural robustness, and energy savings. As a product of low-value
small-diameter-timber strands that utilize less resin and processing energy, the embodied energy
of the HCP is significantly lower than materials of comparable strength or size. Mechanical
testing of the HCP has demonstrated that the specific bending stiffness of the panel exceeds a
solid panel of the same dimensions and material (Voth 2009). Most recently, the implementation
of closed cell insulation and radiant barrier has demonstrated energy reduction when the core of
the panel is utilized to house additional insulating materials (White 2011).
Phase Change Materials
All materials can be quantitatively classified with a specific heat capacity which defines the
material’s ability to thermally fluctuate per unit of mass when subjected to an applied energy
such as heat. If the material undergoes a phase change within the temperature range of interest,

52
then considerably more thermal energy can be stored through the latent heat of fusion. When an
onset temperature is reached, a solid PCM will undergo a phase change allowing the material to
store considerable thermal energy at a nearly constant temperature until the melt is complete,
after which the storage capacity of the liquid material is defined by its specific heat capacity. As
the liquid form of the PCM cools to a temperature representative of its end temperature,
nucleation occurs while releasing stored energy and forming crystals. The benefit of this
absorption and release process can be observed when integration of a PCM occurs in a building
envelope. Acting like a battery for energy storage, phase change comprised materials reduce
heat flux through the building envelope providing a reduction in indoor air conditioning costs
and increased thermal comfort.
Incorporating PCM into the building envelope can provide thermal mass for light construction
through several techniques. Typical materials can be manipulated to exhibit latent heat
properties through impregnation or microencapsulation. Impregnation is commonly considered
for existing porous substrates such as gypsum, concrete block, wood, and open cell insulation,
whereas microencapsulation is introduced during the material production process.
Microencapsulation offers the benefit of containing the PCM in a microscopic polymer shell
which reduces the chances of material leakage. A third strategy for implementing PCM into the
building assembly is shape stabilization which pairs the PCM with an auxiliary polymeric
material that has a higher melt temperature. Estep (2010) studied stable PCM consisting of
75/25, 60/40, and 50/50 blends of paraffin (octadecane)/high density polyethylene (HDPE) that
were produced at three different extrusion processing speeds and tested for leakage, thermal
conductivity, latent heat storage capacity, storage modulus and dispersion. Paraffin with a melt

53
temperature of 28°C was chosen as the PCM with HDPE as the containment polymer with higher
melt temperature of 130°C.
The primary PCM materials used in building applications include inorganic and organic.
Inorganic PCM are low cost, highly conductive salt hydrates with a high volumetric latent heat
storage capacity. These PCM are less popular than organic PCM due to their high volumetric
changes, low nucleation rates, and ability to lose storage capacity over time. Organic PCM are
paraffins, fatty acids, and polyethylene glycol (PEG) which are recyclable, have a greater self-
nucleation rate, and are compatible with materials commonly found in the building envelope.
Disadvantages to organic PCM can include high cost, high flammability, and low volumetric
latent heat. This study will focus on a form stable organic PCM comprised of an n-octadecane,
commonly known as paraffin wax, and HDPE blend with an average melting point of 28 C,
appropriate for building envelope purposes (Estep 2010).
Objectives and Approach
The goal of this study was to employ hygrothermal modeling to investigate the thermal behavior
of a new high performance building panel proposed by the Composite Materials and Engineering
Center at Washington State University. The proposed wall assembly was inspired by traditional
SIP panels, but utilizes HCP structural skins to offer the same benefits as traditional SIP
construction with added potential for thermal storage through the integration of form stable PCM
at the skin core voids. A parametric analysis was formed to compare typical SIP construction
(with solid OSB skins) with the proposed assemblies to determine the thermal advantage over
typical construction and the appropriateness of implementing PCM in various climate zones.
The following approach was followed:

54
Establish exterior wall assemblies – one representative of typical SIPs (with OSB skins)
and all others representative of the proposed construction utilizing HCP and PCM.
Determine each climate zone and the representative exterior boundary conditions to
define the external environmental loads for each wall case simulation.
Employ hygrothermal modeling to investigate the long-term thermal and moisture
response of each assembly.
Evaluate the thermal and moisture performance through considerations of heat flux and
individual layer moisture and duration of wetness.
Using the typical panel assembly as a baseline, perform a parametric analysis to gauge
the thermal response of the proposed panel construction and identify moisture durability
issues.
LITERATURE REVIEW
Consideration of PCM integration into the building envelope first sparked in the late 1980’s,
however, a true interest in the subject has only appeared in the last ten years to parallel the
implementation of stricter energy codes and heightened encapsulation technology (Kuznik et al.
2011). The majority of PCM research spans the direct application of the material, such as in wall
applications, yet, roof and floor implementation research is also taking place. Regardless of
application, research is driven by the materials ability to passively store and release energy with
the potential to reduce peak heat flux through exterior wall assemblies by great percentages and
reduce indoor temperature flux – all while increasing indoor thermal comfort and reducing
heating and cooling demand.
Zhou et al (2007) demonstrated phase change application to gypsum wall board at the interior
boundary of the building envelope. PCM mixed gypsum was compared to the application of a

55
form stable PCM layered directly behind traditional gypsum to demonstrate that mixed gypsum
capped the envelope heat flux by 46 percent, while the PCM sheets produced a 56 percent flux
reduction. However, the application of PCM materials at the indoor boundary of the envelope
leads to flammability issues; therefore, some researchers have focused on the introduction of
PCM at the insulation layer. Kosny et al (2007) published findings on the microencapsulated
phase change of cellulose insulation that examined R value, heat flux reduction benefits, and
thermal stability in comparison to typical wood framed wall construction. Results showed that
the cellulose insulation could be mixed up to 30 percent by weight with PCM before reductions
in R value occurred, and using 22 percent by weight of PCM, a heat flux reduction of 40 percent
and 30 percent were demonstrated through a hot box test and field test, respectively. The mixed
insulation provided a more thermally stable construction than typical wood framed walls and
demonstrated that the PCM was fully charging and discharging over the 24 hours when
temperatures ranged from 120F at day and 55 F at night. The same insulation with 5 and 20
percent by weight PCM incorporation applied to attics in laboratory tests showed fully charging
and discharging capabilities for temperature fluctuations between 65 to 120 degrees with 6 to 8
hours required for full discharge.
Further research for PCM inclusion at the insulation layer was demonstrated by Medina et al.
(2008) by integrated PCM into SIP construction using pipes of paraffin placed at the SIP core
directly behind the interior skin of the panel. PCM was integrated at 10 percent and 20 percent
by weight of interior OSB skin and placed in test houses. Results showed that the 10 percent
PCM SIP had an average heat flux reduction and average peak heat flux reductions of 33 percent
and 37 percent, where the 20 percent PCM-SIP had a 38 percent and 62 percent reduction. The

56
inclusion of both PCM weights within the SIP was able to shift the average peak heat flux by one
hour.
Research performed by Carbonari et al. (2006) included PCM in prefabricated sandwich panel
assemblies constructed of sheet metal skins, a polyurethane insulation core, and eutectic salts
contained in rigid containers. Some of prototypes tested included a ventilated air cavity. Both
numerical developed and laboratory analyses were conducted on the various PCM systems and
results demonstrated that an air layer placed between the PCM container and the exterior metal
skin improved the performance of the phase change material. Results from both the numeric and
laboratory analyses were comparable and exemplified the ability of incorporating phase change
material into prefabricated wall assembly panels.
Additional heat loss benefits of varying envelope types performed by Castellón et al (2009)
showed that even a very small integration of PCM into the building envelope can reduce peak
energy demands. Concrete cubicles tested with 5 percent by weight microencapsulated PCM
delivered a 2 hour peak delay in June climate of Spain. It was noted that such a shift in a
commercial building application could create large energy savings for indoor air conditioning.
Brick with polyurethane and microencapsulated PCM reduced the daily indoor temperature
swing; however, the full potential of the phase change was never used and full liquefaction never
occurred. Additional test performed by Castellon et al (2009) showed that the brick and concrete
walls reduced energy consumption by 15 (1.94 percent total mass of wall impregnated
polyurethane insulation) to 17 (3.3 percent mass of total – alveolar brick) percent through the
impregnation of PCM into envelope materials.
57
Net zero energy potential for PCM was demonstrated by Oak Ridge National Laboratory when a
dynamic reflective insulation with impregnated open cell polyurethane insulation roofing system
reduced peak heat flux by 90 percent over traditional asphalt roof construction (Kośny et al.
2007). During peak solar irradiance, the traditional asphalt roof exhibited 94.6 W/m2 in heat flux
while the PCM dynamic insulation had a heat flux of 12.6 W/m2.
MATERIALS AND ENVELOPE ASSEMBLIES
Four wall assemblies were considered in this study. One assembly was representative of a
typical SIP exterior wall assembly and utilized OSB structural skins without PCM
implementation, and three utilized HCP structural skins with various implementation of PCM at
the HCP cores. The PCM was considered at both the exterior and interior skins to determine
which configuration would curb the heat flux from the bordering environmental temperature
fluctuations best. A summary of the wall sections simulated may be found in Table 3.1.
To account for the one-dimensional modeling limitation of the hygrothermal software selected to
perform the simulations of this study, the three-dimensional core of the HCP was modeled using
two variations, as in the investigations of Chapter 2. However, investigations for this chapter
showed no significant variation was exhibited by identifying the core geometry variability and
averaged results are presented later in this chapter.
Each assembly simulated consisted of 6 mm cement fiber board cladding furred with a 13 mm air
cavity ventilated at 0.8 ACH and backed by a spun bonded polyolefine water resistant barrier, a
140 mm closed cell expanded polystyrene insulation core, and a 16 mm gypsum wallboard
interior. The baseline envelope assembly was constructed of 1 layer of 13 mm OSB at either side
of the expanded polystyrene core as shown in Figure 3.2. Each proposed assembly was of the

58
same material layering of the baseline, however the interior and exterior skins used HCP and
variations of PCM as shown in Figure 3.3.
The PCM material used was a 60 to 40 percent blend of HDPE and n-octadecane (paraffin) with
a specific heat capacity of 1859.5 J/kgK, thermal conductivity of 0.336 W/mK, and density of
861.3 kg/m3. The temperature dependent enthalpy of the PCM had an onset temperature of 22.5
°C, end temperature of 34.8, and latent heat of 116.5 kJ/kg (Estep 2010).
HYGROTHERMAL MODELING
Hygrothermal modeling was employed for the performance evaluation of the integrated PCM for
a number of reasons. Thermal transmission through the envelope is greatly affected by the
porous properties of building materials and can be influenced by the presence of water in the
pore structure. There are several ways in which moisture can affect the heat flow through a
material such as radiant and conductive flows through water film at the pore wall or evaporation
and condensation of liquid to vapor and vice versa. Due to the complexity of the coupled
behavior of heat and moisture, calculations may be made that estimate the in situ apparent
thermal properties of each material layer, however, the use of hygrothermal modeling allows
calculations to consider the transient effects of boundary conditions that affect the presence of
moisture in materials. Use of a hygrothermal simulation of each assembly provided
consideration of material thermal conductivities exposed to realistic moisture conditions and the
increased energy transfer due to the presence of moisture that may occur.
In addition to the impact of moisture on thermal behavior, moisture behavior itself was also
investigated for the proposed assemblies. SIP assemblies contain an impermeable core of
expanded polystyrene with layers of increasing permeability toward both the exterior and interior

59
boundaries. The inclusion of the impermeable PCM at either the interior or exterior panel cores
had the potential to trap moisture as the OSB layers between the PCM and expanded polystyrene.
Based on initial moisture conditions or leakage, the moisture accumulation and drying potential
of this sandwiched OSB was investigated. Simulations were performed for two cases of the
proposed assembly in Chicago, Illinois for a warm year - one with PCM at the exterior skin core
(left ribbing) and the other with PCM at the interior skin core (right ribbing). Simulations were
performed for various air exchange rates within the interior boundary and included 0.15 ACH,
0.35 ACH, and 0.55 ACH, These values were selected to represent a range of both natural
infiltration and mechanical ventilation flow rates that the structure could experience.
The simulations of this study were employed using the hygrothermal model WUFI Pro 5.1
(Fraunhofer Institute for Building Physics 2011), developed by Fraunhofer Institute of Building
Physics. The software selected had the ability to compute the coupled behavior of heat, air, and
moisture while utilizing real climate and material data to simulate the response of the multi-
layered envelope acting as one unit. Characteristics of WUFI considered important for this
study included the ability to account for temperature dependent enthalpy of the PCM, wind
driven rain, capillary conduction, and user defined moisture sources, sinks, and generation rates,
all which could provide a greater control of the moisture in the envelope as well as a more
realistic response. As demonstrated by Pankratz and Holm (2004), the use of a hygrothermal
model is a tremendous aid in the development of new building envelope design construction and
materials. Although hygrothermal modeling cannot replace laboratory or natural climate
exposure testing, the ability to realistically gauge the response of an assembly can lead to
predictions in performance over numerous factors without exhausting unreasonable amounts of
time or funds.

60
Internal Calculations: Transport Equations
WUFI Pro 5.1 uses an iterative calculation process to satisfy two transport equations that
convergence to describe the coupled heat and moisture behavior of the programmed assembly at
an instance in time (Künzel 1995). The energy transport equation shown in Equation 1 is
described as the heat capacity of the wet building material as a function of the transient
temperature which is equivalent to the gradient of the heat flux and latent heat changes. The
moisture transport equation shown in Equation 2 is described as the moisture storage capacity as
a function of transient relative humidity which is equivalent to the gradient of the capillary
moisture, vapor diffusion, and external moisture fluxes.
Energy transport:
dH/dϑ · ∂ϑ/∂t = ·( λϑ) + hv · (δp(φ psat)) Equation 1
Where:
H = total enthalpy [J/m3]
ϑ = temperature [°C]
t = time [s]
λ = thermal conductivity of moist material [W/mK]
hv = evaporation heat of water [J/kg]
δp = water vapor permeability of material [kg/msPa]
φ = relative humidity [-]
psat = saturation vapor pressure [Pa]
Moisture transport:
dw/dφ · ∂φ/∂t = ·(Dφ φ + δp(φ psat )) Equation 2

61
Where:
w = water content [kg/m3]
φ = relative humidity [-]
t = time [s]
Dφ = liquid conduction coefficient [kg/ms]
φ = relative humidity [-]
δp = water vapor permeability of material [kg/msPa]
φ = relative humidity [-]
psat = saturation vapor pressure [Pa]
Climate Zones and Weather Data
Four climate zones were selected for analysis that covered the broad range of climate
encompassing the United States and included climates describes as hot-humid, hot-dry, mixed-
marine, and cool-humid climates. These zones and representative U.S. Cities are described in
the 2009 International Energy Conservation Code and included; Zone 2A: Houston, Texas; Zone
2B: Phoenix, Arizona; Zone 4C; Seattle, Washington; Zone 5A: Chicago, Illinois (International
Code Council 2009).
Each assembly was simulated within each climate zone over a period of three years beginning in
October. Year one was considered a neutralization phase during which the initial moisture
content of the construction materials reached equilibrium within the wall system. The last two
years of simulation were considered for analysis and provided almost identical results. For
simplicity, only results from year two are discussed in this chapter.

62
To minimize the simulation results evaluation periods to the times of year in which heat flux
across the envelope was assumed to be most prevalent, climate design conditions for all locations
were taken from appropriately located World Meteorological Organization (WMO) stations, and
annual heating and cooling design conditions were sought for the hottest and coldest months of
each year (Owen and Kennedy 2009). Each climatically extreme month plus one month prior
and one month following were selected to provide for two, three month analysis periods as
described in Table 3.2.
WUFI ASCII climate format files supplied with WUFI Pro 5.1 were used to simulate the external
boundary conditions. Two separate simulation periods, each three years in length, were
performed for each climate. One simulation period represented a warm year (10% probability)
for the specific climate and the other a cold year (10% probability). Orientation of the assembly
was determined by analyzing the climate file for each climate zone to determine the most critical
direction of wind driven rain.
MOISTURE DESIGN CRITERION
The criteria outlined in ANSI/ASHRAE Standard 160-2009: Criteria for Moisture-Control
Design Analysis in Buildings, was used as guidance to define the interior boundary conditions,
initial moisture conditions of materials, moisture generation for occupancy, exterior boundary
rain loads, and rain penetration (American Society of Heating, Refrigerating and Air-
Conditioning Engineers, Inc. 2009).
The driving potential for heat flux calculations within WUFI Pro 5.1 were based on ASHRAE
Standard160-2009 interior temperature determinations for a heating only option. The indoor
design temperature was specified as 2.8 °C greater than the 24 hour running average outdoor
63
temperature and a set point for heating at 21.1 °C. The indoor humidity input was based on the
ASHRAE Standard 160-2009 intermediate method of indoor design humidity. Moisture
generation of the interior was based on occupancy use of the building as a commercial office
structure where the average moisture generation served as the design rate and was determined
from occupant densities maintained over a 10 hour work day at a moisture generation rate of 3.5
kg/day/person. For simulation, the total moisture generation during the 10 hour work day was
taken as an average rate over 24 hours. Initial moisture content of each material was defined as
two times the equilibrium moisture content at 80 percent relative humidity. To account for
possible leakage due to workmanship or durability failures, incidental wetting was accounted for
by applying a 1 percent rain penetration at the water resistant barrier and OSB interface.
RESULTS AND DISCUSSION
Analysis of the results from all four climate zones showed that the proposed wall assembly
constructed of HCP with and without PCM filled exterior skin cores was effective at reducing
the peak heat flux measured at the interior most wall surface. Figure 3.4 shows an example of
how the proposed wall assembly achieved a reduction and shift in peak heat flux across the
interior wall surface during July 25th and 26th in Chicago, Illinois. In comparison to the
baseline assembly, the proposed assembly without PCM achieved a two hour peak shift and a 3.3
percent reduction in peak heat flux, while the assembly with PCM at exterior cores achieved a
six hour peak shift and 7.8 percent reduction.
Table 3.3 summarizes the average peak heat flux reduction during both the warm and cold month
analysis periods for both the warm year and cold year simulated for Phoenix and Seattle.
Additional results for Chicago and Houston may be found in Appendix H. These values show

64
that the proposed assembly even without PCM is capable of reducing peak heat flux. In Phoenix,
Arizona the greatest peak flux reduction was achieved in the summer during the cold year when
PCM was located at the exterior core voids of the proposed assembly. This maximum reduction
was at 28.7 percent for the HCP structural skin. Figure 3.5 and Figure 3.6 present an explanation
for the greatest peak reduction during a cold year. As shown in Figure 3.7, during the warmest
months in Phoenix, the exterior surface wall temperature at midday is significantly greater than
the melt temperature of the latent heat temperature range for the PCM. At such high
temperatures, the PCM is fully melted and can only partially begin to solidify during the night.
Without a complete charge and discharge cycle in a 24 hour period, the PCM fails to utilize its
latent heat capacity to the fullest and prevents having a great affect on the cap or shift of the peak
heat flux. As shown in Figure 3.8, for the cold year simulation, the maximum exterior surface
temperature drops enough to optimize the storage potential of the PCM and maximize the
reduction of heat flux over the baseline values. This is best seen in Figure 3.8 on July 6th.
There was no significant reduction in peak heat flux achieved during cold months as shown in
Table 3.3 for the Seattle, Washington values. Comparing the proposed assembly without PCM to
the proposed assembly with PCM revealed that little thermal benefit was achieved by
implementing the PCM into the exterior core voids. A similar situation to Phoenix, but on the
low side of the latent heat temperature range, Seattle winter temperatures were too low to
capitalize on the heat storage benefits of the PCM used in this study. As shown in Figure 3.9, the
exterior surface temperature is below the PCM onset temperature, therefore, both the proposed
with and without PCM respond in a very similar manner yet still providing a thermal advantage
over the typical SIP assembly. This increased advantage is contributed to the greater thermal
resistance achieved with the proposed wall assembly.

65
Thermal behavior of the proposed assembly with PCM at the interior core voids is shown in
Figure 3.8 for Houston, Texas; however, it demonstrates similar behavior for all climate zones
simulated. Locating the PCM toward the interior of the building provided greater amplitude in
heat flux when compared to the other assemblies. Whereas the baseline, proposed, and proposed
assembly with PCM at the exterior follow a diurnal cycle, the interior PCM assembly is most
affected by the interior temperature swing. As shown and as expected, interior temperature
fluctuations occurred much more gradual creating charging and discharging cycles within the
PCM over the course of four to five days rather than one day as seen within other assemblies. In
Figure 3.8, the dump of energy occurs early in the morning of June 28th and continues until
midmorning on June 30th. During this time, interior temperatures are already uncomfortably
high and the energy from the PCM could encourage even more thermal discomfort for
occupants. Due to the use of ASHRAE Standard 160-2009 indoor temperature suggestions, the
indoor temperature represented in this graph, as previously discussed, is a function of the exterior
climate temperature. This limits further investigation into the potential impact of the heat flux on
interior boundary conditions and inhabitant thermal comfort.
Moisture related concerns were demonstrated with the simulation of two wall assemblies in
Chicago and revealed that PCM at the interior panel cores resulted in acceptable drying potential.
However, for the assembly with PCM at the exterior boundary, high initial moisture content
levels (those set at suggested value of twice the equilibrium moisture content at 80 percent
relative humidity) and the sandwiching of the OSB by two impermeable layers significantly
inhibited the drying potential. As shown in Figure 3.9, moisture content levels remained above
20 percent moisture content (the accepted threshold value for below which decay potential is at a
minimum, (Carll and Highley 1999)) for the three year simulation period for 0.15 ACH and most

66
of the three year simulation period for 0.35 ACH. At 0.55 ACH the material drops below critical
moisture content of 20 percent in late July of the second simulation year. Decay fungi have the
ability to germinate in as little as 24 hours with the potential to cause damaging affects in a
matter of weeks (Carll and Highley 1999), therefore all air exchange rates were considered not to
provide adequate drying potential. From these results, it is expected that high initial moisture
contents in the OSB may cause microbial growth and decay – damaging the structural integrity
of the material and the wall assembly within a few years.
SUMMARY AND CONCLUSIONS
PCM, whether microencapsulated or in a form stable condition, can be effective for thermal
storage and can be incorporated into lightweight construction materials to provide thermal mass.
However, the placement of the PCM within the wall and its latent heat behavior temperature
range are critical for a thermally optimized and structurally sound wall assembly.
Placement of PCM at the outer structural skin cores of the HCP SIP provided the most successful
location for reducing peak heat flux (as great as 30 percent). The optimization of the latent heat
of fusion temperature range for the climate chosen was critical for capitalizing on the full storage
potential of the PCM. This was demonstrated in both zones of warmer exterior temperatures
(Phoenix, AZ) and cooler exterior temperatures (Chicago, IL) where the outdoor temperature
remained too high or too low to activate the PCM. Seasonal changes also reduced the efficiency
of the PCM at the exterior boundary – a factor that must be considered when determining latent
heat response temperature range and the economics of incorporating this technology.
The latent heat of fusion temperature range of the simulated PCM failed to provide thermal
storage benefits when placed at the interior HCP skin. Interior temperature swings were too

67
subtle to fully charge or discharge the PCM. This created the benefit of thermal collection over
several days but provided large dumps of energy indoors at times when thermal comfort may be
compromised. It is suggested that a PCM with a difference thermal range, with consideration of
indoor conditioning availability, be considered for indoor applications
Placement of the PCM within each wall assembly was critical for avoiding moisture damage and
for PCM thermal response. Locating the PCM at the exterior HCP core voids showed potential
to increase moisture entrapment within layers surrounded by impermeable materials, but
provided in most cases a full cycle of charging and discharging – optimizing thermal collection.
Locating the PCM at the interior HCP core voids provided an opposite response, one which
posed minimal moisture issues but failed to cycle the PCM fully due to small internal
temperature changes.
The inclusion of the HCP with or without PCM did provide an overall advantage to the thermal
capabilities of those already recognized for SIP construction. Further investigation should focus
on the internal temperature fluctuations directly related to the thermal absorption and desorption
of PCM and the affect this has on inhabitant comfort. The hypothesis that PCM at the exterior
boundary could promote moisture accumulation within sandwiched OSB layers should also be
experimentally validated. This consensus may be determined by considering the full three-
dimensional form of the sandwich skin core and investigating how the three-dimensional core
may potentially act as a moisture bridge between layers on either side of the PCM. In all, further
steps should be taken to optimize the peak heat flux reductions by including exterior core voids
of PCM with thermal ranges most appropriate for a specified climate and minimizing the
moisture issues that this PCM placement creates to maximize energy savings even greater
beyond those of standard SIP construction.

68
REFERENCES
American Society of Heating, Refrigerating and Air-Conditioning Engineers, Inc. 2009.
ANSI/ASHRAE Standard 160-2009: Criteria for Moisture-Control Design Analysis in
Buildings. Atlanta, GA.
Carbonari, A., M. De Grassi, C. Di Perna, and P. Principi. 2006. “Numerical and experimental
analyses of PCM containing sandwich panels for prefabricated walls.” Energy and
Buildings 38 (5) (May): 472-483. doi:10.1016/j.enbuild.2005.08.007.
Carll, C.G., and T.L. Highley. 1999. “Decay of wood and wood-based products above ground in
buildings.” Journal of testing and evaluation 27: 150–158.
Castellón, C., A. Castell, M. Medrano, I. Martorell, and LF Cabeza. 2009. “Experimental study
of PCM inclusion in different building envelopes.” Journal of Solar Energy Engineering
131: 041006.
Estep, G.D. 2010. The Influence of Extrusion Processing for Formulation on Form-Stable Phase
Change Material. Washington State University.
Fraunhofer Institute for Building Physics. 2011. WUFI Pro. Stuttgart, Germany: Fraunhofer
Gesellschaft.
International Code Council. 2009. International Energy Conservation Code. Cengage Learning.
D&R International, Ltd. 2011. 2010 Buildings Energy Data Book. U.S. Department of Energy,
March.

69
Kośny, J., D. Yarbrough, W. Miller, T. Petrie, P. Childs, and A. Syad. 2007. “Thermal
performance of PCM-enhanced building envelope systems.” Proceedings of Thermal
Performance of the Exterior Envelopes of Buildings X.
Künzel, H.M. 1995. Simultaneous heat and moisture transport in building components.
Fraunhofer IRB Verlag Suttgart.
Kuznik, Frédéric, Damien David, Kevyn Johannes, and Jean-Jacques Roux. 2011. “A review on
phase change materials integrated in building walls.” Renewable and Sustainable Energy
Reviews 15 (1) (January): 379-391. doi:10.1016/j.rser.2010.08.019.
Medina, M.A., J.B. King, and M. Zhang. 2008. “On the heat transfer rate reduction of structural
insulated panels (SIPs) outfitted with phase change materials (PCMs).” Energy 33 (4):
667–678.
Owen, Mark S., and Heather E. Kennedy. 2009. 2009 ASHRAE handbook: fundamentals.
Atlanta, GA: American Society of Heating, Refrigeration and Air-Conditioning
Engineers, July 1.
Pankratz, Oskar, and Andreas Holm. 2004. Designing and Testing a Structural Insulated Panel
(SIP) with the Help of Hygrothermal Model. In Proceedings of Performance of the
Exterior Envelopes of Whole Buildings IX International Conference. Clearwater Beach,
FL.
Thevenard, D., and K. Haddad. 2006. “Ground reflectivity in the context of building energy
simulation.” Energy and buildings 38 (8): 972–980.
70
U.S. Department of Energy. 2008. Energy Efficiency Trends in Residential and Commercial
Buildings. U.S. Department of Energy, October.
Voth, C.R. 2009. Lightweight Sandwich Panels Using Small-diameter Timber Wood-strands and
Recycled Newsprint Cores. Washington State University.
Weight, S.W. 2007. A novel wood-strand composite laminate using small-diameter timber.
Washington State University.
Weight, Shilo W., and Vikram Yadama. 2008a. “Manufacture of laminated strand veneer (LSV)
composite. Part 2: Elastic and strength properties of laminate of thin strand veneers.”
Holzforschung 62 (6) (November): 725-730.
———. 2008b. “Manufacture of laminated strand veneer (LSV) composite. Part 1: Optimization
and characterization of this strand veneers.” Holzforschung 62 (6) (November): 718-724.
White, Nathan. 2011. Strategies for Improving Thermal and Mechanical Properties of Wood-
Strand Composites. Washington State University, December.
Zhou, Guobing, Yinping Zhang, Xin Wang, Kunping Lin, and Wei Xiao. 2007. “An assessment
of mixed type PCM-gypsum and shape-stabilized PCM plates in a building for passive
solar heating.” Solar Energy 81 (11) (November): 1351-1360.
doi:10.1016/j.solener.2007.01.014.

71
TABLES
Table 3.1. Assembly variations used for simulation. This table describes the assemblies considered and the variations of each assembly for simulation purposes. The first assembly listed is
representative of traditional SIP exterior wall assembly construction while the other assemblies are a
similar proposed construction that incorporates HCP structural skins and in some cases PCM at the skin core voids.
assembly
assembly
variation
designation
structural
skins PCM
R-Value,
m2K/W
(hft2°F/Btu)
traditional Baseline OSB na 4.44 (25.2)
proposed Proposed HCP na 4.75 (27.0)
proposed with
PCM at exterior
Proposed
PCM Ext HCP
exterior skin
core 4.65 (26.4)
proposed with
PCM at interior
Proposed
PCM Int HCP
interior skin
core 4.65 (26.4)
Table 3.2. Climate location information. For each climate, the representative city used for simulation, the WMO identification number and name, the coldest and warmest month, and three consecutive months
for evaluated were collected to minimize the analysis period of the simulation results to the most critical
seasons for heating and cooling.
Climate
Zone City
WMO
# WMO Location
Coldest
Month*
Warmest
Month*
Coldest
Months
Evaluated
Warmest
Months
Evaluated
2A Houston,
TX 722436
Houston/
Ellington, TX 1 7
December
January
February
June
July
August
2B Phoenix,
AZ 722780
Phoenix Sky
Harbor
International
Airport, AZ
12 7
November
December
January
June
July
August
4C Seattle,
WA 727935
Seattle Boeing
Field, WA 12 8
November
December
January
July
August
September
5A Chicago,
IL 725340
Chicago Midway
Airport, IL 1 7
December
January
February
June
July
August
*where 1 = January, 12 = December

72
Table 3.3. Peak heat flux reduction from baseline behavior. For each analysis performed, a daily
comparison of peak heat flux to that of the typical SIP construction simulation was calculated. The average reduction from the baseline performance for each analysis period is shown.
Seattle Phoenix
Coldest Months
Evaluated
Warmest Months
Evaluated
Coldest Months
Evaluated
Warmest Months
Evaluated
Cold
Year
Warm
Year
Cold
Year
Warm
Year
Cold
Year
Warm
Year
Cold
Year
Warm
Year
proposed 7.08% 7.44% 8.67% 9.88% 9.02% 9.27% 7.76% 8.01%
proposed
exterior PCM 7.27% 8.59% 18.42% 19.14% 16.01% 22.43% 28.76% 23.94%

73
FIGURES
Figure 3.1. Exploded view of the hollow core panel. The three-dimensional hollow-core wood-strand composite sandwich panel was used as structural skins
for this study. This sandwich panel took the place of the oriented strand board
structurally skins typical used for structural insulated panels. Photo courtesy of the Composite Materials and Engineering Center – Washington State University.
Figure 3.2. Baseline envelope assembly one-dimensional cross-section. One baseline
envelope assembly was developed for analysis. Material layers shown are of a typical
SIP wall section. For simulation purposes the exterior climate boundary is located at the left and the interior climate boundary is shown at the right.

74
Figure 3.3. Proposed envelope assembly one-dimensional cross-section. Three variations of the proposed envelope assembly were analyzed and include the proposed assembly without PCM, PCM at the
exterior skin core, and PCM at the interior skin core.
Figure 3.4. Example peak heat flux shift and reduction for Chicago, warm year simulation. A delay of
two hours and six hours is shown for the proposed assembly and proposed with PCM at exterior core voids, respectively, when in comparison to the baseline performance. The baseline assembly, proposed
assembly, and proposed with PCM assembly at exterior core voids peak heat flux were 4.49 W/m2, 4.34
W/m2, and 4.14 W/m
2, respectively.

75
Figure 3.5. Heat flux data for Phoenix, warm year simulations. The exterior surface temperature, as
shown, exceeds the end temperature of the PCM and prevents the PCM from fully discharging.
Figure 3.6. Heat flux data for Phoenix, cold year simulations. The exterior surface temperature, as
shown particularly on July 6th, demonstrates a drop below the onset temperature during the evening. A
rise in temperature above the end temperature of the PCM allows the PCM to fully melt, optimizing the energy absorption for that day.

76
Figure 3.7. Seattle heat flux for baseline and proposed assemblies. During a cool year, such as those
shown in December in Seattle, the latent heat temperature range of the PCM was not activated. This
allowed for the proposed with and without PCM to thermally behave in a similar manner.
Figure 3.8. Houston heat flux during summer (warm). Baseline behavior and proposed wall assembly
behavior were approximately same during the time period shown, therefore, for the purpose of clarity the
proposed wall assembly was removed from this figure. As shown, the interior PCM heat flux charges and
discharges over the course of several days while all other assemblies follow a diurnal pattern. This difference is attributed to the direct impact of the interior temperatures on the interior core PCM.
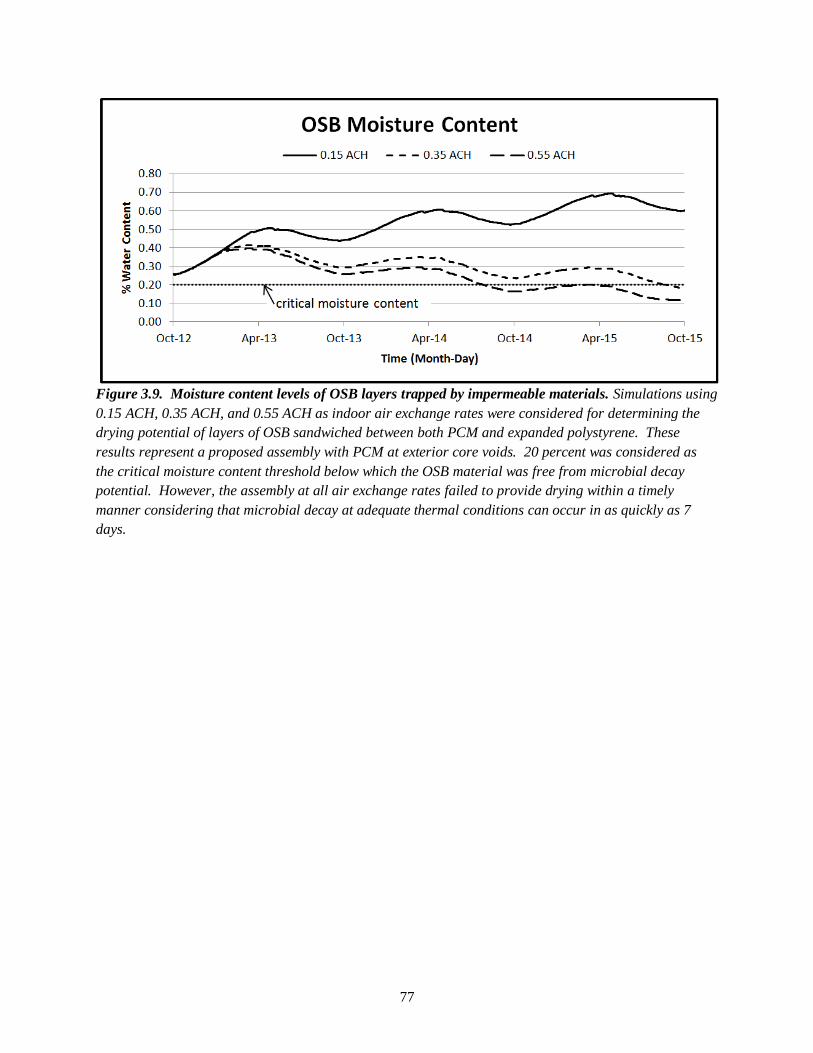
77
Figure 3.9. Moisture content levels of OSB layers trapped by impermeable materials. Simulations using
0.15 ACH, 0.35 ACH, and 0.55 ACH as indoor air exchange rates were considered for determining the
drying potential of layers of OSB sandwiched between both PCM and expanded polystyrene. These
results represent a proposed assembly with PCM at exterior core voids. 20 percent was considered as
the critical moisture content threshold below which the OSB material was free from microbial decay
potential. However, the assembly at all air exchange rates failed to provide drying within a timely
manner considering that microbial decay at adequate thermal conditions can occur in as quickly as 7
days.

78
Chapter 4:
SUMMARY AND CONCLUSIONS
Investigations from preceding chapters have shown that the structural insulated panel (SIP), popular for
its ease of constructability, low air infiltration rates, and high thermal resistance, can be improved upon
with regard to moisture and thermal storage attributes. By replacing the traditional OSB structural skins
of the SIP, with three-dimensional hollow-core wood-strand composite sandwich panels (HCP), a new
high performance building panel is created. The addition of a new skin has been shown to increase
drying capabilities of the exterior structural skin to reduce microbial growth and decay potential, and has
demonstrated that with the integration of form stable phase change material (PCM) peak heat flux at
indoor surfaces may be reduced and delayed.
SIP manufacturers recommend adequate indoor ventilation to avoid moisture related problems given the
low infiltration rates achieved through properly constructed SIP structures. Although beneficial for
reducing energy loss or gain between indoor and outdoor environmental conditions, this low infiltration
rate can harm indoor environments by preventing adequate air exchange required for healthy indoor air
quality. As discovered during simulations within previous chapters, the passive air infiltration rates of
SIP construction must be boosted with proper mechanical systems to avoid microbial growth and
development.
At the exterior boundary of SIP structures, it is also recommended that a drainage plane cavity and water
resistant barrier be applied to external panel faces for climates receiving more than 20 inches of annual
rainfall. This again was reaffirmed during simulations as a beneficial recommendation for providing
additional removal mechanisms. However, when the HCP was investigated, it became apparent that
moisture properties of the recommended SIP construction techniques could be improved upon to achieve
an even greater reduction in moisture accumulation and increase in drying potential. By providing
additional air flow opportunities (behind the water resistant barrier), ventilation between the moisture

79
inhibiting layer of the water resistant barrier and the impermeable expanded polystyrene core was
effective at removing moisture. The most critical layer for microbial growth and decay, yet the most
structurally significant element within the wall assembly, is the structural skin of the SIP. Incorporating
the HCP at this location allowed for ventilation cores to reduce the continuity of the material thickness to
provide a greater amount of surface area from which infiltrated air could absorb water molecules and
carry them to the exterior boundary. Results from Chapter 2 further demonstrated that even very small
rates of ventilation, such as those that would be achieved naturally in almost any setting, were affective at
reducing moisture accumulation and in return microbial growth potential over that of the standard SIP.
The second investigation, as discussed in Chapter 3, was an integration of material technology; form
stable PCM, HCP, and SIP technology. The culmination of these three technologies and materials
provided for targeted placement of PCM to further reduce the energy transfer between interior and
exterior environments. Results for all climate zones investigated showed that during optimum exterior
boundary temperature conditions for the PCM selected, the peak heat flux could be reduced, as much as 6
to 29 percent during peak cooling months. At cases in which the PCM at exterior surfaces could fully
charge and discharge within a 24 hour period, maximum reductions and delays of peak flux were
achieved.
PCM simulated at the interior boundary was not considered as beneficial at reducing indoor conditioning
demands as the exterior PCM. Interior placement of the PCM used required, at times, a five day
charge/discharge period for the PCM, only to discharge at thermally inopportune times to prevent cooling
of spaces during evening hours. These inopportune results for interior placement of the PCM were
attributed to a latent heat behavior temperature range inadequate for interior conditions of most climates.
It is suggested that the interior PCM be reevaluated in conjunction with mechanical cooling capabilities to
optimize both the thermal capacity of the PCM and the reduction in energy use, without compromising
indoor thermal comfort.

80
Although Chapter 3 demonstrated thermal advantages to the incorporation of the PCM, concern did arise
for PCM at the exterior cores in terms of moisture. Simulations, although only performed in Chicago, did
reveal that built in moisture may remain, or excessive moisture accumulation may occur at OSB layers
sandwiched between PCM layers and the expanded polystyrene core. Even at increased infiltration rates,
moisture levels within the OSB remained in excess of those considered adequate for eliminating all
possibilities of decaying fungi.
The minimization of moisture still remains as the easiest environmental requirement for microbial
development to control. However, it still remains a difficult task which is why the most recent
developments within moisture mitigation were employed for the investigations of this research. The
integration of ASHRAE Standard 160-2009 and the hygrothermal modeling software WUFI Pro 5.1 were
a necessity in addressing the complexity of the moisture and thermal behavior for the parametric
evaluation of the two assemblies of interest . Guidelines of ASHRAE Standard 160-2009 provided a solid
basis for realistic moisture exposure and performance expectations, while WUFI Pro was an effective
tool for applying these guidelines and analyzing simulation results against the expectations. The use of
WUFI also provided freedom to explore alternative constructions, materials, locations, and specialty
mechanisms (such as the PCM or user defined air change sources) without compromising time, money, or
other resources.
Use of the one-dimensional analysis available with WUFI Pro was affective at establishing an
understanding of material and construction response as well as providing target PCM melt temperatures
for future investigation. However, a three-dimensional response investigation is suggested to further
exemplify the benefits of the HCP, especially in the case of moisture intrusion and ventilation. Whether
through a three-dimensional simulation or placement within a natural exposure test facility, these
investigations will most likely show an even greater potential for drying due to an increased surface area
consideration (as the full surface area was not accounted for in one-dimensional analysis) for moisture
removal. Additional considerations for moisture bridging within the three-dimensional core should also

81
be accounted for, which could introduce moisture to or relieve moisture from OSB material layers
sandwich between PCM and the expanded polystyrene core.
Further investigations may also be employed to explore the possibilities of the HCP structural skin SIP
and may include:
Investigation of dual integration of ventilation and PCM – alternating cores to mitigate issues due
to PCM moisture entrapment.
Radiant heating or cooling at interior skin core voids to provide an alternative conditioning
mechanism for interior environments. This application could be modeled with a hygrothermal
simulation tool in which user specified heat sources may be applied.
The optimal size, placement, and frequency of vents to achieve passive ventilation could build
upon the investigations of Chapter 2 to identify actual flow rates achievable within HCP cores.
Mechanical ventilation at exterior cores may also be explored for continuous venting at the
exterior skin. The implementation of a perforated pipe (with a forced air source) may be placed
within a routed void at the base of each panel to supply necessary ventilation either at a
continuous rate or one which is triggered by humidity sensors within the wall or at the exterior
boundary.
Moisture performance of stacked HCP wall assemblies may also be of interest. The achievable
strength of many panels may provide advantages to high load application, however, the inclusion
of PCM, expanded polystyrene, or other impermeable substances within core voids hold the
potential to trap moisture and encourage material degradation.
A modified SIP construction wall envelope with HCP structural skins has demonstrated drying and
thermal capabilities that outperform currently available high performance panels. However, whether a
wall, roof, floor, or other application, the HCP is a multipurpose technology capable of expanding current

82
design and construction limitations while meeting the health and energy performance demands of
inhabitants.

83
APPENDIX A: UNIT CONVERSION TABLE
Table A.1: Conversion factors and units table. This table describes the relationship between
the metric and imperial unit systems for quantities related to hygrothermal investigation. The
units of all quantities are also identified (adapted from (Fraunhofer Institute for Building Physics
2011).
Quantity SI units SI to IP IP units IP to SI
bulk density kg/m³ 1/16.01846 lb/ft³ 16.01846
diffusion resistance factor - (*) perm in (*)
heat flux W/m² 1/3.154591 Btu/h ft² 3.154591
heat transfer coefficient W/m²K 1/5.678263 Btu/h ft²°F 5.678263
length m 1/0.0254 in 0.0254
length cm 1/2.54 in 2.54
length mm 1/25.4 in 25.4
length m 1/0.3048 ft 0.3048
liquid transport coefficient m²/s 10.764 ft²/s 1/10.764
porosity m³/m³ 1.0 ft³/ft³ 1.0
pressure kPa 1/6.894757 lbf/in² 6.894757
rain load L/m²=mm 1/25.4 in 25.4
relative humidity % 1.0 % 1.0
sd-value m (**) perm (**)
spec. heat capacity J/kgK 1/4.1868E3 Btu/lb°F 4.1868E3
temperature °C (***) °F (***)
temperature difference °C 1.8 °F 1/1.8
thermal condunctivity supplement %/m-% 1.0 %/m-% 1.0
thermal conductivity W/mK 0.57779 Btu/h ft°F 1/0.57779
thermal resistance m²K/W 5.679 h ft²°F/Btu 1/5.679
water balance kg/m² 1/4.882428 lb/ft² 4.882428
water content kg/m³ 1/16.01846 lb/ft³ 16.01846
(*) µ/[-] = 128.8/(π/(perm in))
π: permeability
(**) sd/m = 3.28/(Δ/perm)
Δ: permeance
(***) °F = (°C * 9/5) + 32
°C = (°F – 32)*5/9

84
APPENDIX B: WUFI Pro 5.1
Table B.1: WUFI Pro 5.1 Capabilities and Limitations. This table provides a brief summary of the
capabilities of the WUFI Pro 5.1 software used for the hygrothermal simulations of this investigation.
Limitations of the software are also defined and were taken into consideration during software selection, modeling input, and analysis processes.
Capabilities -
Limitations –
WUFI does not consider the
following
General
convective heat transport
convective vapor transport
seepage flow due to gravity
pressure differential driven
hydraulic flow
electrokinetic and osmotic
effects
transient behavior analysis
multilayer envelope assembly
boundary conditions as meteorological data
exterior temperature
relative humidity
measured rain
normal rain
wind direction
wind speed, vector and scalar
cloud index
irradiance; long wave atmospheric (horizontal),
long wave terrestrial (horizontal), long wave
measured
irradiance; solar measured, solar diffuse
horizontal
irradiance; solar global horizontal
irradiance; solar direct horizontal
barometric pressure at state height
barometric pressure reduced to sea level
Transport Potentials
heat transport
thermal conduction
enthalpy flow (both moisture and phase change
material driven)
short wave solar radiation
long wave nighttime radiation cooling
moisture transport -vapor transport mechanisms
vapor diffusion
moisture transport -liquid transport mechanisms
capillary conduction
surface diffusion
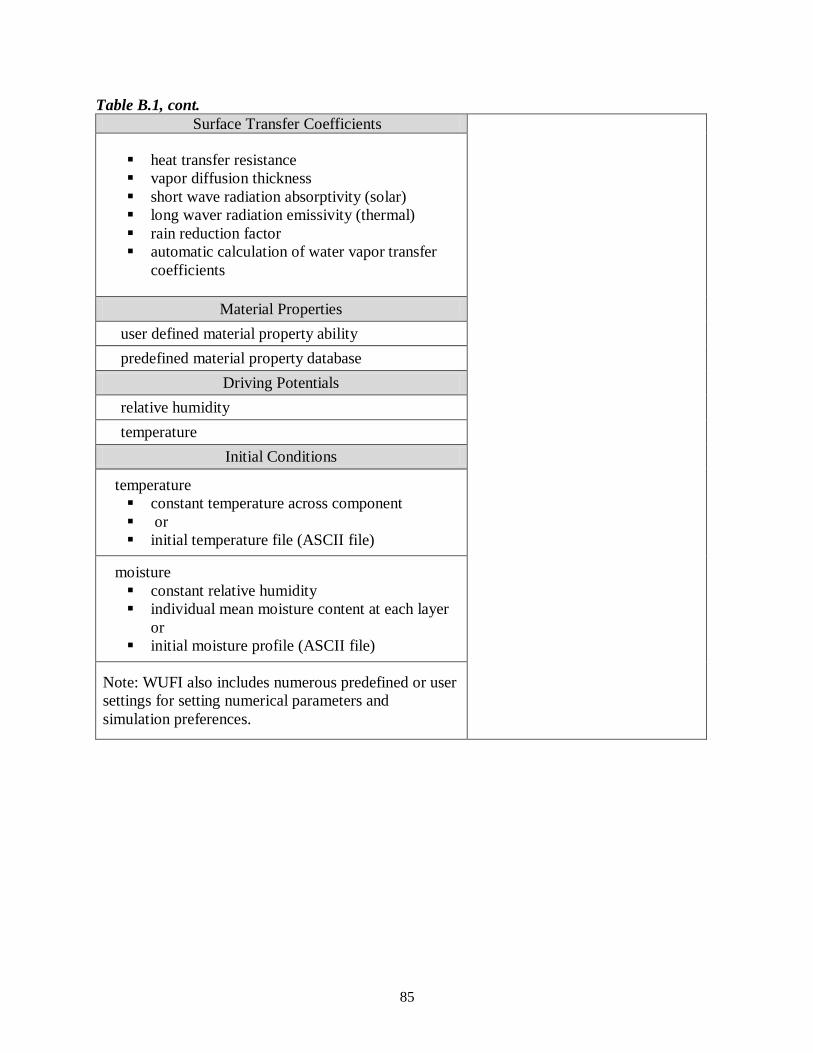
85
Table B.1, cont.
Surface Transfer Coefficients
heat transfer resistance
vapor diffusion thickness
short wave radiation absorptivity (solar)
long waver radiation emissivity (thermal)
rain reduction factor
automatic calculation of water vapor transfer
coefficients
Material Properties
user defined material property ability
predefined material property database
Driving Potentials
relative humidity
temperature
Initial Conditions
temperature
constant temperature across component
or
initial temperature file (ASCII file)
moisture
constant relative humidity
individual mean moisture content at each layer
or
initial moisture profile (ASCII file)
Note: WUFI also includes numerous predefined or user
settings for setting numerical parameters and
simulation preferences.
86
APPENDIX C: CLIMATE SIMULATION DATA
For each wall assembly simulation, the exterior boundary conditions were defined using
meteorological data in WUFI American Standard Code for Information Interchange (ASCII) file
format. Two separate simulation periods, each three years in length, were performed for each
climate. One simulation period represented a warm year (10% probability) for the specific
climate and the other a cold year (10% probability). Both exterior boundary representations
were determined from a 30 year period and provided by ASHRAE as an inclusion within the
WUFI Pro 5.1 software (Fraunhofer Institute for Building Physics 2011). Orientation of the
assembly was determined by analyzing the climate file for each climate zone to determine the
most critical direction of wind driven rain.
For Chapter 2 of this study, the climate zones were selected to represent warm and cool climates
with relatively high moisture/humidity conditions. The climates zones simulated included Zone
2A: Houston, Texas; Zone 5A: Chicago, Illinois; Zone 4C: Seattle, Washington as defined in the
2009 International Energy Conservation Code (International Code Council 2009).
For Chapter 3 of this study, the same climate zones were selected as in Chapter 2, however, the
addition of Zone 2B with a reference location of Phoenix, Arizona was added to investigate the
PCM integrated wall assembly response in a hot and dry climate (International Code Council
2009).
The following information describes the transient temperature and relative humidity defining the
warm year and cold year simulation files.

87
Figure C.1. Chicago, Illinois. Zone 5A External Boundary Conditions: Warm Year

88
Figure C.2. Chicago, Illinois. Zone 5A External Boundary Conditions: Cold Year

89
Figure C.3. Houston, Texas. Zone 2A External Boundary Conditions: Warm Year

90
Figure C.4. Houston, Texas. Zone 2A External Boundary Conditions: Cold Year

91
Figure C.5: Seattle, Washington. Zone 4C External Boundary Conditions: Warm Year

92
Figure C.6. Seattle, Washington. Zone 4C External Boundary Conditions: Cold Year

93
Figure C.7. Phoenix, Arizona. Zone 2B External Boundary Conditions: Warm Year

94
Figure C.8. Phoenix, Arizona. Zone 2B External Boundary Conditions: Cold Year

95
APPENDIX D: MATERIAL PROPERTIES
Material data for the baseline and proposed wall assembly cases was either developed or selected
from the material database integrated into the WUFI Pro 5.1 software (Fraunhofer Institute for
Building Physics 2011). Those materials selected from the Generic North American Database
included expanded polystyrene insulation, fiber cement board, gypsum board (USA), oriented
strand board, and spun bonded polyolefine membrane. Material selected from the Generic
Materials database was the 20 mm air layer. Material data developed for simulation included
calculations for a 13 mm air layer and hygrothermal property definition of the form-stable PCM.
Air Cavity Hygrothermal Properties
WUFI Pro 5.1 provides a material database with predefined hygrothermal properties of building
materials that are the product of independent laboratory testing or obtained from published
material. Although this database included air layers in a variety of thicknesses, the 13mm air
layer desired for the cavity at the exterior strapping (between the fiber cement siding and spun
bonded polyolefine membrane) was not available.
For the hygrothermal properties of the 13mm air layer, the properties not affected by the material
thickness were taken directly from predefined air cavity properties in the WUFI Pro 5.1 Generic
Materials database. These properties included the bulk density, porosity, and specific heat
capacity. Properties affected by the material thickness included the dry thermal conductivity and
the water vapor diffusion resistance factor. These thickness dependent properties were
calculated using equations that accounted for the additional transport phenomenon of air layers.
The basis of WUFI heat and moisture transport equations are originally defined for solid and
porous materials; therefore, additional considerations and alterations for radiant and convective

96
heat transfer, as well as vapor diffusivity and moisture storage capacity were made (Fraunhofer
Institute for Building Physics 2011).
For the radiant and conductive heat flow across the air layer, an effective thermal conductivity
value was calculated as shown in Equation D.1 (Fraunhofer Institute for Building Physics 2011).
Using Table 3 of Chapter 26 in the 2009 ASHRAE Fundamentals Handbook (Owen and Kennedy
2009), an effective emittance of 0.82, common for typical building materials, was considered for
a horizontal heat flow through a vertical air cavity of 13 mm at a mean temperature of 10.0 C,
which resulted in a thermal resistance value of 0.16 m2 K W
-1. In return, an effective thermal
conductivity of 0.08125 W m-1
K-1
was calculated.
λ* = Δx*/ Rnon-met Equation D.1
Where:
λ* = effective thermal conductivity [W m-1
K-1
]
Rnon-met = thermal resistance of plane air spaces with non-metallic surfaces [m2 K W
-1]
Δx* = effective air layer thickness [m]
Similarly, the effective water vapor diffusion resistance factor, as shown in Equation D.2, was
calculated using an effective emittance for metallic surfaces as recommended by WUFI Pro 5.1
(Fraunhofer Institute for Building Physics 2011). A value of 0.20 was selected for the effective
emittance (Owen and Kennedy 2009). The same parameters and table used previously were used
to obtain a thermal resistance of 0.33 m2 K W
-1 and an effective water vapor diffusion resistance
factor of 0.66 was calculated.

97
μ* = 0.026 Rmet/Δx* Equation D.2
Where:
μ* = effective water vapor diffusion resistance factor [-]
Rnon-met = thermal resistance of plane air spaces with metallic surfaces [m2 K W
-1]
Δx* = effective air layer thickness [m]
The default WUFI moisture storage function applied to all materials within the WUFI database is
a consideration of porous materials that have the ability to transport moisture through capillary
conduction at relative humidity values below 100 percent (Fraunhofer Institute for Building
Physics 2011). This can provide unrealistic moisture content values within an air layer;
therefore, the air layer (material) is manipulated to define a linear moisture storage function of 0
kg/m3 at a 0 percent relative humidity and free water saturation (or capillary saturation) at 100
percent relative humidity.
Form-Stable PCM
The organic form-stable PCM used for investigation was a blend of 60 percent n-octadecane and
40 percent high density polyethylene (HDPE). The material had an average melting temperature
of 28C and a thermal conductivity of 0.336 Wm-1
K-1
(Estep 2010). The density of the mixture
was determined from the use of Equation D.3 (Yingkui et al. 2001; Zhou et al. 2007) using a
density of 980 kg m-3
for HDPE and 782.2 kg m-3 for paraffin (Alfa Aesar 2011). An
assumption was made that both the HDPE and paraffin contained no voids and had no moisture
storage capacity, therefore the porosity was established as 0.001 and the water vapor diffusion

98
resistance factor was assumed at the known value for HDPE at 100,000 (Hens 2010). The
specific heat was calculated using Equation D.4 (Yingkui et al. 2001; Zhou et al. 2007) using a
specific heat of 1800 J kg-1
K-1
for HDPE and 1909.2 J kg-1
K-1
at 280 K for n-octadecane (Hens
2010; Parks et al. 1949).
ρ = v1ρ1 + v2ρ2 Equation D.3
Where:
ρ = composite material density [kg m-3
]
v1 = mass percentage HDPE [%]
v2 = mass percentage n-octadecane [%]
ρ1 = density HDPE [kg m-3
]
ρ2 = density n-octadecane [kg m-3
]
c = (v1ρ1c1 +v2ρ2c2)/ρ Equation D.4
Where:
c = specific heat capacity phase change [J kg-1
K-1]
c1 = specific heat capacity HDPE [J kg-1
K-1]
c2 = specific heat capacity n-octadecane [J kg-1
K-1
]

99
ρ = composite material density [kg m-3
]
v1= mass percentage HDPE [%]
v2= mass percentage n-octadecane [%]
ρ1= density HDPE [kg m-3
]
ρ2 = density n-octadecane [kg m-3
]
The above equations yielded a density of 861.32 kg m-3
and a specific heat capacity of 1859.5
Jkg-1
K-1
.
The enthalpy of the PCM was taken from previously conducted research on a 60/40 blend of
paraffin-HDPE material in which a differential scanning calorimeter was used to determine latent
heat of fusion (Estep 2010) . Through integration from a lower bound onset temperature of
22.50 C to an upper bound end temperature of 34.81 C, a thermal energy storage capacity of
116,460 J kg-1
was calculated. This information was input into WUFI using a table format in
which a rise in specific enthalpy of 116,460 J kg-1
from 22.5 C to 34.81 C occurred. The onset
temperature, end temperature, and the slope of the temperature dependent enthalpy curve were
only of interest for the heat transport calculations. Therefore, arbitrary values representing the
linear trend of the specific heat capacity (1859.5 J kg-1
K-1
) were included in the table input
before and after the onset and end temperatures.
Built in moisture for the phase change material was set as zero.

100
Material Hygrothermal Properties
This section contains the material properties used by the modeling software to perform the
simulations described in this study. The following tables and graphs were taken from a final
report produced by WUFI Pro 5.1 (Fraunhofer Institute for Building Physics 2011).

101
Figure D.1. Material properties for fiber cement siding.
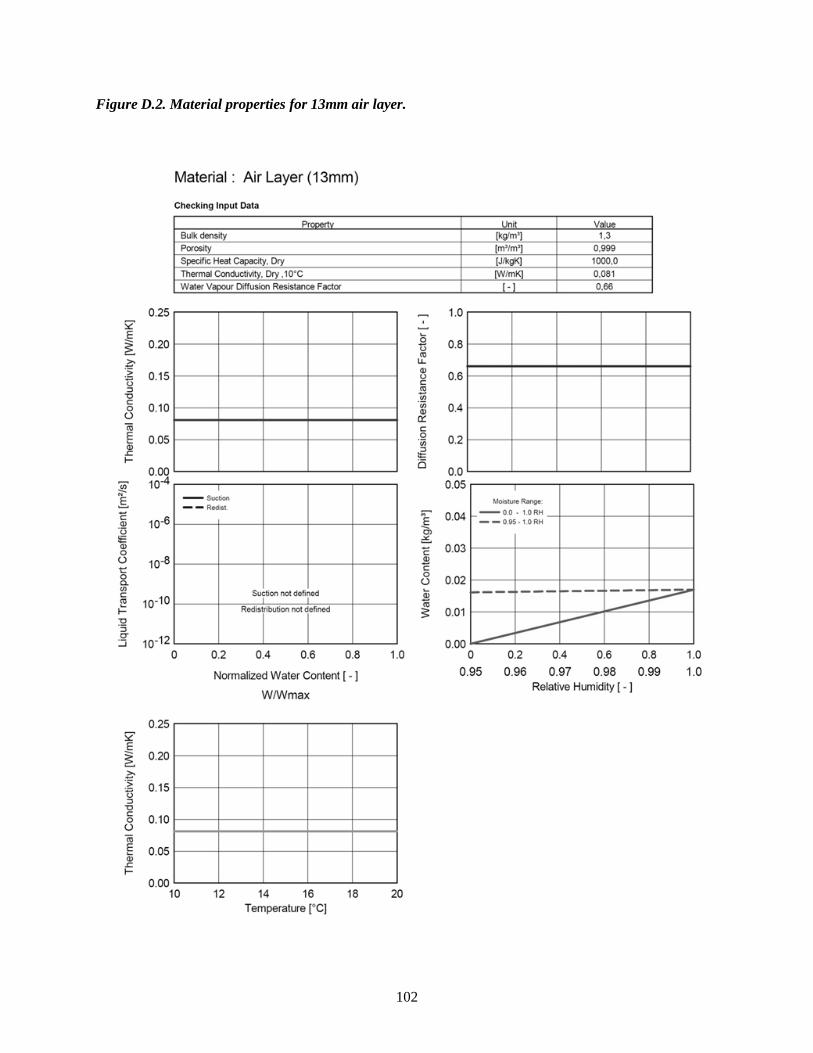
102
Figure D.2. Material properties for 13mm air layer.
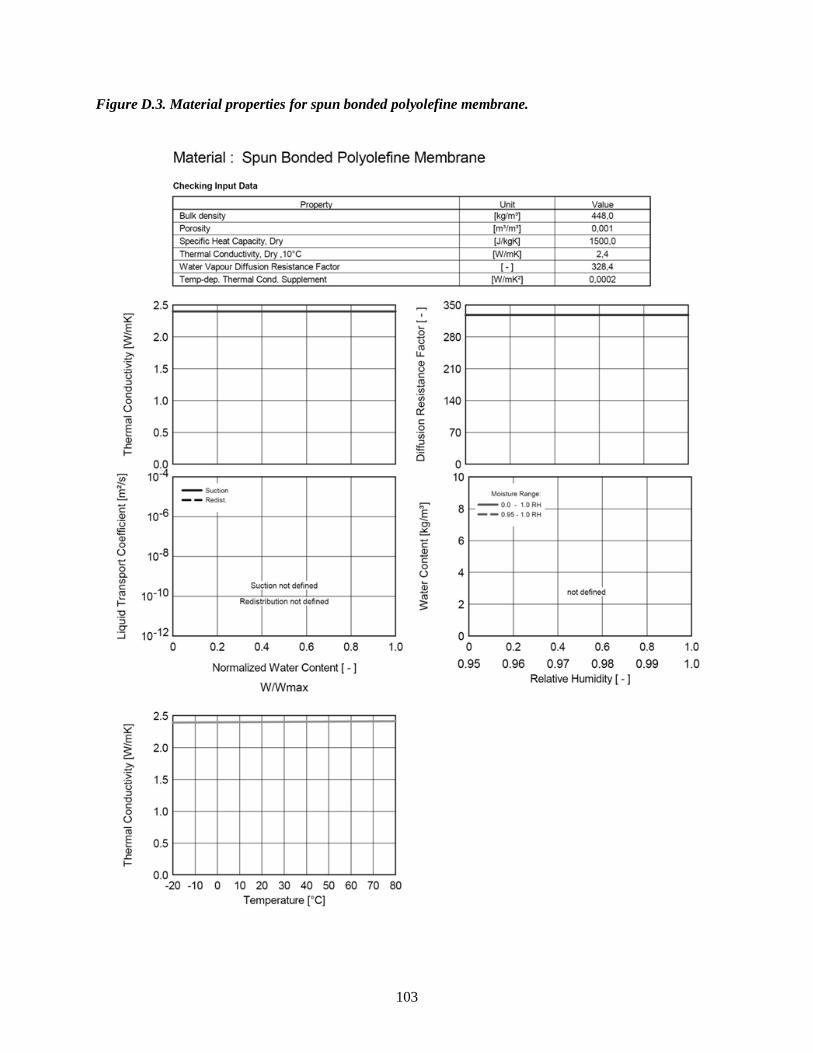
103
Figure D.3. Material properties for spun bonded polyolefine membrane.

104
Figure D.4. Material properties for oriented strand board.

105
Figure D.5. Material properties for 20mm air layer.
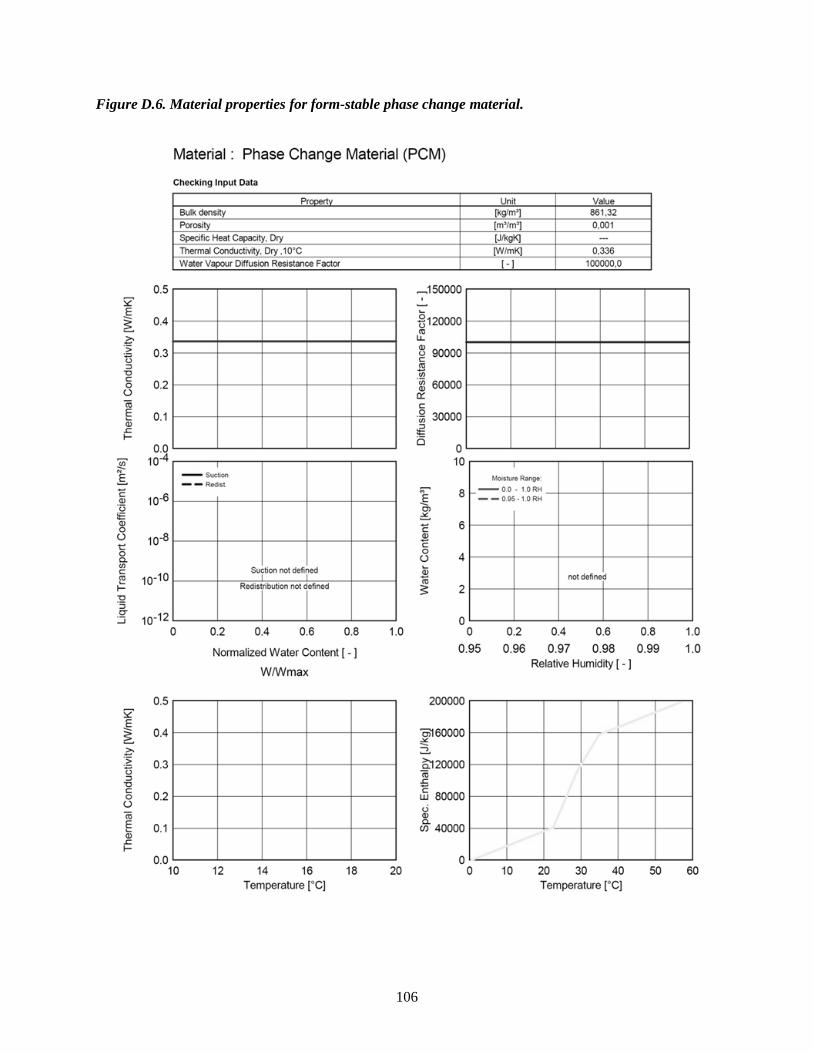
106
Figure D.6. Material properties for form-stable phase change material.
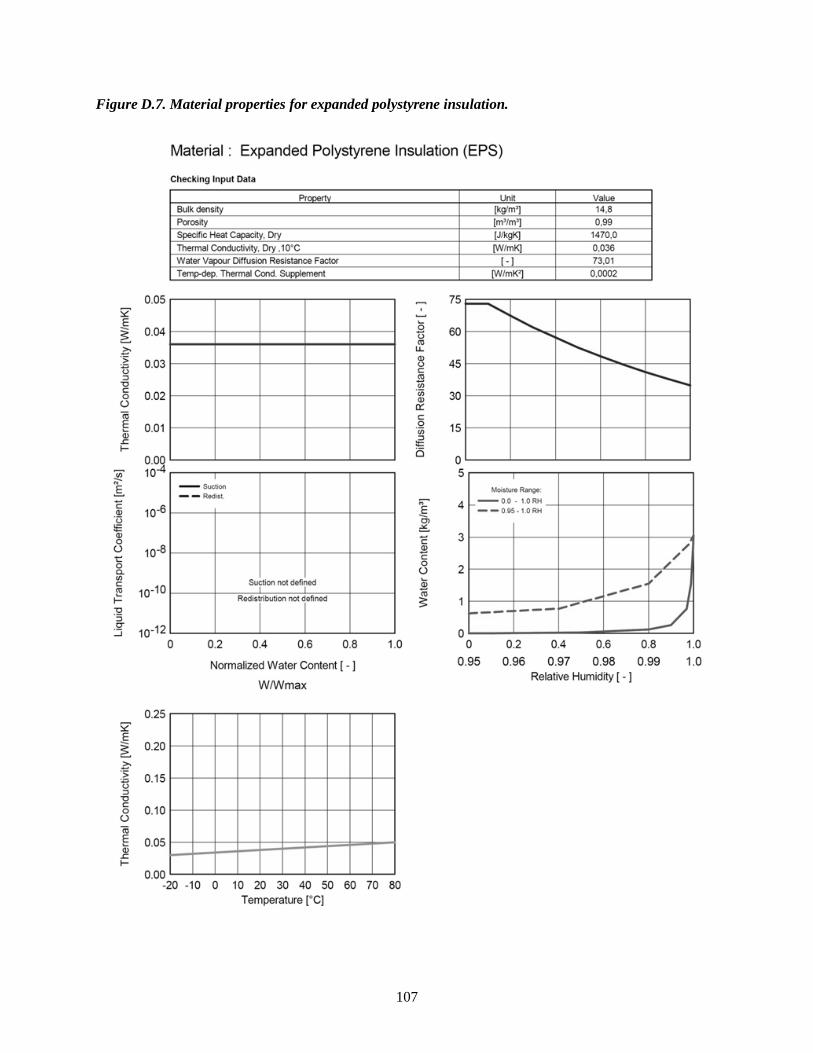
107
Figure D.7. Material properties for expanded polystyrene insulation.
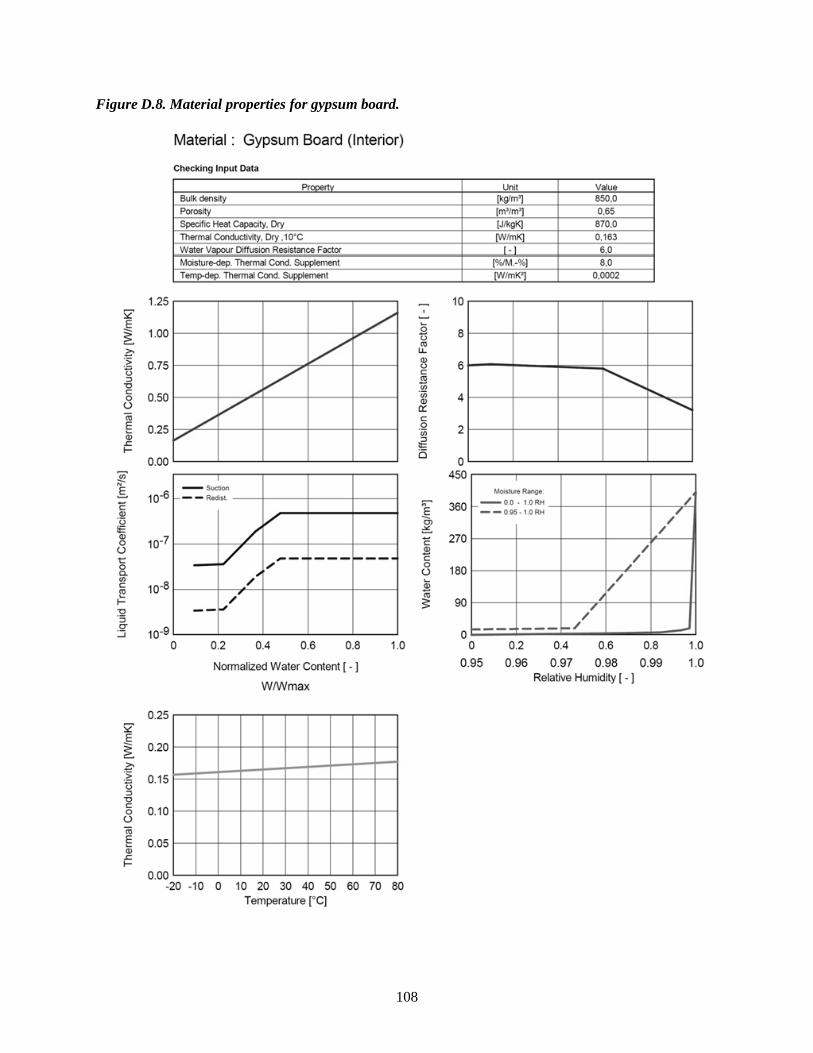
108
Figure D.8. Material properties for gypsum board.

109
APPENDIX E: SURFACE TRANSFER COEFFICIENTS
Each simulation performed in WUFI required defining a series of surface transfer coefficients – a
screen shot from WUFI Pro 5.1 promoting these values is shown in Figure E.1. Appendix E
aims at discussing these coefficients, their values, and the basis for their selection.
Figure E.1. WUFI Pro 5.1 surface transfer coefficient screen shot. Each simulation
performed required a series of surface transfer coefficients for the exterior and interior surface. These surface transfer coefficients included heat resistance, sd-value, short and long
wave radiation, and rain adherence.
Exterior Surface Coefficients
The exterior surface heat resistance is the inverse of the heat transfer coefficient. It consists of
convective and radiative heat transfers between the exterior surface of the assembly and the
surrounding air (Fraunhofer Institute for Building Physics 2011). The default exterior surface
transfer coefficient set by WUFI is defined as 0.0588 m2KW
-1, or the reciprocal of a heat transfer
resistance of approximately 17 Wm-2
K-1
(Schaube 1986). This resistance was calculated from an
average wind speed of 3.6 ms-1
, considered adequate for simulations located in Germany

110
(Schaube 1986), and described as adequate for most simulations (Fraunhofer Institute for
Building Physics 2011). However, this default value was not chosen for simulations within this
investigation. A wind specific heat transfer coefficient was selected to consider both the mean
wind direction and speed for calculations in each climate zone. In any instance, WUFI included
both a basic convective heat transfer coefficient of 4.5 Wm-2
and a radiative transfer coefficient
of 6.5 Wm-2
in the absence of wind (Fraunhofer Institute for Building Physics 2011). When the
simulated wall was facing away from the mean wind direction or facing toward the mean wind
direction for the specified climate zone, additional heat transfer was included at a factor of 0.33
or 1.6 of the mean wind velocity, respectively. Selecting a wind-dependent coefficient allowed
for each climate zones actual wind speed and direction to properly be accounted for in thermal
calculations.
A vapor diffusion resistance value, sd-value, for the exterior was defined for a typical exterior
acrylic house paint and a permeance value of 313 ng Pa-1
s-1
m-2
with a thickness of 0.04mm
(Owen and Kennedy 2009). The water vapor diffusion resistance was calculated by dividing the
water vapor permeance of stagnant air by the water vapor permeance of the exterior paint finish
as shown in Equation E.1 (Kumaran 2001). The water vapor permeance of the stagnant air was
calculated using Equation E.2 (Kumaran 2001).
μm = δa/δm Equation E.1
Where:
μm = water vapor diffusion resistance factor of material [-]
δa = water vapor permeance of stagnant air [kg Pa-1
s-1
m-1
]

111
δm = water vapor permeance of material [kg Pa-1
s-1
m-1
]
δa = (2.306E-5Po / RvTP)(T/273.15)^1.81 Equation E.2
Where:
Po = standard atmospheric pressure [Pa]
P = ambient pressure [Pa]
Rv = ideal gas constant for water [J K-1
kg-1
]
T =temperature [K]
For calculations, an ambient pressure of 101.325 kPa and an ambient temperature of 273.15 K
were used. This resulted in a water vapor permeance for stagnant air of 1.8293 x 10⁻¹⁰
kg Pa-1
s-
1m
-1.
A water vapor diffusion resistance factor of the material was found to be approximately 14611
which produced a vapor diffusion thickness of 0.58 m for a 0.04 mm paint coat. This was
calculated by multiplying the water vapor diffusion resistance factor of the material by the
material thickness.
Short wave absorptivity and long wave radiation emissivity were considered in this study. It was
assumed that the exterior siding of each assembly was painted white, therefore, a user specified
solar absorptivity value of 0.26 and long-wave radiation emissivity value of 0.9 were used
(Owen and Kennedy 2009). The ground short-wave reflectivity was also considered for this
study, however, the explicit radiation balance was not enabled. As the nature of the explicit
radiation balance is dictated by the surrounds of the wall assembly, it was not considered for this

112
parametric study but is suggested when employing hygrothermal modeling for a specific design
case. A reflectivity value of 0.22 was chosen to represent a ground covering of weathered
concrete (Thevenard and Haddad 2006). This value was slightly less than a vertical wall
exposed to grassy land (0.26) and slight more than exposure to dry bare ground (0.2) (Thevenard
and Haddad 2006). It was noted that reflectivity greatly increases with a fresh snow covered
ground, which can hold a reflectivity value as great as 0.95. However, variability of snow
production within each climate, snow depth, and duration can all greatly vary the reflectivity,
therefore snow was not considered within the reflectivity value used for investigation (Thevenard
and Haddad 2006). It is suggested, however, that the effect of snow reflectance be examined for
individual climates and cases.
The rain reduction factor was specified to vary with the inclination and construction type of the
wall providing a default value of 70 percent. Factors affecting the rain reduction included
orientation, inclination, exterior surface texture, and precipitation factors.
Interior Surface Coefficients
The surface diffusion resistance factor at the interior face of the wall was defined the same as the
exterior face and heat resistance for the interior wall was set at the default WUFI value of 0.125.
Although the inclusion of a surface diffusion resistance factor was included on both the interior
and exterior faces of each assembly, WUFI automatically calculates the existing diffusion
resistance at the face due to a thin air film (Fraunhofer Institute for Building Physics 2011).

113
APPENDIX F: UNITED STATES REGULATIONS TO PROMOTE
ENERGY SAVINGS IN BUILDINGS
The contents of this section are an extension of information presented in Chapter 1, however, are
still only a brief summary of the current U.S. movement toward energy savings strategies. The
goal of this section is to provide an overview of the current measures being taken by federal,
state, and local governing agencies to promote energy conservation within federal government
agencies, buildings and programs, state buildings and regulatory codes, and private sectors.
Affecting the government sector, Executive Order 13423: Strengthening Federal Environmental,
Energy, and Transportation Management was signed on January 24, 2007, enacted on February
17, 2009 (Bush 2007), and mandates federal departments to play an active role in accomplishing
respective activities to improve energy efficiency and reduce greenhouse gas emissions, support
renewable resources, reduce water consumption, and implement sustainable environmental
practices. Among these requirements all new construction and major renovations to federal
buildings must follow the Guiding Principles for Federal Leadership in High Performance and
Sustainable Buildings Memorandum of Understanding (MOU) (United States Federal
Government 2006) . Specified in this MOU, energy demand for new buildings are expected to
perform at 30 percent below the baseline building standards as outlined in ASHRAE Standard
90.1-2004, whereas major renovations are required to perform at 20 percent below the baseline
of existing building performance prior to 2003. Some areas directly affecting the building
envelope include MOU requirements for humidity control, moisture control for biological
growth and biodeterioration prevention, and a call for recycled/certified biobase products and
materials.

114
An even more demanding Order was released on October 5, 2009, Executive Order 13514:
Leadership in Environmental, Energy, and Economic Performance, and declared plans for
federal buildings after 2020 to result in net zero structures by 2030 and for 15 percent of all
existing federal buildings to comply with the set guidelines by 2015 (Federal Energy
Management Program 2011)(Environmental 2010). The new executive order follows the same
Guiding Principles for Federal Leadership in High Performance and Sustainable Buildings as
Order 13423 but establishes a goal date for building energy reformation.
Affecting a more local sector, the Department of Energy State Energy Program (SEP) was
developed in 1996 and serves to promote energy efficiency among the states and territories of the
United States (U.S. Department of Energy 2011). Through competitive grants, the SEP
encourages states to implement energy efficiency technology, develop energy goals and
programs, and more recently drive the adoption and enforcement of energy codes. With the
1992 Energy Policy Act, the DOE was provided with the duty of becoming a more active
participant in the development of state energy legislation and gained leverage in 2009 when the
American Reinvestment and Recovery Act provided 3.1 billion dollars to the SEP. This
additional funding heightened the financial incentive of state interest in energy efficiency
concern and encouraged numerous states to begin adopting the most recent IECC and ASHRAE
90.1-2007 due to the strict requirements for receiving the second funding phase of each awarded
grant (Eldridge et al. 2009). Several dozen states began the adoption of the grant requiring codes
between the 2009 and 2010 year (Molina et al. 2010).
To encourage the private commercial sector, the Better Buildings Initiative was declared in
February 2011 with the goal of increasing efficiency of commercial buildings by 20 percent by
the year 2020 (U.S. Department of Energy 2012). This announcement sparked the development
115
of such programs such as the Better Building Challenge and the Better Buildings Neighborhood
Program, but has also rallied the Department of Energy to team with Congress, the Appraisal
Foundation, Small Business Administration, and the National Institute of Standards and
Technology to promote energy efficiency within the private sector. Propositions for the fiscal
year 2012 have demanded more money for state energy code adoption aid and loans for
commercial energy investments.
116
APPENDIX G: CHAPTER 2 RESULTS
This appendix displays additional results to Chapter 2 simulations regarding ventilation air flow
at the strapped and three-dimensional core cavities of interest for both the baseline and proposed
wall assemblies.
Mold Evaluation Results
The following section displays results from the 30-day running average temperature and relative
humidity evaluation for each wall assembly. The purpose of analysis was to determine if the
necessary conditions to reduce microbial growth were exhibited. This evaluation criterion was
taken from ANSI/ASHRAE Standard 160-2009 (American Society of Heating, Refrigerating and
Air-Conditioning Engineers, Inc. 2009).

117
Figure G.1. Microbial growth potential for Chicago, IL (cold year). Depicted is the normalized
microbial growth potential for the baseline assembly and both HCP rib variation assemblies. These results are based on the air flow rate the drainage plane cavity and exterior core cavity were subjected to
and provides the assembly response at the water resistant barrier and OSB material layers interface.
Figure G.2. Microbial growth potential for Chicago, IL (warm year). Depicted is the normalized
microbial growth potential for the baseline assembly and both HCP rib variation assemblies. These results are based on the air flow rate the drainage plane cavity and exterior core cavity were subjected to
and provides the assembly response at the OSB and expanded polystyrene material layers interface.

118
Figure G.3. Microbial growth potential for Chicago, IL (cold year). Depicted is the normalized
microbial growth potential for the baseline assembly and both HCP rib variation assemblies. These results are based on the air flow rate the drainage plane cavity and exterior core cavity were subjected to
and provides the assembly response at the OSB and expanded polystyrene material layers interface.
Figure G.4. Microbial growth potential for Houston, TX (warm year). Depicted is the normalized
microbial growth potential for the baseline assembly and both HCP rib variation assemblies. These
results are based on the air flow rate the drainage plane cavity and exterior core cavity were subjected to and provides the assembly response at the OSB and expanded polystyrene material layers interface.
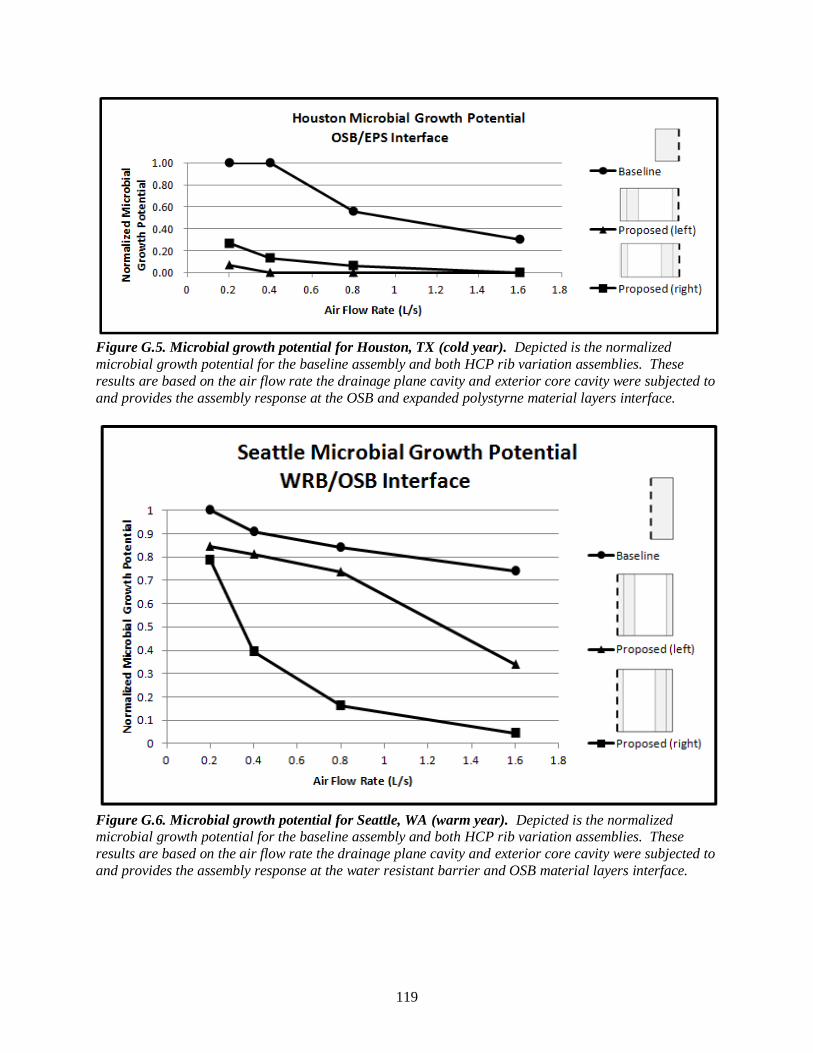
119
Figure G.5. Microbial growth potential for Houston, TX (cold year). Depicted is the normalized
microbial growth potential for the baseline assembly and both HCP rib variation assemblies. These
results are based on the air flow rate the drainage plane cavity and exterior core cavity were subjected to
and provides the assembly response at the OSB and expanded polystyrne material layers interface.
Figure G.6. Microbial growth potential for Seattle, WA (warm year). Depicted is the normalized microbial growth potential for the baseline assembly and both HCP rib variation assemblies. These
results are based on the air flow rate the drainage plane cavity and exterior core cavity were subjected to
and provides the assembly response at the water resistant barrier and OSB material layers interface.

120
Figure G.7. Microbial growth potential for Seattle, WA (cold year). Depicted is the normalized
microbial growth potential for the baseline assembly and both HCP rib variation assemblies. These
results are based on the air flow rate the drainage plane cavity and exterior core cavity were subjected to and provides the assembly response at the water resistant barrier and OSB material layers interface.
Figure G.8. Microbial growth potential for Seattle, WA (warm year). Depicted is the normalized microbial growth potential for the baseline assembly and both HCP rib variation assemblies. These
results are based on the air flow rate the drainage plane cavity and exterior core cavity were subjected to
and provides the assembly response at the OSB and expanded polystyrene material layers interface.

121
APPENDIX H: CHAPTER 3 RESULTS
Additional data to that presented in the result section of the Chapter 3 investigation on the
implementation of form-stable PCM is described in this section.
Table H1. Peak heat flux reduction from baseline behavior. For each analysis performed, a daily comparison of peak heat flux was compared to that of the typical SIP construction simulation. The
average reduction from the baseline performance for each analysis period is shown for all climate
zones simulated.
Houston, TX: Zone 2A Phoenix, AZ: Zone 2B
Coldest Months
Evaluated Warmest Months
Evaluated Coldest Months
Evaluated Warmest Months
Evaluated
Cold Year
Warm Year
Cold Year
Warm Year
Cold Year
Warm Year
Cold Year
Warm Year
Proposed 7.25% 7.44% 9.47% 8.86% 9.02% 9.27% 7.76% 8.01%
Proposed PCM Ext
9.10% 11.72% 35.00% 32.04% 16.01% 22.43% 28.76% 23.94%
Seattle, WA: Zone 4C Chicago, IL: Zone 5A
Coldest Months
Evaluated Warmest Months
Evaluated Coldest Months
Evaluated Warmest Months
Evaluated
Cold Year
Warm Year
Cold Year
Warm Year
Cold Year
Warm Year
Cold Year
Warm Year
Proposed 7.08% 7.44% 8.67% 9.88% 6.52% 7.00% 6.30% 5.85%
Proposed PCM Ext
7.27% 8.59% 18.42% 19.14% 6.92% 7.71% 9.92% 5.93%

122
APPENDIX I: APPENDICES REFERENCES
Alfa Aesar. 2011. 531954 n-Octadecane, 99%. Alfa Aesar - A Johnson Matthey Company.
http://www.alfa-chemcat.com/en/GP100w.pgm?DSSTK=031954.
American Society of Heating, Refrigerating and Air-Conditioning Engineers, Inc. 2009.
ANSI/ASHRAE Standard 160-2009 Criteria for Moisture-Control Design Analysis in
Buildings. Atlanta, GA.
Bush, G. W. 2007. Executive Order 13423 - Strengthening Federal Environment, Energy, and
Transportation Management. Vol. 72. Federal Register 17. United States of America,
January 26.
Eldridge, Maggie, Michael Sciortino, Laura Furrey, Seth Nowak, Shruti Vaidyanathan, Max
Neubauer, Nate Kaufman, et al. 2009. The 2009 State Energy Efficiency Scorecard.
American Council for an Energy-Efficient Economy, October.
Environmental, E. 2010. “Executive Order 13514.”
Estep, G.D. 2010. The Influence of Extrusion Processing for Formulation on Form-Stable Phase
Change Material. Washington State University.
Federal Energy Management Program. 2011. Executive Order 13514 - Federal Leadership in
Environmental, Energy, and Economic Performance. U.S. Department of Energy, July.
Fraunhofer Institute for Building Physics. 2011. WUFI Pro. Stuttgart, Germany: Fraunhofer
Gesellschaft.

123
Hens, Hugo S. L. C. 2010. Applied Building Physics: Boundary Conditions, Building
Performance and Material Properties. John Wiley and Sons, December 21.
International Code Council. 2009. International Energy Conservation Code. Cengage Learning.
Kumaran, M. K. 2001. “Hygrothermal properties of building materials.” ASTM Manual on
Moisture in Buildings (September 1).
Molina, Maggie, Max Neubauer, Michael Sciortino, Seth Nowak, Shruti Vaidyanathan, Nate
Kaufman, and Anna Chittum. 2010. The 2010 State Energy Efficiency Scorecard.
American Council for an Energy-Efficient Economy, October 13.
Owen, Mark S., and Heather E. Kennedy. 2009. 2009 ASHRAE handbook: fundamentals.
Atlanta, GA: American Society of Heating, Refrigeration and Air-Conditioning
Engineers, July 1.
Parks, George S., George E. Moore, Melvin L. Renquist, Benjamin F. Naylor, Leslie A.
McClaine, Paul S. Fujii, and John A. Hatton. 1949. “Thermal Data on Organic
Compounds. XXV. Some Heat Capacity, Entropy and Free Energy Data for Nine
Hydrocarbons of High Molecular Weight.” J. Am. Chem. Soc. 71 (10): 3386-3389.
doi:10.1021/ja01178a034.
Schaube, H. 1986. Wärmeübergangskoeffizient unter natürlichen Klimabedingungen. Vol. 109.
Fraunhofer-Institut fur Bauphysik; iBP-Mitteilung.
Thevenard, D., and K. Haddad. 2006. “Ground reflectivity in the context of building energy
simulation.” Energy and Buildings 38 (8) (August): 972-980.
doi:10.1016/j.enbuild.2005.11.007.

124
U.S. Department of Energy. 2011. Weatherization and Intergovernmental Program: State Energy
Program. July 19. http://www1.eere.energy.gov/wip/sep.html.
———. 2012. Better Buildings. January 4.
http://www1.eere.energy.gov/buildings/betterbuildings/.
United States Federal Government. 2006. Federal Leadership in High Performance and
Sustainable Buildings Memorandum of Understanding. January.
Yingkui, G., L. Xingang, and Z. Yinping. 2001. “Simplified Method for Analyzing the Transient
Thermal Performance of Composite (Phase Change) Material.” Acta Energiae Solaris
Sinica 1.
Zhou, Guobing, Yinping Zhang, Xin Wang, Kunping Lin, and Wei Xiao. 2007. “An assessment
of mixed type PCM-gypsum and shape-stabilized PCM plates in a building for passive
solar heating.” Solar Energy 81 (11) (November): 1351-1360.
doi:10.1016/j.solener.2007.01.014.