Embed Size (px)
Citation preview
i
University of Southern Queensland
Faculty of Health, Engineering and Sciences
Thermally Insulated Structural Sandwich Panels for
Roofing Applications
A dissertation submitted by
Mr. Aiden Michael Flannery
In fulfilment of the requirements of
Bachelor of Engineering (Civil)
October 2015

iii
Abstract
The market for modular housing and infrastructure is growing remarkably quickly due
to increasing costs of labour and the demand for energy efficient, long lasting buildings.
The viability of using fibre composite sandwich panels for these applications formed the
primary investigation of this research project. The flexural strength and thermal
insulation were of main focus however fire resistance, cost effectiveness and lifespan
were also investigated.
A literature review was conducted on the design methods, requirements and
applications of fibre composite technology in the civil infrastructure industry. Based on
these findings, the theoretical properties of the materials were than calculated and used
to design a set of sample beams. The sample beams consisted of a rigid polyurethane
core sandwiched between two fibreglass skins made from woven roving and chopped
strand mat. The beams were tested in 3 point, 4 point, quarter-span and third-span
bending. From the tests results, various material properties were calculated such as the
core shear rigidity, core ultimate compressive stress, core ultimate shear stress and
facing modulus. These mechanical properties along with the knowledge of failure
modes gained throughout the testing period were used to redesign the sandwich panels.
The final design was modelled in Creo Parametric with an FEA conducted using the
Creo Simulation package.
Core crushing and skin delamination were the two most common failure modes
observed during testing. The modulus of elasticity of the skins and shear rigidity of the
core were calculated as 2797.5MPa and 2.4MPa respectively. The core ultimate
compressive stress and shear stress were calculated as 0.3MPa and 0.34MPa
respectively. The serviceability requirements governed the roofing panel design which
resulted in a core thickness of 100mm and a thermal resistance (R) value of 5.75. The
finite element analysis results confirmed the design satisfied the serviceability
requirements with a variation of less than 10% when compared with the predicted
values and physical testing data. A cost analysis revealed that the FRP sandwich panels
were significantly more expensive than conventional roofing materials however key
areas for design improvement and cost reductions have been identified.
iv
University of Southern Queensland
Faculty of Health, Engineering and Sciences
ENG4111/ENG4112 Research Project
Limitations of Use
The Council of the University of Southern Queensland, its Faculty of Health,
Engineering & Sciences, and the staff of the University of Southern Queensland, do not
accept any responsibility for the truth, accuracy or completeness of material contained
within or associated with this dissertation.
Persons using all or any part of this material do so at their own risk, and not at the risk
of the Council of the University of Southern Queensland, its Faculty of Health,
Engineering & Sciences or the staff of the University of Southern Queensland.
This dissertation reports an educational exercise and has no purpose or validity beyond
this exercise. The sole purpose of the course pair entitled “Research Project” is to
contribute to the overall education within the student’s chosen degree program. This
document, the associated hardware, software, drawings, and other material set out in the
associated appendices should not be used for any other purpose: if they are so used, it is
entirely at the risk of the user.
v
Certification
I certify that the ideas, experimental work, results, analyses, software and conclusions
reported in this dissertation are entirely my own effort, except where otherwise
acknowledged.
I also certify that the work is original and has not been previously submitted for any
other award, except where otherwise acknowledged.
Aiden Michael Flannery
Student Number: 0061033162
___________________________________________ ________________________
Student signature Date
Endorsement
Dr Sourish Banerjee
___________________________________________ ________________________
Supervisor signature Date

vi
Acknowledgements
This project would not have been possible if it weren’t for the support and assistance
that I received from others whilst undertaking the project and preparing the dissertation.
Firstly I would like to thank my friends and family for their support throughout my time
studying at the University of Southern Queensland.
I would like acknowledge BAC and in particular Norman Watt for the supply of
materials and continued support throughout this project.
I would also like to thank my supervisor, Dr Sourish Banerjee, for his guidance and
Wayne Crowell from the Centre of Excellence in Engineered Fibre Composites for his
assistance in the testing laboratories.

vii
Table of Contents
Abstract ....................................................................................................................... iii
Limitations of Use ........................................................................................................ iv
Certification .................................................................................................................. v
Acknowledgements ...................................................................................................... vi
Table of Contents ........................................................................................................ vii
List of Figures .............................................................................................................. xii
List of Tables ............................................................................................................... xiv
Nomenclature and Acronyms ...................................................................................... xvi
Chapter 1. Introduction .............................................................................................. 1
1.1. Topic ...................................................................................................................... 1
1.2. Background ........................................................................................................... 1
1.3. Aim and objectives ................................................................................................ 2
1.4. Justification of project........................................................................................... 2
1.5. Design Concept ..................................................................................................... 3
Chapter 2. Literature Review ...................................................................................... 7
2.1. Introduction .......................................................................................................... 7
2.2. Fibre composites ................................................................................................... 7
2.2.1. History
2.2.2. Development and applications
2.3. Composite sandwich panels ................................................................................ 12
2.3.1. Introduction
2.3.2. Fabrication
2.3.3. Development
viii
2.3.4. Applications
2.3.5. Benefits
2.4. Flexural strength and deflection of sandwich panels .......................................... 17
2.4.1. Strength of composites
2.4.2. Volume Fraction
2.4.3. Rule of mixtures
2.4.4. Micro-Cracking
2.4.5. Flexural rigidity
2.4.6. Bending stress
2.4.7. Deflection
2.4.8. Delamination
2.4.9. Wrinkling
2.4.10. Core shear failure
2.4.11. Crushing
2.4.12. Wide beams and effective width
2.5. Thermal insulation of sandwich panels ............................................................... 28
2.5.1. Thermal conductivity (𝛌)
2.5.2. Thermal resistance (R’)
2.5.3. Thermal diffusivity (D)
2.6. Fire resistance ...................................................................................................... 30
2.6.1. PU core
2.6.2. Fibreglass skins
2.7. Testing ................................................................................................................. 31
2.7.1. Stiffness
2.7.2. Strength
Chapter 3. Methodology and Manufacture ............................................................... 35
3.1. Introduction ......................................................................................................... 35
ix
3.2. Design requirements ........................................................................................... 35
3.3. Initial design ........................................................................................................ 35
3.4. Properties of materials ....................................................................................... 36
3.4.1. Introduction
3.4.2. Glass
3.4.3. Resin
3.4.4. Foam Cores
3.4.5. Theoretical properties
3.4.5.1. Volume fraction
3.4.5.2. Thickness of laminate
3.4.5.3. Composite density
3.4.5.4. Modulus of elasticity
3.4.5.5. Tensile strength
3.5. Manufacture ....................................................................................................... 45
3.5.1. Materials
3.5.2. Procedure
3.6. Testing procedures.............................................................................................. 47
3.7. Modelling and final design .................................................................................. 50
3.8. Resource requirements ....................................................................................... 50
Chapter 4. Results and Analysis ................................................................................ 51
4.1. Introduction ........................................................................................................ 51
4.2. Design loads ........................................................................................................ 51
4.2.1. Dead load
4.2.2. Live load
4.2.3. Wind load
4.3. Serviceability limits ............................................................................................. 56
x
4.4. Thermal insulation requirements ........................................................................ 57
4.5. Initial design ......................................................................................................... 57
4.5.1. Flexural rigidity
4.5.2. Compressive strength
4.5.3. Shear strength
4.5.4. Bending moment
4.5.5. Thermal insulation
4.6. Testing ................................................................................................................. 60
4.6.1. Test 1
4.6.2. Test 2
4.6.3. Test 3
4.6.4. Test 4
4.6.5. Test 5
4.6.6. Test 6
4.6.7. Testing summary
4.6.8. Stiffness
4.6.9. Strength
Chapter 5. Modelling and final design ....................................................................... 73
5.1. Parameters .......................................................................................................... 73
5.2. Design .................................................................................................................. 73
5.2.1. Loading Cases
5.2.2. Serviceability
5.2.3. Strength
5.2.4. Thermal insulation
5.3. Modelling and analysis ........................................................................................ 79
5.3.1. Test beam
5.3.2. Final Panel Design
xi
5.4. Cost analysis ........................................................................................................ 83
5.4.1. Sandwich panels
5.4.2. Traditional materials
5.4.3. Existing sandwich panels
5.4.4. Conclusion
Chapter 6. Conclusions and future work ................................................................... 87
6.1. Introduction ........................................................................................................ 87
6.2. Design requirements ........................................................................................... 87
6.3. Testing results ..................................................................................................... 87
6.4. Final design ......................................................................................................... 88
6.5. Summary ............................................................................................................. 89
6.6. Recommendations and future work ................................................................... 89
References .................................................................................................................. 91
Appendices ................................................................................................................. 95
Appendix A – Project Specification................................................................................... 95
Appendix B – Risk Management Plan ............................................................................... 97
Appendix C - Time line .................................................................................................... 104
Appendix D – Creo Simulation ........................................................................................ 105
xii
List of Figures
Figure 1 - Typical Roof Truss ................................................................................................... 3
Figure 2 - Modular Roof Concept ............................................................................................ 3
Figure 3 - Composite sandwich panel ..................................................................................... 4
Figure 4 - Tongue and groove connection .............................................................................. 4
Figure 5 - Concept Design ....................................................................................................... 5
Figure 6 - Fibreglass sailboat and car ...................................................................................... 8
Figure 7 - Pultrusion Process adopted by (Pultrusion Process 2015) ..................................... 9
Figure 8 - Pultruded Decks .................................................................................................... 10
Figure 9 - (a) solid core, (b) honeycomb core, (c) corrugated core ...................................... 12
Figure 10 - Reinforcement of Core ........................................................................................ 14
Figure 11 - BAC FRP Pedestrian Bridge ................................................................................. 15
Figure 12 - Complete Modular Homes Granny Flat .............................................................. 16
Figure 13 - Failure modes (Almeida 2009) ............................................................................ 17
Figure 14 - Idealised stress-strain curve (Foster 1998) ......................................................... 20
Figure 15 - Micro-cracking (Gurit 2015) ................................................................................ 21
Figure 16 - Dimensions of sandwich beam ........................................................................... 22
Figure 17 - Values of 𝜷𝟏, 𝜷𝟐, 𝜷𝟑, 𝜷𝟒, 𝜷𝟓 ............................................................................. 23
Figure 18 - Values for 𝜷𝟔 𝒂𝒏𝒅 𝜷𝟕 ........................................................................................ 26
Figure 19 - Wide beams ........................................................................................................ 27
Figure 20 - 3-Point Mid-Span Loading ................................................................................... 32
Figure 21 - 4-Point Quarter-Span and 4-Point Third-Span Loading ...................................... 33
Figure 22 - Ultimate and working strengths ......................................................................... 44
Figure 23 - Foam core, chopped strand mat and woven roving glass .................................. 46
Figure 24 - Completed test beams ........................................................................................ 46
Figure 25 - Loading case 1 ..................................................................................................... 47
Figure 26 - Test 3 setup ......................................................................................................... 48
xiii
Figure 27 - Specimen 4 during testing process..................................................................... 49
Figure 28 - Test 6 setup ........................................................................................................ 49
Figure 29 - Loading Configuration ........................................................................................ 51
Figure 30 - Building dimensions ........................................................................................... 53
Figure 31 - Test 1 (Mid-Span Loading) 450mm span ............................................................ 60
Figure 32 - Core crushing failure mode ................................................................................ 61
Figure 33 - Test 2 (Mid-Span Loading) 300mm span ............................................................ 61
Figure 34 - Core crushing ...................................................................................................... 62
Figure 35 - Test 3 (4-point Loading) 1300mm span .............................................................. 62
Figure 36 - Shearing failure .................................................................................................. 63
Figure 37 - Test 4 (4-Point Loading) 600mm span ................................................................ 63
Figure 38 - Test 5 (4-Point Loading) 450mm span ................................................................ 64
Figure 39 - Support shear failure and delamination ............................................................ 65
Figure 40 - Test 6 (Quarter Point Loading) 450mm span ..................................................... 65
Figure 41 - Linear-elastic zone .............................................................................................. 67
Figure 42 - Core crushing load .............................................................................................. 71
Figure 43 - Final panel dimensions ....................................................................................... 74
Figure 44 - FEA test beam configuration .............................................................................. 80
Figure 45 - FEA test beam deflection ................................................................................... 80
Figure 46 - FEA panel loading configuration ........................................................................ 81
Figure 47 - FEA panel deflection ........................................................................................... 81
Figure 48 - FEA panel stress top ........................................................................................... 82
Figure 49 - FEA panel stress bottom ..................................................................................... 82
Figure 50 - The risk management process............................................................................ 98
Figure 51 - Risk Matrix ........................................................................................................ 100
Figure 52 - Foam core inputs .............................................................................................. 105
Figure 53 - FRP skin input ................................................................................................... 106
xiv
Figure 54 - FEA test beam loading ...................................................................................... 107
Figure 55 - FEA test beam restraints ................................................................................... 108
Figure 56 - FEA test beam stress top .................................................................................. 109
Figure 57 - FEA test beam stress bottom ............................................................................ 110
Figure 58 - FEA test beam 500N deflection ........................................................................ 111
Figure 59 - FEA panel mesh geometry ................................................................................ 112
List of Tables
Table 1 - Nomenclature and Acronyms ............................................................................... xvi
Table 2 - Values of 𝑲𝒈 and 𝑲𝒔 for different supporting conditions ................................... 24
Table 3 - Effective width ....................................................................................................... 27
Table 4 - E glass properties ................................................................................................... 36
Table 5 - Comparison of E-glass composites with different yarn processing types.............. 37
Table 6 - Typical liquid properties ......................................................................................... 38
Table 7 - Typical cured properties......................................................................................... 38
Table 8 – BFE35 Typical physical properties ......................................................................... 39
Table 9 - Testing results of 16 & 62kg/m³ PU foam .............................................................. 40
Table 10 - Laminate Layup .................................................................................................... 41
Table 11 - Serviceability limits .............................................................................................. 56
Table 12 - Minimum total R-Values ...................................................................................... 57
Table 13 - Results summary .................................................................................................. 66
Table 14 - 50mm core stiffness properties ........................................................................... 67
Table 15 - 75mm core stiffness properties ........................................................................... 68
Table 16 - Revised 75mm core stiffness properties .............................................................. 69
Table 17 - Sandwich beam property summary ..................................................................... 70
Table 18 - Final panel properties .......................................................................................... 73
xv
Table 19 - Custom ORB limit state wind pressure capacities (kPa) 0.42BMT ...................... 74
Table 20 - Design capacities ................................................................................................. 78
Table 21 - Material rates ...................................................................................................... 84
Table 22 - Panel costing ........................................................................................................ 84
Table 23 - Insulation rates (Schneider 2015) ........................................................................ 85
Table 24 - Roofing rates (Roofing Fundamental 2015) ........................................................ 85
Table 25 - Cost comparison .................................................................................................. 86
Table 26 - Important results ................................................................................................. 89
Table 27 – Identified hazards ............................................................................................... 99
Table 28 - Other hazards .................................................................................................... 100
Table 29 - RMP ................................................................................................................... 101
Table 30 - Project timeline ................................................................................................. 104
xvi
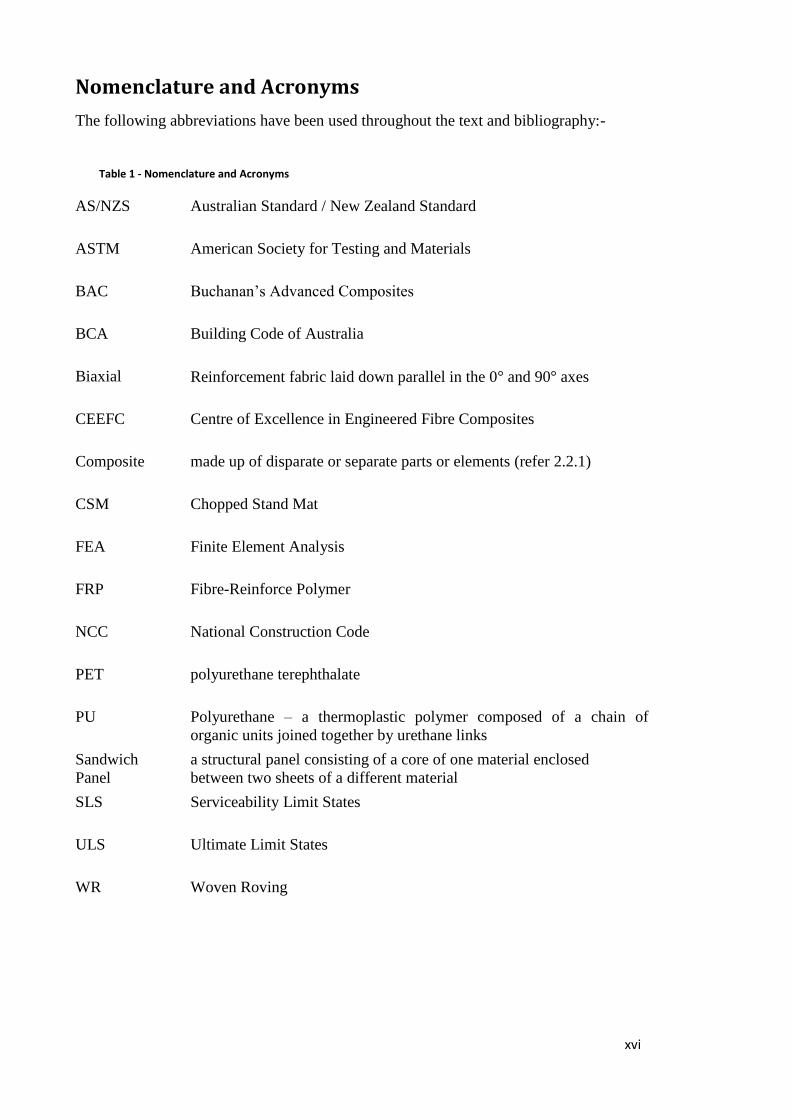
Nomenclature and Acronyms
The following abbreviations have been used throughout the text and bibliography:-
Table 1 - Nomenclature and Acronyms
AS/NZS Australian Standard / New Zealand Standard
ASTM American Society for Testing and Materials
BAC Buchanan’s Advanced Composites
BCA Building Code of Australia
Biaxial Reinforcement fabric laid down parallel in the 0° and 90° axes
CEEFC Centre of Excellence in Engineered Fibre Composites
Composite made up of disparate or separate parts or elements (refer 2.2.1)
CSM Chopped Stand Mat
FEA Finite Element Analysis
FRP Fibre-Reinforce Polymer
NCC National Construction Code
PET
polyurethane terephthalate
PU Polyurethane – a thermoplastic polymer composed of a chain of
organic units joined together by urethane links
Sandwich
Panel
a structural panel consisting of a core of one material enclosed
between two sheets of a different material
SLS Serviceability Limit States
ULS Ultimate Limit States
WR Woven Roving
1
Chapter 1. Introduction
“Composite materials, based on the principal that the sum is greater than the
parts, are beginning to offer engineers new choices in materials selection for
product design. With composites already in use for products ranging from
golf-club shafts to turbine blades, many feel that the composite industry is
poised for spectacular growth in the coming decades. To the majority of
engineers, however, composite materials are viewed as uncharted waters: a
vast expanse of technology sure to yield improved performance-but where
does one begin? . . .”
(Gall 1987, p. 5)
This chapter, along with outlining the objectives and justification of the project,
provides a basic overview of the conceptual design of fibre composite sandwich roofing
panels and more importantly, an insight into what future developments in fibre
composite technology could lead to.
1.1. Topic
‘Numerical modelling and testing of fibre composite sandwich panels for residential
and commercial roofing applications’
1.2. Background
The market for modular housing and infrastructure is growing remarkably quickly.
Fibre cement panels with corrugated steel shells have been on the forefront of the quick
build industry. Products that incorporate these materials have the advantages of a high
strength to weight ratio, great durability and fire resistance however they rate poorly in
thermal resistance and sound transmission. Fibreglass sandwich panels share similar
properties to that of fibre cement panels. The proposed fibre composite sandwich panels
for this project were constructed from two main components, a fibreglass skin (E glass
and resin) and a rigid polyurethane foam core.
2
1.3. Aim and objectives
The primary objective of this research project was to investigate the viability of using
fibre composite sandwich panels for roofing applications. To do this, a thorough
understanding of how the core thickness of a panel will affect the strength and thermal
insulation of the structure must be obtained. The research objectives of this project have
been listed below:
Research the background information relating to fibre composite sandwich
panels used in the construction industry.
Determine the typical loading cases that a roofing panel would be exposed to by
the use of Australian Standards.
Determine the thermal insulation property required from a sandwich panel in a
roofing application.
Design and test fibre composite sandwich beams (fibreglass skins with low
density PU cores of varying thickness).
Analyse the strength, serviceability and thermal insulation properties of the
beams obtained from the testing to generate a final design.
Conduct a FEA on the proposed final panel design.
Conduct a cost analysis of producing the panels in comparison to traditional
roofing techniques.
The findings of this research project will aid BAC Technologies in developing a fibre
composite modular roof design.
1.4. Justification of project
Increasing costs of labour and the demand for energy efficient, long lasting buildings
are the driving factors for conducting this research. With global warming becoming a
major issue amongst today’s society, there has been an increasing demand for
infrastructure with superior energy efficiency. The thermal insulation provided in the
roofing of such structures is vital to reducing the energy consumption. Along with the
tremendous insulation properties of fibre composite sandwich panels they also offer an
outstanding lifespan.
3
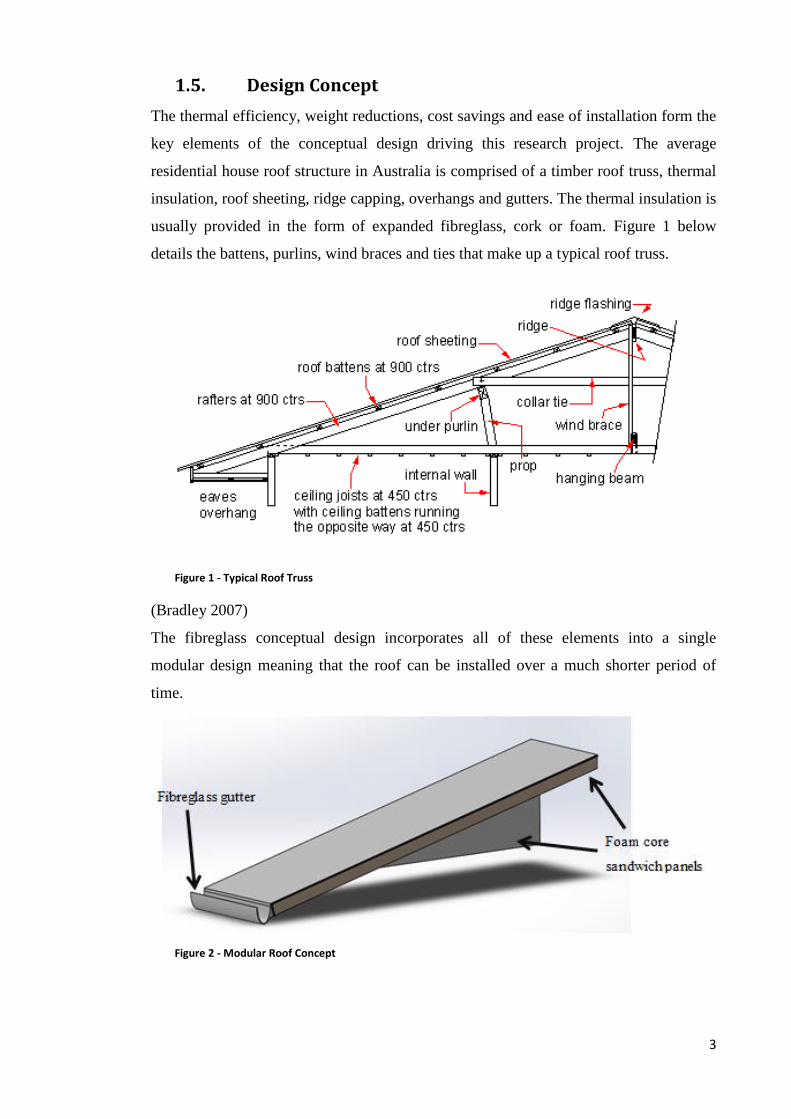
1.5. Design Concept
The thermal efficiency, weight reductions, cost savings and ease of installation form the
key elements of the conceptual design driving this research project. The average
residential house roof structure in Australia is comprised of a timber roof truss, thermal
insulation, roof sheeting, ridge capping, overhangs and gutters. The thermal insulation is
usually provided in the form of expanded fibreglass, cork or foam. Figure 1 below
details the battens, purlins, wind braces and ties that make up a typical roof truss.
Figure 1 - Typical Roof Truss
(Bradley 2007)
The fibreglass conceptual design incorporates all of these elements into a single
modular design meaning that the roof can be installed over a much shorter period of
time.
Figure 2 - Modular Roof Concept
4
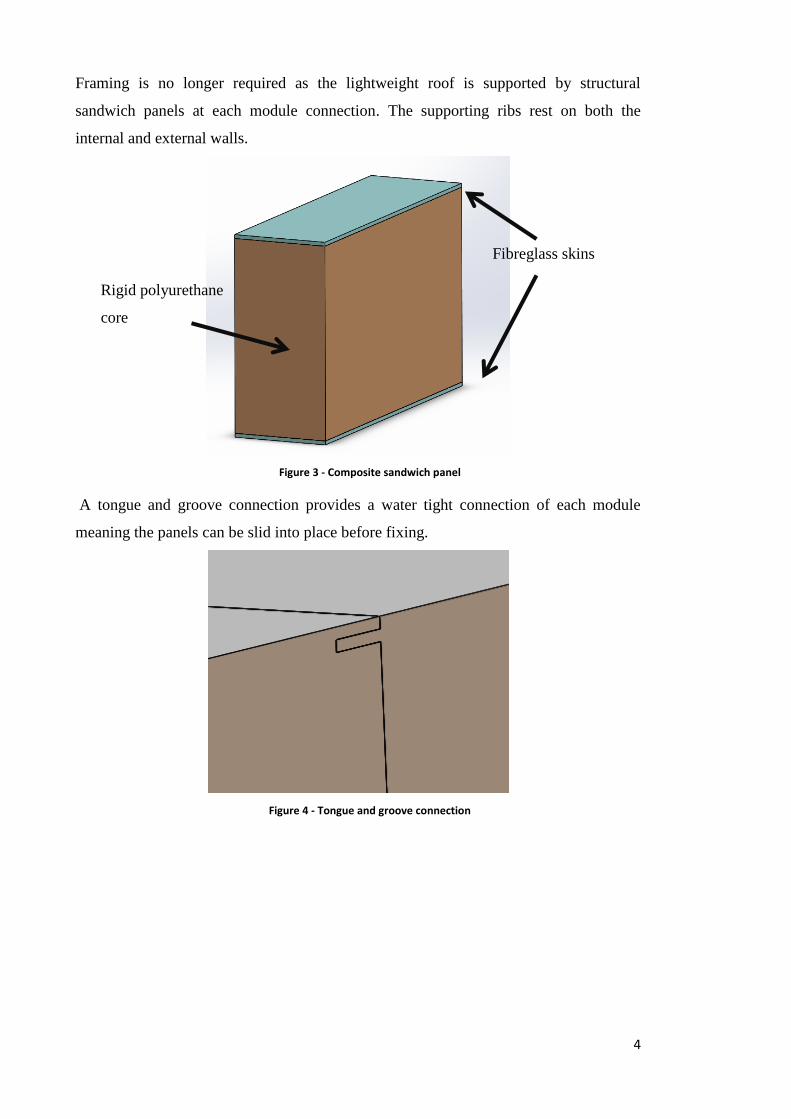
Framing is no longer required as the lightweight roof is supported by structural
sandwich panels at each module connection. The supporting ribs rest on both the
internal and external walls.
Figure 3 - Composite sandwich panel
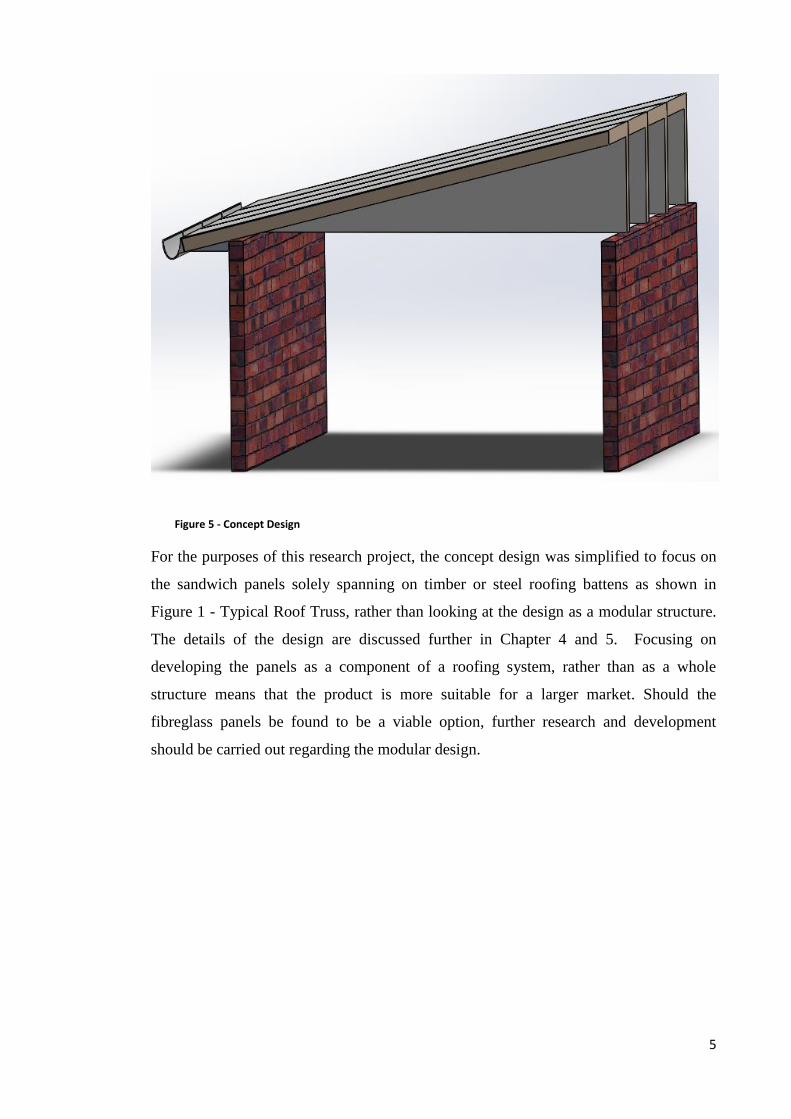
A tongue and groove connection provides a water tight connection of each module
meaning the panels can be slid into place before fixing.
Figure 4 - Tongue and groove connection
Rigid polyurethane
core
Fibreglass skins
5
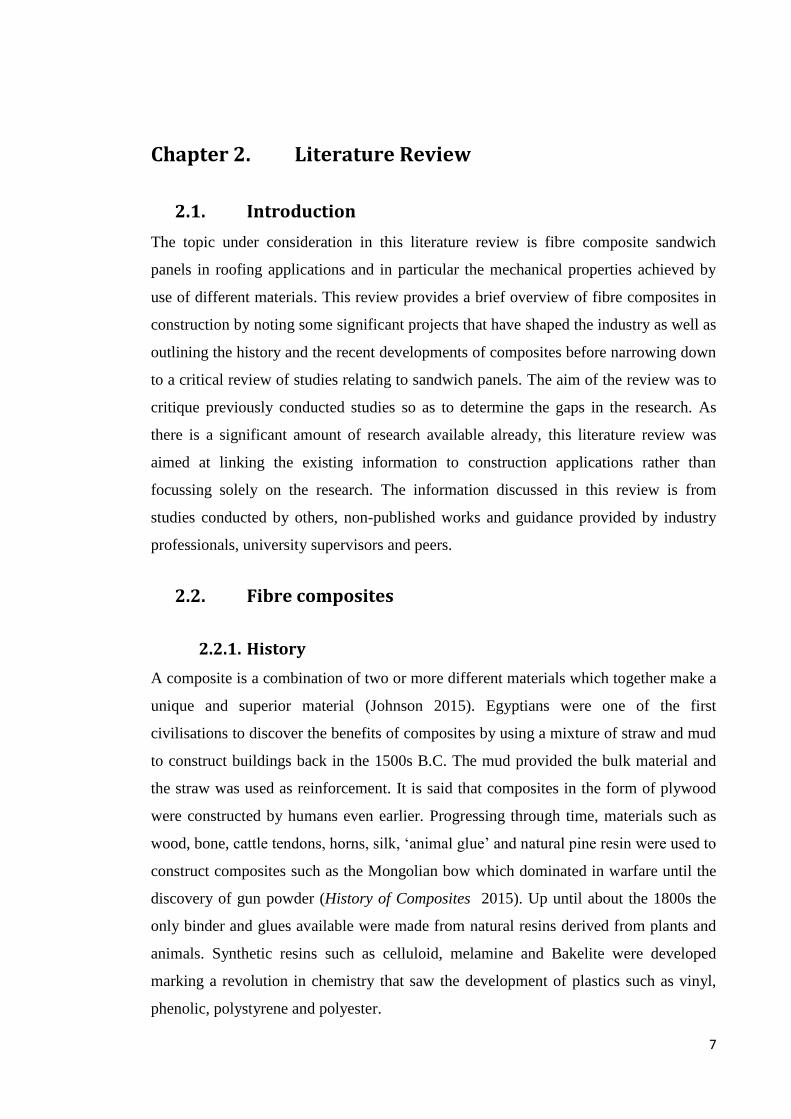
Figure 5 - Concept Design
For the purposes of this research project, the concept design was simplified to focus on
the sandwich panels solely spanning on timber or steel roofing battens as shown in
Figure 1 - Typical Roof Truss, rather than looking at the design as a modular structure.
The details of the design are discussed further in Chapter 4 and 5. Focusing on
developing the panels as a component of a roofing system, rather than as a whole
structure means that the product is more suitable for a larger market. Should the
fibreglass panels be found to be a viable option, further research and development
should be carried out regarding the modular design.

7
Chapter 2. Literature Review
2.1. Introduction
The topic under consideration in this literature review is fibre composite sandwich
panels in roofing applications and in particular the mechanical properties achieved by
use of different materials. This review provides a brief overview of fibre composites in
construction by noting some significant projects that have shaped the industry as well as
outlining the history and the recent developments of composites before narrowing down
to a critical review of studies relating to sandwich panels. The aim of the review was to
critique previously conducted studies so as to determine the gaps in the research. As
there is a significant amount of research available already, this literature review was
aimed at linking the existing information to construction applications rather than
focussing solely on the research. The information discussed in this review is from
studies conducted by others, non-published works and guidance provided by industry
professionals, university supervisors and peers.
2.2. Fibre composites
2.2.1. History
A composite is a combination of two or more different materials which together make a
unique and superior material (Johnson 2015). Egyptians were one of the first
civilisations to discover the benefits of composites by using a mixture of straw and mud
to construct buildings back in the 1500s B.C. The mud provided the bulk material and
the straw was used as reinforcement. It is said that composites in the form of plywood
were constructed by humans even earlier. Progressing through time, materials such as
wood, bone, cattle tendons, horns, silk, ‘animal glue’ and natural pine resin were used to
construct composites such as the Mongolian bow which dominated in warfare until the
discovery of gun powder (History of Composites 2015). Up until about the 1800s the
only binder and glues available were made from natural resins derived from plants and
animals. Synthetic resins such as celluloid, melamine and Bakelite were developed
marking a revolution in chemistry that saw the development of plastics such as vinyl,
phenolic, polystyrene and polyester.
8
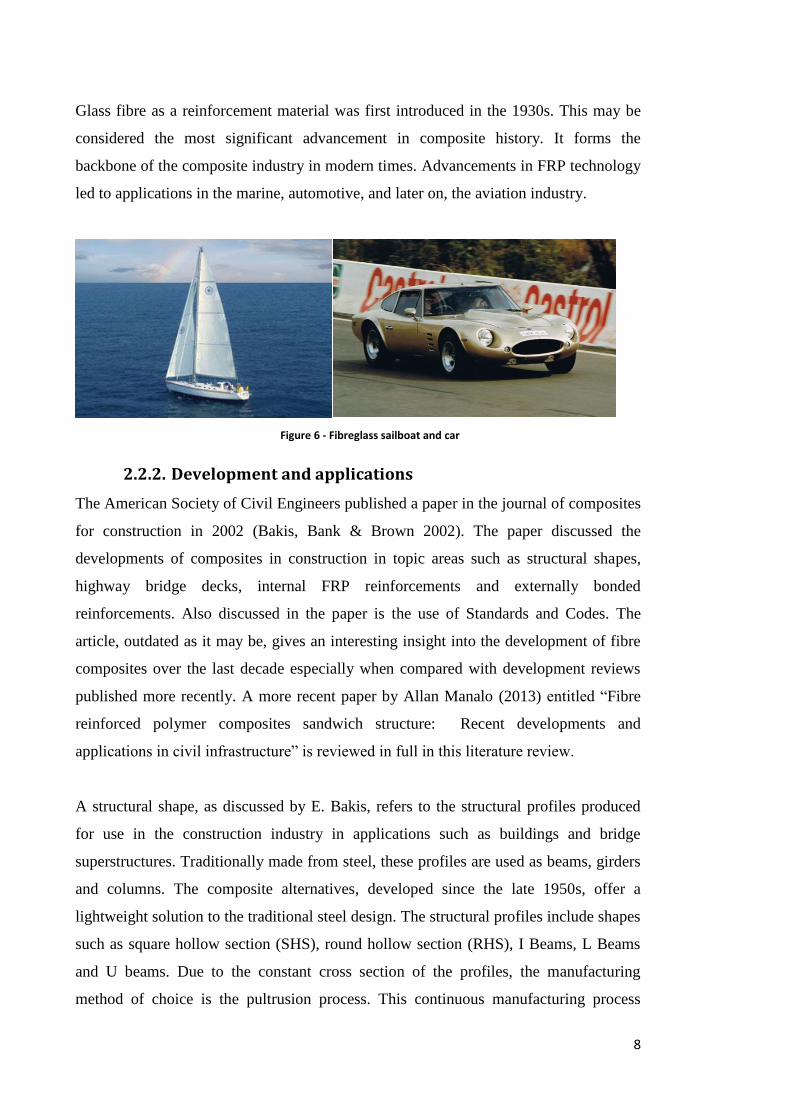
Glass fibre as a reinforcement material was first introduced in the 1930s. This may be
considered the most significant advancement in composite history. It forms the
backbone of the composite industry in modern times. Advancements in FRP technology
led to applications in the marine, automotive, and later on, the aviation industry.
Figure 6 - Fibreglass sailboat and car
2.2.2. Development and applications
The American Society of Civil Engineers published a paper in the journal of composites
for construction in 2002 (Bakis, Bank & Brown 2002). The paper discussed the
developments of composites in construction in topic areas such as structural shapes,
highway bridge decks, internal FRP reinforcements and externally bonded
reinforcements. Also discussed in the paper is the use of Standards and Codes. The
article, outdated as it may be, gives an interesting insight into the development of fibre
composites over the last decade especially when compared with development reviews
published more recently. A more recent paper by Allan Manalo (2013) entitled “Fibre
reinforced polymer composites sandwich structure: Recent developments and
applications in civil infrastructure” is reviewed in full in this literature review.
A structural shape, as discussed by E. Bakis, refers to the structural profiles produced
for use in the construction industry in applications such as buildings and bridge
superstructures. Traditionally made from steel, these profiles are used as beams, girders
and columns. The composite alternatives, developed since the late 1950s, offer a
lightweight solution to the traditional steel design. The structural profiles include shapes
such as square hollow section (SHS), round hollow section (RHS), I Beams, L Beams
and U beams. Due to the constant cross section of the profiles, the manufacturing
method of choice is the pultrusion process. This continuous manufacturing process
9
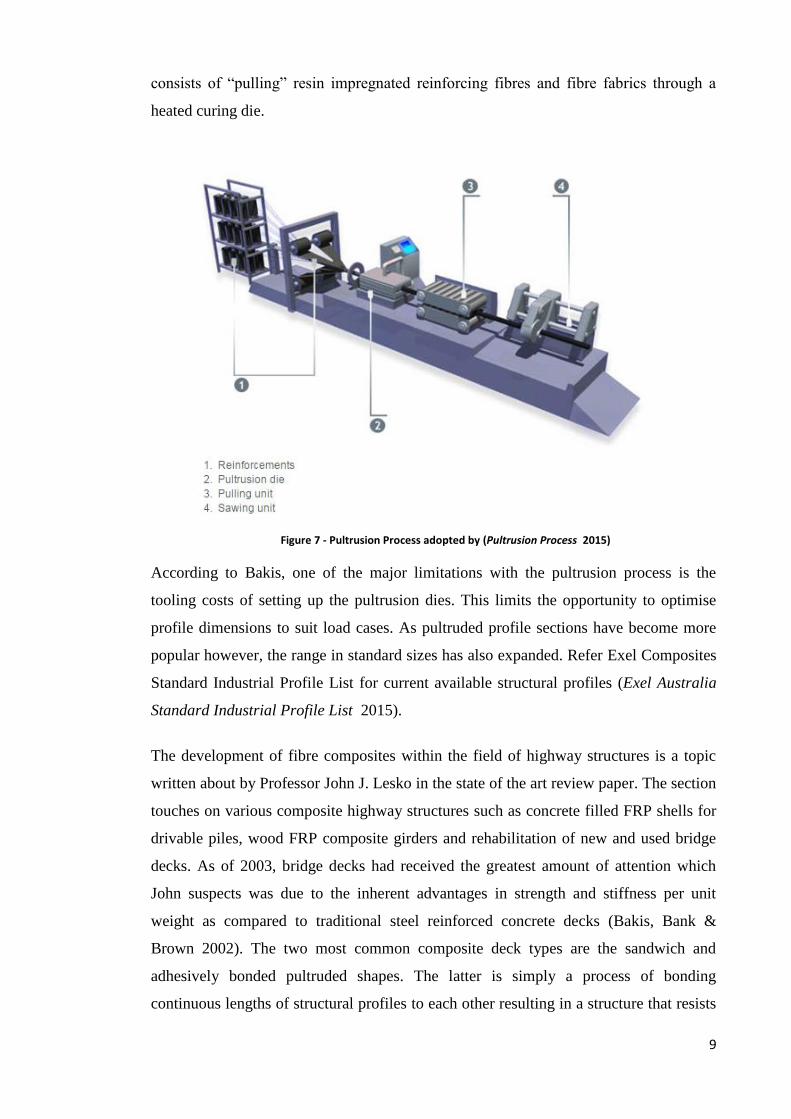
consists of “pulling” resin impregnated reinforcing fibres and fibre fabrics through a
heated curing die.
Figure 7 - Pultrusion Process adopted by (Pultrusion Process 2015)
According to Bakis, one of the major limitations with the pultrusion process is the
tooling costs of setting up the pultrusion dies. This limits the opportunity to optimise
profile dimensions to suit load cases. As pultruded profile sections have become more
popular however, the range in standard sizes has also expanded. Refer Exel Composites
Standard Industrial Profile List for current available structural profiles (Exel Australia
Standard Industrial Profile List 2015).
The development of fibre composites within the field of highway structures is a topic
written about by Professor John J. Lesko in the state of the art review paper. The section
touches on various composite highway structures such as concrete filled FRP shells for
drivable piles, wood FRP composite girders and rehabilitation of new and used bridge
decks. As of 2003, bridge decks had received the greatest amount of attention which
John suspects was due to the inherent advantages in strength and stiffness per unit
weight as compared to traditional steel reinforced concrete decks (Bakis, Bank &
Brown 2002). The two most common composite deck types are the sandwich and
adhesively bonded pultruded shapes. The latter is simply a process of bonding
continuous lengths of structural profiles to each other resulting in a structure that resists
10
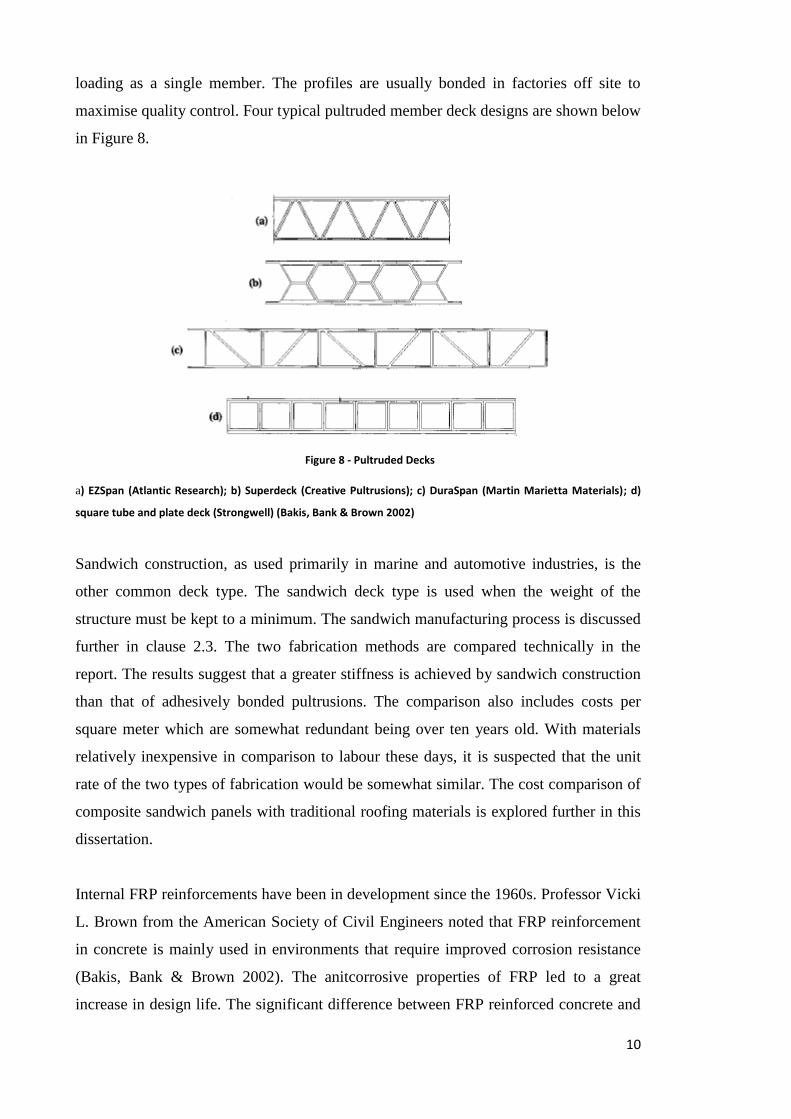
loading as a single member. The profiles are usually bonded in factories off site to
maximise quality control. Four typical pultruded member deck designs are shown below
in Figure 8.
Figure 8 - Pultruded Decks
a) EZSpan (Atlantic Research); b) Superdeck (Creative Pultrusions); c) DuraSpan (Martin Marietta Materials); d)
square tube and plate deck (Strongwell) (Bakis, Bank & Brown 2002)
Sandwich construction, as used primarily in marine and automotive industries, is the
other common deck type. The sandwich deck type is used when the weight of the
structure must be kept to a minimum. The sandwich manufacturing process is discussed
further in clause 2.3. The two fabrication methods are compared technically in the
report. The results suggest that a greater stiffness is achieved by sandwich construction
than that of adhesively bonded pultrusions. The comparison also includes costs per
square meter which are somewhat redundant being over ten years old. With materials
relatively inexpensive in comparison to labour these days, it is suspected that the unit
rate of the two types of fabrication would be somewhat similar. The cost comparison of
composite sandwich panels with traditional roofing materials is explored further in this
dissertation.
Internal FRP reinforcements have been in development since the 1960s. Professor Vicki
L. Brown from the American Society of Civil Engineers noted that FRP reinforcement
in concrete is mainly used in environments that require improved corrosion resistance
(Bakis, Bank & Brown 2002). The anitcorrosive properties of FRP led to a great
increase in design life. The significant difference between FRP reinforced concrete and
11
traditional steel reinforced concrete is the ductility of the reinforcment which adversaly
effects how the concrete must be designed. Reinforced concrete is usually designed so
that the reinforcement fails before the concrete. This yeilds a safer design as it gives
time for people to evacuate the site. FRP is brittle and therefore FRP reinforced concrete
must be designed differently to steel reinforced concrete. The design of FRP reinforced
concrete is generally governed by the servicability limits.
As design requirements become more stringent we see more and more drive to improve
the strength of existing structures to meet current standards. This drive has seen a
significant focus on the development of externally bonded fibre composite
reinforcements. Professor Thanasis Triantafillou of the University of Patras in Greece,
notes strength, weight, chemical resistance and ease of installation/application as the
key advantages to the composite solutions (Bakis, Bank & Brown 2002). Such
applications include FRP wraps of concrete columns to improve strength and epoxy
bonding materials to portions of beams subject to tension to reduce stress in the
members and overall deflection. Epoxy bonding compoposites to masonary structures
has become common where historical structures are in need of upgrading but cosmetic
appeal is still a governing factor.
‘Fiber-Reinforced Polymer Composites for construction - State-of-the-Art Review’
published by the American Society of Civil Engineers is an informative paper that
accurately portrays the development that was occuring in the FRP industry in 2002.
Although the paper was published in 2002, the information contained in the document is
considered valuable for this research project. The applications of composite technology
discussed have been mainly to do with the construction industries. Composites however
have been used in recreational, automotive, aerospace, marine, medical and electronic
applications. These applications are discussed in further detail with respect to sandwich
panels in section 2.3.4 ‘Applications’.
12
2.3. Composite sandwich panels
2.3.1. Introduction
Sandwich construction as defined by Frederick Plantema (1966) is a “three-layer type of
construction, consisting of two thin sheets of high-strength material between which a
thick layer of low average strength and density is sandwiched”. The two thin sheets of
high strength material are generally referred to as skins or faces. The material used for
skins varies depending on the application of the composite panel. Aluminium,
reinforced plastic, steel and titanium are just some of the materials used for skins. This
project will be focusing on fibreglass skins. The thick layer between the two skins is
called the core which can vary again in material and geometry. The core of the
sandwich panel serves two critical purposes: firstly, the core must be stiff enough in the
direction perpendicular to the skins to ensure that they remain the same distance apart;
and secondly, the core must also resist shearing of the skins. The core must therefore
possess a certain shearing rigidity in planes perpendicular to the skins. If sliding occurs
the skins will act simply as two independent members and the sandwich effect will be
lost. I beams in bending work on the same concept as sandwich panels. The resistance
to bending is provided by the flanges. The greater the distance from the flanges to the
centroid, the greater the resistance to bending provided the web has sufficient shear
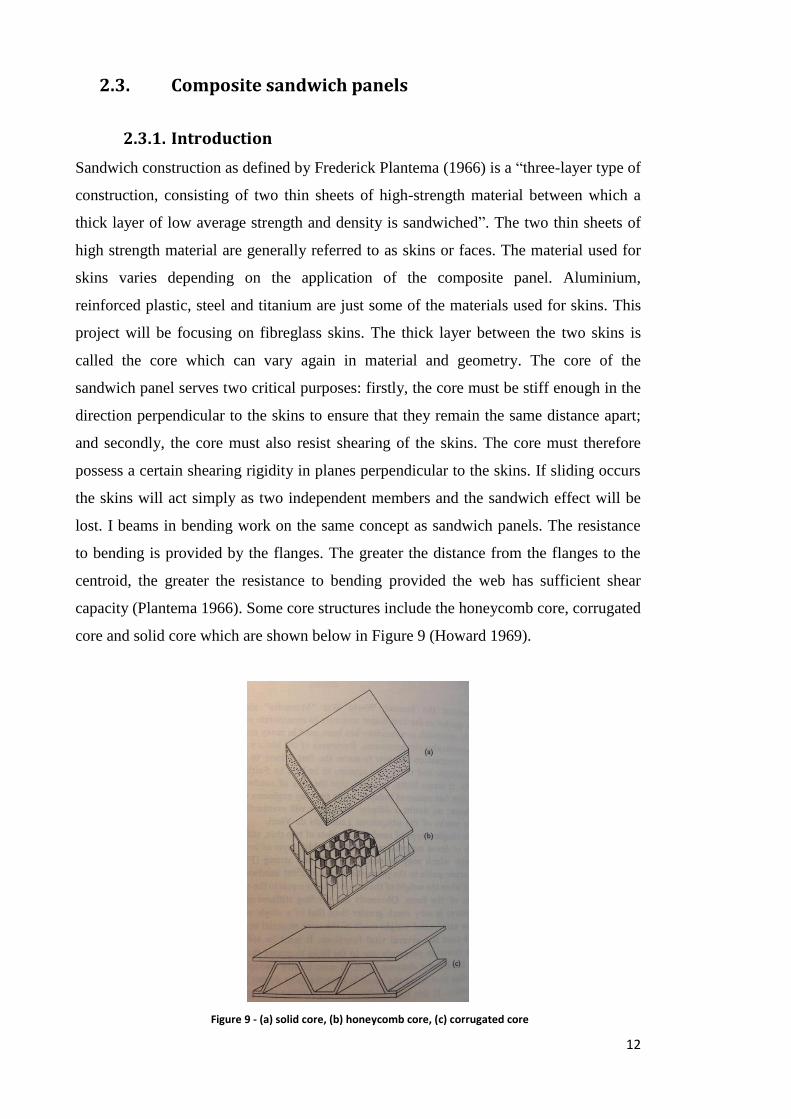
capacity (Plantema 1966). Some core structures include the honeycomb core, corrugated
core and solid core which are shown below in Figure 9 (Howard 1969).
Figure 9 - (a) solid core, (b) honeycomb core, (c) corrugated core
13
Solid Cores made of materials such as balsa wood, perforated chipboard, expanded
plastic, foam and clay products are the most common type of core used in the building
industry. They offer a lightweight solution however the final product is much cheaper
than honeycomb or corrugated core panels. Solid cores are ideal in situations where the
member is carrying a relatively small load over a large span. Solid cores also have the
advantage of thermal insulation which is very important when used in housing
applications. Foam cores when compared with honeycomb and corrugated cores may be
considered solid when in fact the nature of low density foam is such that there are air
voids throughout. Foam cores were of focus for this project as it is these voids that
contribute to the superior thermal insulation. Honeycomb core sandwich panels are
predominantly used in the aerospace and aviation industries as they are the most
efficient of the sandwich designs with respect to weight and mechanical performance.
The production of honeycomb sandwich panels is labour intensive and relatively
expensive. This limits its use in other industries where weight is not as crucial such as
the civil infrastructure industry. Corrugated Core sandwich panels are similar to
honeycomb core in the fact that they are both labour intensive constructions. The
corrugated core is again a lighter solution than the solid core type. The geometric shape
of the corrugations varies significantly in design however the most common shape is
that shown in Figure 9.
2.3.2. Fabrication
There are two general types of fiberglass fabrication; open moulded which includes both
hand layup and spray layup (chopping) and closed moulded which includes fabrication
methods such as vacuum infusion, pultrusion, compression moulding and continuous
lamination. The traditional hand layup fabrication technique has been in most cases
superseded by the closed moulded methods however for the large flat laminates that
make up the skins of the sandwich panel, hand layup is usually the method of choice
(Composites Australia 2015).
2.3.3. Development
Allan Manalo from the Centre of Excellence in Engineered Fibre Composites (CEEFC)
at the University of Southern Queensland (USQ) produced a report discussing the recent
developments of fibre reinforced polymer composite sandwich structures and their
applications to civil infrastructure. The report reviews how such composite sandwich
structures are currently used in the civil construction industry and details a number of
14
barriers that are limiting the growth and development of the material (Manalo 2013).
Manalo says that the poor understanding of the overall behaviour of composite
sandwich structures combined with the lack of appropriate design codes and standards
is the reason there is such a disadvantage evident when composites are compared with
traditional construction materials. Although research and development into the use of
fibre composites in civil infrastructure has continued, the lack of application of these
products suggests that the potential for this type of construction has not yet been fully
explored.
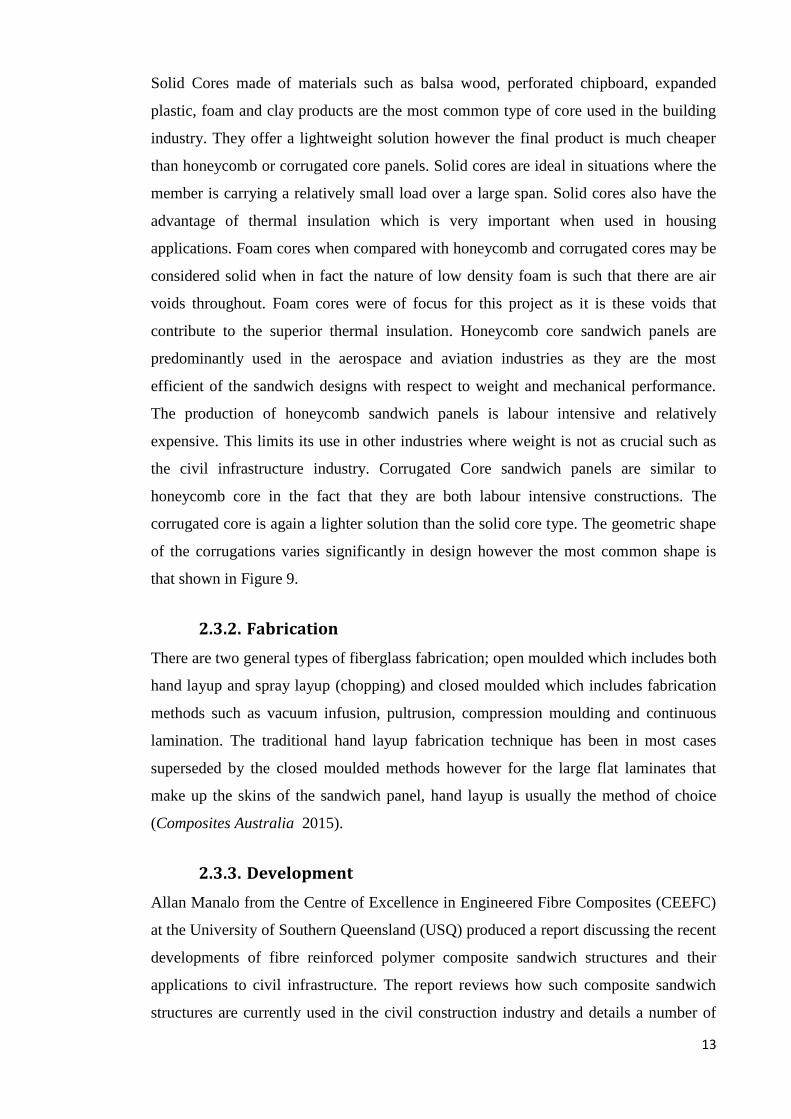
Manalo notes that research into improving the performance of core materials in
composite sandwich structures has been of significant focus in the past few years.
Efforts to improve the strength of composite sandwich cores have been attempted by
cellular manipulation and reinforcement of the core material. Refer Figure 10 (Manalo
2013). Reinforcement of the core material helps to prevent delamination failure while
cellular manipulation has been proven to improve flexural stiffness and strength.
Figure 10 - Reinforcement of Core
2.3.4. Applications
With the large amount of research and development going into fibre composite
sandwich panels, there has been a significant increase in new and innovative ways of
practically applying the technology to civil engineering. Sandwich panel technology has
been utilised in applications such as housing, bridge decks, pedestrian decks, tanks and
railway sleepers.
Fibre composite sandwich technology has been utilised by companies around the world
for bridge deck and pedestrian walkway constructions. In the local market are
companies such as ‘Wagner’s’ and ‘BAC Technologies’. Fibre composite bridge decks
15
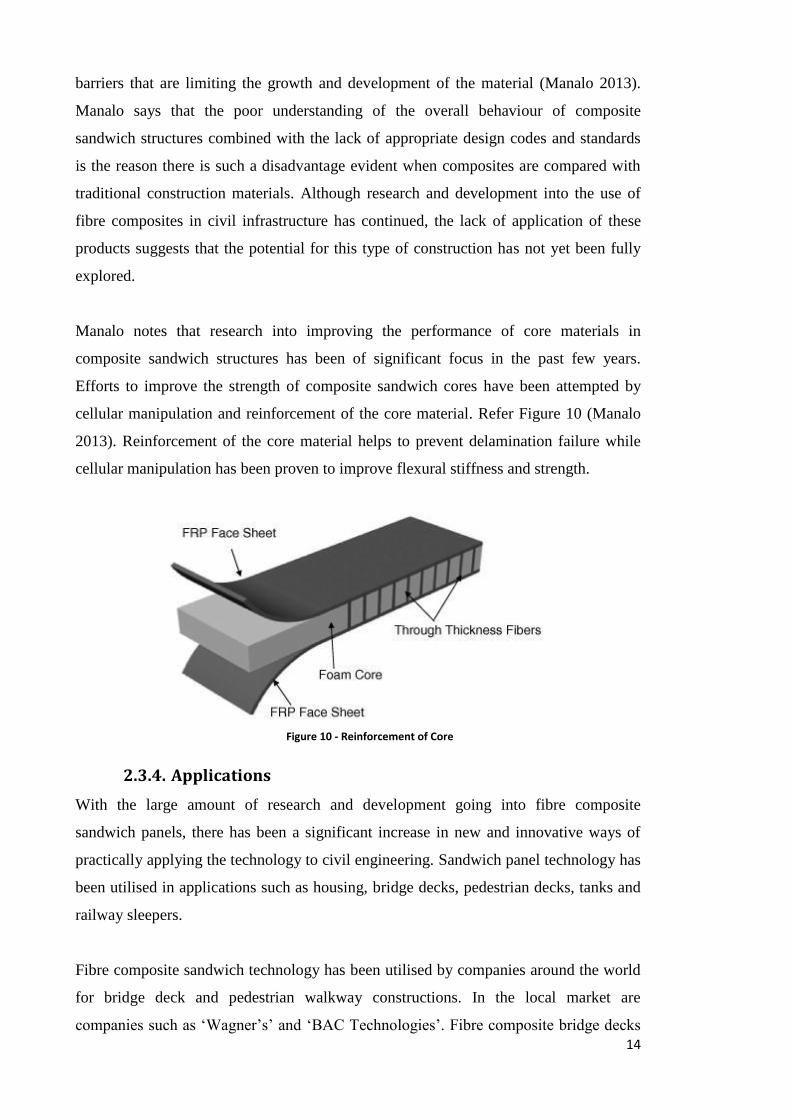
are growing in demand due to the significant long term cost benefits that come with the
minimal maintenance requirements and the prolonged service life of these materials.
Figure 11 shows a fibre composite bridge manufactured by BAC Technologies which
has a service life of approximately 100 years (Modular FRP Pedestrian Bridge 2015).
Figure 11 - BAC FRP Pedestrian Bridge
With composite sandwich technology advancing so well in the marine, aeronautical and
transport industries it is not surprising that the technology is also being used in housing
applications. Similarly to other industries the key advantage of using composite
sandwich panels in housing applications is materials weight. As the panels are much
lighter than traditional construction materials they can be easily transported, handled
and installed reducing construction costs (Manalo 2013). Composite panels lend
themselves to repetitive construction which is why they are so widely used in modular
building designs such as in mining camps, unit blocks and flats.
Maunsell Structural Plastics, a company based in London developed a system
comprising of pultruded FRP composite with a polyethylene foam core for use in walls
and floors of building structures. The Advanced Composite Construction System
(ACCS) as they call it allows for rapid installation on site (L.C. Hollaway 2001). This
system is very similar to the design that will be investigated in this report. Shifting
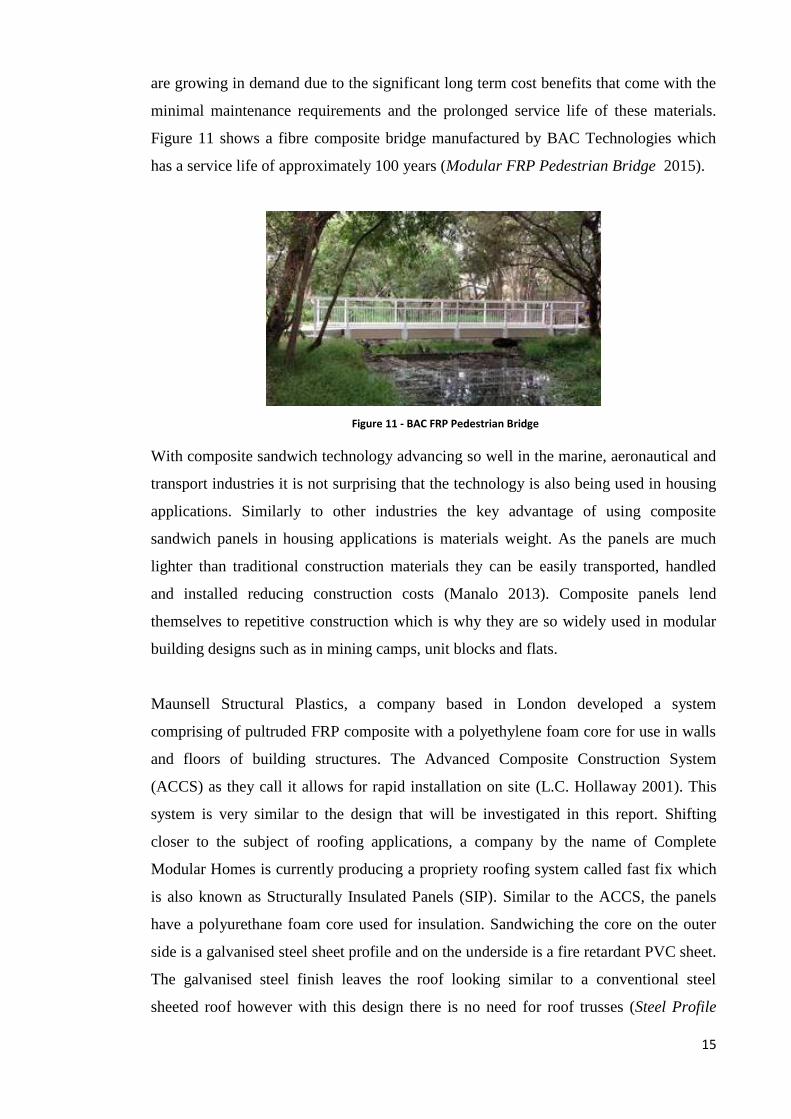
closer to the subject of roofing applications, a company by the name of Complete
Modular Homes is currently producing a propriety roofing system called fast fix which
is also known as Structurally Insulated Panels (SIP). Similar to the ACCS, the panels
have a polyurethane foam core used for insulation. Sandwiching the core on the outer
side is a galvanised steel sheet profile and on the underside is a fire retardant PVC sheet.
The galvanised steel finish leaves the roof looking similar to a conventional steel
sheeted roof however with this design there is no need for roof trusses (Steel Profile
16
Insulated Roofing Panel 2015). A company by the name of Bondor also produce a
similar roofing system with a polyurethane core (Bondor Insulated Roofing Panels
2015).
Figure 12 - Complete Modular Homes Granny Flat
2.3.5. Benefits
As discussed in previous sections, fibre composite sandwich panels have several
significant advantages over other more traditional construction materials such as timber,
reinforced concrete and steel. The most well-known benefit of fibre composite sandwich
panels would be the superior strength to weight ratio they offer. The panels also have
the advantage of being flexible in design, fire resistant, corrosion resistant and have a
low thermal conductivity (DIAB Group 2015). The strength and thermal conductivity
will be discussed in detail in sections 2.4 ‘Flexural strength and deflection of sandwich
panels’ and 2.5 ‘Thermal insulation of sandwich panels’ respectively. Fibreglass can be
shaped and modified up to the last stage of manufacturing. This allows for countless
adjustments and or changes to designs. Fibreglass is also a versatile material in that it
can be easily repaired or ‘built on to’ by the same process used in manufacturing
resulting in a seamless finish. It is these traits that make fibre composite sandwich
panels so flexible in design. The fire resistance of the composite panels is attributed to
the fibreglass skins that somewhat shield the light weight core. It is therefore important
to look at the fire resistance of the two materials separately. The fire resistance of
sandwich panels is covered in more detail in section 2.6 ‘Fire resistance’. The superior
corrosion resistance of fibreglass is a trait commonly known. Fibreglass boat hulls have
stood the test of time being exposed to the harshest of environments for lifespans in
excess of 100 years. With this in mind it was predictable that fibreglass solutions would
become more common in the field of civil infrastructure.
17
2.4. Flexural strength and deflection of sandwich panels
2.4.1. Strength of composites
Composite materials constructed with fibre reinforcement embedded in a matrix are
orthotropic in that the mechanical properties in the x, y and z directions vary. Therefore
to characterise the strength of the material, three strength parameters must be
determined. The compressive and tensile strength, (parallel and perpendicular to the
fibres) and the shear strength (measured parallel to the fibres) must be determined. The
longitudinal tensile strength is governed by the tensile strength of the fibres whereas the
compressive strength is determined largely by the stability of the fibres. If the
reinforcement is unidirectional, the transverse and shear strengths are limited by the
strength properties of the matrix (Concise encyclopedia of composite materials 1989).
In practical situations such as the roofing panels, the reinforcement is usually biaxial so
as to provide bending resistance both laterally and longitudinally. Basic models can be
used to estimate the strength properties of composites with reinforcement provided in
multiple directions however a significant error is present due to the presence of
hydrothermal strains, development of non-catastrophic damage and material
nonlinearity. Generally, manufacturers will conduct testing resulting in accurate
mechanical properties for design.
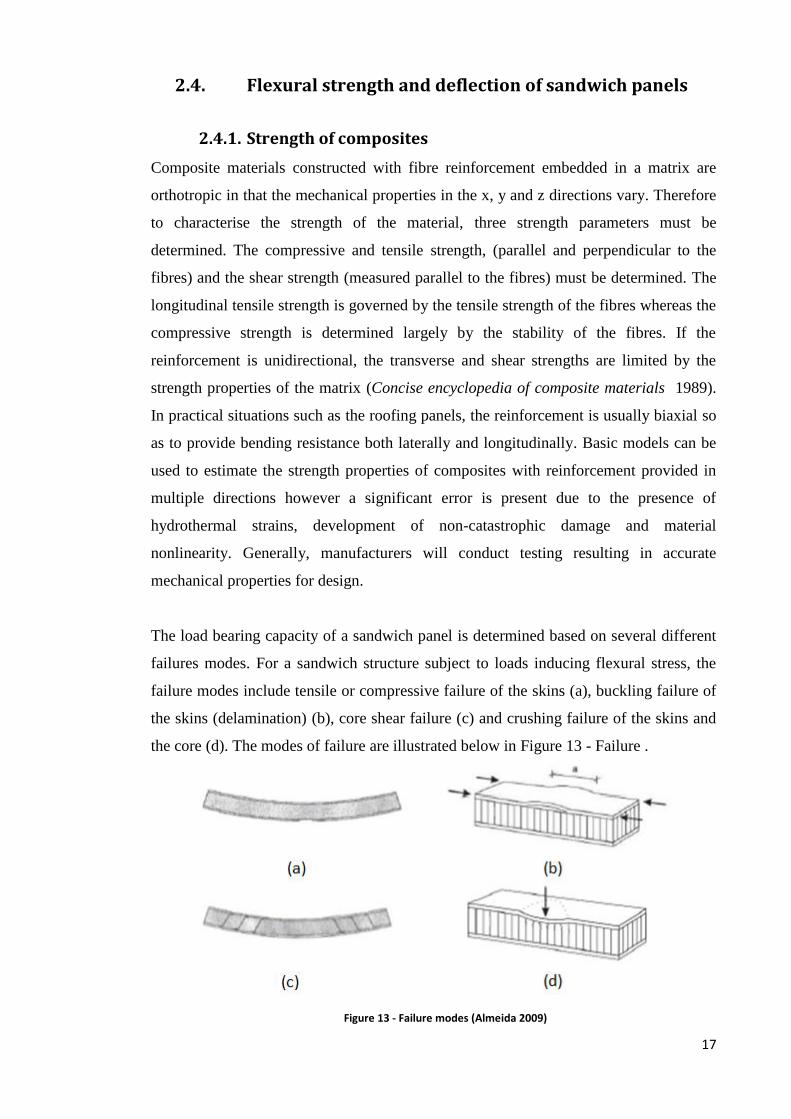
The load bearing capacity of a sandwich panel is determined based on several different
failures modes. For a sandwich structure subject to loads inducing flexural stress, the
failure modes include tensile or compressive failure of the skins (a), buckling failure of
the skins (delamination) (b), core shear failure (c) and crushing failure of the skins and
the core (d). The modes of failure are illustrated below in Figure 13 - Failure .
Figure 13 - Failure modes (Almeida 2009)
18
2.4.2. Volume Fraction
The volume fraction of the glass and resin are important properties used to calculate the
strength and stiffness of a laminate. Generally provided by the supplier are the weight
per square metre and density of the materials. Equation (1) describes the conversion
from weight fraction to volume fraction (Design Data 1994).
𝑉1 =
𝑊1
𝛥1
𝑊1
𝛥1+
𝑊2
𝛥2+
𝑊3
𝛥3
(1)
Where:
𝑉 = volume fraction of the constituent
𝑊 = weight fraction of the constituent
𝛥 = density of the constituent
2.4.3. Rule of mixtures
As the composite skin of a sandwich panel is made up of fibres embedded within a
matrix, the mechanical properties of the composite must be determined from the
properties of both the fibre and the matrix. The rule of mixtures is used to determine
mechanical properties such us the modulus of elasticity, ultimate tensile and
compressive stress and density. The equations for modulus of elasticity and ultimate
stress and are presented below.
Assuming that the composite will only be subject to elastic deformation, the modulus
can be calculated using the following equation.
Modulus of Elasticity
𝐸𝑐 = 𝐸𝑓𝑉𝑓 + 𝐸𝑚𝑉𝑚 (2)
Where:
𝐸𝑚 = modulus of elasticity of the composite
𝐸𝑓 = modulus of elasticity of the fibre
𝑉𝑓 = volume fraction of the fibre
𝐸𝑚 = modulus of elasticity of the matrix
𝑉𝑓 = volume fraction of the matrix
(John W. Weeton 1987)
19
The tensile and compressive strength equation is of the same form.
𝜎𝑐∗ = 𝜎𝑓
∗𝑉𝑓 + 𝜎𝑚∗ 𝑉𝑚 (3)
Where:
𝜎𝑐∗ = stress carried by the composite at a particular strain
𝜎𝑓∗ = stress carried by the fibre at a particular strain
𝑉𝑓 = volume fraction of the fibre
𝜎𝑚∗ = stress carried by the matrix at a particular strain
𝜎𝑚 = ultimate tensile strength of the matrix
𝑉𝑓 = volume fraction of the matrix
(John W. Weeton 1987)
Equation (3) is true provided that the fibre fraction is great enough so as to begin
strengthening the matrix. The critical fibre content may be calculated with equation (4).
𝑉𝑐𝑟𝑖𝑡 =
𝜎𝑚 − 𝜎𝑚∗
𝜎𝑓 − 𝜎𝑚∗
(4)
For composites made up of E glass and either polyester, vinyl ester or epoxy resin, the
critical fibre content required is generally very low due to the glass having a
significantly higher modulus of elasticity then the resin. Although in most cases the
critical fibre content will be quite low, it is still important and must be checked for
design.
When a composite is subjected to a tensile load, the strain ε in the fibres will be equal to
the strain in the matrix provided that the fibres share a perfect bond with the matrix.
Thus the axial stresses in the fibres and matrix can be approximated simply by equation
(5) and (6).
𝜎𝑓 = 𝐸𝑓𝜖 (5)
𝜎𝑚 = 𝐸𝑚𝜖 (6)
(Foster 1998)
As the two materials will undergo identical strain when subject to an axial load, it is
assured that one of the materials will reach its ultimate strength prior to the other. In this
case, the resin matrix will have a much lower ultimate strength than the glass fibres and
therefore will fail first. Assuming an idealised stress-strain curve shown in Figure 14,
the ultimate stress of the composite may be calculated as the maximum of the working
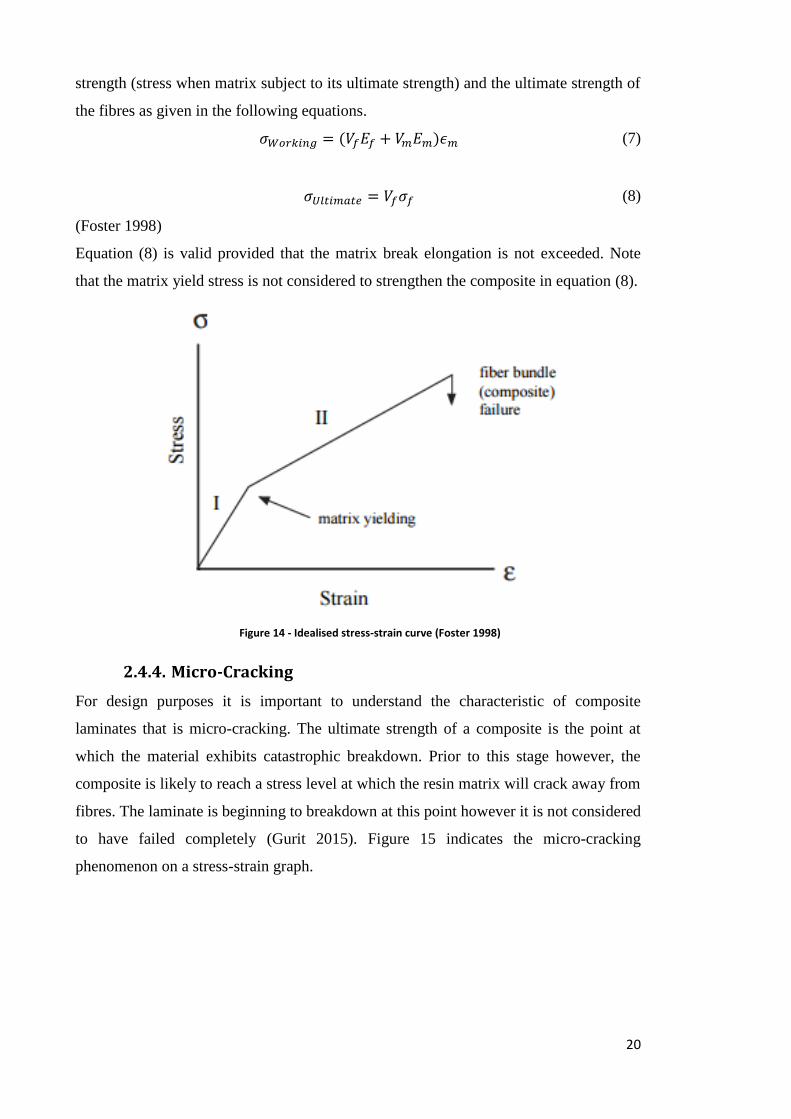
20
strength (stress when matrix subject to its ultimate strength) and the ultimate strength of
the fibres as given in the following equations.
𝜎𝑊𝑜𝑟𝑘𝑖𝑛𝑔 = (𝑉𝑓𝐸𝑓 + 𝑉𝑚𝐸𝑚)𝜖𝑚 (7)
𝜎𝑈𝑙𝑡𝑖𝑚𝑎𝑡𝑒 = 𝑉𝑓𝜎𝑓 (8)
(Foster 1998)
Equation (8) is valid provided that the matrix break elongation is not exceeded. Note
that the matrix yield stress is not considered to strengthen the composite in equation (8).
Figure 14 - Idealised stress-strain curve (Foster 1998)
2.4.4. Micro-Cracking
For design purposes it is important to understand the characteristic of composite
laminates that is micro-cracking. The ultimate strength of a composite is the point at
which the material exhibits catastrophic breakdown. Prior to this stage however, the
composite is likely to reach a stress level at which the resin matrix will crack away from
fibres. The laminate is beginning to breakdown at this point however it is not considered
to have failed completely (Gurit 2015). Figure 15 indicates the micro-cracking
phenomenon on a stress-strain graph.
21
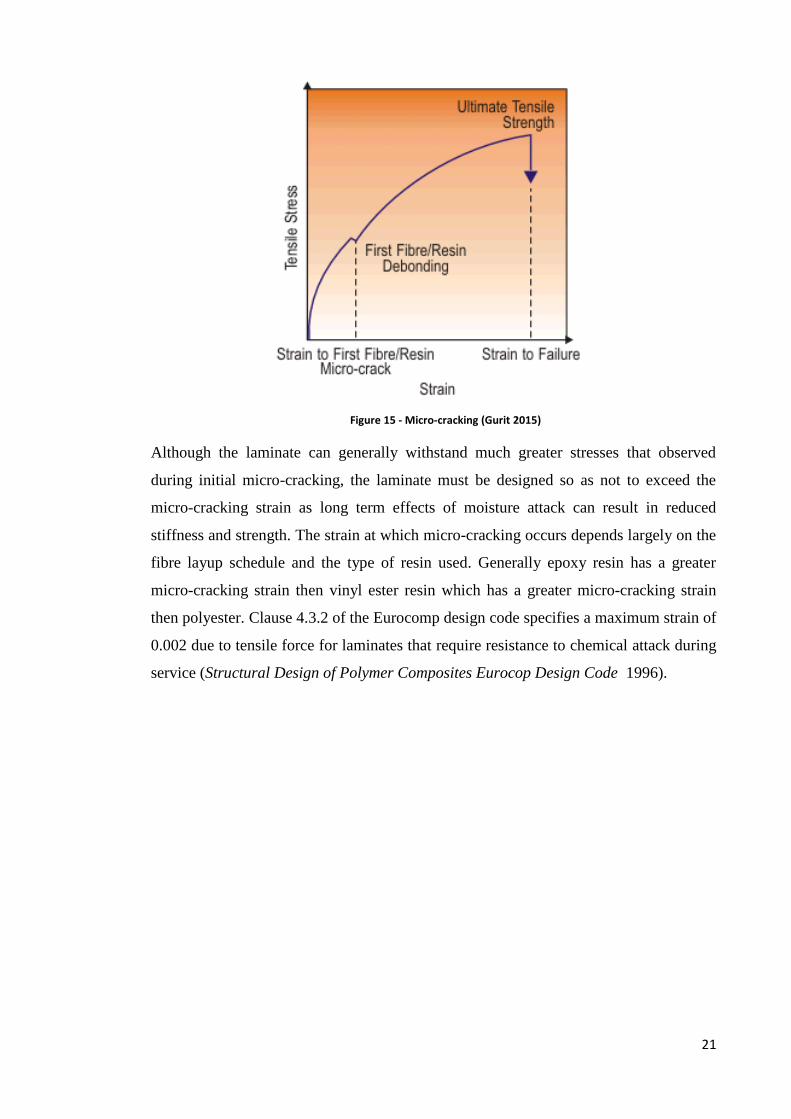
Figure 15 - Micro-cracking (Gurit 2015)
Although the laminate can generally withstand much greater stresses that observed
during initial micro-cracking, the laminate must be designed so as not to exceed the
micro-cracking strain as long term effects of moisture attack can result in reduced
stiffness and strength. The strain at which micro-cracking occurs depends largely on the
fibre layup schedule and the type of resin used. Generally epoxy resin has a greater
micro-cracking strain then vinyl ester resin which has a greater micro-cracking strain
then polyester. Clause 4.3.2 of the Eurocomp design code specifies a maximum strain of
0.002 due to tensile force for laminates that require resistance to chemical attack during
service (Structural Design of Polymer Composites Eurocop Design Code 1996).
22
2.4.5. Flexural rigidity
Fundamentally, a sandwich structure should be designed to ensure that it has sufficient
shear strength and flexural rigidity to prevent failures when subject to applied loads
(Gryzagoridis, Oliver & Findeis 2015). The flexural rigidity of the composite beam is
equal to the sum of the flexural rigidities of the faces and the core, measured about the
centroidal axis of the entire cross section.
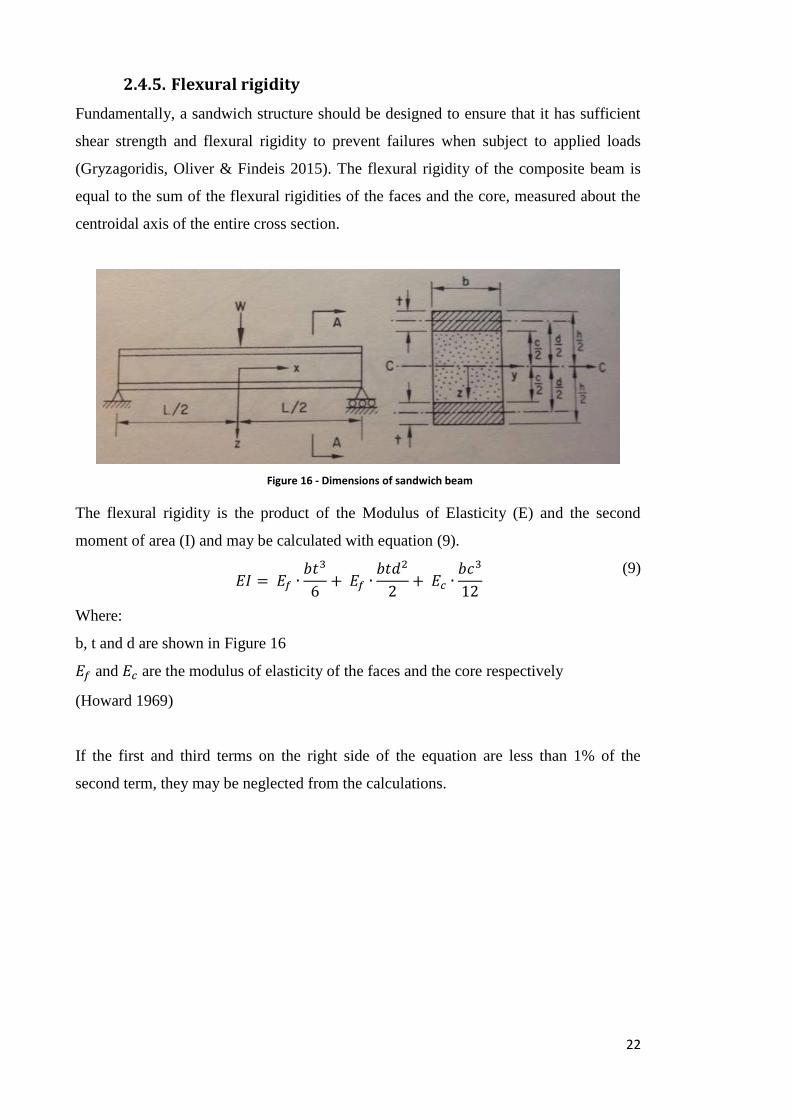
Figure 16 - Dimensions of sandwich beam
The flexural rigidity is the product of the Modulus of Elasticity (E) and the second
moment of area (I) and may be calculated with equation (9).
𝐸𝐼 = 𝐸𝑓 ∙
𝑏𝑡3
6+ 𝐸𝑓 ∙
𝑏𝑡𝑑2
2+ 𝐸𝑐 ∙
𝑏𝑐3
12
(9)
Where:
b, t and d are shown in Figure 16
𝐸𝑓 and 𝐸𝑐 are the modulus of elasticity of the faces and the core respectively
(Howard 1969)
If the first and third terms on the right side of the equation are less than 1% of the
second term, they may be neglected from the calculations.
23
2.4.6. Bending stress
The bending stresses in the face and core can be calculated using ordinary bending
theory as per equation (10) and (11) respectively.
𝜎𝑓 =
𝑀𝑧
𝐷 𝐸𝑓
(10)
𝜎𝑐 =
𝑀𝑧
𝐷 𝐸𝑐
(11)
Where:
M = resulting bending moment due to loading
z = distance from the centroidal axis
D = EI
(Howard 1969)
As the panels are proposed to span in one direction, they will be analysed as a sandwich
beam rather than a plate. If however a design change occurs leaving the panel supported
on all four sides, therefore bending occurs in both the x and y planes, the stresses in the
panels may then be expressed by the following.
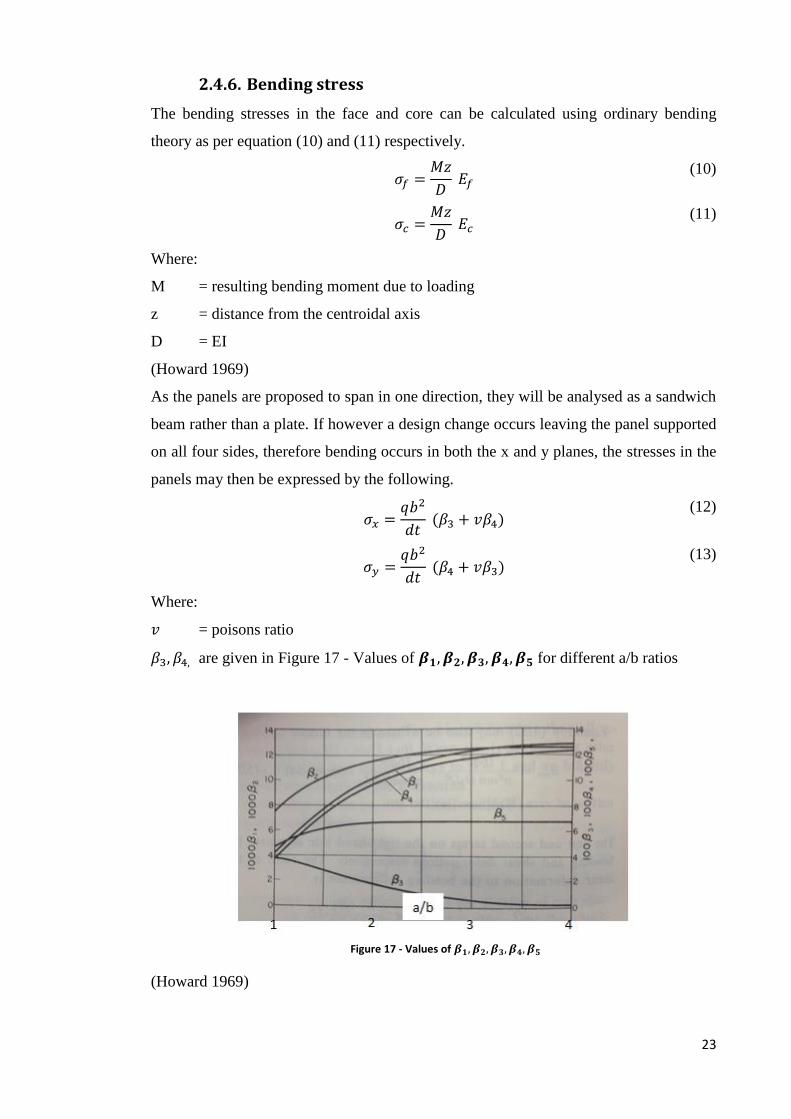
𝜎𝑥 =
𝑞𝑏2
𝑑𝑡 (𝛽3 + 𝑣𝛽4)
(12)
𝜎𝑦 =
𝑞𝑏2
𝑑𝑡 (𝛽4 + 𝑣𝛽3)
(13)
Where:
𝑣 = poisons ratio
𝛽3, 𝛽4, are given in Figure 17 - Values of 𝜷𝟏, 𝜷𝟐, 𝜷𝟑, 𝜷𝟒, 𝜷𝟓 for different a/b ratios
Figure 17 - Values of 𝜷𝟏, 𝜷𝟐, 𝜷𝟑, 𝜷𝟒, 𝜷𝟓
(Howard 1969)
24
2.4.7. Deflection
The mid span deflection of a sandwich beam with a uniformly distributed load is equal
to the central bending deflection (∆1) plus the central shear deflection (∆2 ) as given in
equation (14).
∆ = ∆1 + ∆2 =
𝐾𝑔𝑞𝐿4
𝐷+
𝐾𝑠𝑞𝐿2
𝐴𝐺
(14)
Where:
G = modulus of rigidity of the core material
A = 𝑏𝑑2
𝑐
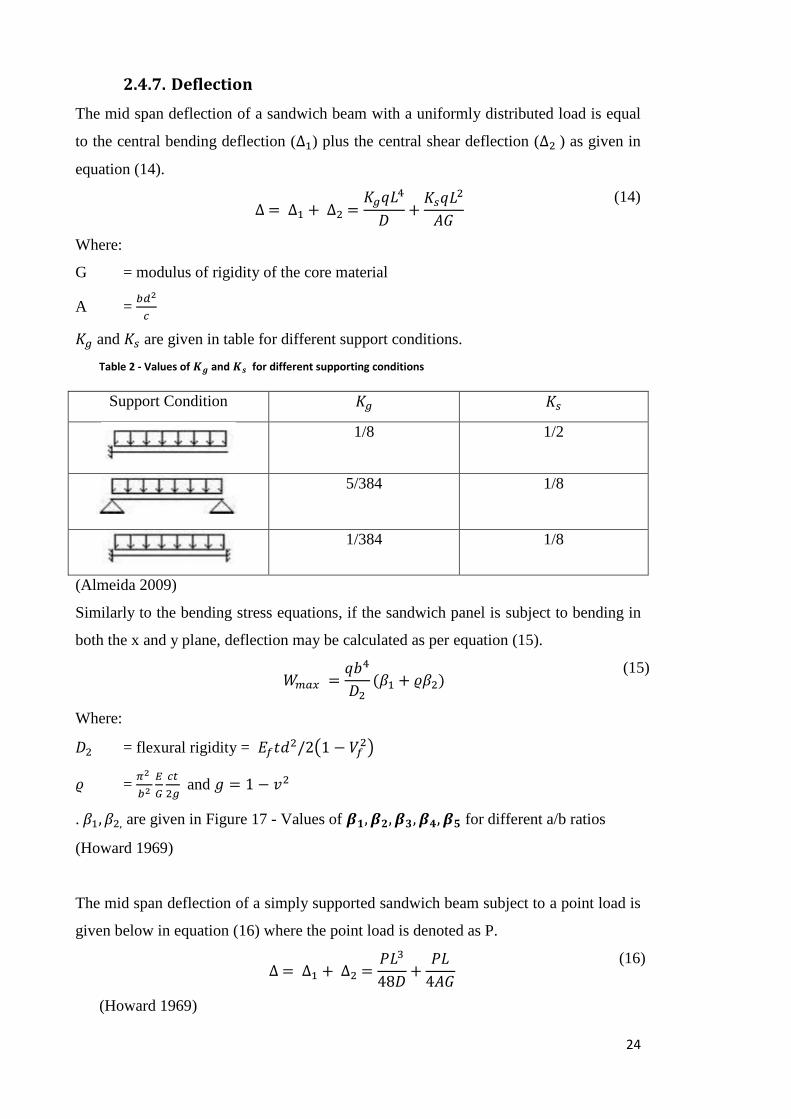
𝐾𝑔 and 𝐾𝑠 are given in table for different support conditions.
Table 2 - Values of 𝑲𝒈 and 𝑲𝒔 for different supporting conditions
Support Condition 𝐾𝑔 𝐾𝑠
1/8 1/2
5/384 1/8
1/384 1/8
(Almeida 2009)
Similarly to the bending stress equations, if the sandwich panel is subject to bending in
both the x and y plane, deflection may be calculated as per equation (15).
𝑊𝑚𝑎𝑥 =
𝑞𝑏4
𝐷2(𝛽1 + 𝜚𝛽2)
(15)
Where:
𝐷2 = flexural rigidity = 𝐸𝑓𝑡𝑑2/2(1 − 𝑉𝑓2)
𝜚 = 𝜋2
𝑏2
𝐸
𝐺
𝑐𝑡
2𝑔 and 𝑔 = 1 − 𝑣2
. 𝛽1, 𝛽2, are given in Figure 17 - Values of 𝜷𝟏, 𝜷𝟐, 𝜷𝟑, 𝜷𝟒, 𝜷𝟓 for different a/b ratios
(Howard 1969)
The mid span deflection of a simply supported sandwich beam subject to a point load is
given below in equation (16) where the point load is denoted as P.
∆ = ∆1 + ∆2 =
𝑃𝐿3
48𝐷+
𝑃𝐿
4𝐴𝐺
(16)
(Howard 1969)
25
2.4.8. Delamination
Sandwich panel facing delamination from the core is perhaps the most difficult failure
mode to predict. Delamination is highly dependent on the skin to core bond and occurs
just below the face of the core. The forces that cause the delamination result from
varying stiffness of the core and the facing. Delamination of the skins from the core can
result in localised skin wrinkling and core shear failure.
2.4.9. Wrinkling
The local buckling phenomenon known as skin wrinkling occurs when the skins
separate from the core and buckle on their own. The wrinkling can occur due to a
weakness in the bond holding the core and the skins together or by buckling instability
of the skins themselves. Buckling instability of the cores occurs when the skins are too
thin or too soft. For practical design purposes, Plantema (1966) recommends the
wrinkling stress be calculated from equation (17).
𝜎𝑤𝑟 = 0.5(𝐺𝑐𝐸𝑐𝑧𝐸𝑓)
13
(17)
Where:
𝐸𝑐𝑧 = modulus of elasticity of the core parallel to the z-axis
2.4.10. Core shear failure
When subject to a transverse shear force, the sandwich beam carries the shear force
mainly by the core. Plastic collapse of the core can occur causing a catastrophic failure.
It is important therefore to ensure that the core has sufficient shear strength. The shear
stress in a sandwich beam can be calculated using the following expression.
𝜏 =
𝑄
𝐷𝑏∑(𝑆𝐸)
(18)
Where:
Q = shear force at the section under consideration
D = flexural rigidity of the entire section
∑(𝑆𝐸) = sum of the products of S and E of all parts of the section for which z>𝑧1
𝑧1 = depth of interest
26
Equation (19) may be simplified where it is deemed that the core is too weak to provide
a significant contribution to the flexural rigidity of the sandwich structure. The shear
stress is therefore assumed constant over the depth of the core and can be calculated by
the following:
𝜏 =
𝑄
𝑏𝑑
(19)
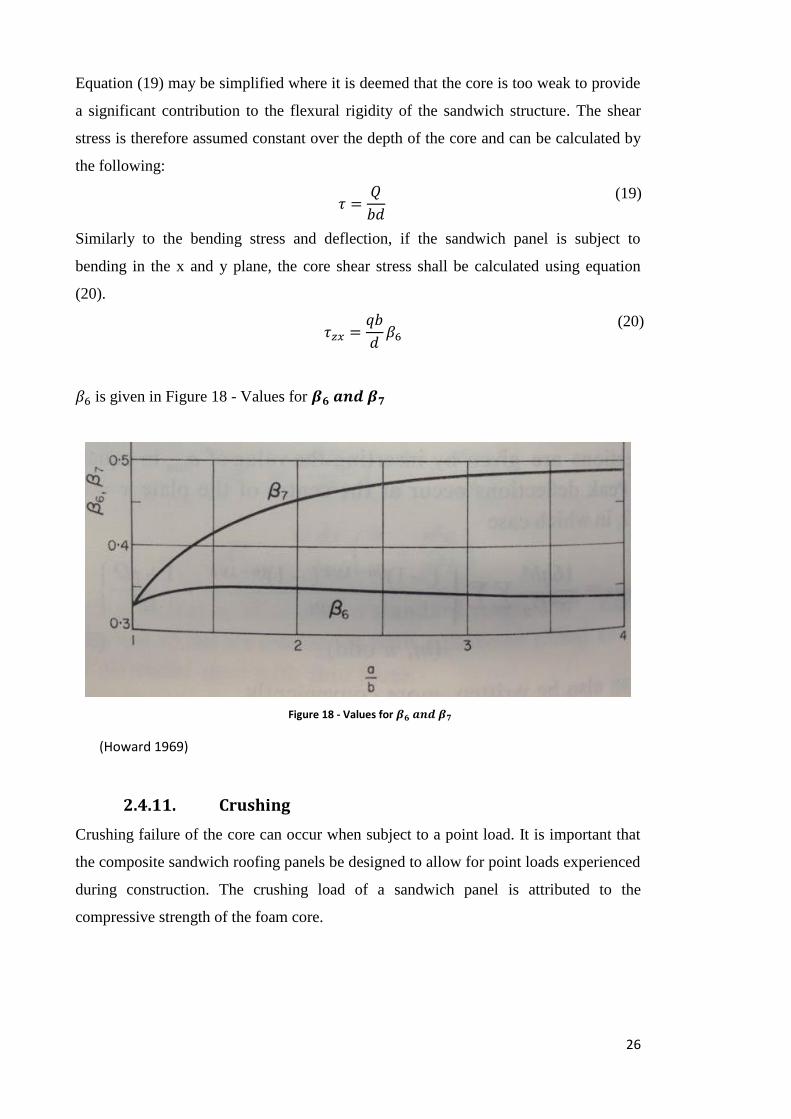
Similarly to the bending stress and deflection, if the sandwich panel is subject to
bending in the x and y plane, the core shear stress shall be calculated using equation
(20).
𝜏𝑧𝑥 =
𝑞𝑏
𝑑𝛽6
(20)
𝛽6 is given in Figure 18 - Values for 𝜷𝟔 𝒂𝒏𝒅 𝜷𝟕
Figure 18 - Values for 𝜷𝟔 𝒂𝒏𝒅 𝜷𝟕
(Howard 1969)
2.4.11. Crushing
Crushing failure of the core can occur when subject to a point load. It is important that
the composite sandwich roofing panels be designed to allow for point loads experienced
during construction. The crushing load of a sandwich panel is attributed to the
compressive strength of the foam core.
27
2.4.12. Wide beams and effective width
As previously stated in section 2.4.6 ‘Bending Stress’, the panels will be bending about
one axis only, meaning they will only be supported on two sides. Due to the prevention
of lateral deformation that would otherwise occur is narrow beams, wide beams are in
fact more rigid than described in equations give in section 2.4.6 and 2.4.7. Young and
Budynas (2002) state that the stiffening effect can be taken into account by using the
following formula instead of the modulus of elasticity for deflection and curvature
calculations.
𝐸𝑠𝑢𝑏 = 𝐸/(1 − 𝑣2) (21)
Where 𝑣 is poisons ratio.
The curvature that exists in narrow beams is still present however at the extreme edges
of a wide beam. For stress calculations the concept of effective width should be taken
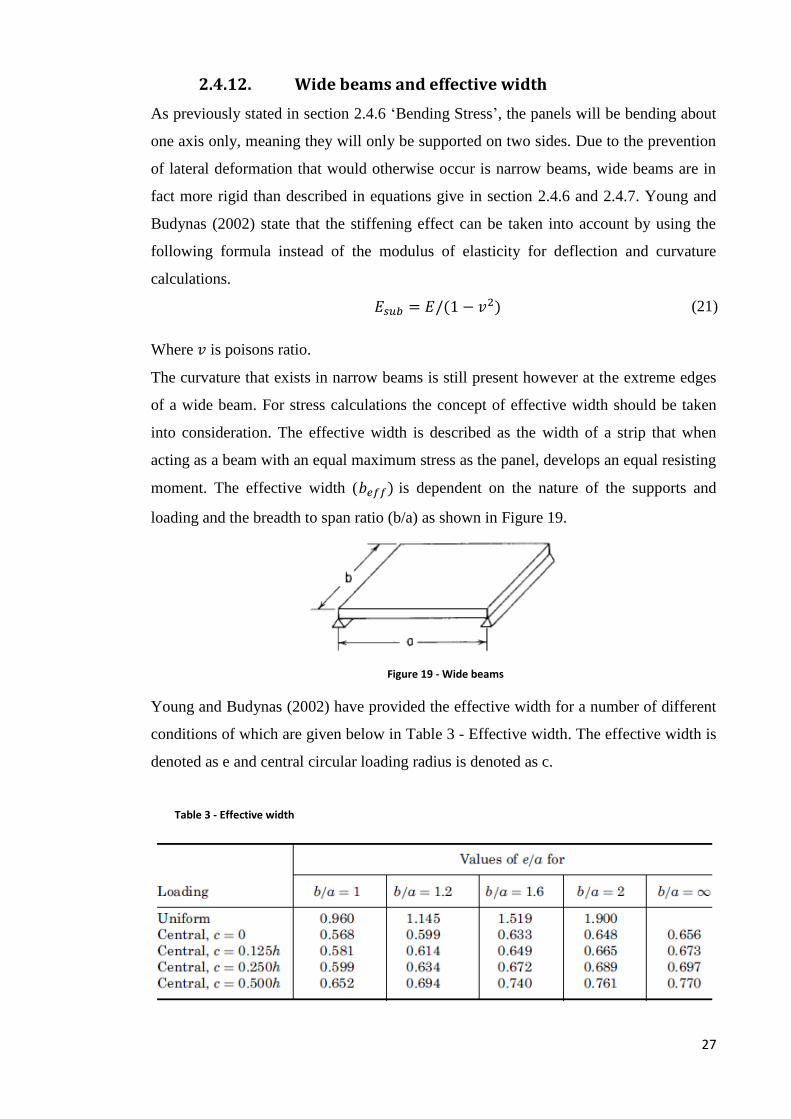
into consideration. The effective width is described as the width of a strip that when
acting as a beam with an equal maximum stress as the panel, develops an equal resisting
moment. The effective width (𝑏𝑒𝑓𝑓) is dependent on the nature of the supports and
loading and the breadth to span ratio (b/a) as shown in Figure 19.
Figure 19 - Wide beams
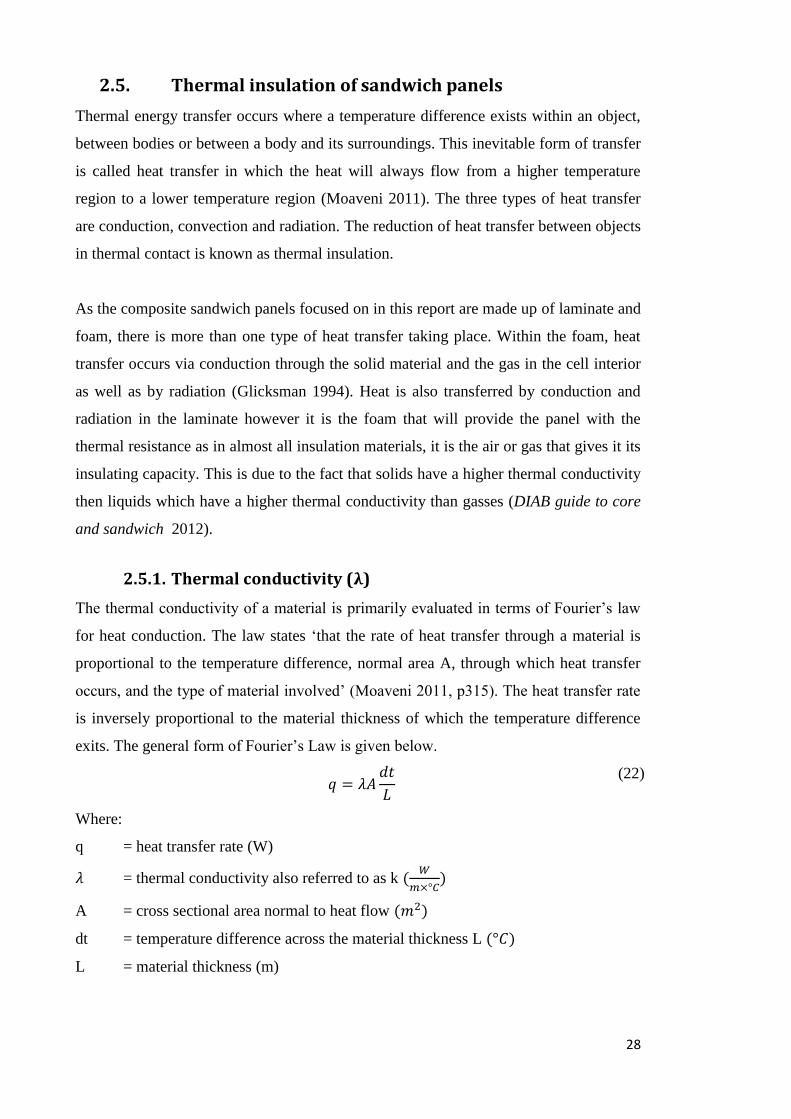
Young and Budynas (2002) have provided the effective width for a number of different
conditions of which are given below in Table 3 - Effective width. The effective width is
denoted as e and central circular loading radius is denoted as c.
Table 3 - Effective width
28
2.5. Thermal insulation of sandwich panels
Thermal energy transfer occurs where a temperature difference exists within an object,
between bodies or between a body and its surroundings. This inevitable form of transfer
is called heat transfer in which the heat will always flow from a higher temperature
region to a lower temperature region (Moaveni 2011). The three types of heat transfer
are conduction, convection and radiation. The reduction of heat transfer between objects
in thermal contact is known as thermal insulation.
As the composite sandwich panels focused on in this report are made up of laminate and
foam, there is more than one type of heat transfer taking place. Within the foam, heat
transfer occurs via conduction through the solid material and the gas in the cell interior
as well as by radiation (Glicksman 1994). Heat is also transferred by conduction and
radiation in the laminate however it is the foam that will provide the panel with the
thermal resistance as in almost all insulation materials, it is the air or gas that gives it its
insulating capacity. This is due to the fact that solids have a higher thermal conductivity
then liquids which have a higher thermal conductivity than gasses (DIAB guide to core
and sandwich 2012).
2.5.1. Thermal conductivity (𝛌)
The thermal conductivity of a material is primarily evaluated in terms of Fourier’s law
for heat conduction. The law states ‘that the rate of heat transfer through a material is
proportional to the temperature difference, normal area A, through which heat transfer
occurs, and the type of material involved’ (Moaveni 2011, p315). The heat transfer rate
is inversely proportional to the material thickness of which the temperature difference
exits. The general form of Fourier’s Law is given below.
𝑞 = 𝜆𝐴
𝑑𝑡
𝐿
(22)
Where:
q = heat transfer rate (W)
𝜆 = thermal conductivity also referred to as k (𝑊
𝑚×°𝐶)
A = cross sectional area normal to heat flow (𝑚2)
dt = temperature difference across the material thickness L (°𝐶)
L = material thickness (m)
29
The thermal conductivity is a property that describes a material’s ability to conduct heat.
From equation (22) we learn that a material with a high thermal conductivity will in turn
have a high heat transfer rate. Materials with low thermal conductivities are therefore
usually selected for use as thermal insulation. The thermal conductivity is not however
constant, rather a property that changes with temperature, density, time and moisture
content. For the purposes of this project, the thermal conductivities of the foam cores
and E glass laminates are supplied by the manufacturers. As a general estimate,
fibreglass has a thermal conductivity of 0.04 𝑊
𝑚𝐾 at a temperature of approximately 25°𝐶
and polyurethane cores approximately 0.03𝑊
𝑚𝐾 at temperatures above 20°𝐶.
2.5.2. Thermal resistance (R’)
The thermal resistance, referred to as an R-value or R-factor in the building and
construction industry, is a property that provides resistance to heat flow. The thermal
resistance of a material is given in equation (23).
𝑅′ =
𝐿
𝑘𝐴
(23)
It is important to note that heat transfer is directly proportional to the temperature
difference and is inversely proportional to the thermal resistance (Moaveni 2011). When
equation (23) is expressed per unit area of material it is referred to as the R-value.
𝑅 =
𝐿
𝑘
(24)
R has the metric units of 𝑚2×°𝐶
𝑊 however it is most commonly expressed in imperial
units of𝑓𝑡2×°𝐹×ℎ
𝐵𝑇𝑈. AS/NZS 4859.1:2002, Materials for the thermal insulation of
buildings, clause 2.3.3 specifies the standard methods for determination of thermal
properties including R values for insulation (AS4859.1 2002 Materials for the thermal
insulation of buildings 2002).
30
2.5.3. Thermal diffusivity (D)
Thermal diffusivity denoted as D or 𝛼 measures the ability of a material to conduct
thermal energy with respect to its ability to store it. The equation for thermal diffusivity
is given below:
𝐷 =
𝑘
𝜌𝐶𝑝
(25)
Where:
𝜌 = density (𝑘𝑔
𝑚3)
𝐶𝑝 = specific heat capacity (𝐽
𝑘𝑔×𝐾)
(Carslaw & Jaeger 1986)
2.6. Fire resistance
2.6.1. PU core
When subject to a sufficient heat source, polyurethane foam can ignite and burn.
Generally for insulation applications the foam will contain fire retardants however it is
important that the foam be manufactured, transported and used in accordance with the
relevant building codes and standards (American Chemistry Council - Polyurethane
2015). The Building Code of Australia (BCA) Section C Fire Resistance specifies both
the fire resistance and reaction to fire requirements for insulated sandwich panels (Rakic
2003). For insulation materials other than sarking-type materials, the member when
tested in accordance with AS1530.3 must have a spread of flame index not exceeding 9.
Where the spread of flame index is greater than 5, it must also have a smoke developed
index not exceeding 8 (National Construction Code Series Volume 1 2015). The
national regulatory requirements are based on accepted safety levels concerning human
life where as insurance company regulations are also concerned with ensuring
protection of property. Hence, over the past decade it has been the insurance
requirements governing the fire resistance properties rather than the national regulatory
requirements.
2.6.2. Fibreglass skins
As discussed previously, the fibreglass skins act similarly to the concrete cover
provided for reinforcement steel in that it limits the exposure of the foam core to the
heat source. In fact the BCA states that in the case of a composite member assembly, the
31
core is not required to meet the flame index or smoked developed index provided that
the structure as a whole satisfies the requirement. The core must also be protected on all
sides and edges from exposure to the air for a period of not less than ten minutes
(National Construction Code Series Volume 1 2015).
2.7. Testing
Testing of fibre composites for structural design is of great importance as in many
cases, the actual strength and deflection of a member will vary significantly from the
theoretical values. The calculated properties of composite materials can vary due to
several reasons. Two of the most common causes for these variances are quality control
during manufacture and the uncertainty involved with the bonding strength between two
different materials. Quite often even after extensive research and repetitive application
of a product, testing is still required before the product can be considered a safe design
for each individual case.
2.7.1. Stiffness
For roofing applications it is important to determine the sandwich panels flexural and
shear stiffness so as to ensure the design requirements are met. ASTM D7250/D7250M
details the standard practice for determining sandwich beam flexural and shear stiffness.
The practice uses test results obtained from the standard test method for facing
properties of sandwich constructions by long beam flexure (ASTM D7249/D72490M)
and the standard test method of core shear properties of sandwich constructions by
beam flexure (ASTM C393/C393M).
ASTM D7250/D7250M gives solutions for the flexural and shear stiffness for common
combinations of loading conditions. The sandwich beam testing will consist of several
different loading conditions of which include 3-Point Mid-Span Loading and various 4-
Point Loading configurations including Third-Span and Quarter-Span. The equations
for the flexural stiffness (D), transverse shear rigidity (U) and core shear modulus (G)
are given for the two loading combinations used in the testing. For each set of loading
combinations, D, U and G must be calculated for at least ten (10) force levels evenly
spaced over the linear elastic force range. The final values for each parameter may then
be calculated as the average of the set.
32
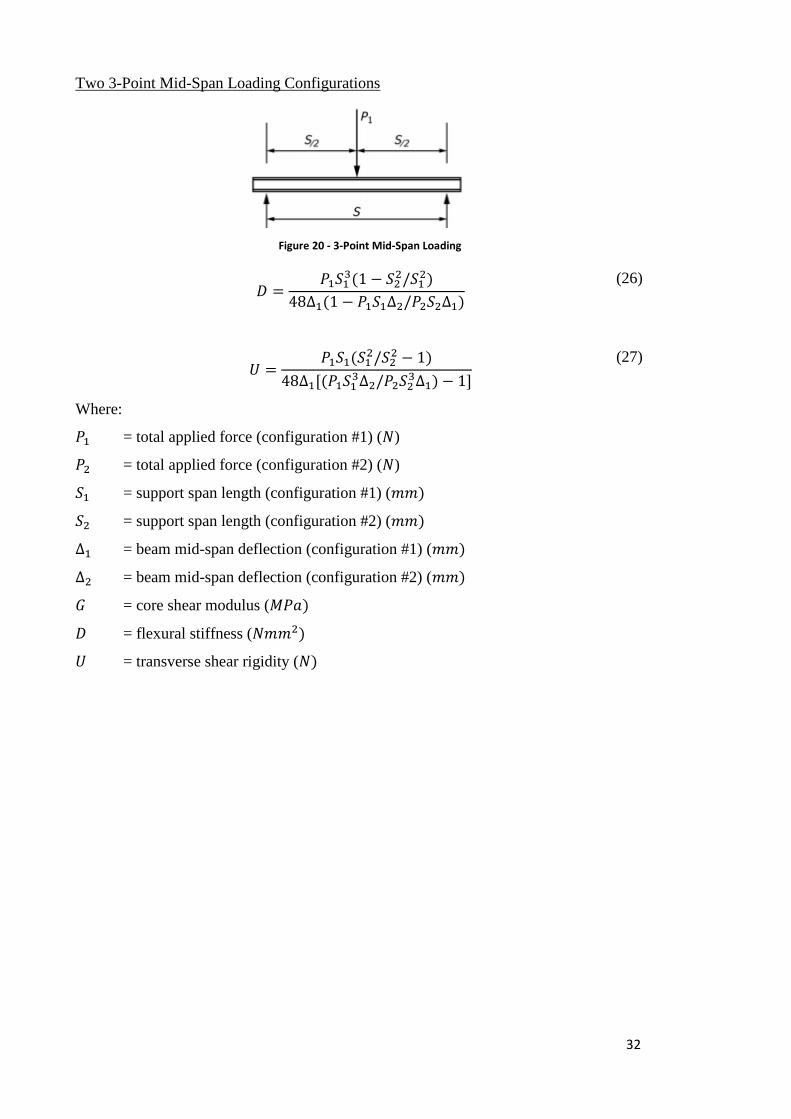
Two 3-Point Mid-Span Loading Configurations
Figure 20 - 3-Point Mid-Span Loading
𝐷 =
𝑃1𝑆13(1 − 𝑆2
2/𝑆12)
48∆1(1 − 𝑃1𝑆1∆2/𝑃2𝑆2∆1)
(26)
𝑈 =
𝑃1𝑆1(𝑆12/𝑆2
2 − 1)
48∆1[(𝑃1𝑆13∆2/𝑃2𝑆2
3∆1) − 1]
(27)
Where:
𝑃1 = total applied force (configuration #1) (𝑁)
𝑃2 = total applied force (configuration #2) (𝑁)
𝑆1 = support span length (configuration #1) (𝑚𝑚)
𝑆2 = support span length (configuration #2) (𝑚𝑚)
∆1 = beam mid-span deflection (configuration #1) (𝑚𝑚)
∆2 = beam mid-span deflection (configuration #2) (𝑚𝑚)
𝐺 = core shear modulus (𝑀𝑃𝑎)
𝐷 = flexural stiffness (𝑁𝑚𝑚2)
𝑈 = transverse shear rigidity (𝑁)
33
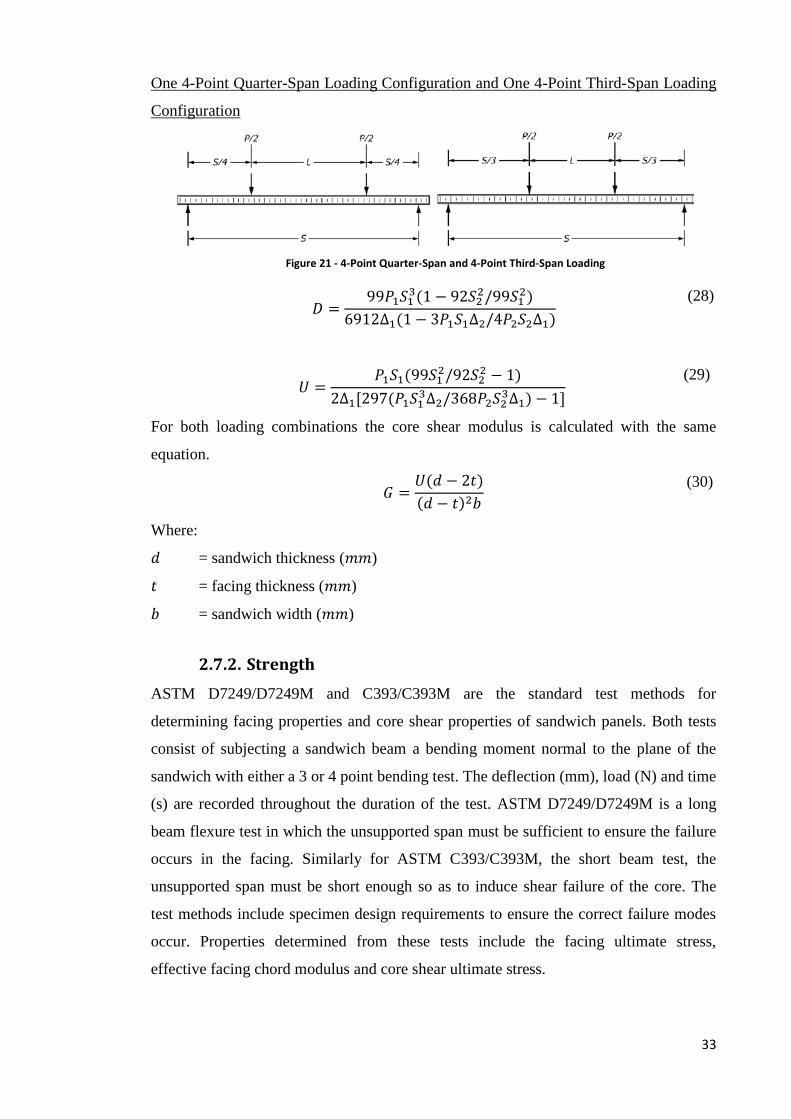
One 4-Point Quarter-Span Loading Configuration and One 4-Point Third-Span Loading
Configuration
Figure 21 - 4-Point Quarter-Span and 4-Point Third-Span Loading
𝐷 =
99𝑃1𝑆13(1 − 92𝑆2
2/99𝑆12)
6912∆1(1 − 3𝑃1𝑆1∆2/4𝑃2𝑆2∆1)
(28)
𝑈 =
𝑃1𝑆1(99𝑆12/92𝑆2
2 − 1)
2∆1[297(𝑃1𝑆13∆2/368𝑃2𝑆2
3∆1) − 1]
(29)
For both loading combinations the core shear modulus is calculated with the same
equation.
𝐺 =
𝑈(𝑑 − 2𝑡)
(𝑑 − 𝑡)2𝑏
(30)
Where:
𝑑 = sandwich thickness (𝑚𝑚)
𝑡 = facing thickness (𝑚𝑚)
𝑏 = sandwich width (𝑚𝑚)
2.7.2. Strength
ASTM D7249/D7249M and C393/C393M are the standard test methods for
determining facing properties and core shear properties of sandwich panels. Both tests
consist of subjecting a sandwich beam a bending moment normal to the plane of the
sandwich with either a 3 or 4 point bending test. The deflection (mm), load (N) and time
(s) are recorded throughout the duration of the test. ASTM D7249/D7249M is a long
beam flexure test in which the unsupported span must be sufficient to ensure the failure
occurs in the facing. Similarly for ASTM C393/C393M, the short beam test, the
unsupported span must be short enough so as to induce shear failure of the core. The
test methods include specimen design requirements to ensure the correct failure modes
occur. Properties determined from these tests include the facing ultimate stress,
effective facing chord modulus and core shear ultimate stress.

35
Chapter 3. Methodology and Manufacture
3.1. Introduction
This chapter details the analysis methods and design processes followed throughout the
duration of the project. The method for analysing the composite sandwich panels for
roofing applications may be broken down into several phases:
- determination of design loads, serviceability and insulation requirements;
- design;
- manufacture;
- testing; and
- modelling.
The timeline for the various phases of the project has been attached as appendix C.
3.2. Design requirements
Design loads and serviceability
The design loads and serviceability limits were calculated using the relevant standards
for roofing design which include AS1170.0, AS1170.1 and AS1170.2. The loads
determined included dead load, superimposed point and distributed live loads as well as
wind loads.
Insulation
The insulation requirements were determined according to Section J ‘Energy
Efficiency’ of the National Construction Code (NCC) otherwise known as the Building
Code of Australia (BCA). Based on findings from the literature review, the local council
requirements for thermal insulation will also need to be determined and designed for.
3.3. Initial design
As stated in the literature review, there have been many studies conducted on the
flexural strength of sandwich panels of which the results are widely published. Using
the published equations, the theoretical capacities of the sandwich panels subject to
transverse loads were calculated numerically. This was carried out with the use of the
program Microsoft Excel. Similarly the thermal insulation or resistance (R) was
calculated in the same way.
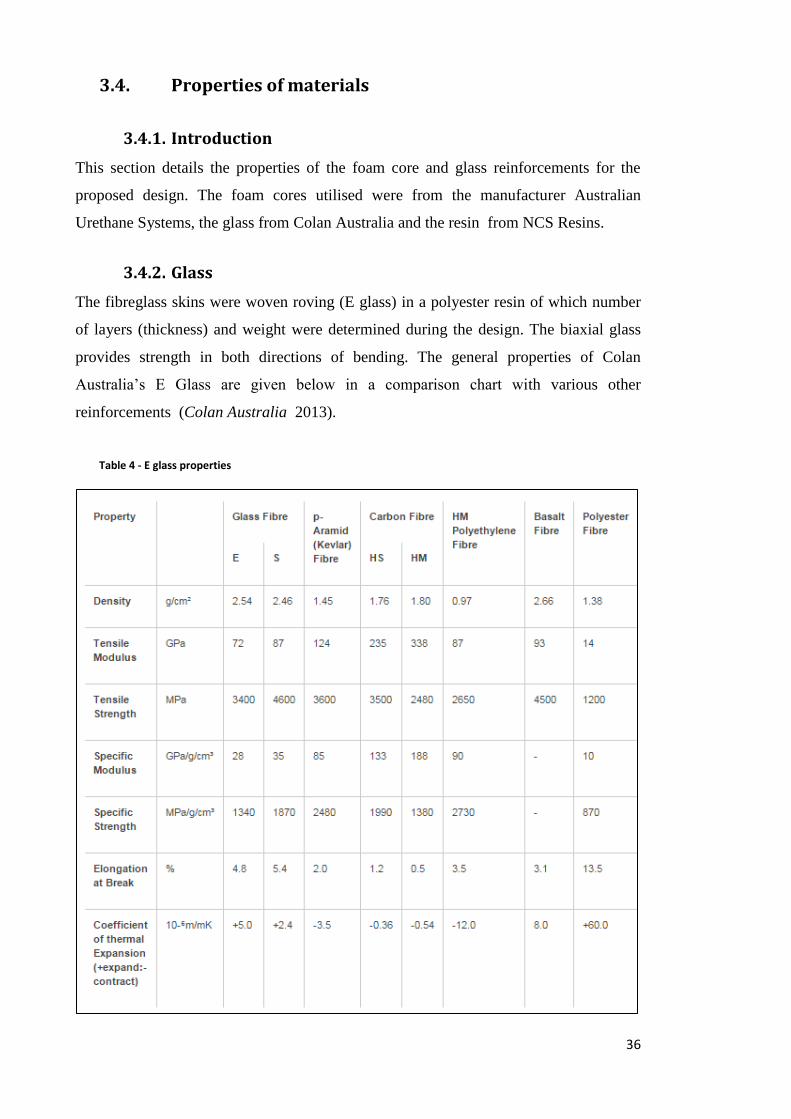
36
3.4. Properties of materials
3.4.1. Introduction
This section details the properties of the foam core and glass reinforcements for the
proposed design. The foam cores utilised were from the manufacturer Australian
Urethane Systems, the glass from Colan Australia and the resin from NCS Resins.
3.4.2. Glass
The fibreglass skins were woven roving (E glass) in a polyester resin of which number
of layers (thickness) and weight were determined during the design. The biaxial glass
provides strength in both directions of bending. The general properties of Colan
Australia’s E Glass are given below in a comparison chart with various other
reinforcements (Colan Australia 2013).
Table 4 - E glass properties
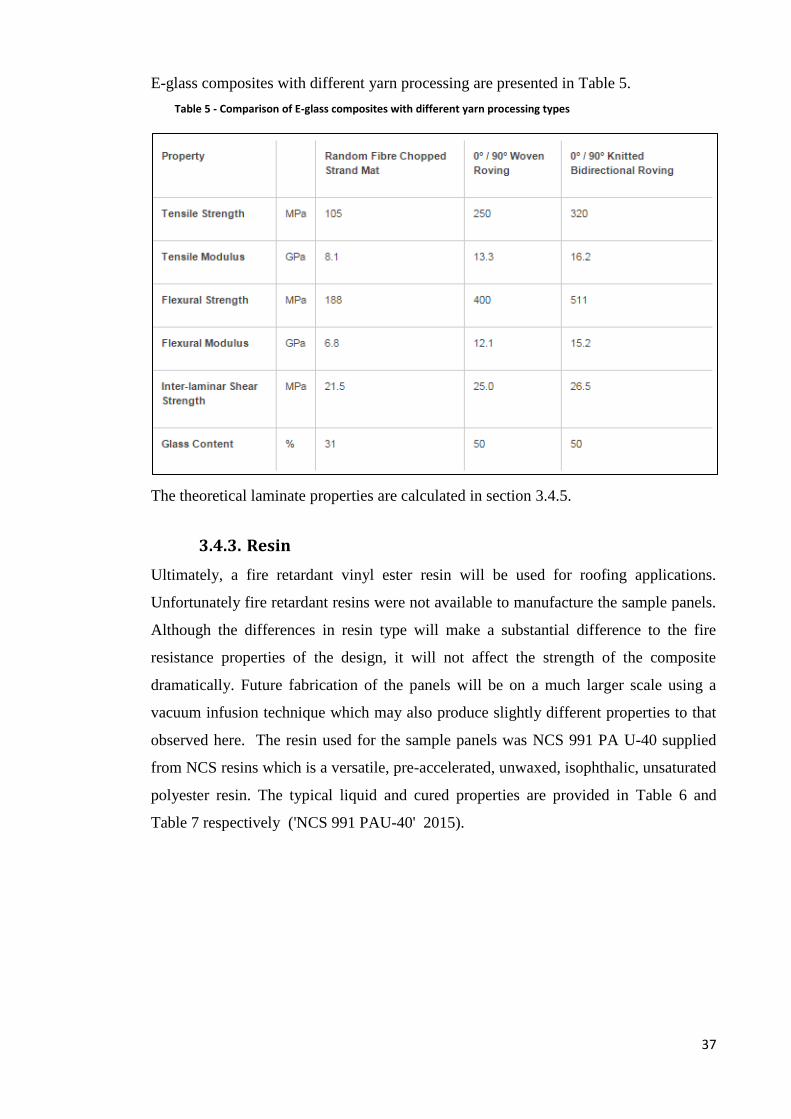
37
E-glass composites with different yarn processing are presented in Table 5.
Table 5 - Comparison of E-glass composites with different yarn processing types
The theoretical laminate properties are calculated in section 3.4.5.
3.4.3. Resin
Ultimately, a fire retardant vinyl ester resin will be used for roofing applications.
Unfortunately fire retardant resins were not available to manufacture the sample panels.
Although the differences in resin type will make a substantial difference to the fire
resistance properties of the design, it will not affect the strength of the composite
dramatically. Future fabrication of the panels will be on a much larger scale using a
vacuum infusion technique which may also produce slightly different properties to that
observed here. The resin used for the sample panels was NCS 991 PA U-40 supplied
from NCS resins which is a versatile, pre-accelerated, unwaxed, isophthalic, unsaturated
polyester resin. The typical liquid and cured properties are provided in Table 6 and
Table 7 respectively ('NCS 991 PAU-40' 2015).
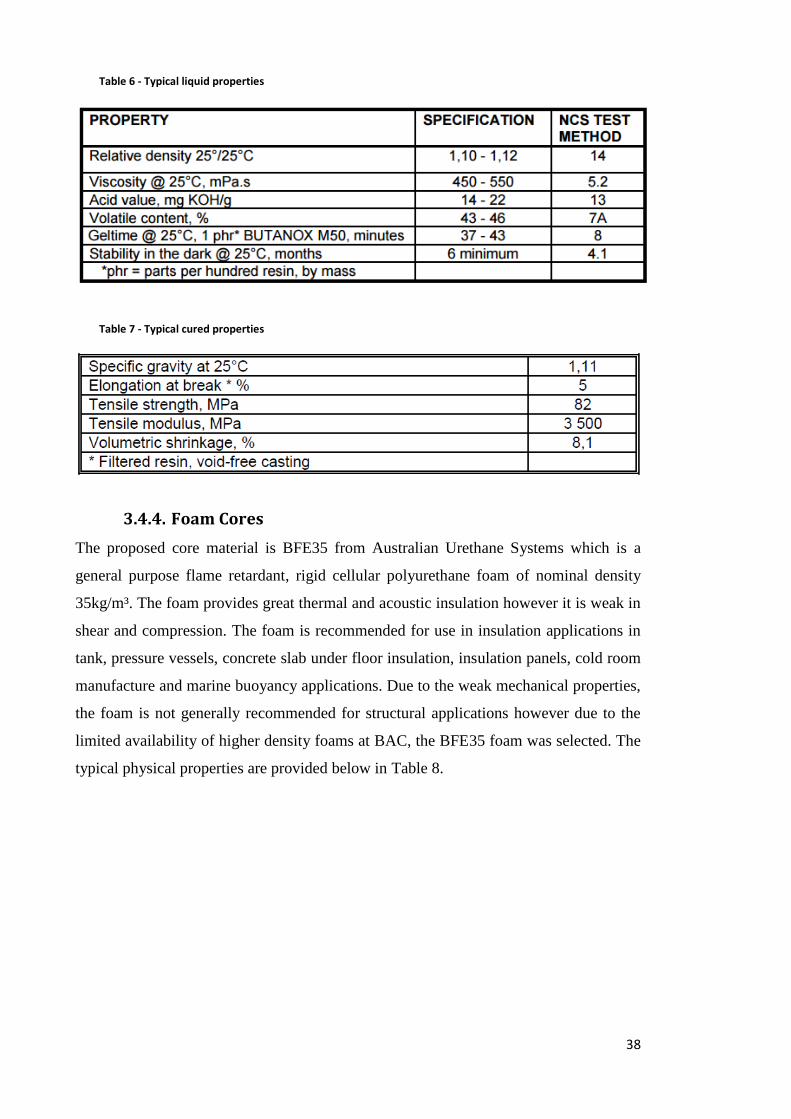
38
Table 6 - Typical liquid properties
Table 7 - Typical cured properties
3.4.4. Foam Cores
The proposed core material is BFE35 from Australian Urethane Systems which is a
general purpose flame retardant, rigid cellular polyurethane foam of nominal density
35kg/m³. The foam provides great thermal and acoustic insulation however it is weak in
shear and compression. The foam is recommended for use in insulation applications in
tank, pressure vessels, concrete slab under floor insulation, insulation panels, cold room
manufacture and marine buoyancy applications. Due to the weak mechanical properties,
the foam is not generally recommended for structural applications however due to the
limited availability of higher density foams at BAC, the BFE35 foam was selected. The
typical physical properties are provided below in Table 8.
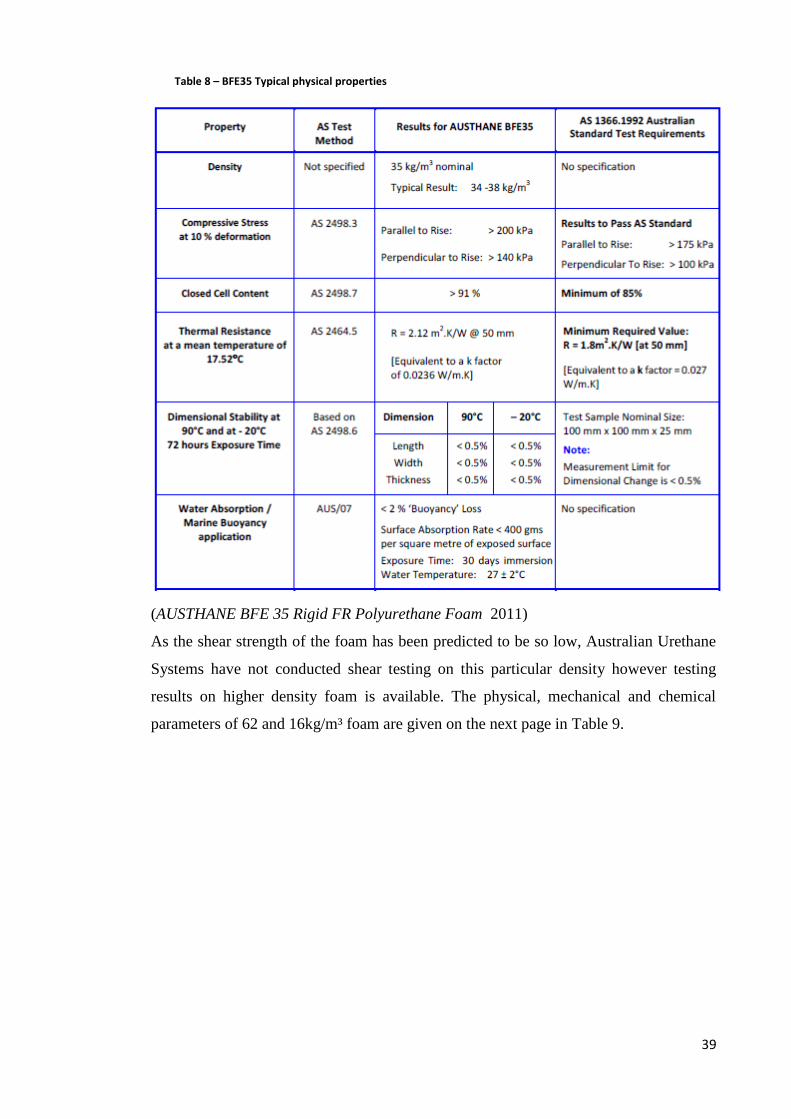
39
Table 8 – BFE35 Typical physical properties
(AUSTHANE BFE 35 Rigid FR Polyurethane Foam 2011)
As the shear strength of the foam has been predicted to be so low, Australian Urethane
Systems have not conducted shear testing on this particular density however testing
results on higher density foam is available. The physical, mechanical and chemical
parameters of 62 and 16kg/m³ foam are given on the next page in Table 9.
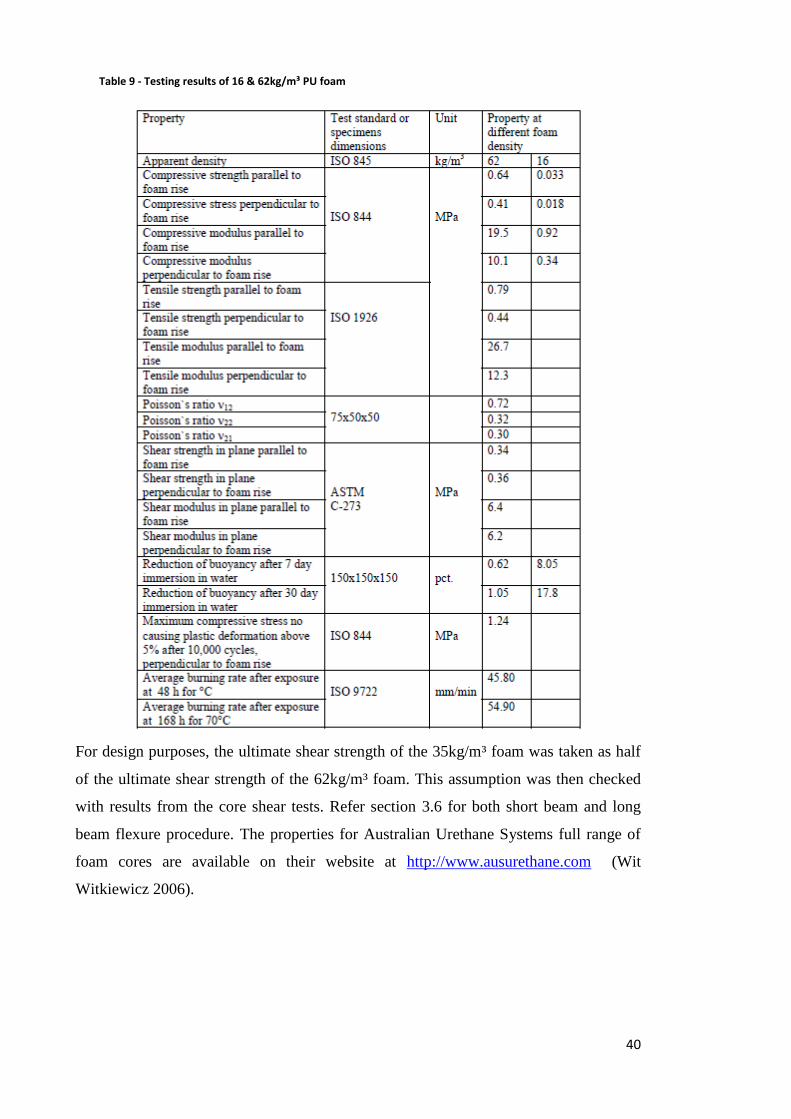
40
Table 9 - Testing results of 16 & 62kg/m³ PU foam
For design purposes, the ultimate shear strength of the 35kg/m³ foam was taken as half
of the ultimate shear strength of the 62kg/m³ foam. This assumption was then checked
with results from the core shear tests. Refer section 3.6 for both short beam and long
beam flexure procedure. The properties for Australian Urethane Systems full range of
foam cores are available on their website at http://www.ausurethane.com (Wit
Witkiewicz 2006).
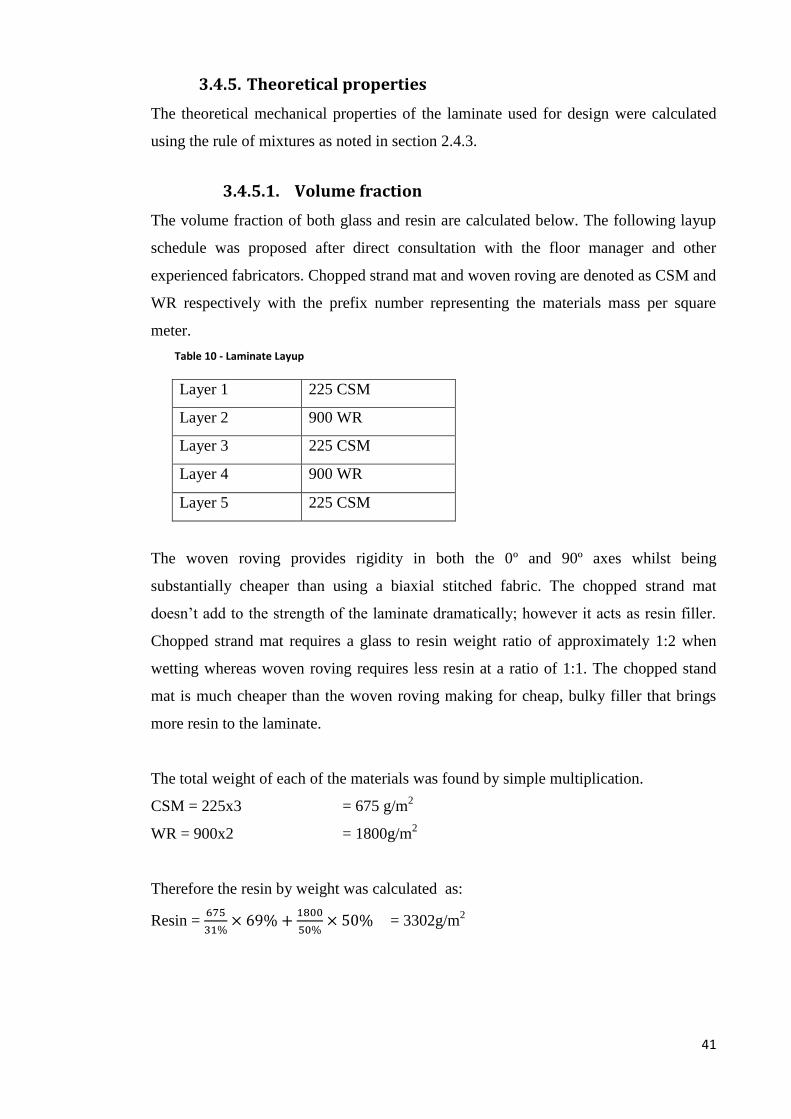
41
3.4.5. Theoretical properties
The theoretical mechanical properties of the laminate used for design were calculated
using the rule of mixtures as noted in section 2.4.3.
3.4.5.1. Volume fraction
The volume fraction of both glass and resin are calculated below. The following layup
schedule was proposed after direct consultation with the floor manager and other
experienced fabricators. Chopped strand mat and woven roving are denoted as CSM and
WR respectively with the prefix number representing the materials mass per square
meter.
Table 10 - Laminate Layup
Layer 1 225 CSM
Layer 2 900 WR
Layer 3 225 CSM
Layer 4 900 WR
Layer 5 225 CSM
The woven roving provides rigidity in both the 0º and 90º axes whilst being
substantially cheaper than using a biaxial stitched fabric. The chopped strand mat
doesn’t add to the strength of the laminate dramatically; however it acts as resin filler.
Chopped strand mat requires a glass to resin weight ratio of approximately 1:2 when
wetting whereas woven roving requires less resin at a ratio of 1:1. The chopped stand
mat is much cheaper than the woven roving making for cheap, bulky filler that brings
more resin to the laminate.
The total weight of each of the materials was found by simple multiplication.
CSM = 225x3 = 675 g/m2
WR = 900x2 = 1800g/m2
Therefore the resin by weight was calculated as:
Resin = 675
31%× 69% +
1800
50%× 50% = 3302g/m
2
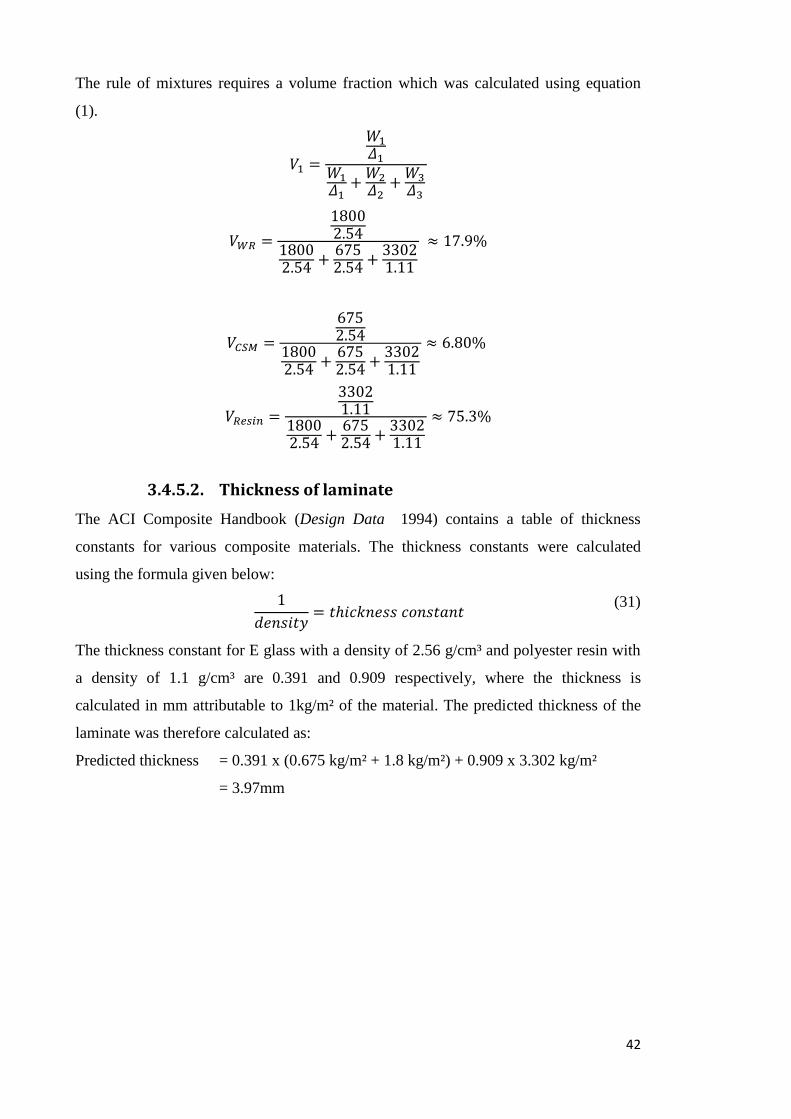
42
The rule of mixtures requires a volume fraction which was calculated using equation
(1).
𝑉1 =
𝑊1
𝛥1
𝑊1
𝛥1+
𝑊2
𝛥2+
𝑊3
𝛥3
𝑉𝑊𝑅 =
18002.54
18002.54
+6752.54
+33021.11
≈ 17.9%
𝑉𝐶𝑆𝑀 =
6752.54
18002.54
+6752.54
+33021.11
≈ 6.80%
𝑉𝑅𝑒𝑠𝑖𝑛 =
33021.11
18002.54
+6752.54
+33021.11
≈ 75.3%
3.4.5.2. Thickness of laminate
The ACI Composite Handbook (Design Data 1994) contains a table of thickness
constants for various composite materials. The thickness constants were calculated
using the formula given below:
1
𝑑𝑒𝑛𝑠𝑖𝑡𝑦= 𝑡ℎ𝑖𝑐𝑘𝑛𝑒𝑠𝑠 𝑐𝑜𝑛𝑠𝑡𝑎𝑛𝑡
(31)
The thickness constant for E glass with a density of 2.56 g/cm³ and polyester resin with
a density of 1.1 g/cm³ are 0.391 and 0.909 respectively, where the thickness is
calculated in mm attributable to 1kg/m² of the material. The predicted thickness of the
laminate was therefore calculated as:
Predicted thickness = 0.391 x (0.675 kg/m² + 1.8 kg/m²) + 0.909 x 3.302 kg/m²
= 3.97mm
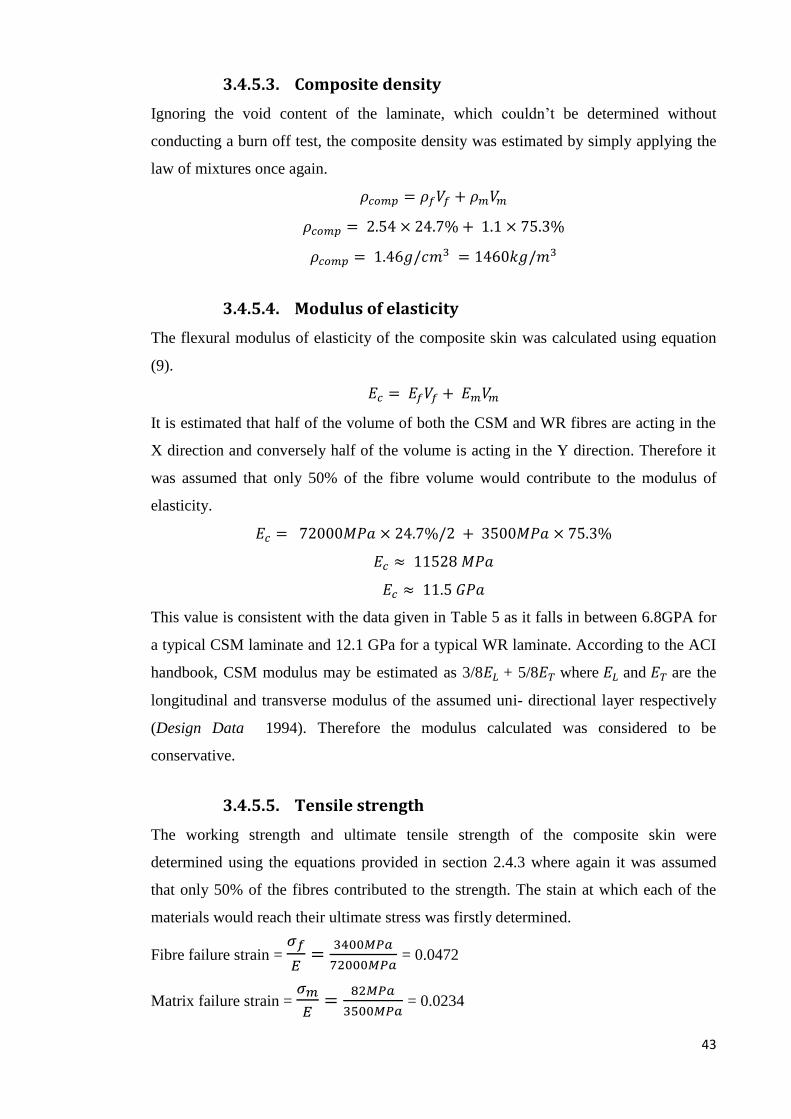
43
3.4.5.3. Composite density
Ignoring the void content of the laminate, which couldn’t be determined without
conducting a burn off test, the composite density was estimated by simply applying the
law of mixtures once again.
𝜌𝑐𝑜𝑚𝑝 = 𝜌𝑓𝑉𝑓 + 𝜌𝑚𝑉𝑚
𝜌𝑐𝑜𝑚𝑝 = 2.54 × 24.7% + 1.1 × 75.3%
𝜌𝑐𝑜𝑚𝑝 = 1.46𝑔/𝑐𝑚3 = 1460𝑘𝑔/𝑚3
3.4.5.4. Modulus of elasticity
The flexural modulus of elasticity of the composite skin was calculated using equation
(9).
𝐸𝑐 = 𝐸𝑓𝑉𝑓 + 𝐸𝑚𝑉𝑚
It is estimated that half of the volume of both the CSM and WR fibres are acting in the
X direction and conversely half of the volume is acting in the Y direction. Therefore it
was assumed that only 50% of the fibre volume would contribute to the modulus of
elasticity.
𝐸𝑐 = 72000𝑀𝑃𝑎 × 24.7%/2 + 3500𝑀𝑃𝑎 × 75.3%
𝐸𝑐 ≈ 11528 𝑀𝑃𝑎
𝐸𝑐 ≈ 11.5 𝐺𝑃𝑎
This value is consistent with the data given in Table 5 as it falls in between 6.8GPA for
a typical CSM laminate and 12.1 GPa for a typical WR laminate. According to the ACI
handbook, CSM modulus may be estimated as 3/8𝐸𝐿 + 5/8𝐸𝑇 where 𝐸𝐿 and 𝐸𝑇 are the
longitudinal and transverse modulus of the assumed uni- directional layer respectively
(Design Data 1994). Therefore the modulus calculated was considered to be
conservative.
3.4.5.5. Tensile strength
The working strength and ultimate tensile strength of the composite skin were
determined using the equations provided in section 2.4.3 where again it was assumed
that only 50% of the fibres contributed to the strength. The stain at which each of the
materials would reach their ultimate stress was firstly determined.
Fibre failure strain = 𝜎𝑓
𝐸 =
3400𝑀𝑃𝑎
72000𝑀𝑃𝑎 = 0.0472
Matrix failure strain = 𝜎𝑚
𝐸 =
82𝑀𝑃𝑎
3500𝑀𝑃𝑎 = 0.0234
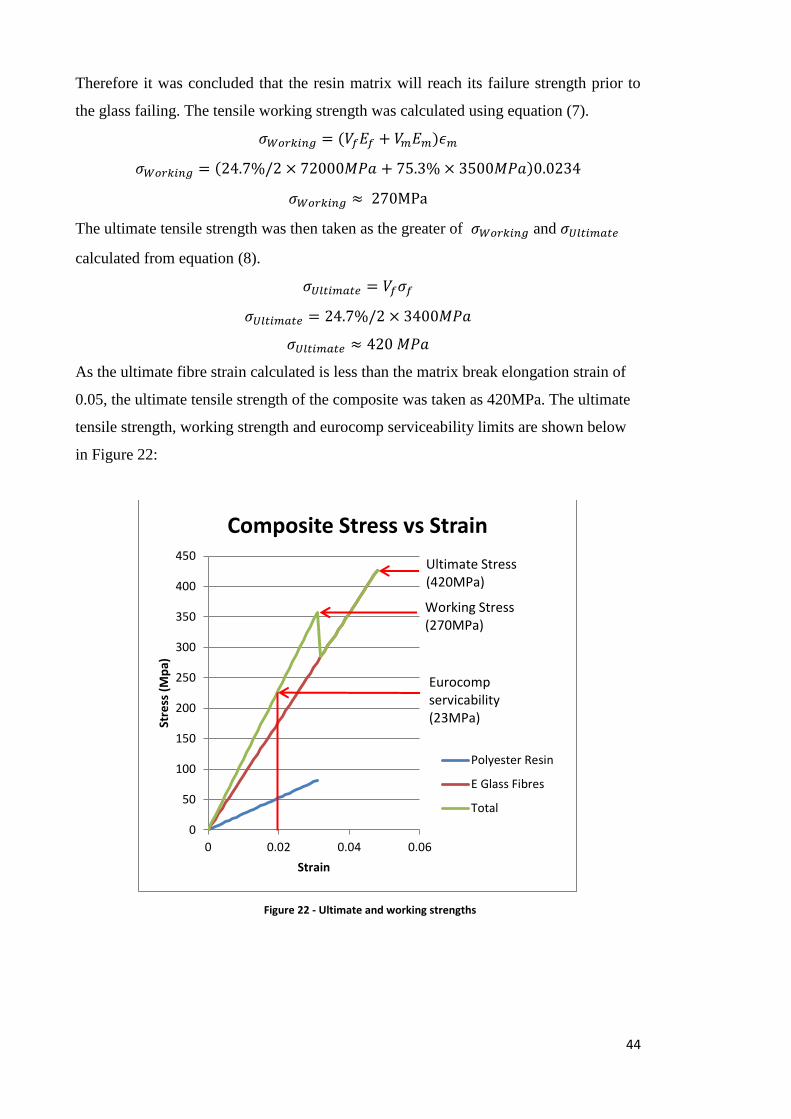
44
Therefore it was concluded that the resin matrix will reach its failure strength prior to
the glass failing. The tensile working strength was calculated using equation (7).
𝜎𝑊𝑜𝑟𝑘𝑖𝑛𝑔 = (𝑉𝑓𝐸𝑓 + 𝑉𝑚𝐸𝑚)𝜖𝑚
𝜎𝑊𝑜𝑟𝑘𝑖𝑛𝑔 = (24.7%/2 × 72000𝑀𝑃𝑎 + 75.3% × 3500𝑀𝑃𝑎)0.0234
𝜎𝑊𝑜𝑟𝑘𝑖𝑛𝑔 ≈ 270MPa
The ultimate tensile strength was then taken as the greater of 𝜎𝑊𝑜𝑟𝑘𝑖𝑛𝑔 and 𝜎𝑈𝑙𝑡𝑖𝑚𝑎𝑡𝑒
calculated from equation (8).
𝜎𝑈𝑙𝑡𝑖𝑚𝑎𝑡𝑒 = 𝑉𝑓𝜎𝑓
𝜎𝑈𝑙𝑡𝑖𝑚𝑎𝑡𝑒 = 24.7%/2 × 3400𝑀𝑃𝑎
𝜎𝑈𝑙𝑡𝑖𝑚𝑎𝑡𝑒 ≈ 420 𝑀𝑃𝑎
As the ultimate fibre strain calculated is less than the matrix break elongation strain of
0.05, the ultimate tensile strength of the composite was taken as 420MPa. The ultimate
tensile strength, working strength and eurocomp serviceability limits are shown below
in Figure 22:
Figure 22 - Ultimate and working strengths
0
50
100
150
200
250
300
350
400
450
0 0.02 0.04 0.06
Stre
ss (
Mp
a)
Strain
Composite Stress vs Strain
Polyester Resin
E Glass Fibres
Total
Ultimate Stress (420MPa)
Working Stress (270MPa)
Eurocomp servicability (23MPa)
45
3.5. Manufacture
The composite sandwich panels used for testing were manufactured at BAC’s workshop
over a period of one week in strict accordance with project risk management plan and
BAC’s safety policy. The following procedure outlines the method of manufacture as
well as the materials and tools required:
3.5.1. Materials
The materials used for manufacture were:
- Australian Urethane Systems BFE35 Rigid block foam;
- AkzoNobel Butanox M-50 Catalyst;
- NCS 991PAU-40 Resin;
- Colan Australia 830g/m2 Woven roving; and
- Colan Australia 225g/m2 Chopped strand mat.
3.5.2. Procedure
1) The BFE35 Rigid block foam was cut to the following panel sizes using a band-
saw:
o 2x 75x250x1450mm;
o 1x 75x250x1200mm; and
o 3x 50x250x1200mm.
2) Saw dusts and other foreign materials were removed from the foam with
compressed air.
3) The woven roving and chopped strand mat glass were cut into the required
lengths.
4) A catalyst to resin ratio of 2% was achieved by adding approximately 60mL of
M-50 Catalyst to 3000mL of 991PAU-40 Resin in several milk containers.
5) The foam cores were prepared for the first layer of glass by applying a thin film
of resin with a paintbrush. The resin soaked into the core providing for a strong
skin to core bond.
6) The glass was placed according to Table 10 - Laminate Layup with the use of a
paintbrush and roller when applying the resin mix.
7) The panels were placed to the side for three hours allowing for the laminate to
set before flipping over.
8) Step 5,6 and 7 were repeated for skins on the opposite sides of the panels.
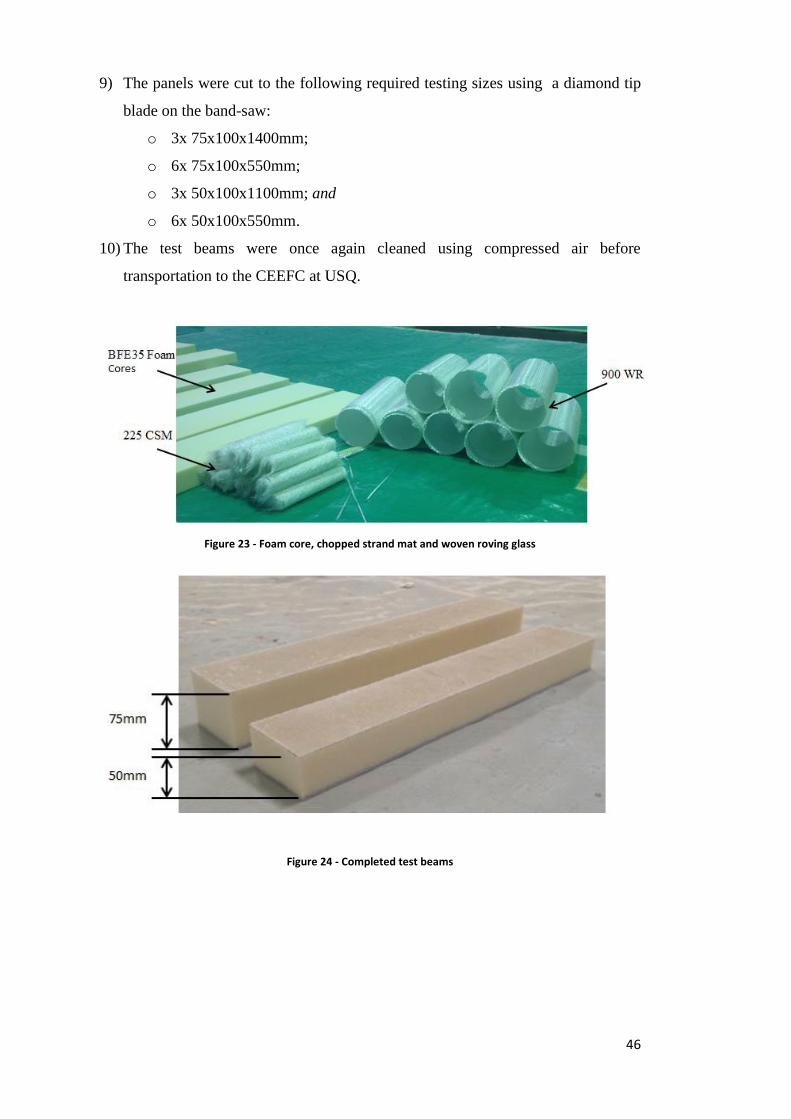
46
9) The panels were cut to the following required testing sizes using a diamond tip
blade on the band-saw:
o 3x 75x100x1400mm;
o 6x 75x100x550mm;
o 3x 50x100x1100mm; and
o 6x 50x100x550mm.
10) The test beams were once again cleaned using compressed air before
transportation to the CEEFC at USQ.
Figure 23 - Foam core, chopped strand mat and woven roving glass
Figure 24 - Completed test beams
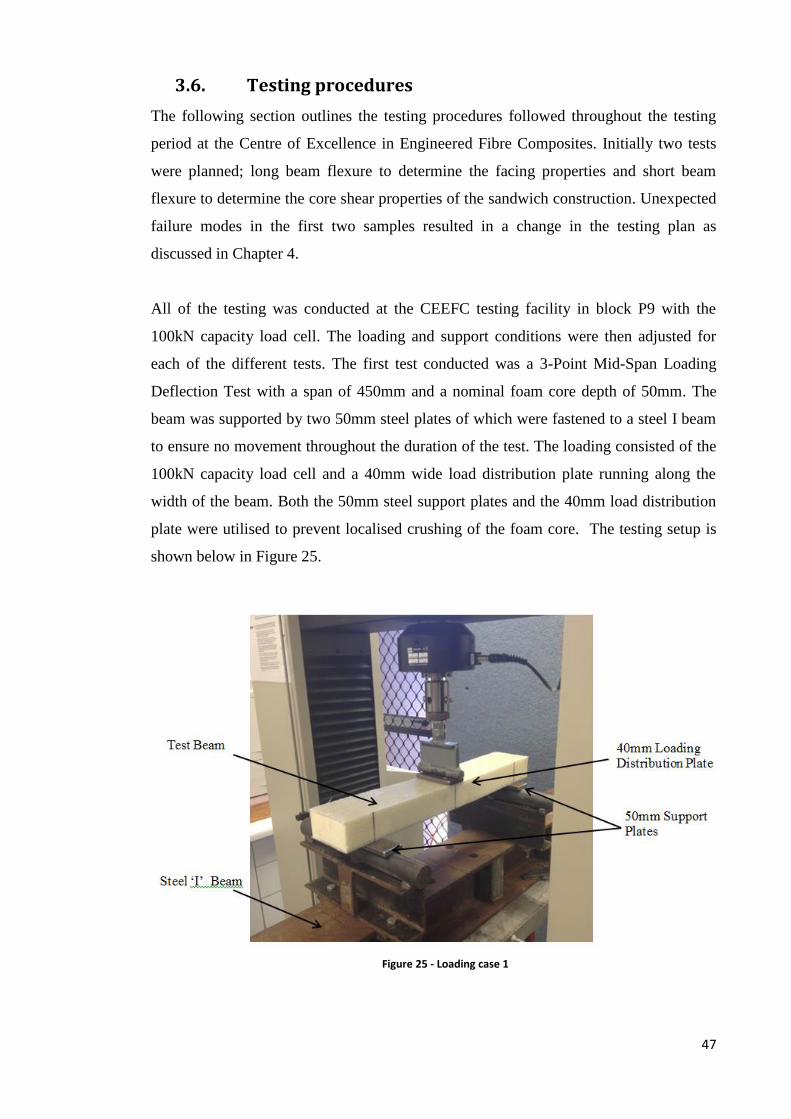
47
3.6. Testing procedures
The following section outlines the testing procedures followed throughout the testing
period at the Centre of Excellence in Engineered Fibre Composites. Initially two tests
were planned; long beam flexure to determine the facing properties and short beam
flexure to determine the core shear properties of the sandwich construction. Unexpected
failure modes in the first two samples resulted in a change in the testing plan as
discussed in Chapter 4.
All of the testing was conducted at the CEEFC testing facility in block P9 with the
100kN capacity load cell. The loading and support conditions were then adjusted for
each of the different tests. The first test conducted was a 3-Point Mid-Span Loading
Deflection Test with a span of 450mm and a nominal foam core depth of 50mm. The
beam was supported by two 50mm steel plates of which were fastened to a steel I beam
to ensure no movement throughout the duration of the test. The loading consisted of the
100kN capacity load cell and a 40mm wide load distribution plate running along the
width of the beam. Both the 50mm steel support plates and the 40mm load distribution
plate were utilised to prevent localised crushing of the foam core. The testing setup is
shown below in Figure 25.
Figure 25 - Loading case 1
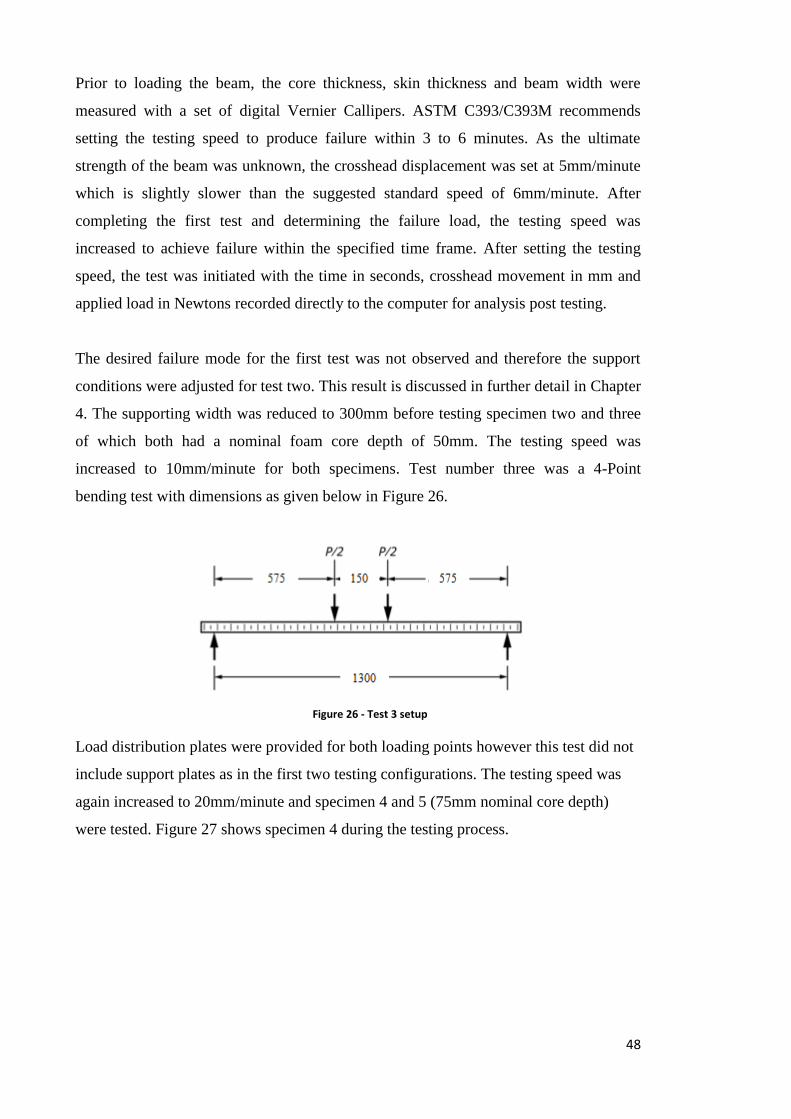
48
Prior to loading the beam, the core thickness, skin thickness and beam width were
measured with a set of digital Vernier Callipers. ASTM C393/C393M recommends
setting the testing speed to produce failure within 3 to 6 minutes. As the ultimate
strength of the beam was unknown, the crosshead displacement was set at 5mm/minute
which is slightly slower than the suggested standard speed of 6mm/minute. After
completing the first test and determining the failure load, the testing speed was
increased to achieve failure within the specified time frame. After setting the testing
speed, the test was initiated with the time in seconds, crosshead movement in mm and
applied load in Newtons recorded directly to the computer for analysis post testing.
The desired failure mode for the first test was not observed and therefore the support
conditions were adjusted for test two. This result is discussed in further detail in Chapter
4. The supporting width was reduced to 300mm before testing specimen two and three
of which both had a nominal foam core depth of 50mm. The testing speed was
increased to 10mm/minute for both specimens. Test number three was a 4-Point
bending test with dimensions as given below in Figure 26.
Figure 26 - Test 3 setup
Load distribution plates were provided for both loading points however this test did not
include support plates as in the first two testing configurations. The testing speed was
again increased to 20mm/minute and specimen 4 and 5 (75mm nominal core depth)
were tested. Figure 27 shows specimen 4 during the testing process.
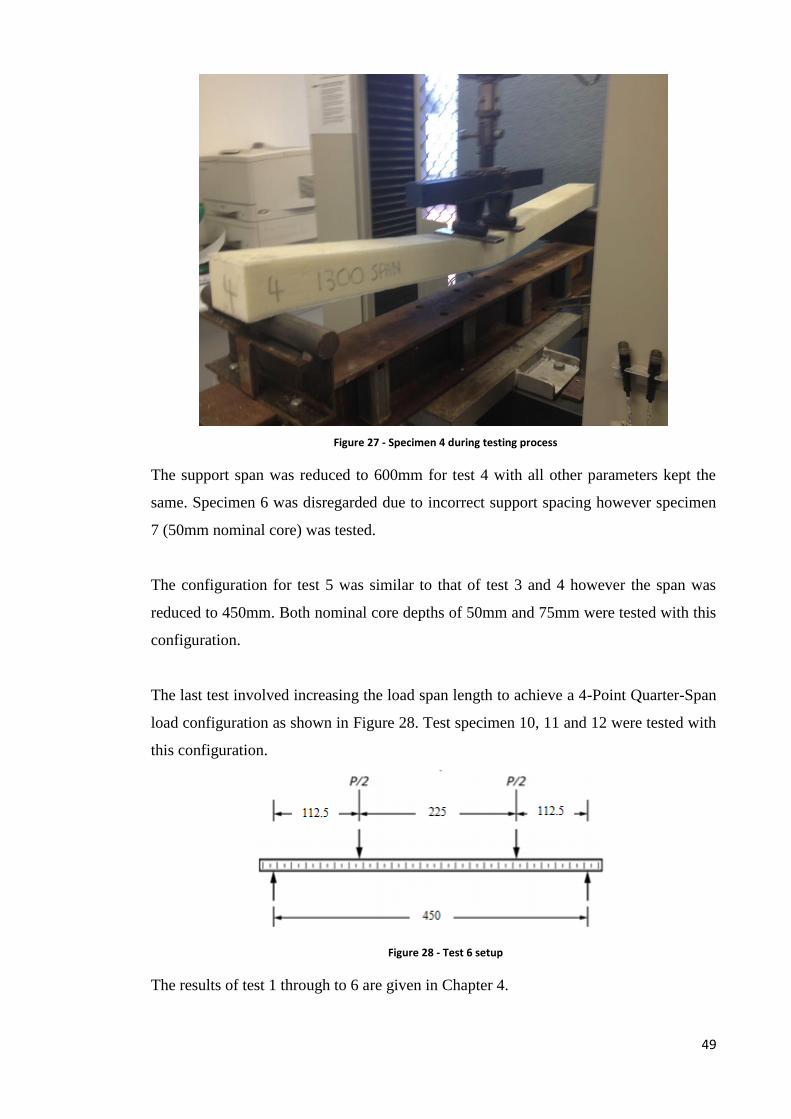
49
Figure 27 - Specimen 4 during testing process
The support span was reduced to 600mm for test 4 with all other parameters kept the
same. Specimen 6 was disregarded due to incorrect support spacing however specimen
7 (50mm nominal core) was tested.
The configuration for test 5 was similar to that of test 3 and 4 however the span was
reduced to 450mm. Both nominal core depths of 50mm and 75mm were tested with this
configuration.
The last test involved increasing the load span length to achieve a 4-Point Quarter-Span
load configuration as shown in Figure 28. Test specimen 10, 11 and 12 were tested with
this configuration.
Figure 28 - Test 6 setup
The results of test 1 through to 6 are given in Chapter 4.
50
3.7. Modelling and final design
The mechanical property results from the composite sandwich beam tests, along with
the knowledge of failure modes gained throughout the testing period were used to
redesign the sandwich panels to fully satisfy the design requirements discussed in
section 3.2. The final design was modelled in Creo Parametric with an FEA conducted
using the Creo Simulation package. An FEA was also conducted on a beam to compare
with the physical test results from the three point bend test validating the model.
3.8. Resource requirements
In addition to the resources such as the materials listed for manufacture and the
equipment required for testing in section 3.5 and 3.6 respectively, several other
resources were required to complete the project. Software packages such as Solidworks,
Creo Parametric and the Microsoft Office suite were used throughout the project both
on the university computers as well as on the work computers at BAC. Planning the
tests at USQ was the only resource management challenge as the testing period had to
be booked at a time when both the testing staff and project supervisor were available.
As testing was completed within one afternoon this challenge was easily overcome.
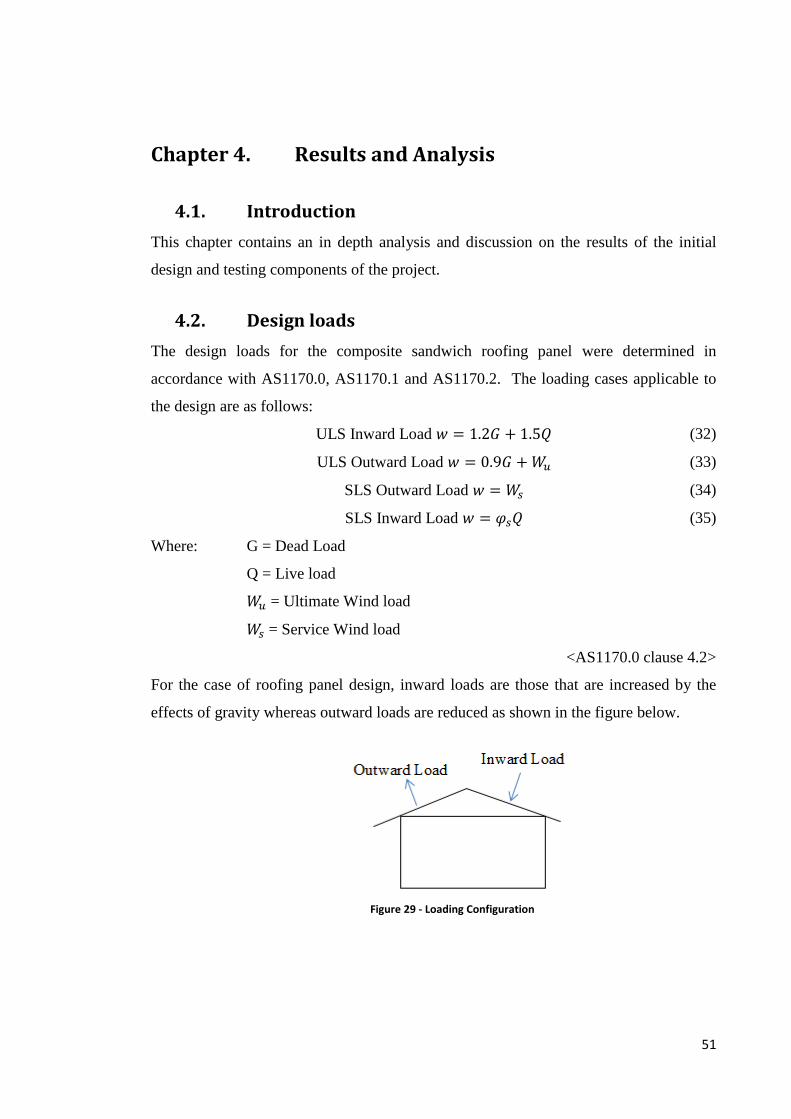
51
Chapter 4. Results and Analysis
4.1. Introduction
This chapter contains an in depth analysis and discussion on the results of the initial
design and testing components of the project.
4.2. Design loads
The design loads for the composite sandwich roofing panel were determined in
accordance with AS1170.0, AS1170.1 and AS1170.2. The loading cases applicable to
the design are as follows:
ULS Inward Load 𝑤 = 1.2𝐺 + 1.5𝑄 (32)
ULS Outward Load 𝑤 = 0.9𝐺 + 𝑊𝑢 (33)
SLS Outward Load 𝑤 = 𝑊𝑠 (34)
SLS Inward Load 𝑤 = 𝜑𝑠𝑄 (35)
Where: G = Dead Load
Q = Live load
𝑊𝑢 = Ultimate Wind load
𝑊𝑠 = Service Wind load
<AS1170.0 clause 4.2>
For the case of roofing panel design, inward loads are those that are increased by the
effects of gravity whereas outward loads are reduced as shown in the figure below.
Figure 29 - Loading Configuration
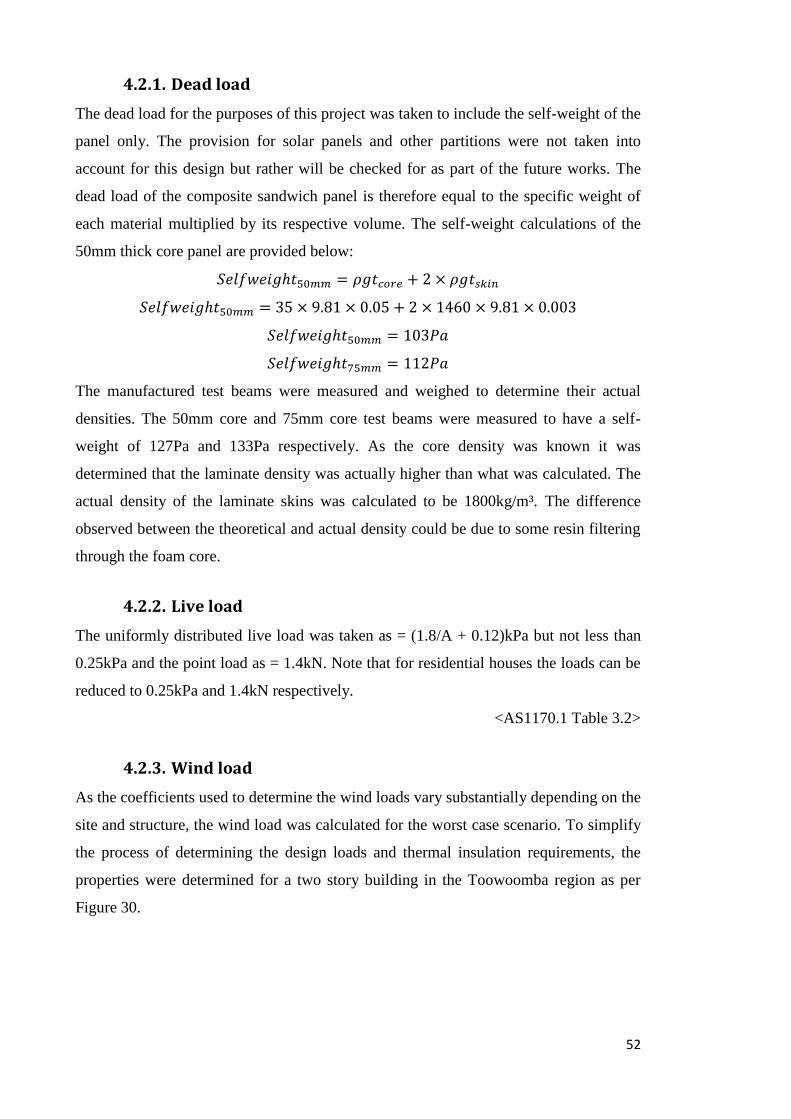
52
4.2.1. Dead load
The dead load for the purposes of this project was taken to include the self-weight of the
panel only. The provision for solar panels and other partitions were not taken into
account for this design but rather will be checked for as part of the future works. The
dead load of the composite sandwich panel is therefore equal to the specific weight of
each material multiplied by its respective volume. The self-weight calculations of the
50mm thick core panel are provided below:
𝑆𝑒𝑙𝑓𝑤𝑒𝑖𝑔ℎ𝑡50𝑚𝑚 = 𝜌𝑔𝑡𝑐𝑜𝑟𝑒 + 2 × 𝜌𝑔𝑡𝑠𝑘𝑖𝑛
𝑆𝑒𝑙𝑓𝑤𝑒𝑖𝑔ℎ𝑡50𝑚𝑚 = 35 × 9.81 × 0.05 + 2 × 1460 × 9.81 × 0.003
𝑆𝑒𝑙𝑓𝑤𝑒𝑖𝑔ℎ𝑡50𝑚𝑚 = 103𝑃𝑎
𝑆𝑒𝑙𝑓𝑤𝑒𝑖𝑔ℎ𝑡75𝑚𝑚 = 112𝑃𝑎
The manufactured test beams were measured and weighed to determine their actual
densities. The 50mm core and 75mm core test beams were measured to have a self-
weight of 127Pa and 133Pa respectively. As the core density was known it was
determined that the laminate density was actually higher than what was calculated. The
actual density of the laminate skins was calculated to be 1800kg/m³. The difference
observed between the theoretical and actual density could be due to some resin filtering
through the foam core.
4.2.2. Live load
The uniformly distributed live load was taken as = (1.8/A + 0.12)kPa but not less than
0.25kPa and the point load as = 1.4kN. Note that for residential houses the loads can be
reduced to 0.25kPa and 1.4kN respectively.
<AS1170.1 Table 3.2>
4.2.3. Wind load
As the coefficients used to determine the wind loads vary substantially depending on the
site and structure, the wind load was calculated for the worst case scenario. To simplify
the process of determining the design loads and thermal insulation requirements, the
properties were determined for a two story building in the Toowoomba region as per
Figure 30.
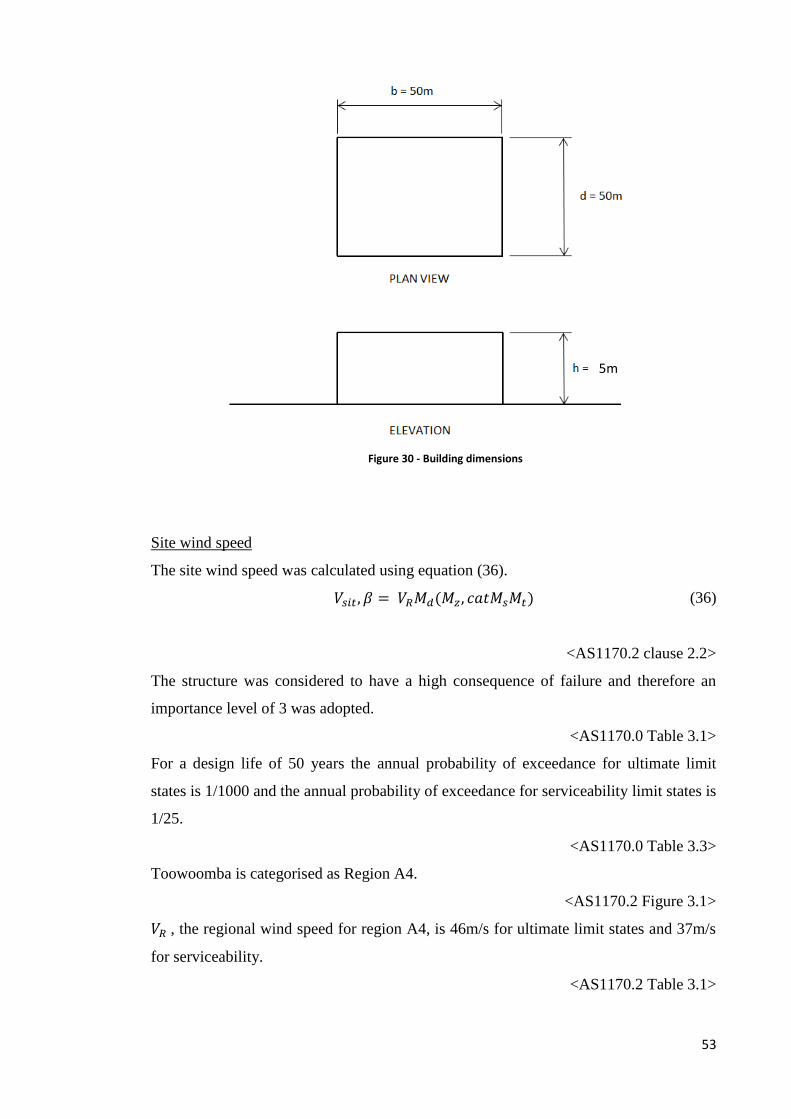
53
Figure 30 - Building dimensions
Site wind speed
The site wind speed was calculated using equation (36).
𝑉𝑠𝑖𝑡, 𝛽 = 𝑉𝑅𝑀𝑑(𝑀𝑧 , 𝑐𝑎𝑡𝑀𝑠𝑀𝑡) (36)
<AS1170.2 clause 2.2>
The structure was considered to have a high consequence of failure and therefore an
importance level of 3 was adopted.
<AS1170.0 Table 3.1>
For a design life of 50 years the annual probability of exceedance for ultimate limit
states is 1/1000 and the annual probability of exceedance for serviceability limit states is
1/25.
<AS1170.0 Table 3.3>
Toowoomba is categorised as Region A4.
<AS1170.2 Figure 3.1>
𝑉𝑅 , the regional wind speed for region A4, is 46m/s for ultimate limit states and 37m/s
for serviceability.
<AS1170.2 Table 3.1>
5m
54
The worst case wind directional multiplier (𝑀𝑑) is 0.95 for the Westerly direction
however 𝑀𝑑 was taken as 1.0 to allow for any direction.
<AS1170.2 Table 3.2>
Terrain category was taken as TC1 for worst case.
<AS1170.2 clause 4.2.1>
Roof height = 5m therefore the Terrain/height multiplier (𝑀𝑧 , 𝑐𝑎𝑡) was taken as 1.12.
<AS1170.2 Table 4.1>
Assumed no shielding 𝑀𝑠 = 1.0
<AS1170.2 Table 4.3>
Allowed for structure to be located for worst case on a hill 𝑀𝑡 = 1.5
<AS1170.2 Table 4.3>
For ultimate limit states:
𝑉𝑠𝑖𝑡 = (46)(1.0)(1.12)(1.1)(1.5)
𝑉𝑠𝑖𝑡 = 85 𝑚/𝑠
For serviceability:
𝑉𝑠𝑖𝑡 = (37)(1.0)(1.12)(1.1)(1.5)
𝑉𝑠𝑖𝑡 = 68 𝑚/𝑠
<AS1170.2 clause 2.2>
The design wind speed was taken as the site wind speed based on the assumption that
the building faces are perpendicular to the cardinal directions.
<AS1170.2 clause 2.3>
Design wind pressure
The design wind pressure was calculated using equation (37).
𝑃 = (0.5𝜌𝑎𝑖𝑟)[𝑉𝑑𝑒𝑠𝜃]2𝐶𝑓𝑖𝑔𝐶𝑑𝑦𝑛 (37)
<AS1170.2 clause 2.4.1>
𝜌𝑎𝑖𝑟= 1.2kg/𝑚3
Assuming none of the structural elements will have a natural frequency less than 1.0Hz
therefore 𝐶𝑑𝑦𝑛 = 1.0.
For ultimate limit states:
𝑃 = 4335𝐶𝑓𝑖𝑔
For serviceability:
𝑃 = 2774.4𝐶𝑓𝑖𝑔
There for 𝑃𝑠𝑒𝑟𝑖𝑐𝑒𝑎𝑏𝑖𝑙𝑖𝑡𝑦 = 0.64𝑃𝑢𝑙𝑡𝑖𝑚𝑎𝑡𝑒
55
The aerodynamic shape factors (𝐶𝑓𝑖𝑔) for external and internal pressure were calculated
using equation (38) and (39) respectively.
𝐶𝑓𝑖𝑔 = 𝐶𝑝𝑒𝐾𝑎𝐾𝑐𝐾𝑙𝐾𝑝 (38)
𝐶𝑓𝑖𝑔 = 𝐶𝑝𝑖𝐾𝑐 (39)
<AS1170.2 clause 5.2>
For internal pressure the worst case will occur when 𝐶𝑓𝑖𝑔 is maximum positive value.
For worst case (windward wall permeable, all others impermeable) 𝐶𝑝𝑖 = 0.6.
<AS1170.2 Table 5.1(A)>
For external pressure the worst case will occur when 𝐶𝑓𝑖𝑔 is maximum negative value.
Allowing for an h/d ratio greater than 1 and a roof pitch less than 10°, 𝐶𝑝𝑒 = -1.2.
<AS1170.2 Table 5.3(B)>
The area reduction factor was taken as 𝐾𝑎 = 1.0 for worst case.
<AS1170.2 Table 5.4>
Both combination factors were taken as 𝐾𝑐𝑒 and 𝐾𝑐𝑖 = 0.9 assuming two effective
surfaces.
<AS1170.2 Table 5.5>
Local pressure factor (𝐾𝑙) was taken as 3.0 for upwind corners of roofs with pitch <10°.
<AS1170.2 Table 5.6>
The permeable cladding reduction factor was taken as (𝐾𝑝) = 1.0 as composite sandwich
panels are non-permeable.
<AS1170.2 Table 5.8>
For external:
𝐶𝑓𝑖𝑔 = 𝐶𝑝𝑒𝐾𝑎𝐾𝑐𝐾𝑙𝐾𝑝
𝐶𝑓𝑖𝑔 = (−1.2)(1.0)(0.9)(3.0)(1.0)
𝐶𝑓𝑖𝑔 = −3.24
𝑃𝑒 = 4335𝐶𝑓𝑖𝑔
𝑃𝑒 = 4335(−3.24)
𝑃𝑒 = −14.1𝑘𝑃𝑎
For internal:
𝐶𝑓𝑖𝑔 = 𝐶𝑝𝑖𝐾𝑐
𝐶𝑓𝑖𝑔 = (0.6)(0.9)
𝐶𝑓𝑖𝑔 = 0.54
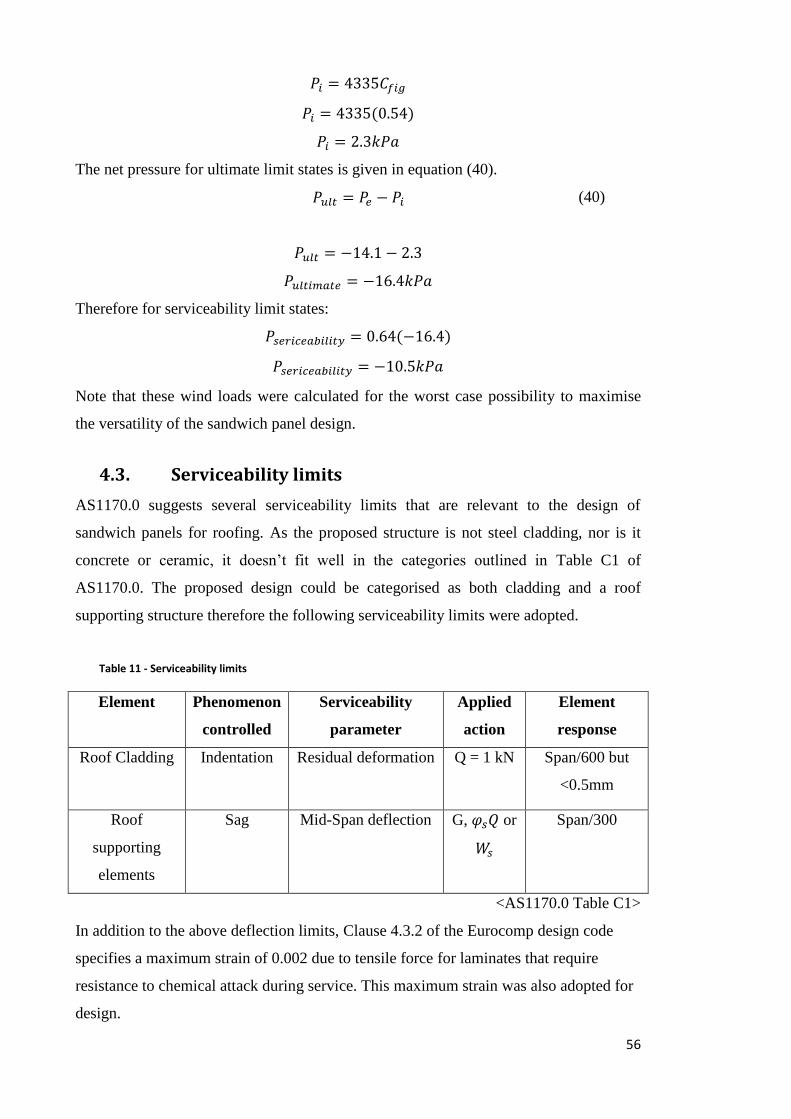
56
𝑃𝑖 = 4335𝐶𝑓𝑖𝑔
𝑃𝑖 = 4335(0.54)
𝑃𝑖 = 2.3𝑘𝑃𝑎
The net pressure for ultimate limit states is given in equation (40).
𝑃𝑢𝑙𝑡 = 𝑃𝑒 − 𝑃𝑖 (40)
𝑃𝑢𝑙𝑡 = −14.1 − 2.3
𝑃𝑢𝑙𝑡𝑖𝑚𝑎𝑡𝑒 = −16.4𝑘𝑃𝑎
Therefore for serviceability limit states:
𝑃𝑠𝑒𝑟𝑖𝑐𝑒𝑎𝑏𝑖𝑙𝑖𝑡𝑦 = 0.64(−16.4)
𝑃𝑠𝑒𝑟𝑖𝑐𝑒𝑎𝑏𝑖𝑙𝑖𝑡𝑦 = −10.5𝑘𝑃𝑎
Note that these wind loads were calculated for the worst case possibility to maximise
the versatility of the sandwich panel design.
4.3. Serviceability limits
AS1170.0 suggests several serviceability limits that are relevant to the design of
sandwich panels for roofing. As the proposed structure is not steel cladding, nor is it
concrete or ceramic, it doesn’t fit well in the categories outlined in Table C1 of
AS1170.0. The proposed design could be categorised as both cladding and a roof
supporting structure therefore the following serviceability limits were adopted.
Table 11 - Serviceability limits
Element Phenomenon
controlled
Serviceability
parameter
Applied
action
Element
response
Roof Cladding Indentation Residual deformation Q = 1 kN Span/600 but
<0.5mm
Roof
supporting
elements
Sag Mid-Span deflection G, 𝜑𝑠𝑄 or
𝑊𝑠
Span/300
<AS1170.0 Table C1>
In addition to the above deflection limits, Clause 4.3.2 of the Eurocomp design code
specifies a maximum strain of 0.002 due to tensile force for laminates that require
resistance to chemical attack during service. This maximum strain was also adopted for
design.
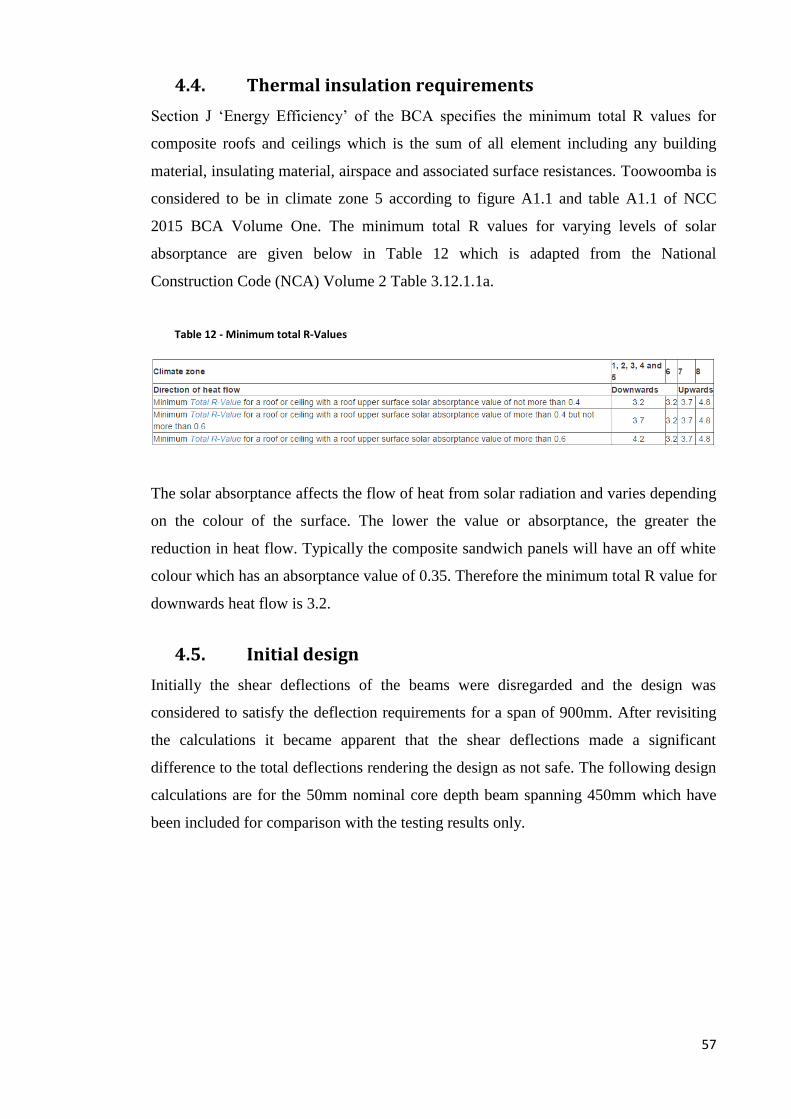
57
4.4. Thermal insulation requirements
Section J ‘Energy Efficiency’ of the BCA specifies the minimum total R values for
composite roofs and ceilings which is the sum of all element including any building
material, insulating material, airspace and associated surface resistances. Toowoomba is
considered to be in climate zone 5 according to figure A1.1 and table A1.1 of NCC
2015 BCA Volume One. The minimum total R values for varying levels of solar
absorptance are given below in Table 12 which is adapted from the National
Construction Code (NCA) Volume 2 Table 3.12.1.1a.
Table 12 - Minimum total R-Values
The solar absorptance affects the flow of heat from solar radiation and varies depending
on the colour of the surface. The lower the value or absorptance, the greater the
reduction in heat flow. Typically the composite sandwich panels will have an off white
colour which has an absorptance value of 0.35. Therefore the minimum total R value for
downwards heat flow is 3.2.
4.5. Initial design
Initially the shear deflections of the beams were disregarded and the design was
considered to satisfy the deflection requirements for a span of 900mm. After revisiting
the calculations it became apparent that the shear deflections made a significant
difference to the total deflections rendering the design as not safe. The following design
calculations are for the 50mm nominal core depth beam spanning 450mm which have
been included for comparison with the testing results only.
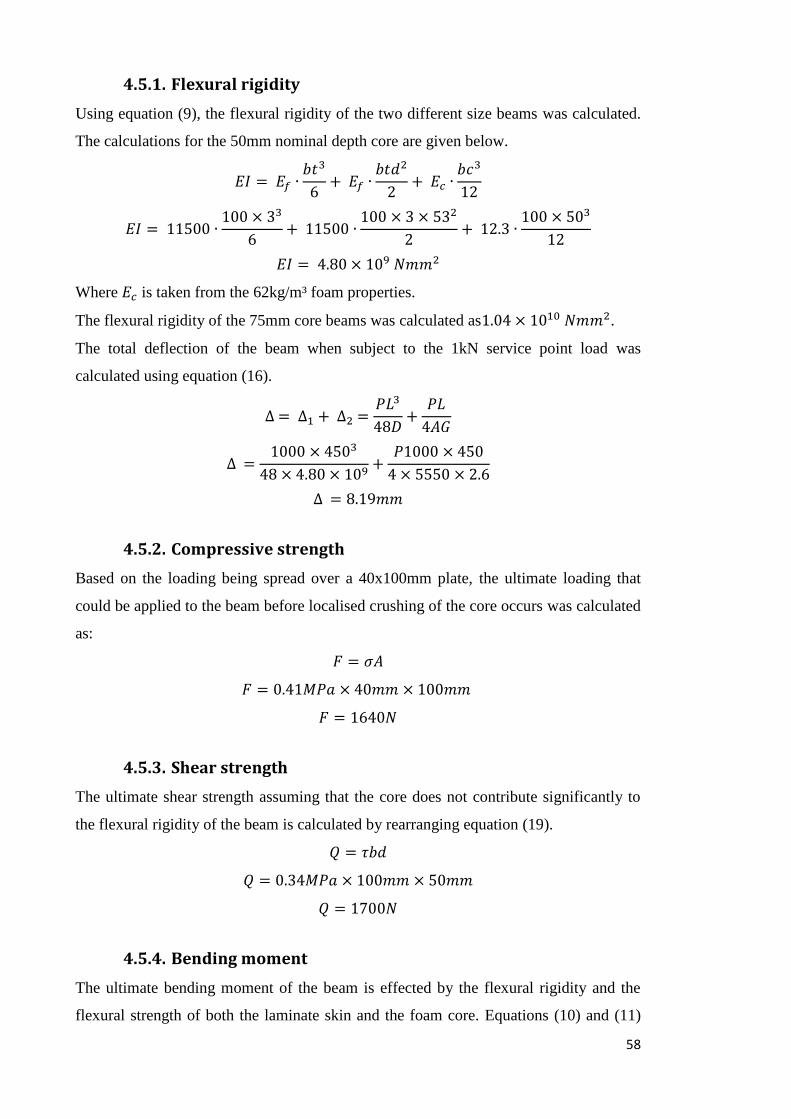
58
4.5.1. Flexural rigidity
Using equation (9), the flexural rigidity of the two different size beams was calculated.
The calculations for the 50mm nominal depth core are given below.
𝐸𝐼 = 𝐸𝑓 ∙𝑏𝑡3
6+ 𝐸𝑓 ∙
𝑏𝑡𝑑2
2+ 𝐸𝑐 ∙
𝑏𝑐3
12
𝐸𝐼 = 11500 ∙100 × 33
6+ 11500 ∙
100 × 3 × 532
2+ 12.3 ∙
100 × 503
12
𝐸𝐼 = 4.80 × 10⁹ 𝑁𝑚𝑚2
Where 𝐸𝑐 is taken from the 62kg/m³ foam properties.
The flexural rigidity of the 75mm core beams was calculated as1.04 × 1010 𝑁𝑚𝑚2.
The total deflection of the beam when subject to the 1kN service point load was
calculated using equation (16).
∆ = ∆1 + ∆2 =𝑃𝐿3
48𝐷+
𝑃𝐿
4𝐴𝐺
∆ =1000 × 4503
48 × 4.80 × 109+
𝑃1000 × 450
4 × 5550 × 2.6
∆ = 8.19𝑚𝑚
4.5.2. Compressive strength
Based on the loading being spread over a 40x100mm plate, the ultimate loading that
could be applied to the beam before localised crushing of the core occurs was calculated
as:
𝐹 = 𝜎𝐴
𝐹 = 0.41𝑀𝑃𝑎 × 40𝑚𝑚 × 100𝑚𝑚
𝐹 = 1640𝑁
4.5.3. Shear strength
The ultimate shear strength assuming that the core does not contribute significantly to
the flexural rigidity of the beam is calculated by rearranging equation (19).
𝑄 = 𝜏𝑏𝑑
𝑄 = 0.34𝑀𝑃𝑎 × 100𝑚𝑚 × 50𝑚𝑚
𝑄 = 1700𝑁
4.5.4. Bending moment
The ultimate bending moment of the beam is effected by the flexural rigidity and the
flexural strength of both the laminate skin and the foam core. Equations (10) and (11)
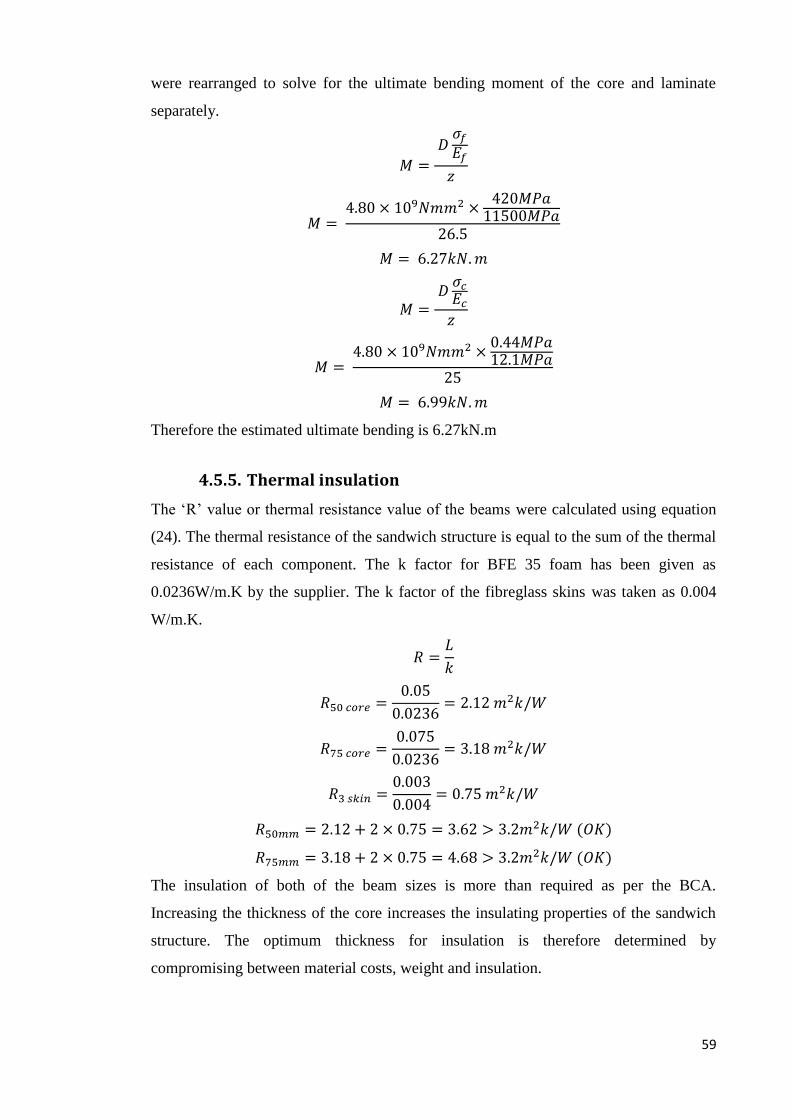
59
were rearranged to solve for the ultimate bending moment of the core and laminate
separately.
𝑀 =
𝐷𝜎𝑓
𝐸𝑓
𝑧
𝑀 = 4.80 × 10⁹𝑁𝑚𝑚2 ×
420𝑀𝑃𝑎11500𝑀𝑃𝑎
26.5
𝑀 = 6.27𝑘𝑁. 𝑚
𝑀 = 𝐷
𝜎𝑐
𝐸𝑐
𝑧
𝑀 = 4.80 × 10⁹𝑁𝑚𝑚2 ×
0.44𝑀𝑃𝑎12.1𝑀𝑃𝑎
25
𝑀 = 6.99𝑘𝑁. 𝑚
Therefore the estimated ultimate bending is 6.27kN.m
4.5.5. Thermal insulation
The ‘R’ value or thermal resistance value of the beams were calculated using equation
(24). The thermal resistance of the sandwich structure is equal to the sum of the thermal
resistance of each component. The k factor for BFE 35 foam has been given as
0.0236W/m.K by the supplier. The k factor of the fibreglass skins was taken as 0.004
W/m.K.
𝑅 =𝐿
𝑘
𝑅50 𝑐𝑜𝑟𝑒 =0.05
0.0236= 2.12 𝑚2𝑘/𝑊
𝑅75 𝑐𝑜𝑟𝑒 =0.075
0.0236= 3.18 𝑚2𝑘/𝑊
𝑅3 𝑠𝑘𝑖𝑛 =0.003
0.004= 0.75 𝑚2𝑘/𝑊
𝑅50𝑚𝑚 = 2.12 + 2 × 0.75 = 3.62 > 3.2𝑚2𝑘/𝑊 (𝑂𝐾)
𝑅75𝑚𝑚 = 3.18 + 2 × 0.75 = 4.68 > 3.2𝑚2𝑘/𝑊 (𝑂𝐾)
The insulation of both of the beam sizes is more than required as per the BCA.
Increasing the thickness of the core increases the insulating properties of the sandwich
structure. The optimum thickness for insulation is therefore determined by
compromising between material costs, weight and insulation.
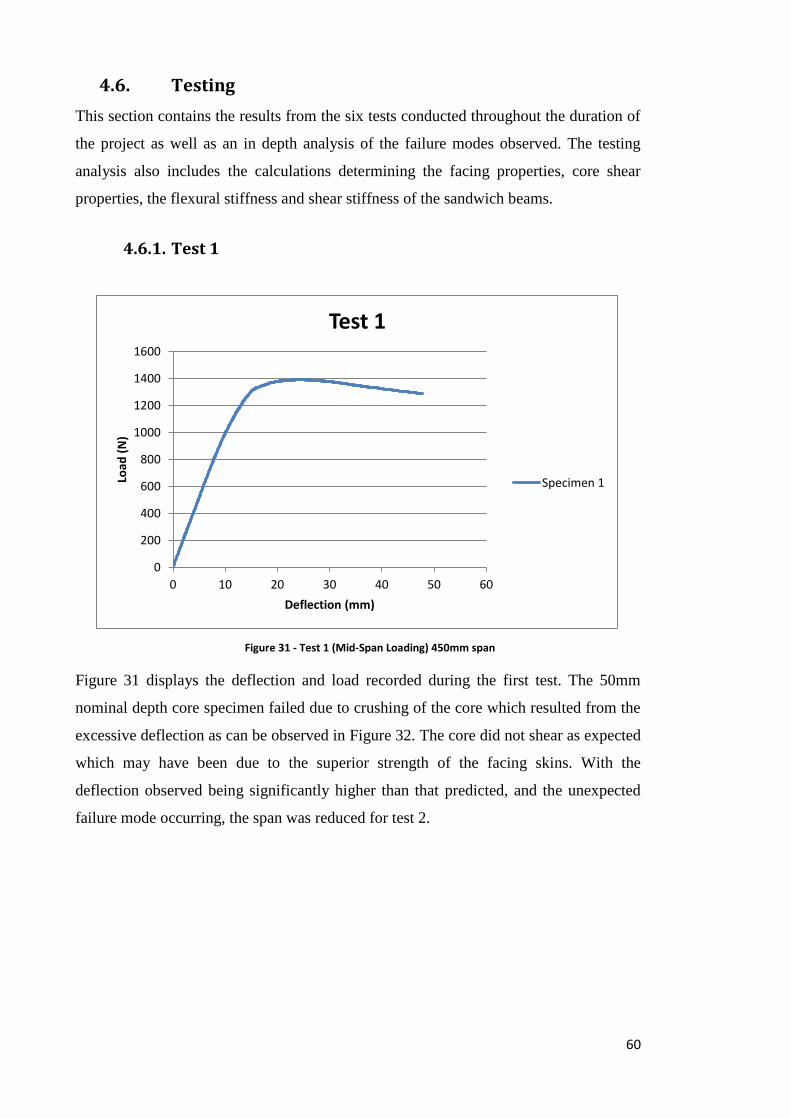
60
4.6. Testing
This section contains the results from the six tests conducted throughout the duration of
the project as well as an in depth analysis of the failure modes observed. The testing
analysis also includes the calculations determining the facing properties, core shear
properties, the flexural stiffness and shear stiffness of the sandwich beams.
4.6.1. Test 1
Figure 31 - Test 1 (Mid-Span Loading) 450mm span
Figure 31 displays the deflection and load recorded during the first test. The 50mm
nominal depth core specimen failed due to crushing of the core which resulted from the
excessive deflection as can be observed in Figure 32. The core did not shear as expected
which may have been due to the superior strength of the facing skins. With the
deflection observed being significantly higher than that predicted, and the unexpected
failure mode occurring, the span was reduced for test 2.
0
200
400
600
800
1000
1200
1400
1600
0 10 20 30 40 50 60
Load
(N
)
Deflection (mm)
Test 1
Specimen 1
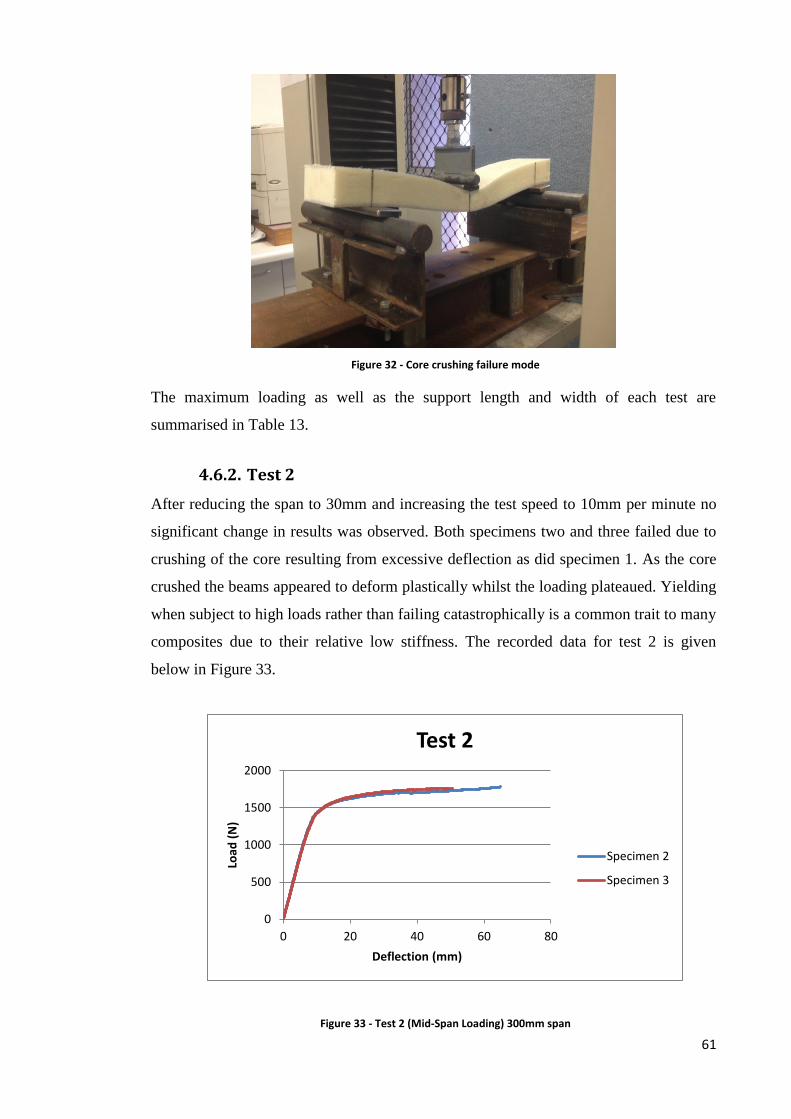
61
Figure 32 - Core crushing failure mode
The maximum loading as well as the support length and width of each test are
summarised in Table 13.
4.6.2. Test 2
After reducing the span to 30mm and increasing the test speed to 10mm per minute no
significant change in results was observed. Both specimens two and three failed due to
crushing of the core resulting from excessive deflection as did specimen 1. As the core
crushed the beams appeared to deform plastically whilst the loading plateaued. Yielding
when subject to high loads rather than failing catastrophically is a common trait to many
composites due to their relative low stiffness. The recorded data for test 2 is given
below in Figure 33.
Figure 33 - Test 2 (Mid-Span Loading) 300mm span
0
500
1000
1500
2000
0 20 40 60 80
Load
(N
)
Deflection (mm)
Test 2
Specimen 2
Specimen 3
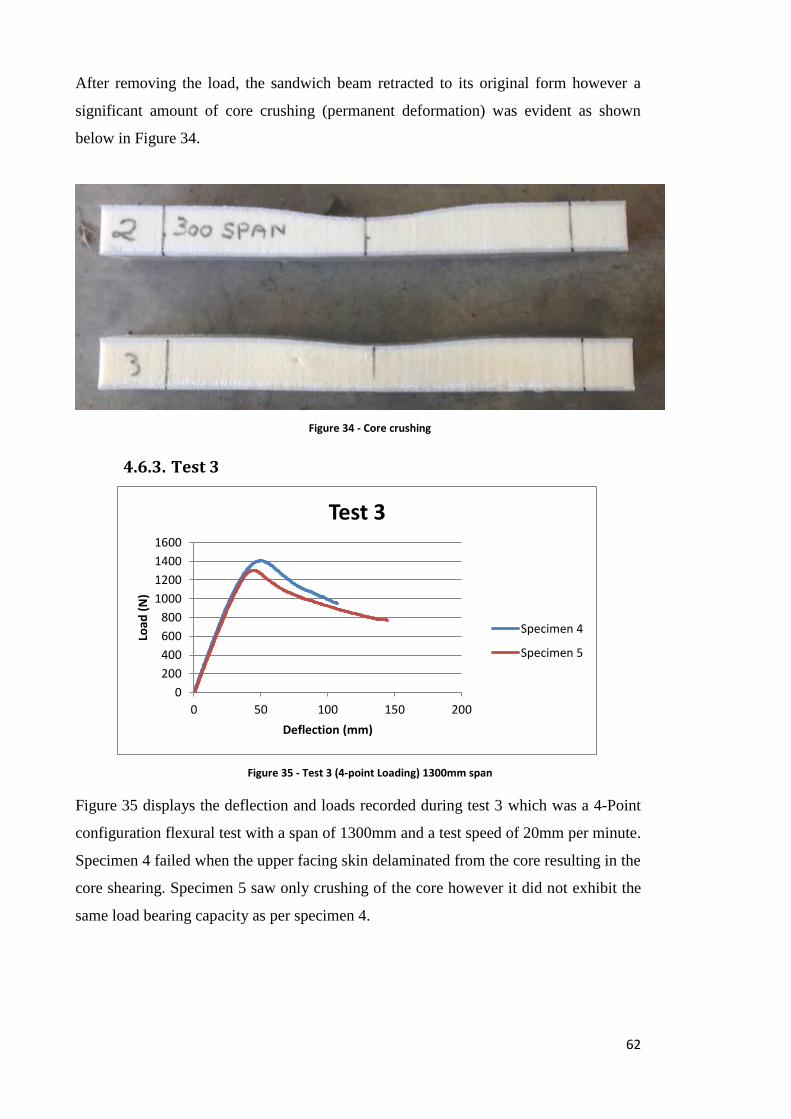
62
After removing the load, the sandwich beam retracted to its original form however a
significant amount of core crushing (permanent deformation) was evident as shown
below in Figure 34.
Figure 34 - Core crushing
4.6.3. Test 3
Figure 35 - Test 3 (4-point Loading) 1300mm span
Figure 35 displays the deflection and loads recorded during test 3 which was a 4-Point
configuration flexural test with a span of 1300mm and a test speed of 20mm per minute.
Specimen 4 failed when the upper facing skin delaminated from the core resulting in the
core shearing. Specimen 5 saw only crushing of the core however it did not exhibit the
same load bearing capacity as per specimen 4.
0
200
400
600
800
1000
1200
1400
1600
0 50 100 150 200
Load
(N
)
Deflection (mm)
Test 3
Specimen 4
Specimen 5
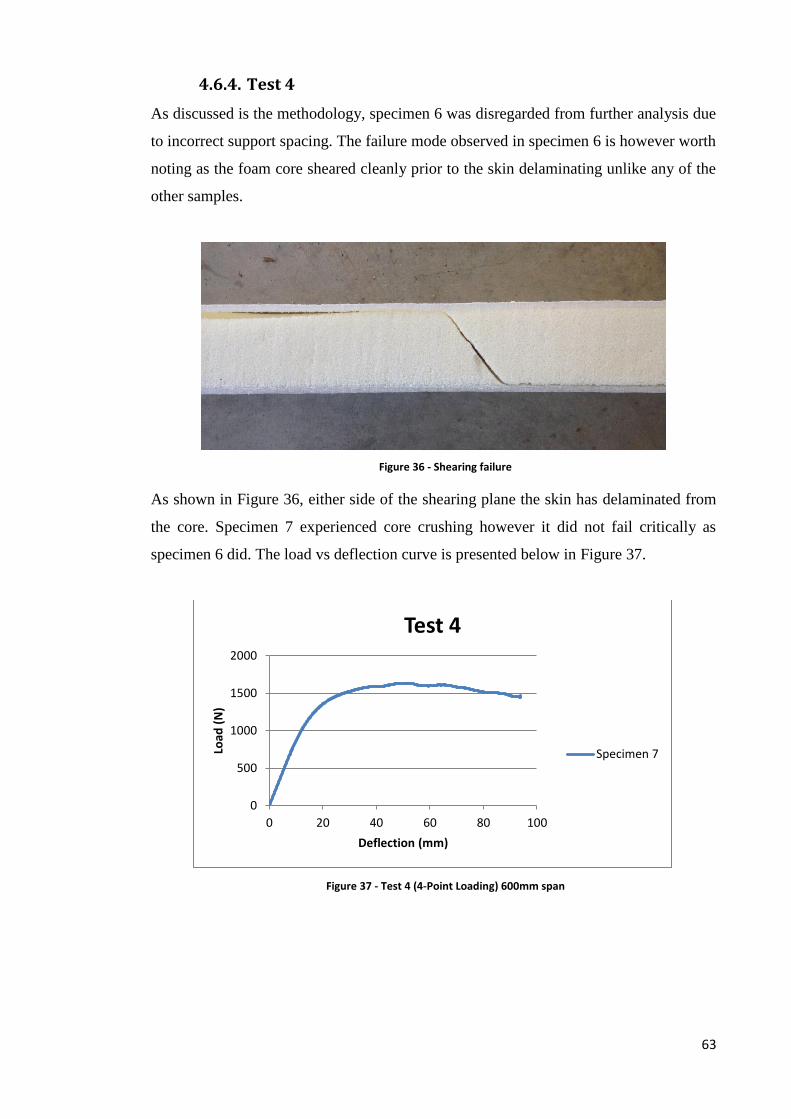
63
4.6.4. Test 4
As discussed is the methodology, specimen 6 was disregarded from further analysis due
to incorrect support spacing. The failure mode observed in specimen 6 is however worth
noting as the foam core sheared cleanly prior to the skin delaminating unlike any of the
other samples.
Figure 36 - Shearing failure
As shown in Figure 36, either side of the shearing plane the skin has delaminated from
the core. Specimen 7 experienced core crushing however it did not fail critically as
specimen 6 did. The load vs deflection curve is presented below in Figure 37.
Figure 37 - Test 4 (4-Point Loading) 600mm span
0
500
1000
1500
2000
0 20 40 60 80 100
Load
(N
)
Deflection (mm)
Test 4
Specimen 7
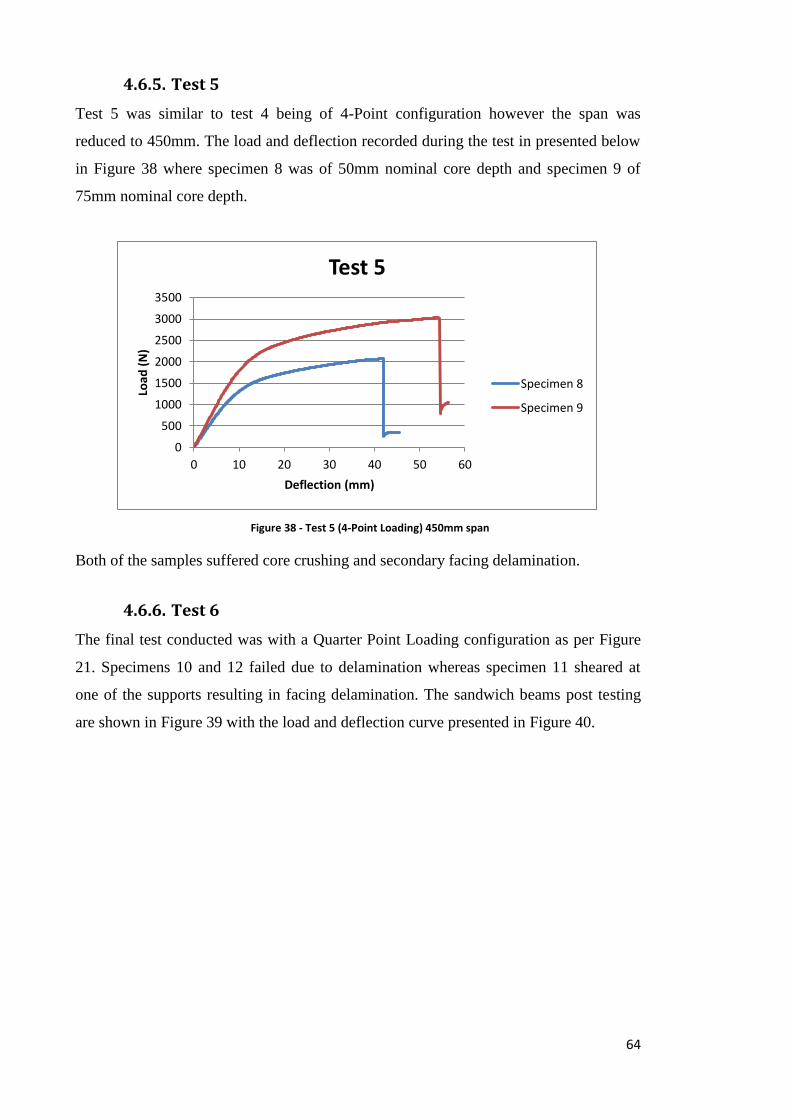
64
4.6.5. Test 5
Test 5 was similar to test 4 being of 4-Point configuration however the span was
reduced to 450mm. The load and deflection recorded during the test in presented below
in Figure 38 where specimen 8 was of 50mm nominal core depth and specimen 9 of
75mm nominal core depth.
Figure 38 - Test 5 (4-Point Loading) 450mm span
Both of the samples suffered core crushing and secondary facing delamination.
4.6.6. Test 6
The final test conducted was with a Quarter Point Loading configuration as per Figure
21. Specimens 10 and 12 failed due to delamination whereas specimen 11 sheared at
one of the supports resulting in facing delamination. The sandwich beams post testing
are shown in Figure 39 with the load and deflection curve presented in Figure 40.
0
500
1000
1500
2000
2500
3000
3500
0 10 20 30 40 50 60
Load
(N
)
Deflection (mm)
Test 5
Specimen 8
Specimen 9
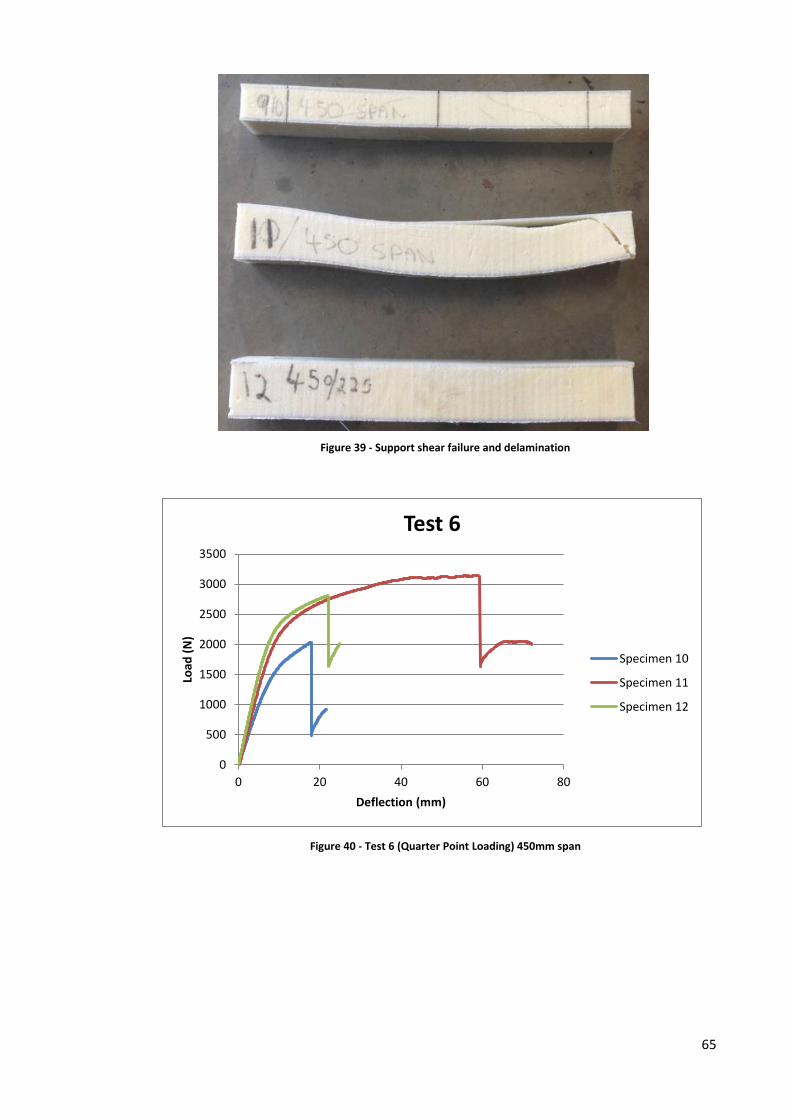
65
Figure 39 - Support shear failure and delamination
Figure 40 - Test 6 (Quarter Point Loading) 450mm span
0
500
1000
1500
2000
2500
3000
3500
0 20 40 60 80
Load
(N
)
Deflection (mm)
Test 6
Specimen 10
Specimen 11
Specimen 12
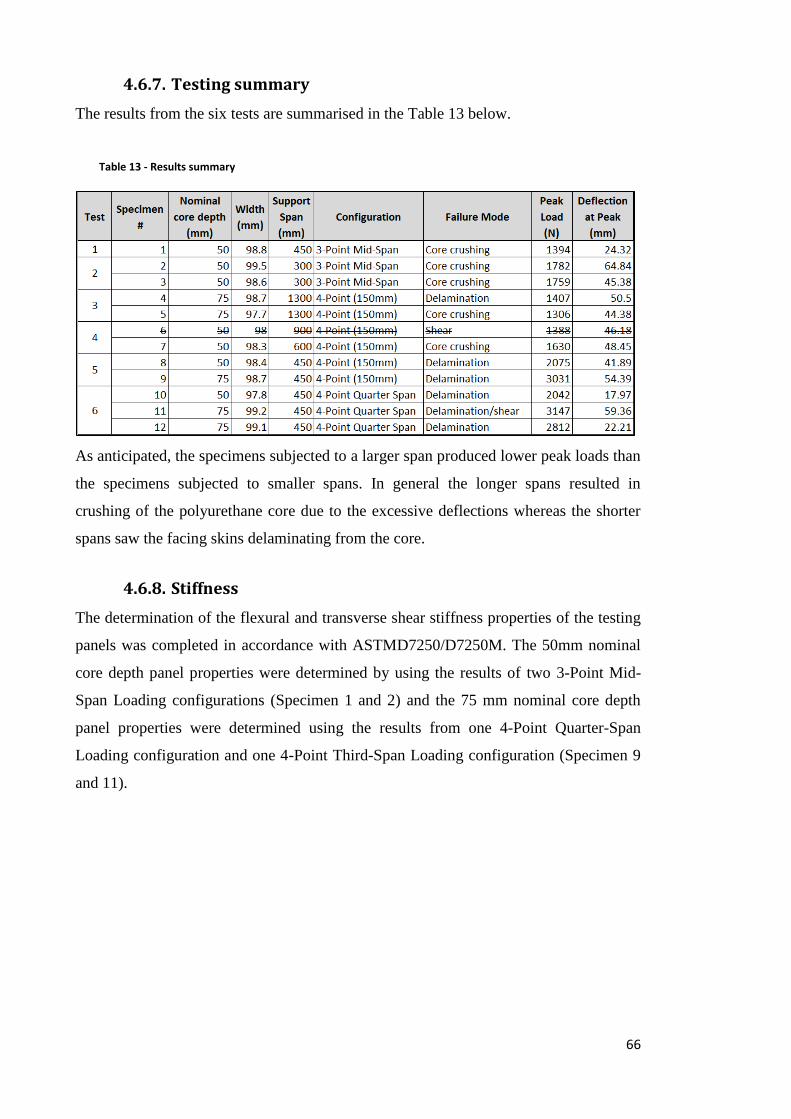
66
4.6.7. Testing summary
The results from the six tests are summarised in the Table 13 below.
Table 13 - Results summary
As anticipated, the specimens subjected to a larger span produced lower peak loads than
the specimens subjected to smaller spans. In general the longer spans resulted in
crushing of the polyurethane core due to the excessive deflections whereas the shorter
spans saw the facing skins delaminating from the core.
4.6.8. Stiffness
The determination of the flexural and transverse shear stiffness properties of the testing
panels was completed in accordance with ASTMD7250/D7250M. The 50mm nominal
core depth panel properties were determined by using the results of two 3-Point Mid-
Span Loading configurations (Specimen 1 and 2) and the 75 mm nominal core depth
panel properties were determined using the results from one 4-Point Quarter-Span
Loading configuration and one 4-Point Third-Span Loading configuration (Specimen 9
and 11).
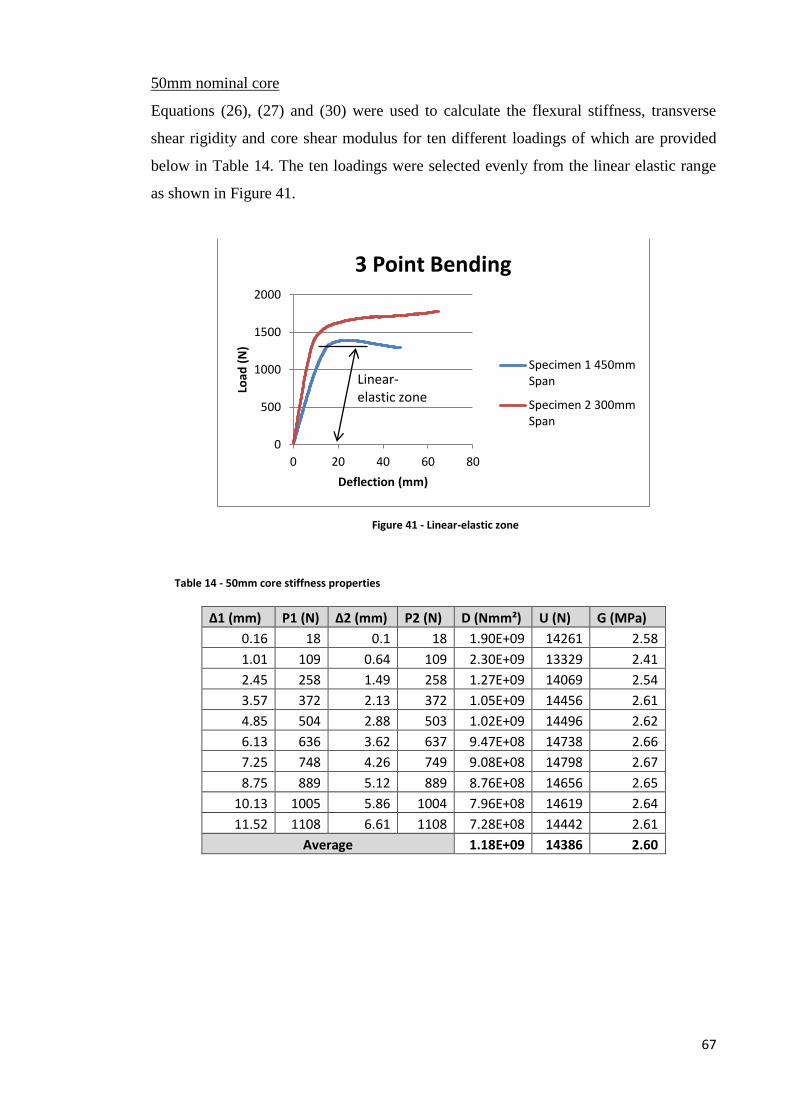
67
50mm nominal core
Equations (26), (27) and (30) were used to calculate the flexural stiffness, transverse
shear rigidity and core shear modulus for ten different loadings of which are provided
below in Table 14. The ten loadings were selected evenly from the linear elastic range
as shown in Figure 41.
Figure 41 - Linear-elastic zone
Table 14 - 50mm core stiffness properties
Δ1 (mm) P1 (N) Δ2 (mm) P2 (N) D (Nmm²) U (N) G (MPa)
0.16 18 0.1 18 1.90E+09 14261 2.58
1.01 109 0.64 109 2.30E+09 13329 2.41
2.45 258 1.49 258 1.27E+09 14069 2.54
3.57 372 2.13 372 1.05E+09 14456 2.61
4.85 504 2.88 503 1.02E+09 14496 2.62
6.13 636 3.62 637 9.47E+08 14738 2.66
7.25 748 4.26 749 9.08E+08 14798 2.67
8.75 889 5.12 889 8.76E+08 14656 2.65
10.13 1005 5.86 1004 7.96E+08 14619 2.64
11.52 1108 6.61 1108 7.28E+08 14442 2.61
Average 1.18E+09 14386 2.60
0
500
1000
1500
2000
0 20 40 60 80
Load
(N
)
Deflection (mm)
3 Point Bending
Specimen 1 450mmSpan
Specimen 2 300mmSpan
Linear-elastic zone
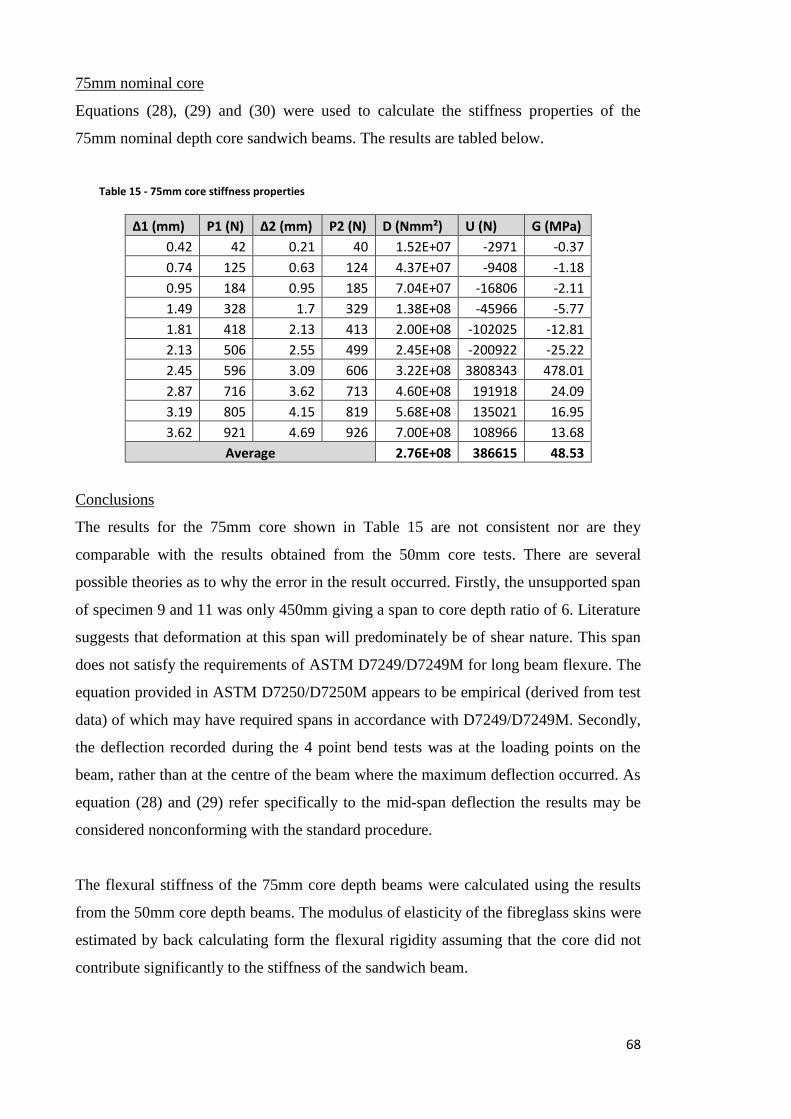
68
75mm nominal core
Equations (28), (29) and (30) were used to calculate the stiffness properties of the
75mm nominal depth core sandwich beams. The results are tabled below.
Table 15 - 75mm core stiffness properties
Δ1 (mm) P1 (N) Δ2 (mm) P2 (N) D (Nmm²) U (N) G (MPa)
0.42 42 0.21 40 1.52E+07 -2971 -0.37
0.74 125 0.63 124 4.37E+07 -9408 -1.18
0.95 184 0.95 185 7.04E+07 -16806 -2.11
1.49 328 1.7 329 1.38E+08 -45966 -5.77
1.81 418 2.13 413 2.00E+08 -102025 -12.81
2.13 506 2.55 499 2.45E+08 -200922 -25.22
2.45 596 3.09 606 3.22E+08 3808343 478.01
2.87 716 3.62 713 4.60E+08 191918 24.09
3.19 805 4.15 819 5.68E+08 135021 16.95
3.62 921 4.69 926 7.00E+08 108966 13.68
Average 2.76E+08 386615 48.53
Conclusions
The results for the 75mm core shown in Table 15 are not consistent nor are they
comparable with the results obtained from the 50mm core tests. There are several
possible theories as to why the error in the result occurred. Firstly, the unsupported span
of specimen 9 and 11 was only 450mm giving a span to core depth ratio of 6. Literature
suggests that deformation at this span will predominately be of shear nature. This span
does not satisfy the requirements of ASTM D7249/D7249M for long beam flexure. The
equation provided in ASTM D7250/D7250M appears to be empirical (derived from test
data) of which may have required spans in accordance with D7249/D7249M. Secondly,
the deflection recorded during the 4 point bend tests was at the loading points on the
beam, rather than at the centre of the beam where the maximum deflection occurred. As
equation (28) and (29) refer specifically to the mid-span deflection the results may be
considered nonconforming with the standard procedure.
The flexural stiffness of the 75mm core depth beams were calculated using the results
from the 50mm core depth beams. The modulus of elasticity of the fibreglass skins were
estimated by back calculating form the flexural rigidity assuming that the core did not
contribute significantly to the stiffness of the sandwich beam.
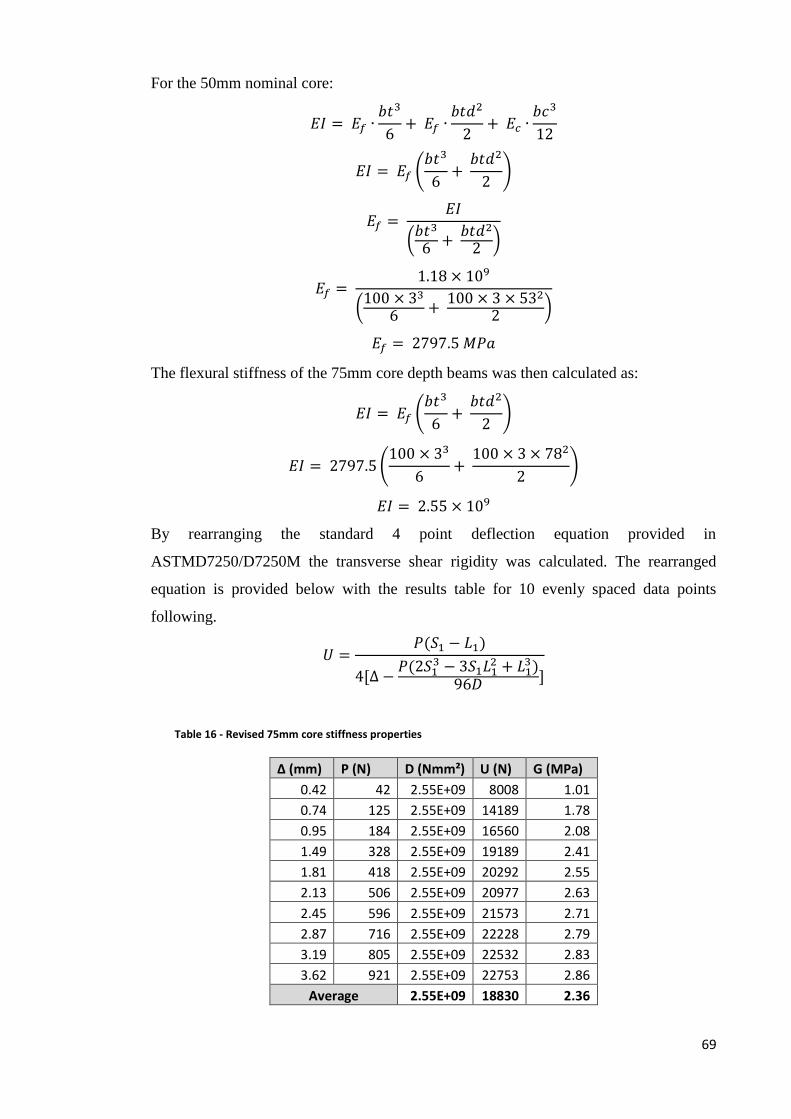
69
For the 50mm nominal core:
𝐸𝐼 = 𝐸𝑓 ∙𝑏𝑡3
6+ 𝐸𝑓 ∙
𝑏𝑡𝑑2
2+ 𝐸𝑐 ∙
𝑏𝑐3
12
𝐸𝐼 = 𝐸𝑓 (𝑏𝑡3
6+
𝑏𝑡𝑑2
2)
𝐸𝑓 = 𝐸𝐼
(𝑏𝑡3
6 + 𝑏𝑡𝑑2
2 )
𝐸𝑓 = 1.18 × 10⁹
(100 × 33
6 + 100 × 3 × 532
2 )
𝐸𝑓 = 2797.5 𝑀𝑃𝑎
The flexural stiffness of the 75mm core depth beams was then calculated as:
𝐸𝐼 = 𝐸𝑓 (𝑏𝑡3
6+
𝑏𝑡𝑑2
2)
𝐸𝐼 = 2797.5 (100 × 33
6+
100 × 3 × 782
2)
𝐸𝐼 = 2.55 × 10⁹
By rearranging the standard 4 point deflection equation provided in
ASTMD7250/D7250M the transverse shear rigidity was calculated. The rearranged
equation is provided below with the results table for 10 evenly spaced data points
following.
𝑈 =𝑃(𝑆1 − 𝐿1)
4[∆ −𝑃(2𝑆1
3 − 3𝑆1𝐿12 + 𝐿1
3)96𝐷 ]
Table 16 - Revised 75mm core stiffness properties
Δ (mm) P (N) D (Nmm²) U (N) G (MPa)
0.42 42 2.55E+09 8008 1.01
0.74 125 2.55E+09 14189 1.78
0.95 184 2.55E+09 16560 2.08
1.49 328 2.55E+09 19189 2.41
1.81 418 2.55E+09 20292 2.55
2.13 506 2.55E+09 20977 2.63
2.45 596 2.55E+09 21573 2.71
2.87 716 2.55E+09 22228 2.79
3.19 805 2.55E+09 22532 2.83
3.62 921 2.55E+09 22753 2.86
Average 2.55E+09 18830 2.36
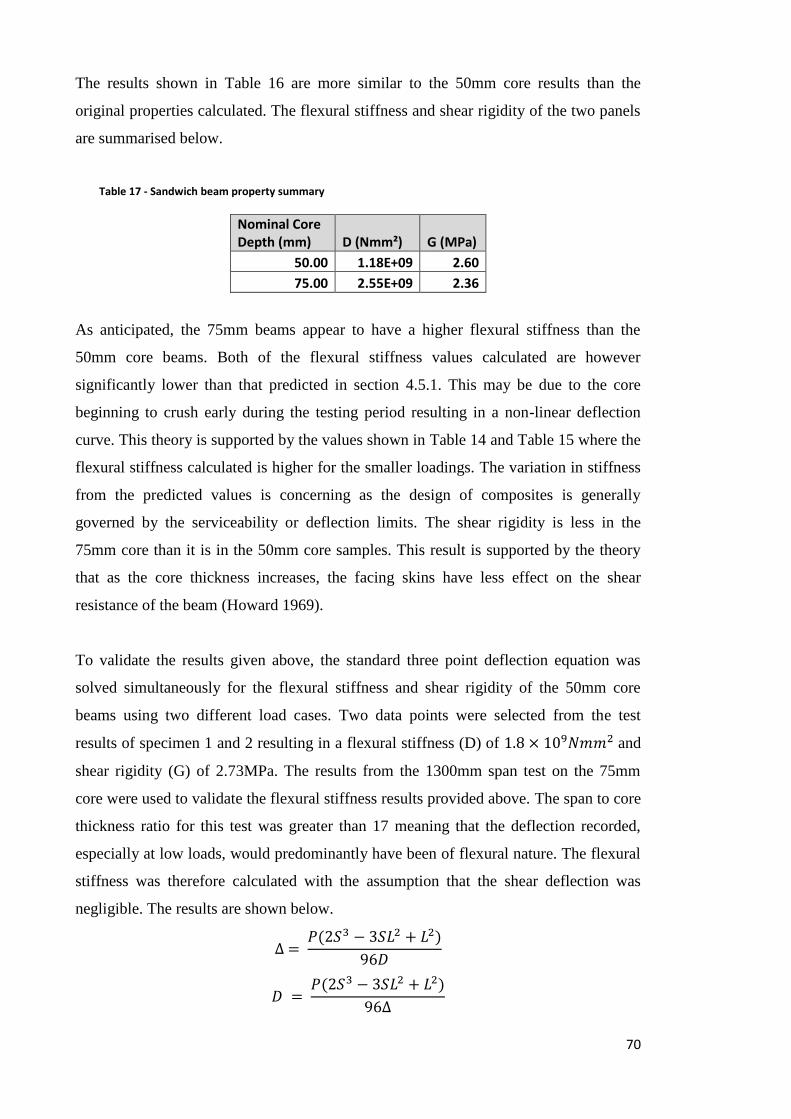
70
The results shown in Table 16 are more similar to the 50mm core results than the
original properties calculated. The flexural stiffness and shear rigidity of the two panels
are summarised below.
Table 17 - Sandwich beam property summary
Nominal Core Depth (mm) D (Nmm²) G (MPa)
50.00 1.18E+09 2.60
75.00 2.55E+09 2.36
As anticipated, the 75mm beams appear to have a higher flexural stiffness than the
50mm core beams. Both of the flexural stiffness values calculated are however
significantly lower than that predicted in section 4.5.1. This may be due to the core
beginning to crush early during the testing period resulting in a non-linear deflection
curve. This theory is supported by the values shown in Table 14 and Table 15 where the
flexural stiffness calculated is higher for the smaller loadings. The variation in stiffness
from the predicted values is concerning as the design of composites is generally
governed by the serviceability or deflection limits. The shear rigidity is less in the
75mm core than it is in the 50mm core samples. This result is supported by the theory
that as the core thickness increases, the facing skins have less effect on the shear
resistance of the beam (Howard 1969).
To validate the results given above, the standard three point deflection equation was
solved simultaneously for the flexural stiffness and shear rigidity of the 50mm core
beams using two different load cases. Two data points were selected from the test
results of specimen 1 and 2 resulting in a flexural stiffness (D) of 1.8 × 10⁹𝑁𝑚𝑚2 and
shear rigidity (G) of 2.73MPa. The results from the 1300mm span test on the 75mm
core were used to validate the flexural stiffness results provided above. The span to core
thickness ratio for this test was greater than 17 meaning that the deflection recorded,
especially at low loads, would predominantly have been of flexural nature. The flexural
stiffness was therefore calculated with the assumption that the shear deflection was
negligible. The results are shown below.
∆ = 𝑃(2𝑆3 − 3𝑆𝐿2 + 𝐿2)
96𝐷
𝐷 = 𝑃(2𝑆3 − 3𝑆𝐿2 + 𝐿2)
96∆
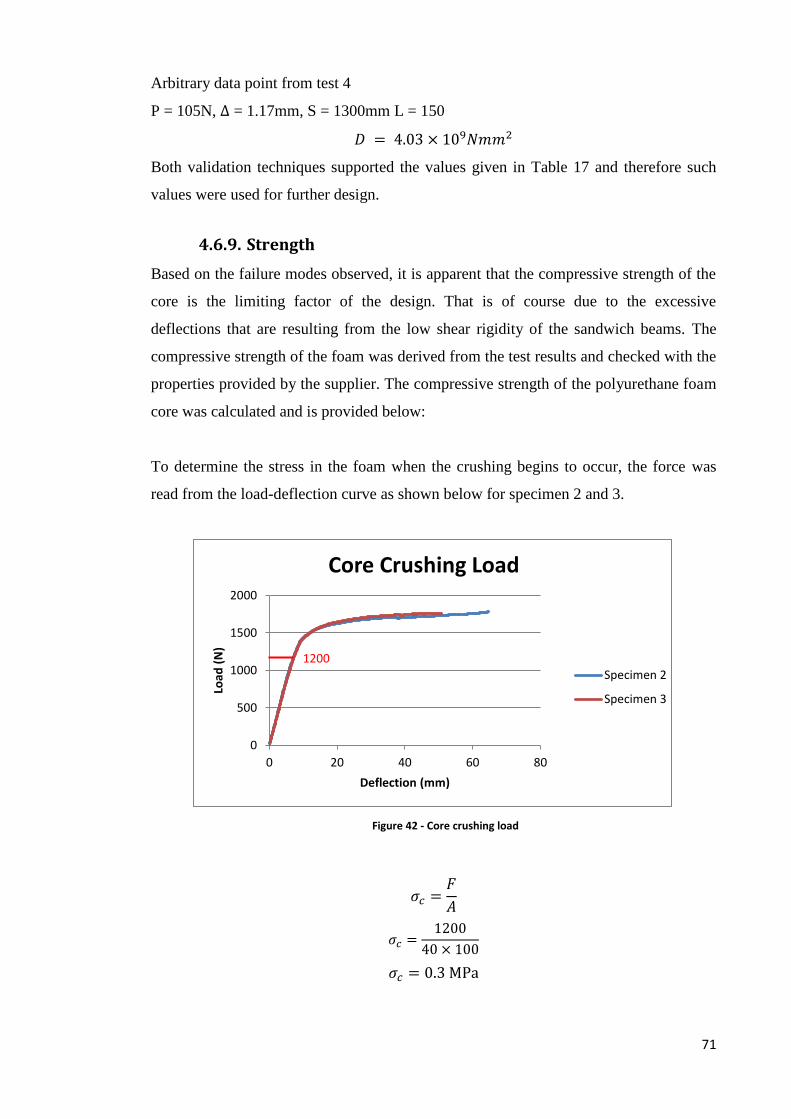
71
Arbitrary data point from test 4
P = 105N, ∆ = 1.17mm, S = 1300mm L = 150
𝐷 = 4.03 × 10⁹𝑁𝑚𝑚2
Both validation techniques supported the values given in Table 17 and therefore such
values were used for further design.
4.6.9. Strength
Based on the failure modes observed, it is apparent that the compressive strength of the
core is the limiting factor of the design. That is of course due to the excessive
deflections that are resulting from the low shear rigidity of the sandwich beams. The
compressive strength of the foam was derived from the test results and checked with the
properties provided by the supplier. The compressive strength of the polyurethane foam
core was calculated and is provided below:
To determine the stress in the foam when the crushing begins to occur, the force was
read from the load-deflection curve as shown below for specimen 2 and 3.
Figure 42 - Core crushing load
𝜎𝑐 =𝐹
𝐴
𝜎𝑐 =1200
40 × 100
𝜎𝑐 = 0.3 MPa
0
500
1000
1500
2000
0 20 40 60 80
Load
(N
)
Deflection (mm)
Core Crushing Load
Specimen 2
Specimen 3
1200
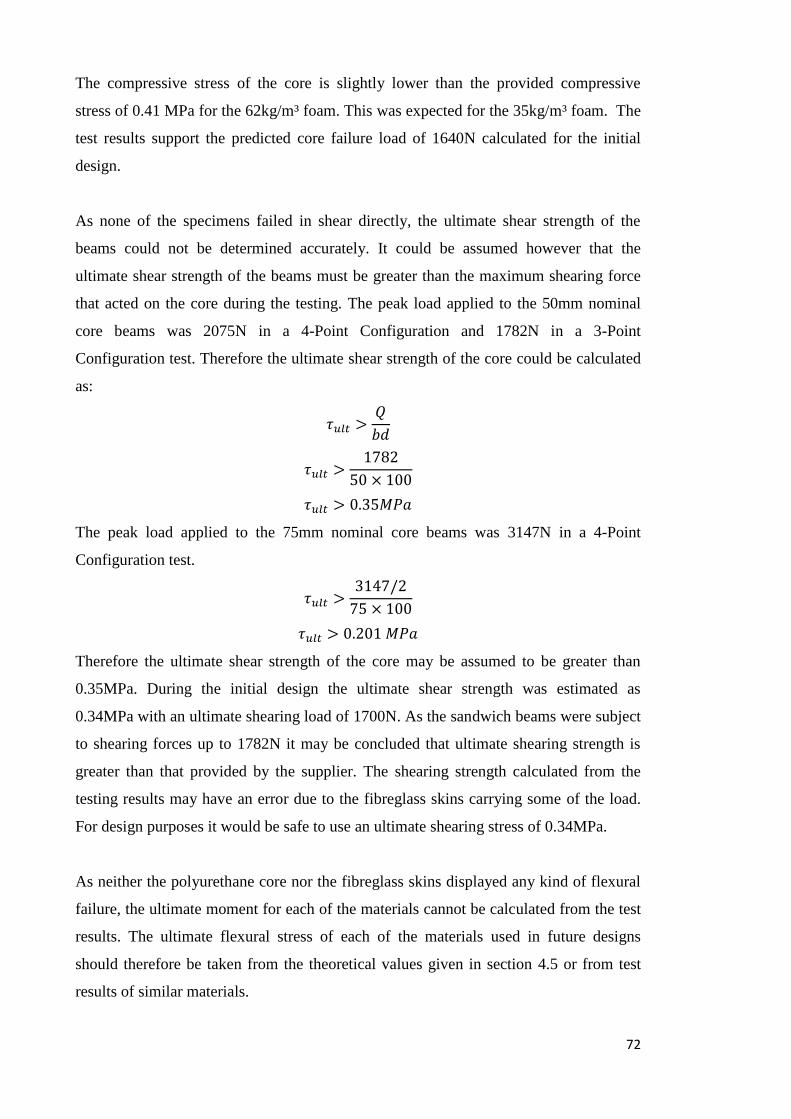
72
The compressive stress of the core is slightly lower than the provided compressive
stress of 0.41 MPa for the 62kg/m³ foam. This was expected for the 35kg/m³ foam. The
test results support the predicted core failure load of 1640N calculated for the initial
design.
As none of the specimens failed in shear directly, the ultimate shear strength of the
beams could not be determined accurately. It could be assumed however that the
ultimate shear strength of the beams must be greater than the maximum shearing force
that acted on the core during the testing. The peak load applied to the 50mm nominal
core beams was 2075N in a 4-Point Configuration and 1782N in a 3-Point
Configuration test. Therefore the ultimate shear strength of the core could be calculated
as:
𝜏𝑢𝑙𝑡 >𝑄
𝑏𝑑
𝜏𝑢𝑙𝑡 >1782
50 × 100
𝜏𝑢𝑙𝑡 > 0.35𝑀𝑃𝑎
The peak load applied to the 75mm nominal core beams was 3147N in a 4-Point
Configuration test.
𝜏𝑢𝑙𝑡 >3147/2
75 × 100
𝜏𝑢𝑙𝑡 > 0.201 𝑀𝑃𝑎
Therefore the ultimate shear strength of the core may be assumed to be greater than
0.35MPa. During the initial design the ultimate shear strength was estimated as
0.34MPa with an ultimate shearing load of 1700N. As the sandwich beams were subject
to shearing forces up to 1782N it may be concluded that ultimate shearing strength is
greater than that provided by the supplier. The shearing strength calculated from the
testing results may have an error due to the fibreglass skins carrying some of the load.
For design purposes it would be safe to use an ultimate shearing stress of 0.34MPa.
As neither the polyurethane core nor the fibreglass skins displayed any kind of flexural
failure, the ultimate moment for each of the materials cannot be calculated from the test
results. The ultimate flexural stress of each of the materials used in future designs
should therefore be taken from the theoretical values given in section 4.5 or from test
results of similar materials.
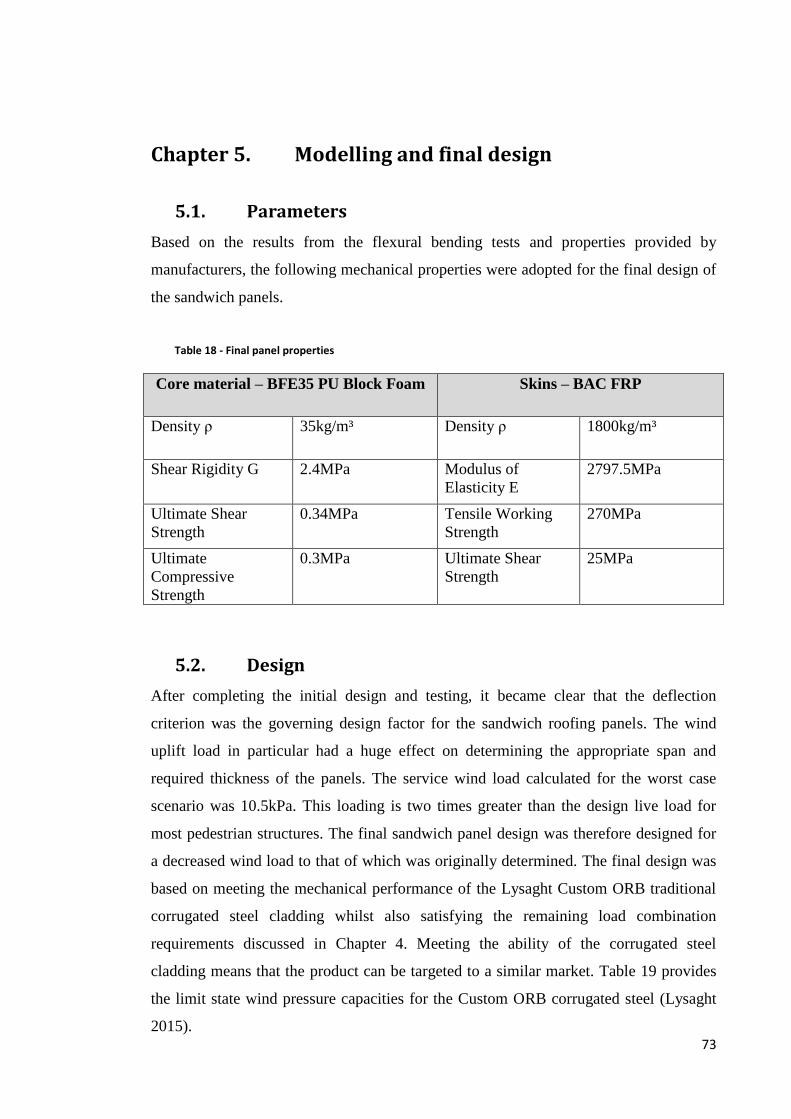
73
Chapter 5. Modelling and final design
5.1. Parameters
Based on the results from the flexural bending tests and properties provided by
manufacturers, the following mechanical properties were adopted for the final design of
the sandwich panels.
Table 18 - Final panel properties
Core material – BFE35 PU Block Foam Skins – BAC FRP
Density ρ 35kg/m³ Density ρ 1800kg/m³
Shear Rigidity G 2.4MPa Modulus of
Elasticity E
2797.5MPa
Ultimate Shear
Strength
0.34MPa Tensile Working
Strength
270MPa
Ultimate
Compressive
Strength
0.3MPa Ultimate Shear
Strength
25MPa
5.2. Design
After completing the initial design and testing, it became clear that the deflection
criterion was the governing design factor for the sandwich roofing panels. The wind
uplift load in particular had a huge effect on determining the appropriate span and
required thickness of the panels. The service wind load calculated for the worst case
scenario was 10.5kPa. This loading is two times greater than the design live load for
most pedestrian structures. The final sandwich panel design was therefore designed for
a decreased wind load to that of which was originally determined. The final design was
based on meeting the mechanical performance of the Lysaght Custom ORB traditional
corrugated steel cladding whilst also satisfying the remaining load combination
requirements discussed in Chapter 4. Meeting the ability of the corrugated steel
cladding means that the product can be targeted to a similar market. Table 19 provides
the limit state wind pressure capacities for the Custom ORB corrugated steel (Lysaght
2015).
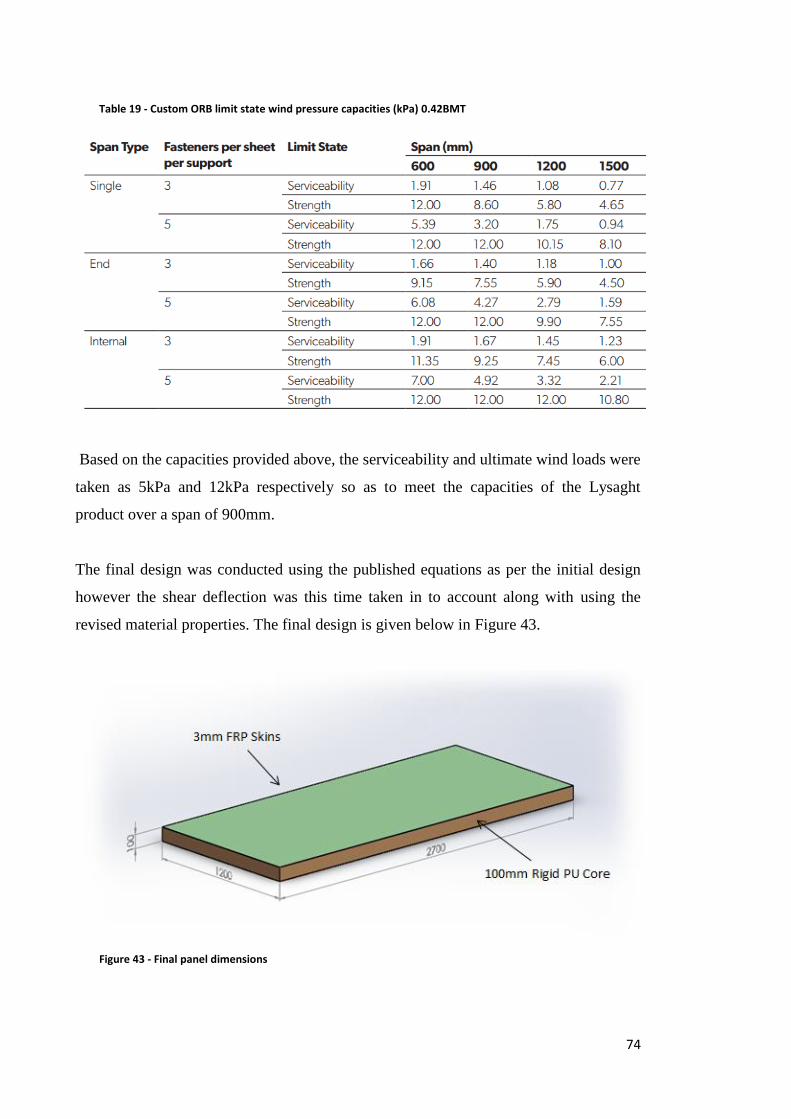
74
Table 19 - Custom ORB limit state wind pressure capacities (kPa) 0.42BMT
Based on the capacities provided above, the serviceability and ultimate wind loads were
taken as 5kPa and 12kPa respectively so as to meet the capacities of the Lysaght
product over a span of 900mm.
The final design was conducted using the published equations as per the initial design
however the shear deflection was this time taken in to account along with using the
revised material properties. The final design is given below in Figure 43.
Figure 43 - Final panel dimensions
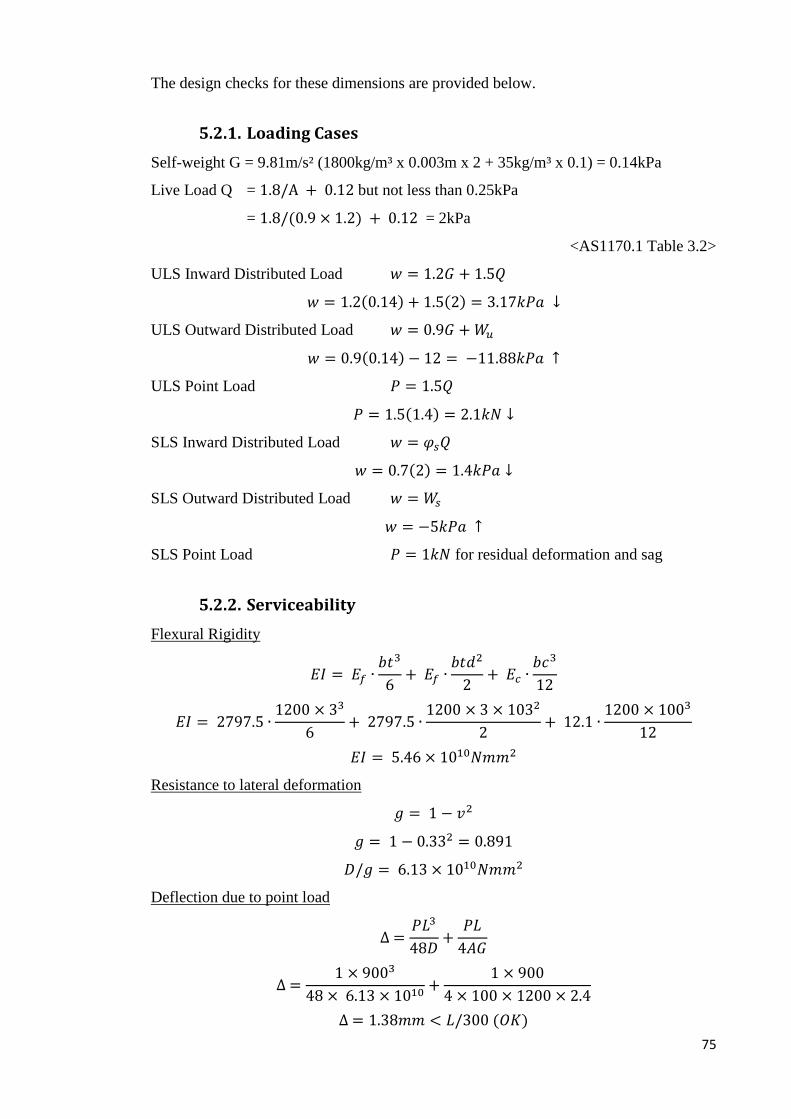
75
The design checks for these dimensions are provided below.
5.2.1. Loading Cases
Self-weight G = 9.81m/s² (1800kg/m³ x 0.003m x 2 + 35kg/m³ x 0.1) = 0.14kPa
Live Load Q = 1.8/A + 0.12 but not less than 0.25kPa
= 1.8/(0.9 × 1.2) + 0.12 = 2kPa
<AS1170.1 Table 3.2>
ULS Inward Distributed Load 𝑤 = 1.2𝐺 + 1.5𝑄
𝑤 = 1.2(0.14) + 1.5(2) = 3.17𝑘𝑃𝑎 ↓
ULS Outward Distributed Load 𝑤 = 0.9𝐺 + 𝑊𝑢
𝑤 = 0.9(0.14) − 12 = −11.88𝑘𝑃𝑎 ↑
ULS Point Load 𝑃 = 1.5𝑄
𝑃 = 1.5(1.4) = 2.1𝑘𝑁 ↓
SLS Inward Distributed Load 𝑤 = 𝜑𝑠𝑄
𝑤 = 0.7(2) = 1.4𝑘𝑃𝑎 ↓
SLS Outward Distributed Load 𝑤 = 𝑊𝑠
𝑤 = −5𝑘𝑃𝑎 ↑
SLS Point Load 𝑃 = 1𝑘𝑁 for residual deformation and sag
5.2.2. Serviceability
Flexural Rigidity
𝐸𝐼 = 𝐸𝑓 ∙𝑏𝑡3
6+ 𝐸𝑓 ∙
𝑏𝑡𝑑2
2+ 𝐸𝑐 ∙
𝑏𝑐3
12
𝐸𝐼 = 2797.5 ∙1200 × 33
6+ 2797.5 ∙
1200 × 3 × 1032
2+ 12.1 ∙
1200 × 1003
12
𝐸𝐼 = 5.46 × 10¹⁰𝑁𝑚𝑚2
Resistance to lateral deformation
𝑔 = 1 − 𝑣2
𝑔 = 1 − 0.332 = 0.891
𝐷/𝑔 = 6.13 × 10¹⁰𝑁𝑚𝑚2
Deflection due to point load
∆ =𝑃𝐿3
48𝐷+
𝑃𝐿
4𝐴𝐺
∆ =1 × 9003
48 × 6.13 × 1010+
1 × 900
4 × 100 × 1200 × 2.4
∆ = 1.38𝑚𝑚 < 𝐿/300 (𝑂𝐾)
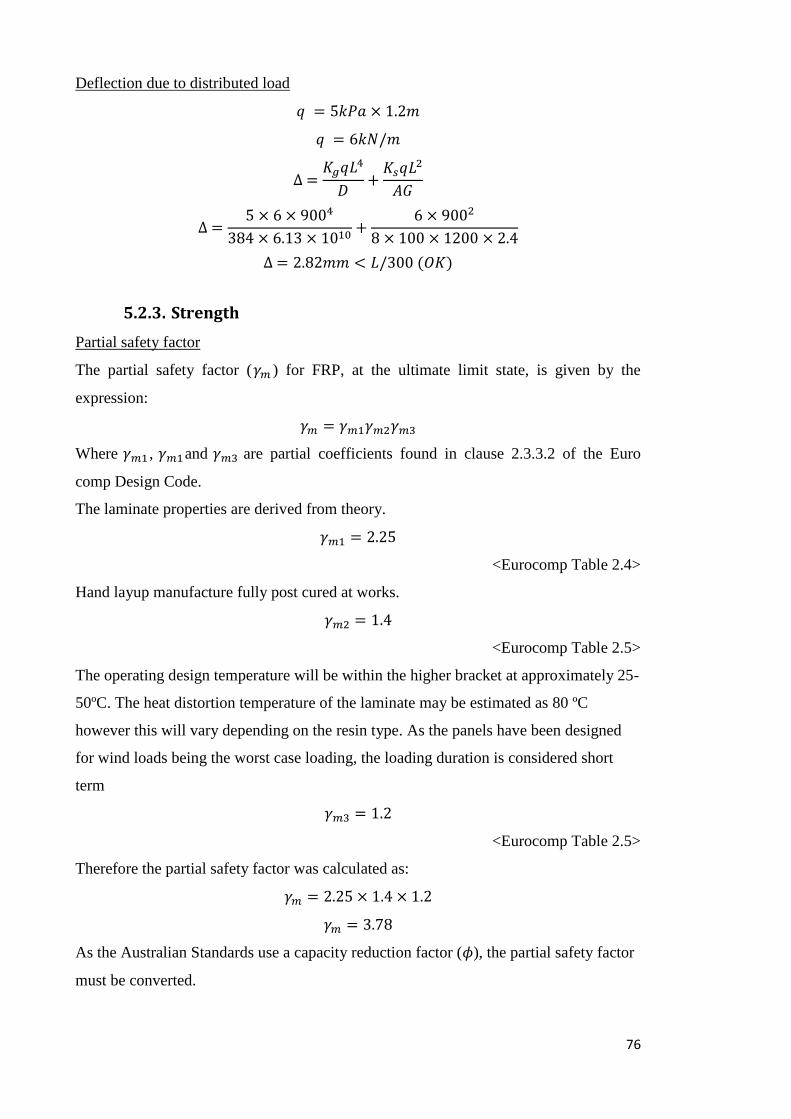
76
Deflection due to distributed load
𝑞 = 5𝑘𝑃𝑎 × 1.2𝑚
𝑞 = 6𝑘𝑁/𝑚
∆ =𝐾𝑔𝑞𝐿4
𝐷+
𝐾𝑠𝑞𝐿2
𝐴𝐺
∆ =5 × 6 × 9004
384 × 6.13 × 1010+
6 × 9002
8 × 100 × 1200 × 2.4
∆ = 2.82𝑚𝑚 < 𝐿/300 (𝑂𝐾)
5.2.3. Strength
Partial safety factor
The partial safety factor (𝛾𝑚 ) for FRP, at the ultimate limit state, is given by the
expression:
𝛾𝑚 = 𝛾𝑚1𝛾𝑚2𝛾𝑚3
Where 𝛾𝑚1 , 𝛾𝑚1and 𝛾𝑚3 are partial coefficients found in clause 2.3.3.2 of the Euro
comp Design Code.
The laminate properties are derived from theory.
𝛾𝑚1 = 2.25
<Eurocomp Table 2.4>
Hand layup manufacture fully post cured at works.
𝛾𝑚2 = 1.4
<Eurocomp Table 2.5>
The operating design temperature will be within the higher bracket at approximately 25-
50ºC. The heat distortion temperature of the laminate may be estimated as 80 ºC
however this will vary depending on the resin type. As the panels have been designed
for wind loads being the worst case loading, the loading duration is considered short
term
𝛾𝑚3 = 1.2
<Eurocomp Table 2.5>
Therefore the partial safety factor was calculated as:
𝛾𝑚 = 2.25 × 1.4 × 1.2
𝛾𝑚 = 3.78
As the Australian Standards use a capacity reduction factor (𝜙), the partial safety factor
must be converted.
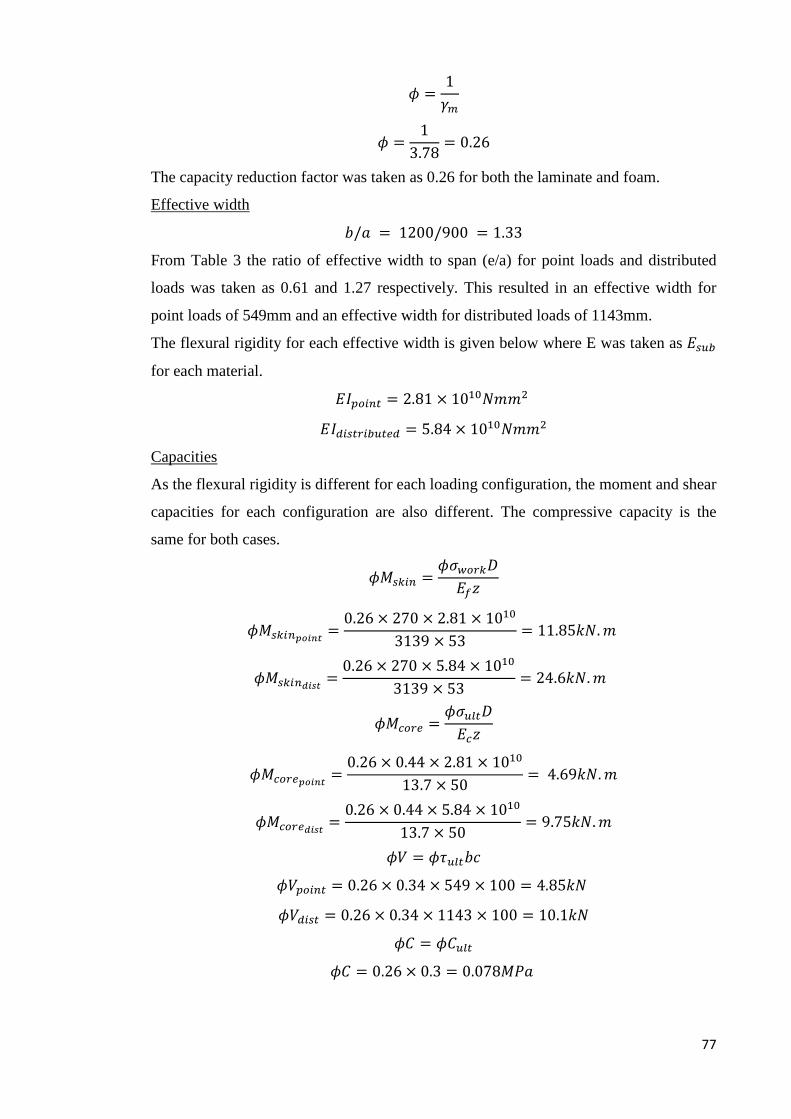
77
𝜙 =1
𝛾𝑚
𝜙 =1
3.78= 0.26
The capacity reduction factor was taken as 0.26 for both the laminate and foam.
Effective width
𝑏/𝑎 = 1200/900 = 1.33
From Table 3 the ratio of effective width to span (e/a) for point loads and distributed
loads was taken as 0.61 and 1.27 respectively. This resulted in an effective width for
point loads of 549mm and an effective width for distributed loads of 1143mm.
The flexural rigidity for each effective width is given below where E was taken as 𝐸𝑠𝑢𝑏
for each material.
𝐸𝐼𝑝𝑜𝑖𝑛𝑡 = 2.81 × 10¹⁰𝑁𝑚𝑚2
𝐸𝐼𝑑𝑖𝑠𝑡𝑟𝑖𝑏𝑢𝑡𝑒𝑑 = 5.84 × 10¹⁰𝑁𝑚𝑚2
Capacities
As the flexural rigidity is different for each loading configuration, the moment and shear
capacities for each configuration are also different. The compressive capacity is the
same for both cases.
𝜙𝑀𝑠𝑘𝑖𝑛 =𝜙𝜎𝑤𝑜𝑟𝑘𝐷
𝐸𝑓𝑧
𝜙𝑀𝑠𝑘𝑖𝑛𝑝𝑜𝑖𝑛𝑡=
0.26 × 270 × 2.81 × 1010
3139 × 53= 11.85𝑘𝑁. 𝑚
𝜙𝑀𝑠𝑘𝑖𝑛𝑑𝑖𝑠𝑡=
0.26 × 270 × 5.84 × 1010
3139 × 53= 24.6𝑘𝑁. 𝑚
𝜙𝑀𝑐𝑜𝑟𝑒 =𝜙𝜎𝑢𝑙𝑡𝐷
𝐸𝑐𝑧
𝜙𝑀𝑐𝑜𝑟𝑒𝑝𝑜𝑖𝑛𝑡=
0.26 × 0.44 × 2.81 × 1010
13.7 × 50= 4.69𝑘𝑁. 𝑚
𝜙𝑀𝑐𝑜𝑟𝑒𝑑𝑖𝑠𝑡=
0.26 × 0.44 × 5.84 × 1010
13.7 × 50= 9.75𝑘𝑁. 𝑚
𝜙𝑉 = 𝜙𝜏𝑢𝑙𝑡𝑏𝑐
𝜙𝑉𝑝𝑜𝑖𝑛𝑡 = 0.26 × 0.34 × 549 × 100 = 4.85𝑘𝑁
𝜙𝑉𝑑𝑖𝑠𝑡 = 0.26 × 0.34 × 1143 × 100 = 10.1𝑘𝑁
𝜙𝐶 = 𝜙𝐶𝑢𝑙𝑡
𝜙𝐶 = 0.26 × 0.3 = 0.078𝑀𝑃𝑎
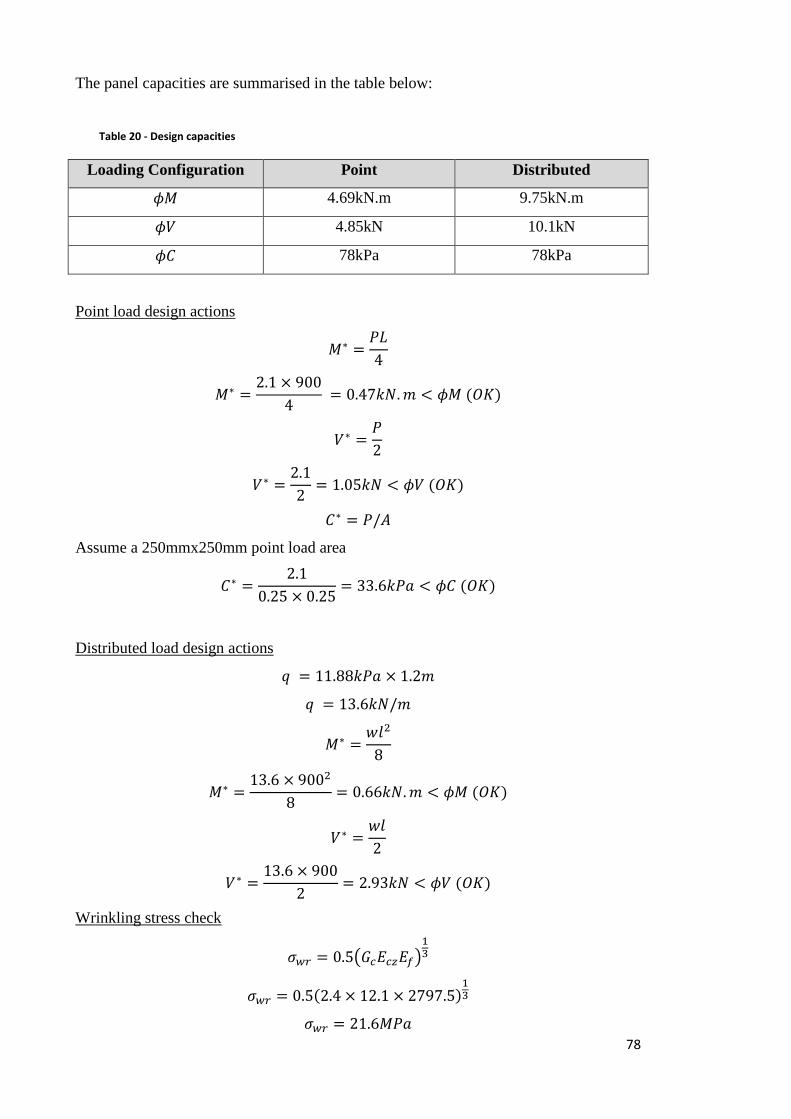
78
The panel capacities are summarised in the table below:
Table 20 - Design capacities
Loading Configuration Point Distributed
𝜙𝑀 4.69kN.m 9.75kN.m
𝜙𝑉 4.85kN 10.1kN
𝜙𝐶 78kPa 78kPa
Point load design actions
𝑀∗ =𝑃𝐿
4
𝑀∗ =2.1 × 900
4 = 0.47𝑘𝑁. 𝑚 < 𝜙𝑀 (𝑂𝐾)
𝑉∗ =𝑃
2
𝑉∗ =2.1
2= 1.05𝑘𝑁 < 𝜙𝑉 (𝑂𝐾)
𝐶∗ = 𝑃/𝐴
Assume a 250mmx250mm point load area
𝐶∗ =2.1
0.25 × 0.25= 33.6𝑘𝑃𝑎 < 𝜙𝐶 (𝑂𝐾)
Distributed load design actions
𝑞 = 11.88𝑘𝑃𝑎 × 1.2𝑚
𝑞 = 13.6𝑘𝑁/𝑚
𝑀∗ =𝑤𝑙2
8
𝑀∗ =13.6 × 9002
8= 0.66𝑘𝑁. 𝑚 < 𝜙𝑀 (𝑂𝐾)
𝑉∗ =𝑤𝑙
2
𝑉∗ =13.6 × 900
2= 2.93𝑘𝑁 < 𝜙𝑉 (𝑂𝐾)
Wrinkling stress check
𝜎𝑤𝑟 = 0.5(𝐺𝑐𝐸𝑐𝑧𝐸𝑓)13
𝜎𝑤𝑟 = 0.5(2.4 × 12.1 × 2797.5)13
𝜎𝑤𝑟 = 21.6𝑀𝑃𝑎
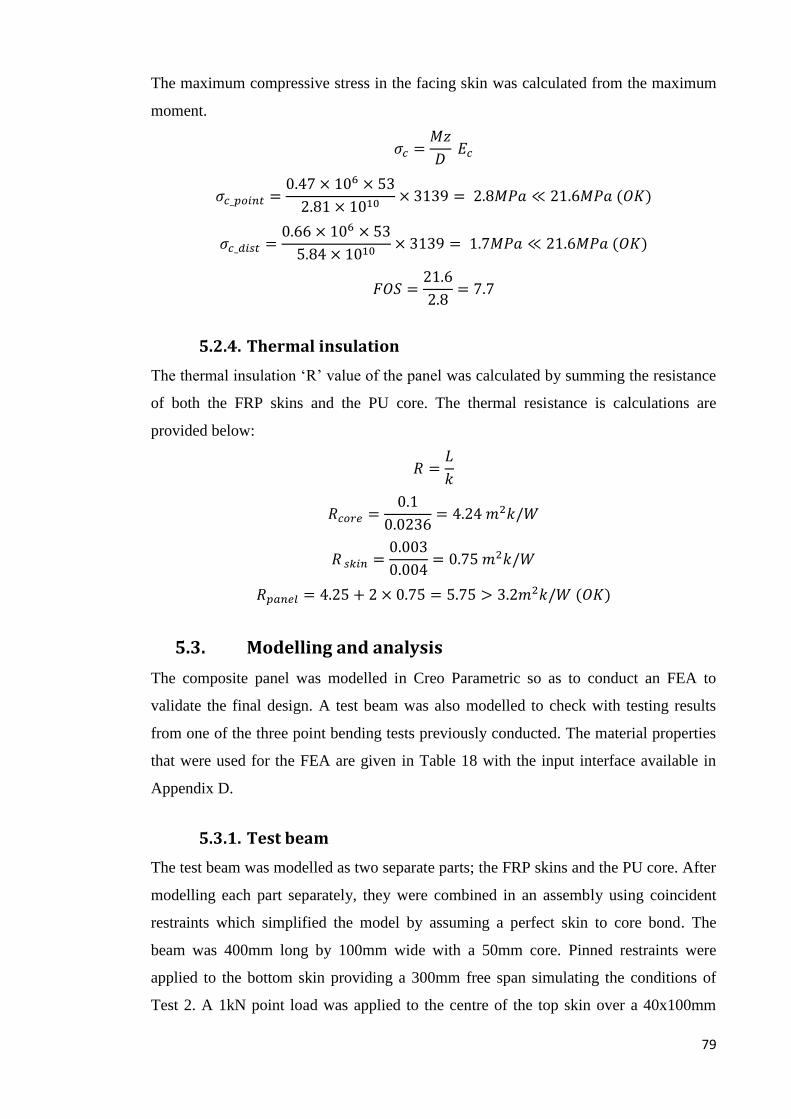
79
The maximum compressive stress in the facing skin was calculated from the maximum
moment.
𝜎𝑐 =𝑀𝑧
𝐷 𝐸𝑐
𝜎𝑐_𝑝𝑜𝑖𝑛𝑡 =0.47 × 106 × 53
2.81 × 1010× 3139 = 2.8𝑀𝑃𝑎 ≪ 21.6𝑀𝑃𝑎 (𝑂𝐾)
𝜎𝑐_𝑑𝑖𝑠𝑡 =0.66 × 106 × 53
5.84 × 1010× 3139 = 1.7𝑀𝑃𝑎 ≪ 21.6𝑀𝑃𝑎 (𝑂𝐾)
𝐹𝑂𝑆 =21.6
2.8= 7.7
5.2.4. Thermal insulation
The thermal insulation ‘R’ value of the panel was calculated by summing the resistance
of both the FRP skins and the PU core. The thermal resistance is calculations are
provided below:
𝑅 =𝐿
𝑘
𝑅𝑐𝑜𝑟𝑒 =0.1
0.0236= 4.24 𝑚2𝑘/𝑊
𝑅 𝑠𝑘𝑖𝑛 =0.003
0.004= 0.75 𝑚2𝑘/𝑊
𝑅𝑝𝑎𝑛𝑒𝑙 = 4.25 + 2 × 0.75 = 5.75 > 3.2𝑚2𝑘/𝑊 (𝑂𝐾)
5.3. Modelling and analysis
The composite panel was modelled in Creo Parametric so as to conduct an FEA to
validate the final design. A test beam was also modelled to check with testing results
from one of the three point bending tests previously conducted. The material properties
that were used for the FEA are given in Table 18 with the input interface available in
Appendix D.
5.3.1. Test beam
The test beam was modelled as two separate parts; the FRP skins and the PU core. After
modelling each part separately, they were combined in an assembly using coincident
restraints which simplified the model by assuming a perfect skin to core bond. The
beam was 400mm long by 100mm wide with a 50mm core. Pinned restraints were
applied to the bottom skin providing a 300mm free span simulating the conditions of
Test 2. A 1kN point load was applied to the centre of the top skin over a 40x100mm
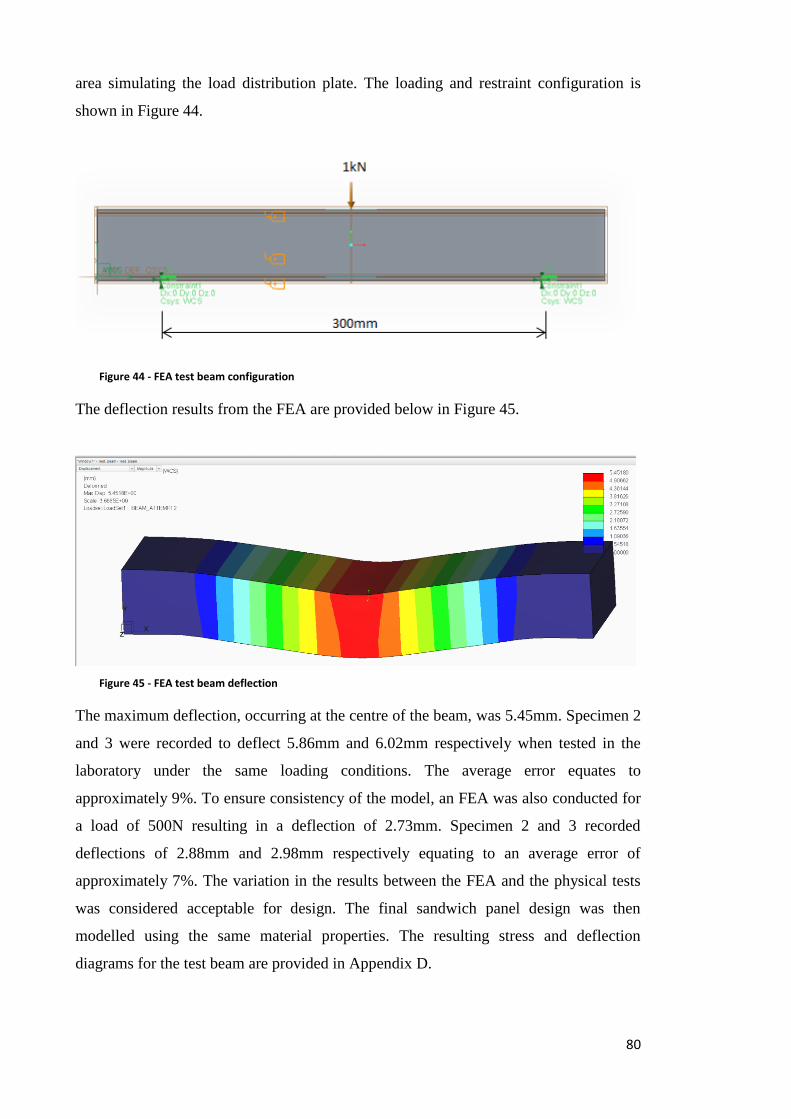
80
area simulating the load distribution plate. The loading and restraint configuration is
shown in Figure 44.
Figure 44 - FEA test beam configuration
The deflection results from the FEA are provided below in Figure 45.
Figure 45 - FEA test beam deflection
The maximum deflection, occurring at the centre of the beam, was 5.45mm. Specimen 2
and 3 were recorded to deflect 5.86mm and 6.02mm respectively when tested in the
laboratory under the same loading conditions. The average error equates to
approximately 9%. To ensure consistency of the model, an FEA was also conducted for
a load of 500N resulting in a deflection of 2.73mm. Specimen 2 and 3 recorded
deflections of 2.88mm and 2.98mm respectively equating to an average error of
approximately 7%. The variation in the results between the FEA and the physical tests
was considered acceptable for design. The final sandwich panel design was then
modelled using the same material properties. The resulting stress and deflection
diagrams for the test beam are provided in Appendix D.
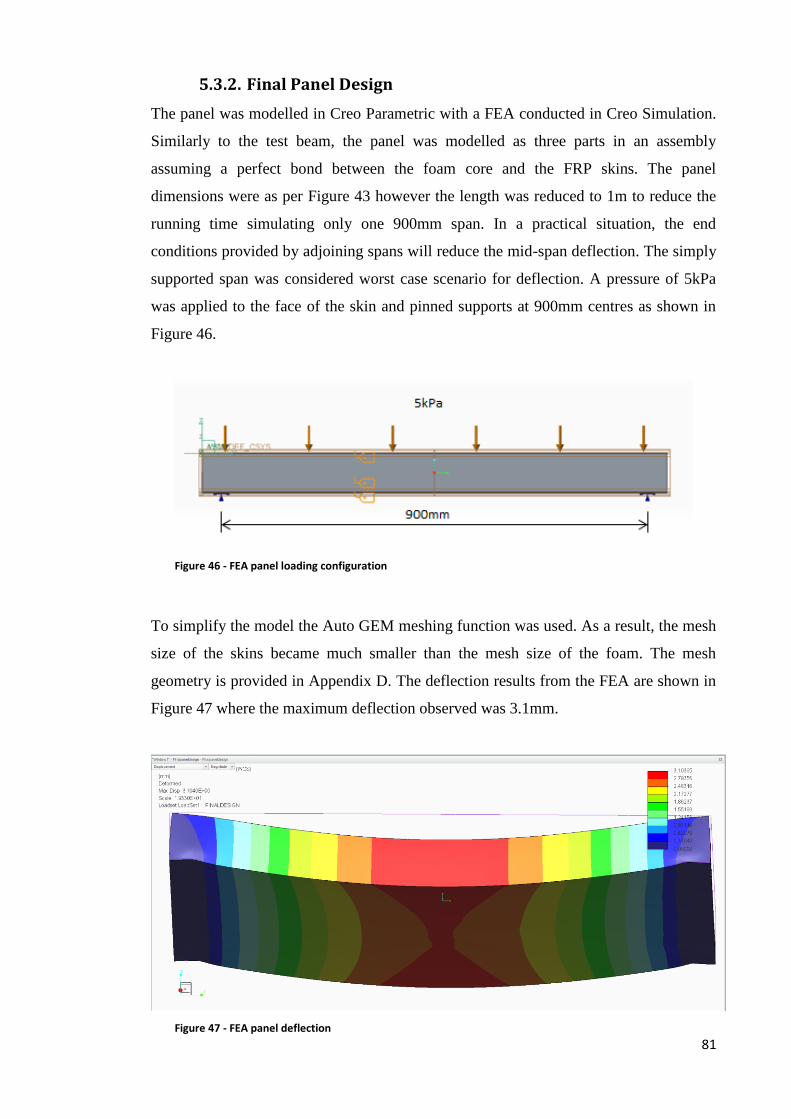
81
5.3.2. Final Panel Design
The panel was modelled in Creo Parametric with a FEA conducted in Creo Simulation.
Similarly to the test beam, the panel was modelled as three parts in an assembly
assuming a perfect bond between the foam core and the FRP skins. The panel
dimensions were as per Figure 43 however the length was reduced to 1m to reduce the
running time simulating only one 900mm span. In a practical situation, the end
conditions provided by adjoining spans will reduce the mid-span deflection. The simply
supported span was considered worst case scenario for deflection. A pressure of 5kPa
was applied to the face of the skin and pinned supports at 900mm centres as shown in
Figure 46.
Figure 46 - FEA panel loading configuration
To simplify the model the Auto GEM meshing function was used. As a result, the mesh
size of the skins became much smaller than the mesh size of the foam. The mesh
geometry is provided in Appendix D. The deflection results from the FEA are shown in
Figure 47 where the maximum deflection observed was 3.1mm.
Figure 47 - FEA panel deflection
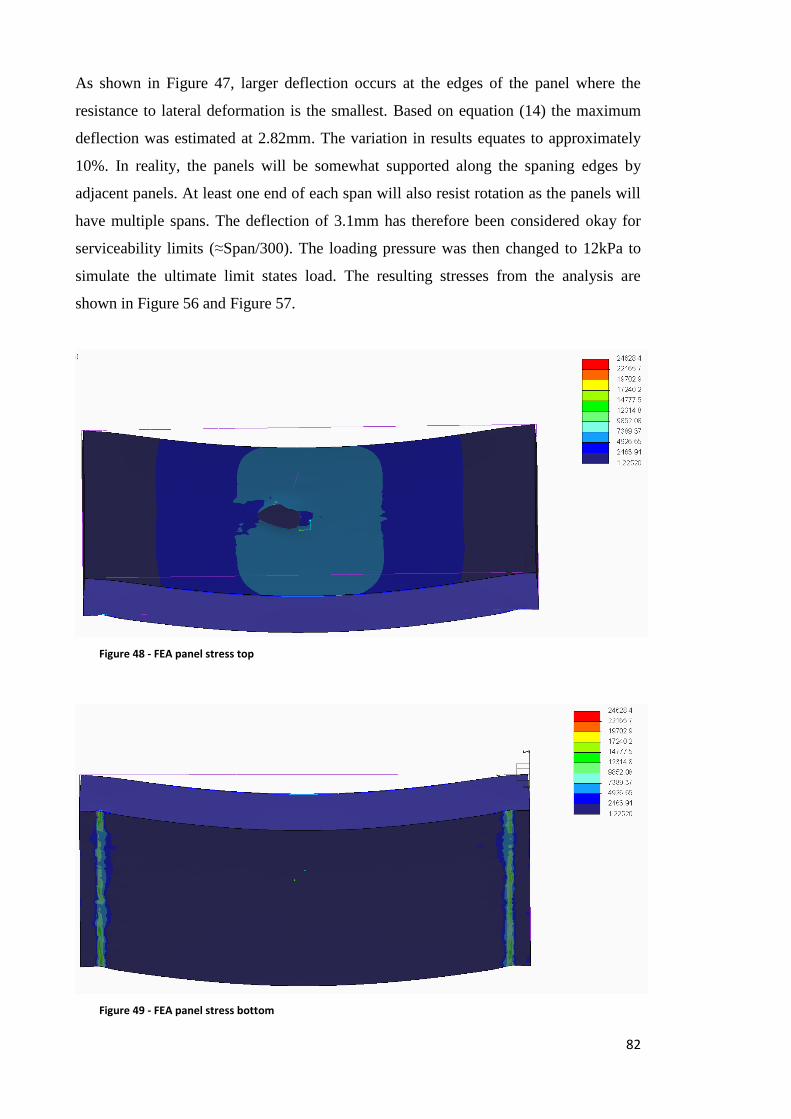
82
As shown in Figure 47, larger deflection occurs at the edges of the panel where the
resistance to lateral deformation is the smallest. Based on equation (14) the maximum
deflection was estimated at 2.82mm. The variation in results equates to approximately
10%. In reality, the panels will be somewhat supported along the spaning edges by
adjacent panels. At least one end of each span will also resist rotation as the panels will
have multiple spans. The deflection of 3.1mm has therefore been considered okay for
serviceability limits (≈Span/300). The loading pressure was then changed to 12kPa to
simulate the ultimate limit states load. The resulting stresses from the analysis are
shown in Figure 56 and Figure 57.
Figure 48 - FEA panel stress top
Figure 49 - FEA panel stress bottom
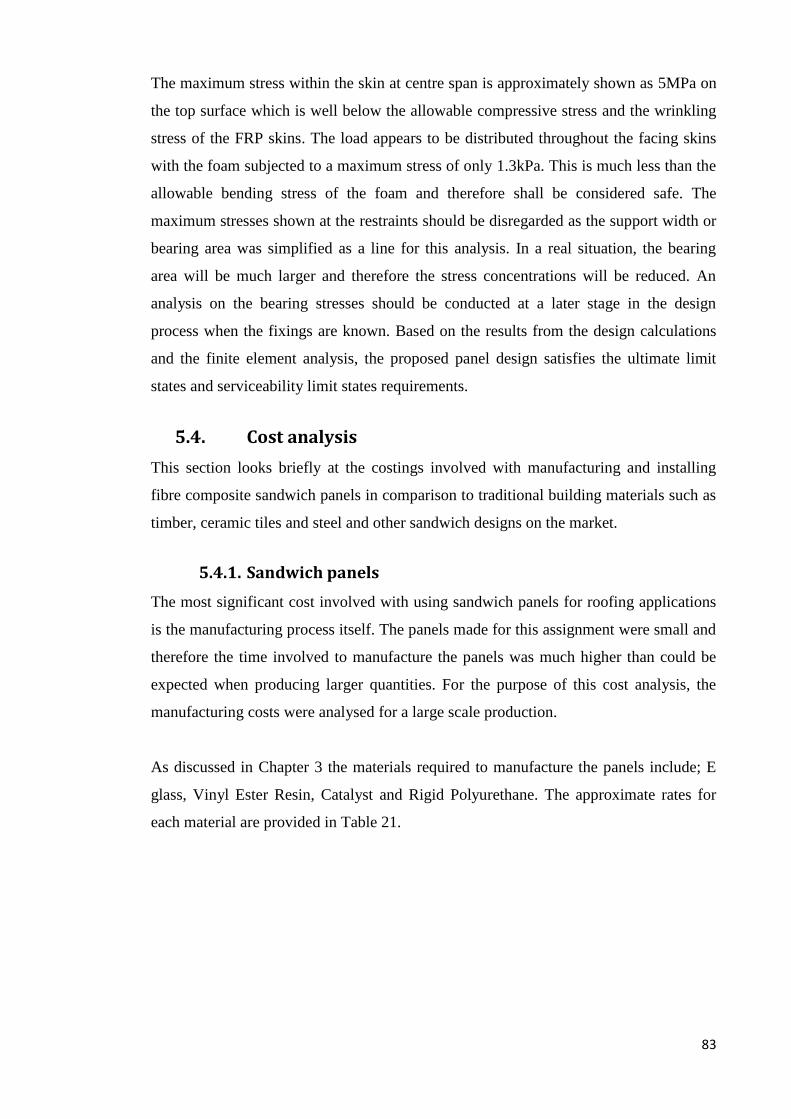
83
The maximum stress within the skin at centre span is approximately shown as 5MPa on
the top surface which is well below the allowable compressive stress and the wrinkling
stress of the FRP skins. The load appears to be distributed throughout the facing skins
with the foam subjected to a maximum stress of only 1.3kPa. This is much less than the
allowable bending stress of the foam and therefore shall be considered safe. The
maximum stresses shown at the restraints should be disregarded as the support width or
bearing area was simplified as a line for this analysis. In a real situation, the bearing
area will be much larger and therefore the stress concentrations will be reduced. An
analysis on the bearing stresses should be conducted at a later stage in the design
process when the fixings are known. Based on the results from the design calculations
and the finite element analysis, the proposed panel design satisfies the ultimate limit
states and serviceability limit states requirements.
5.4. Cost analysis
This section looks briefly at the costings involved with manufacturing and installing
fibre composite sandwich panels in comparison to traditional building materials such as
timber, ceramic tiles and steel and other sandwich designs on the market.
5.4.1. Sandwich panels
The most significant cost involved with using sandwich panels for roofing applications
is the manufacturing process itself. The panels made for this assignment were small and
therefore the time involved to manufacture the panels was much higher than could be
expected when producing larger quantities. For the purpose of this cost analysis, the
manufacturing costs were analysed for a large scale production.
As discussed in Chapter 3 the materials required to manufacture the panels include; E
glass, Vinyl Ester Resin, Catalyst and Rigid Polyurethane. The approximate rates for
each material are provided in Table 21.
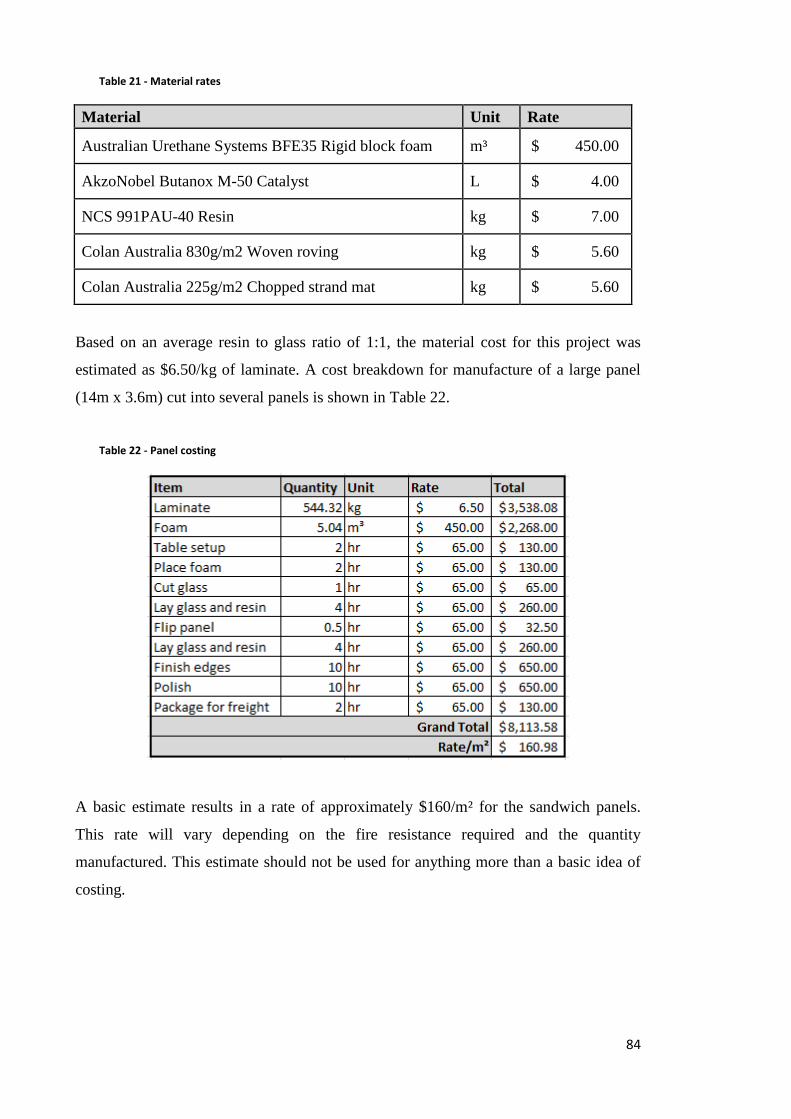
84
Table 21 - Material rates
Material Unit Rate
Australian Urethane Systems BFE35 Rigid block foam m³ $ 450.00
AkzoNobel Butanox M-50 Catalyst L $ 4.00
NCS 991PAU-40 Resin kg $ 7.00
Colan Australia 830g/m2 Woven roving kg $ 5.60
Colan Australia 225g/m2 Chopped strand mat kg $ 5.60
Based on an average resin to glass ratio of 1:1, the material cost for this project was
estimated as $6.50/kg of laminate. A cost breakdown for manufacture of a large panel
(14m x 3.6m) cut into several panels is shown in Table 22.
Table 22 - Panel costing
A basic estimate results in a rate of approximately $160/m² for the sandwich panels.
This rate will vary depending on the fire resistance required and the quantity
manufactured. This estimate should not be used for anything more than a basic idea of
costing.

85
5.4.2. Traditional materials
For the basis of this cost analysis, the insulation and the outer layer of a traditional roof
were considered. As the current sandwich panel design requires roofing battens at
900mm spans, the frame or truss was be included in this analysis. Approximate rates for
different types of roofing insulation are provided in Table 23.
Table 23 - Insulation rates (Schneider 2015)
Type Rate
Reflective sarking $1.20/m²
Reflective foil with air cell barrier (BCA compliant) $12/m²
Glass wool batts $6.70/m²
Polyester batts $9/m²
Sheep wool $9/m²
The reflective foil with the air cell barrier is probably the most comparable to the
sandwich panel insulation as it complies with the Building Code of Australia.
Approximate rates for different roofing materials are provided in Table 24.
Table 24 - Roofing rates (Roofing Fundamental 2015)
Type Rate
Clay tiles $40/m²
Slate tiles $60/m²
Concrete tiles $60/m²
Sheet metal (corrugated iron) $12/m²
Spanish tiles $40/m²
Asphalt shingles $8/m²
There are advantages and disadvantages to each type of roofing material. Although
metal roofing is cheap, installation is time consuming and must be done by experienced
professionals. Slate tiles require little maintenance and have a long lifespan; however
the material costs are relatively high. A sheet metal roof and a slate tile roof with
reflective foil insulation will therefore cost $24/m² and $72/m² respectively.
5.4.3. Existing sandwich panels
The existing roofing sandwich panels made from materials such as polystyrene foam,
corrugated iron and PVC vary in price from about $50/m² through to $80m² depending
on brand, materials, thickness and allowable spans. CSR Bradford (2015), an insulation
company, conducted a cost comparison survey in June 2014 on the total costs of
installing various types of commercial roofing. Included in the costing were all
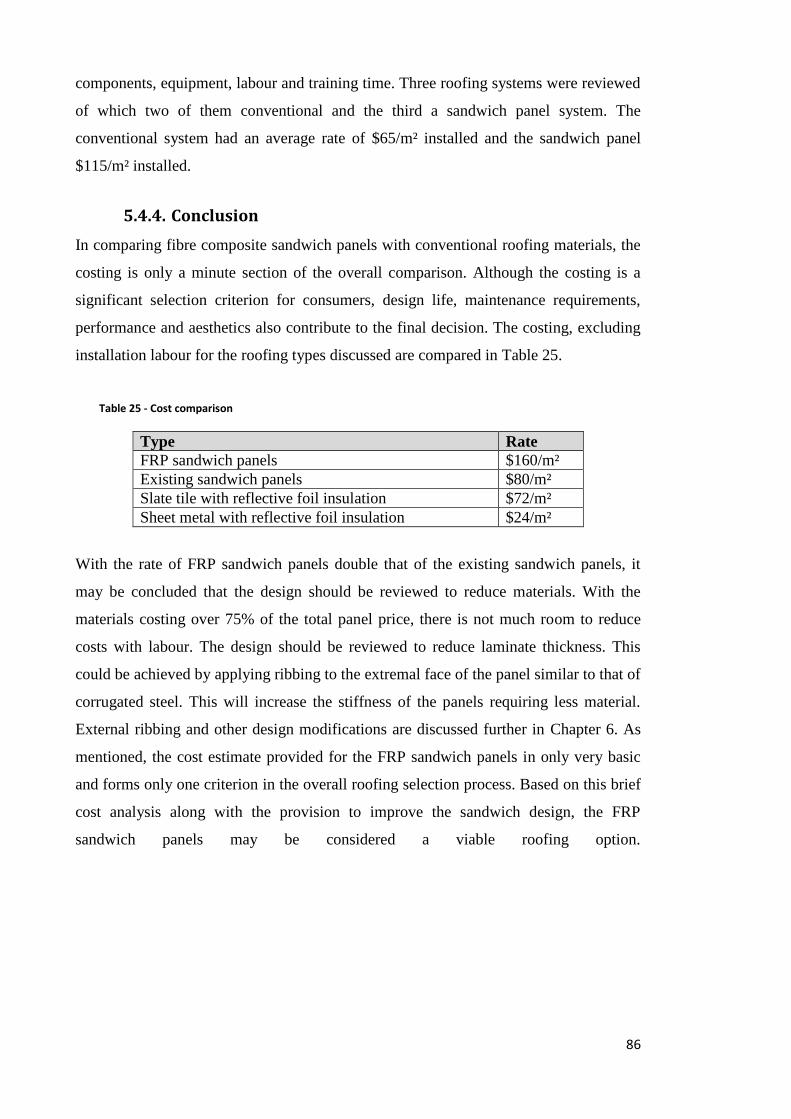
86
components, equipment, labour and training time. Three roofing systems were reviewed
of which two of them conventional and the third a sandwich panel system. The
conventional system had an average rate of $65/m² installed and the sandwich panel
$115/m² installed.
5.4.4. Conclusion
In comparing fibre composite sandwich panels with conventional roofing materials, the
costing is only a minute section of the overall comparison. Although the costing is a
significant selection criterion for consumers, design life, maintenance requirements,
performance and aesthetics also contribute to the final decision. The costing, excluding
installation labour for the roofing types discussed are compared in Table 25.
Table 25 - Cost comparison
Type Rate
FRP sandwich panels $160/m²
Existing sandwich panels $80/m²
Slate tile with reflective foil insulation $72/m²
Sheet metal with reflective foil insulation $24/m²
With the rate of FRP sandwich panels double that of the existing sandwich panels, it
may be concluded that the design should be reviewed to reduce materials. With the
materials costing over 75% of the total panel price, there is not much room to reduce
costs with labour. The design should be reviewed to reduce laminate thickness. This
could be achieved by applying ribbing to the extremal face of the panel similar to that of
corrugated steel. This will increase the stiffness of the panels requiring less material.
External ribbing and other design modifications are discussed further in Chapter 6. As
mentioned, the cost estimate provided for the FRP sandwich panels in only very basic
and forms only one criterion in the overall roofing selection process. Based on this brief
cost analysis along with the provision to improve the sandwich design, the FRP
sandwich panels may be considered a viable roofing option.

87
Chapter 6. Conclusions and future work
6.1. Introduction
The primary objective of this research project was to investigate the thermal insulation
and strength properties of varying core thicknesses in fibre composite sandwich panels.
Included in the investigation was an in depth literature review on the theory of sandwich
panels and the current applications of fibre composite technologies. A set of sample
panels were manufactured at Buchanan’s Advanced Composites and tested in bending
at the Centre for Excellence in Engineered Fibre Composites to compare with
theoretical values predicted from equations found in the literature. The testing included
6 different loading configurations varying in span from 300mm through to 1300mm.
The results from the tests were used to generate a final panel design. A finite element
analysis was conducted in the software package Creo which was used to validate the
final design. Finally a basic cost analysis was completed on the final design for
comparison with conventional building materials.
6.2. Design requirements
The design requirements adopted for the thermally insulated structural sandwich panels
came from several design codes and standards including, but not limited to the
Australian Standards 1170 series, Eurocomp Design Code and the Building Code of
Australia sections C ‘Fire Resistance and J ‘Energy Efficiency’. The polyurethane core
provided more than adequate insulation properties to satisfy the requirements for energy
efficiency however further investigation must be conducted to ensure the FRP skins
along with the PU core provide sufficient fire resistance. The sandwich panels were
designed to satisfy both ultimate limit states as well as serviceability limit states design
requirements. As anticipated the serviceability, in particular the mid-span deflection
when subject to wind loads, became the governing design factor.
6.3. Testing results
A series of experimental tests were conducted at the CEEFC on sandwich beams with
different core thicknesses. From the tests results, various material properties were
calculated such as the core shear rigidity, core ultimate compressive stress, core ultimate
88
shear stress and facing modulus. The core properties calculated from the tests results
were similar to that of which were predicted using properties of similar cores. The
facing modulus calculated was however much smaller than predicted using the rule of
mixtures for fibre composite laminates. This variation may have been caused by
improper manufacturing techniques. As the sample panels were not manufactured by
professionals, the resin to glass ratio may have been less than ideal causing a reduction
in material properties. Localised crushing of the core during the test may also have
caused a reduction in the calculated modulus. The core shear rigidity calculated from
the test results was lower for the thicker core size. This is caused by the facing skins
contributing to the shear stiffness of the beam. As the core thickness increases, the
facing skins contribute less to the shear stiffness.
Along with determining material properties, the tests were also used to gain a better
understanding of the failure modes applicable to the design. In most cases, the failure
mode observed was delamination of the facing skins from the core. The core would then
shear at the location of the delamination. The failure modes occurred when the beams
were subject to excessive deflections. The failure modes were not considered
catastrophic as the beams continued to support loads after delamination.
6.4. Final design
The final design of the sandwich panels was conducted using material properties
derived from testing results as well as from theory resulting in a core thickness of
100mm. The final panel design is provided in Figure 43. A finite element analysis was
conducted on the final panel design to check with the results from the design
calculations. The results from the FEA varied by approximately 10% from the results of
the design calculations. A FEA was also conducted on a test beam identical to specimen
2 and 3 used in the laboratory. Results from the analysis were closely compared with
the physical testing results observing an error of approximately 10% validating the Creo
model.
The final panel design has a thermal resistance R value of 5.75 and has been deemed to
satisfy both the serviceability and strength requirements for the application. A cost
analysis revealed that the FRP sandwich panels were significantly more expensive than
conventional roofing materials. Several design changes have been identified such as
external ribbing that may reduce the overall cost of FRP sandwich panels.
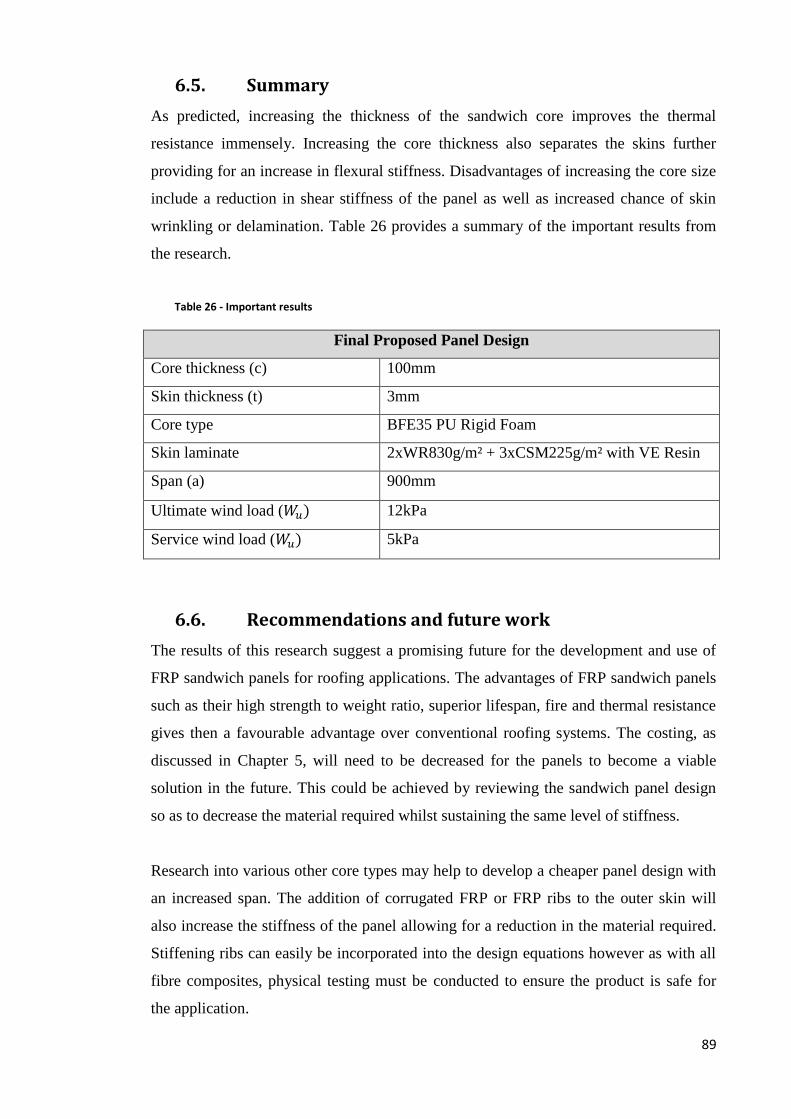
89
6.5. Summary
As predicted, increasing the thickness of the sandwich core improves the thermal
resistance immensely. Increasing the core thickness also separates the skins further
providing for an increase in flexural stiffness. Disadvantages of increasing the core size
include a reduction in shear stiffness of the panel as well as increased chance of skin
wrinkling or delamination. Table 26 provides a summary of the important results from
the research.
Table 26 - Important results
Final Proposed Panel Design
Core thickness (c) 100mm
Skin thickness (t) 3mm
Core type BFE35 PU Rigid Foam
Skin laminate 2xWR830g/m² + 3xCSM225g/m² with VE Resin
Span (a) 900mm
Ultimate wind load (𝑊𝑢) 12kPa
Service wind load (𝑊𝑢) 5kPa
6.6. Recommendations and future work
The results of this research suggest a promising future for the development and use of
FRP sandwich panels for roofing applications. The advantages of FRP sandwich panels
such as their high strength to weight ratio, superior lifespan, fire and thermal resistance
gives then a favourable advantage over conventional roofing systems. The costing, as
discussed in Chapter 5, will need to be decreased for the panels to become a viable
solution in the future. This could be achieved by reviewing the sandwich panel design
so as to decrease the material required whilst sustaining the same level of stiffness.
Research into various other core types may help to develop a cheaper panel design with
an increased span. The addition of corrugated FRP or FRP ribs to the outer skin will
also increase the stiffness of the panel allowing for a reduction in the material required.
Stiffening ribs can easily be incorporated into the design equations however as with all
fibre composites, physical testing must be conducted to ensure the product is safe for
the application.
90
There are several design components that must be completed for the proposed final
design to be ready for the market. Firstly and most importantly, the fire resistance of the
panels must be tested and analysed so as to ensure that the product complies with
Section C of the Building Code of Australia. The results should also be checked against
the insurance industry fire requirements. The connection and fixing details of the panels
must also be designed and these could incorporate channelling for electrical conduit.
Large scale load testing including impact testing would also aid in making the product
more marketable.
With the FRP sandwich panel design completed, further research and development into
a modular unit that eliminates the need for roof trusses could be carried out. This could
involve investigating the attributes of sandwich panels in longitudinal compression. A
complete modular unit may result in a higher material price however the overall cost of
construction may be reduced as the modules would allow for fast installation.
91
References
Almeida, MIAd 2009, 'Structural behaviour of composite sandwich panels
for applications in the construction industry', University of lisbon, Portugal.
American Chemistry Council - Polyurethane, 2015, American Chemistry Council, viewed 30 May, <http://polyurethane.americanchemistry.com/Sustainability/Fire-and-Combustibility>.
AS4859.1 2002 Materials for the thermal insulation of buildings, 2002, Part 1: General criteria and technical provisions, Standards Australia, Sydney.
AUSTHANE BFE 35 Rigid FR Polyurethane Foam, 2011, AUSTRALIAN URETHANE SYSTEMS PTY LTD, Sydney.
Bakis, CE, Bank, LC & Brown, VL 2002, 'Fiber-Reinforced Polymer Composites for construction - State-of-the-Art Review', Journel of Composites for Construction, pp. 73-87.
Bondor Insulated Roofing Panels, 2015, Metecno Pty Ltd, viewed 7 May, <http://www.bondor.com.au/products/roofing>.
Bradford 2015, The Cost of a Roof, CSR Bradford, North Ryde BC NSW, <https://www.architectureanddesign.com.au/getattachment/f2c9d669-4338-43f1-b5a1-39f12c6e6ff7/attachment.aspx>.
Bradley, B 2007, Typical Roof Truss, Wikimedia Commons, Wikimedia Commons, <https://commons.wikimedia.org/wiki/File:Rf-trad-section.gif>.
Carslaw, H & Jaeger, J 1986, Conduction of heat in solids, 2nd edn, Clarendon Press, New York.
Colan Australia, 2013, viewed 3 June, <http://www.colan.com.au/compositereinforcement/resources/fibre-information/fibre-comparison-charts>.
Composites Australia, 2015, Composites Australia, viewed 30 May, <http://www.compositesaustralia.com.au/fabrication-processes/>.
Concise encyclopedia of composite materials, 1989, Pergamon Press, New York.

92
Design Data, 1994, ACI Fibreglass.
DIAB Group, 2015, viewed 5 May 2015, <http://www.diabgroup.com/en-GB/Knowledge/Sandwich-technology>.
DIAB guide to core and sandwich, 2012, Rev 1, Diab Group, Laholm, Sweden, Guide.
Exel Australia Standard Industrial Profile List, 2015, Exel Composites, Boronia VIC Australia, 01/06/16.
Flannery, M 2015, Generic Risk Management Plan, University of Southern Queensland, Toowoomba.
Foster, GC 1998, 'Tensile and Flexure Strength of Unidirectional Fiber-Reinforced Composites: Direct Numerical Simulations and Analytic Models', Virginia Polytechnic Institute and State University, Blacksburg, Virginia.
Gall, TL 1987, Engineers' guide to composite materials, American Society of Metals, Metals Park, Ohio.
Glicksman, L 1994, 'Heat transfer in foams', in NC Hilyard & A Cunningham (eds), Low density cellular plastics, Springer Netherlands, ch 5, pp. 104-52.
Gryzagoridis, J, Oliver, G & Findeis, D 2015, 'On the equivalent flexural rigidity of sandwich composite panels', Insight, vol. 57, no. 3, pp. 140-3, <<Go to ISI>://WOS:000352317400006>.
Gurit 2015, Gurit.com, Gurit UK, viewed 14 September, <http://www.azom.com/suppliers.aspx?SupplierID=221>.
History of Composites, 2015, Mar-Bal Inc, viewed 25 April, <http://www.mar-bal.com/applications/history-of-composites/>.
Howard, AG 1969, Anaylsis and design of structural sanwich panels, 1st edn, Oxfordm Pergamon Press, New York.
John W. Weeton, DMP, Karyn L. Thomas 1987, Engineers' guide to composite materials, American Society of Metals, Metals Park, Ohio.
Johnson, T 2015, History of Composites, About Money, viewed 25 April, <http://composite.about.com/od/aboutcompositesplastics/a/HistoryofComposites.htm>.
93
L.C. Hollaway, PRH 2001, Advanced polymer composites and polymers in the civil infrastructur, Elsevier Science Ltd, London.
Lysaght 2015, Custom ORB Design and Installation Guide, BlueScope.
Manalo, A 2013, 'Fibre reinforced polymer composites sandwich structure: Recent developments and applications in civil infrastructure', proceedings of the Centre of Excellence in Engineered Fibre Composites, University of Southern Queensland, Toowoomba, Queensland 4350, Australia.
Moaveni, S 2011, Engineering Fundamentals - An introduction to engineering, Fourth SI edn, Global Engineering, Stamford CT, USA.
Modular FRP Pedestrian Bridge, 2015, BAC Technologies Pty Ltd, Toowoomba, QLD, <http://www.bac.net.au/civil/modular-frp-pedestrian-bridge/>.
National Construction Code Series Volume 1, 2015, Australian Building Codes Board.
'NCS 991 PAU-40', 2015, NCS Composites, <http://www.ncscomposites.com.au/wp-content/uploads/datasheets/20130924112307442385368.pdf>.
Plantema, FJ 1966, Sandwich Construction: the bending and buckling of sandwich beams, plates, and shells, vol. 3, Wiley, New York.
Pultrusion Process, 2015, Exel Composites, <http://www.exelcomposites.com.au/ManufacturingQuality/Pultrusionprocess.aspx>.
Rakic, J 2003, 'Fire rated insulated (sandwich) panels', Fire Australia, no. May 2003, pp. 33-7, <http://www.pfpa.com.au/docs/sandwich%20panels/10-sandwich%20panel.pdf>.
Roofing Fundamental, 2015, viewed 22 October, <http://www.roofingfundamental.com/Roofing-Materials-Costs-Comparison.html>.
Schneider, R 2015, Roof Insulation, viewed 22 October, <http://www.homeimprovementpages.com.au/article/how_much_does_roof_insulation_cost>.
Steel Profile Insulated Roofing Panel, 2015, Complete Modular Homes, viewed 7 May, <http://completemodularhomes.com/fast-fix-system/fast-fix-roofing/>.
Structural Design of Polymer Composites Eurocop Design Code, 1996, E & FN Spon, London, UK.
94
Wit Witkiewicz, AZ 2006, Properties of Polyurethan (PU) Light Foams, Gdańsk University of Technology, Department of Materials Science and Engineering, Gdańsk, Poland,<.
Young, WC & Budynas, RG 2002, Roark’s Formulas for Stress and Strain, Seventh edn, McGraw-Hill, New York.
Standards:
ASTM C393/C393M-11 - 'Standard test method for core shear properties of sandwich
construction by beam flexure'
ASTM D7249/D7249M-12 - 'Standard test method for facing properties of sandwich
construction by long beam flexure'
ASTM D7250/D7250M-06 - 'Standard practice for determining sandwich beam flexural
and shear stiffness’
AS/NZS 1170-2002 - 'Structural design actions'
Eurocomp Design Code 1996
NCC Vol 1 Section J - 'Energy efficiency'
NCC Vol 1Section C - 'Fire resistance'
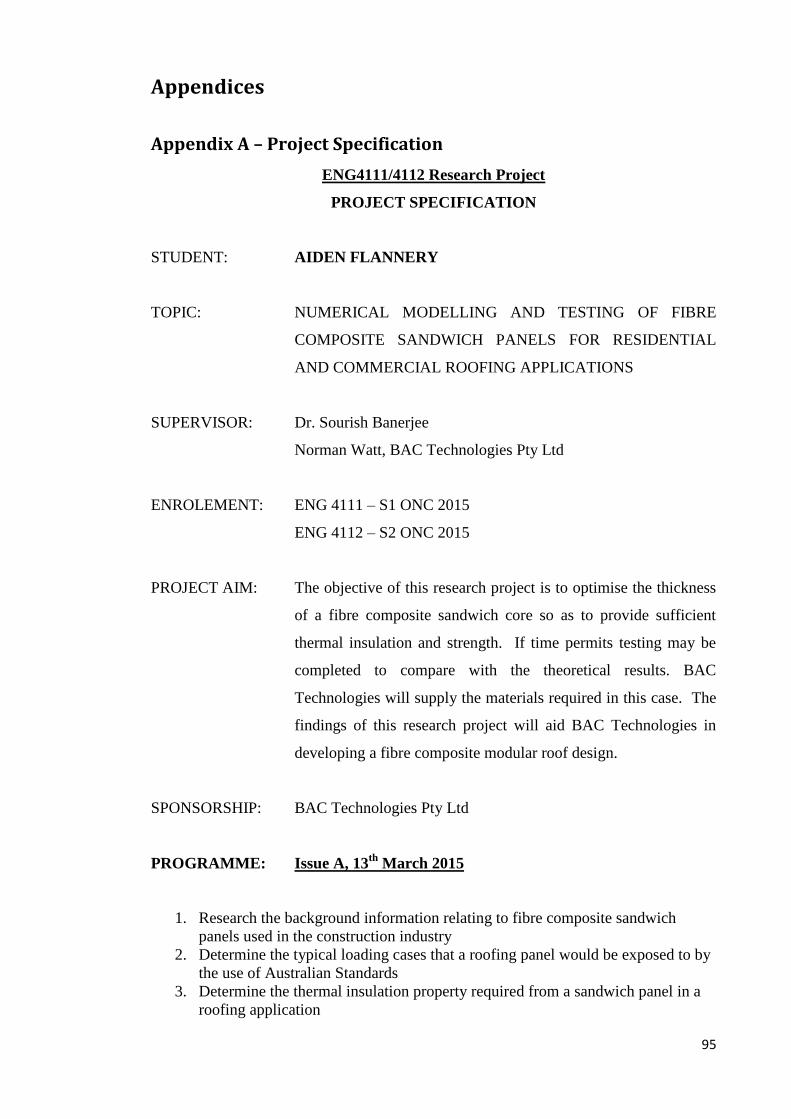
95
Appendices
Appendix A – Project Specification
ENG4111/4112 Research Project
PROJECT SPECIFICATION
STUDENT: AIDEN FLANNERY
TOPIC: NUMERICAL MODELLING AND TESTING OF FIBRE
COMPOSITE SANDWICH PANELS FOR RESIDENTIAL
AND COMMERCIAL ROOFING APPLICATIONS
SUPERVISOR: Dr. Sourish Banerjee
Norman Watt, BAC Technologies Pty Ltd
ENROLEMENT: ENG 4111 – S1 ONC 2015
ENG 4112 – S2 ONC 2015
PROJECT AIM: The objective of this research project is to optimise the thickness
of a fibre composite sandwich core so as to provide sufficient
thermal insulation and strength. If time permits testing may be
completed to compare with the theoretical results. BAC
Technologies will supply the materials required in this case. The
findings of this research project will aid BAC Technologies in
developing a fibre composite modular roof design.
SPONSORSHIP: BAC Technologies Pty Ltd
PROGRAMME: Issue A, 13th
March 2015
1. Research the background information relating to fibre composite sandwich
panels used in the construction industry
2. Determine the typical loading cases that a roofing panel would be exposed to by
the use of Australian Standards
3. Determine the thermal insulation property required from a sandwich panel in a
roofing application

96
4. Design and model fibre composite sandwich panels (fibreglass skins with low
density PU cores of varying thickness)
5. Analyse the strength and thermal insulation properties of the panels by the use
of FE modelling (ANSYS/Strand7)
6. Evaluate the results and determine an optimal thickness for strength and thermal
insulation
As time permits:
7. Test sample size composite panels for strength and thermal conductivity
(provided by BAC Technologies) and compare with numerical results
8. Conduct a cost analysis of producing the panels in comparison to traditional
roofing techniques

97
Appendix B – Risk Management Plan
The following generic risk management plan was adapted from the current USQ management
system (Flannery 2015).
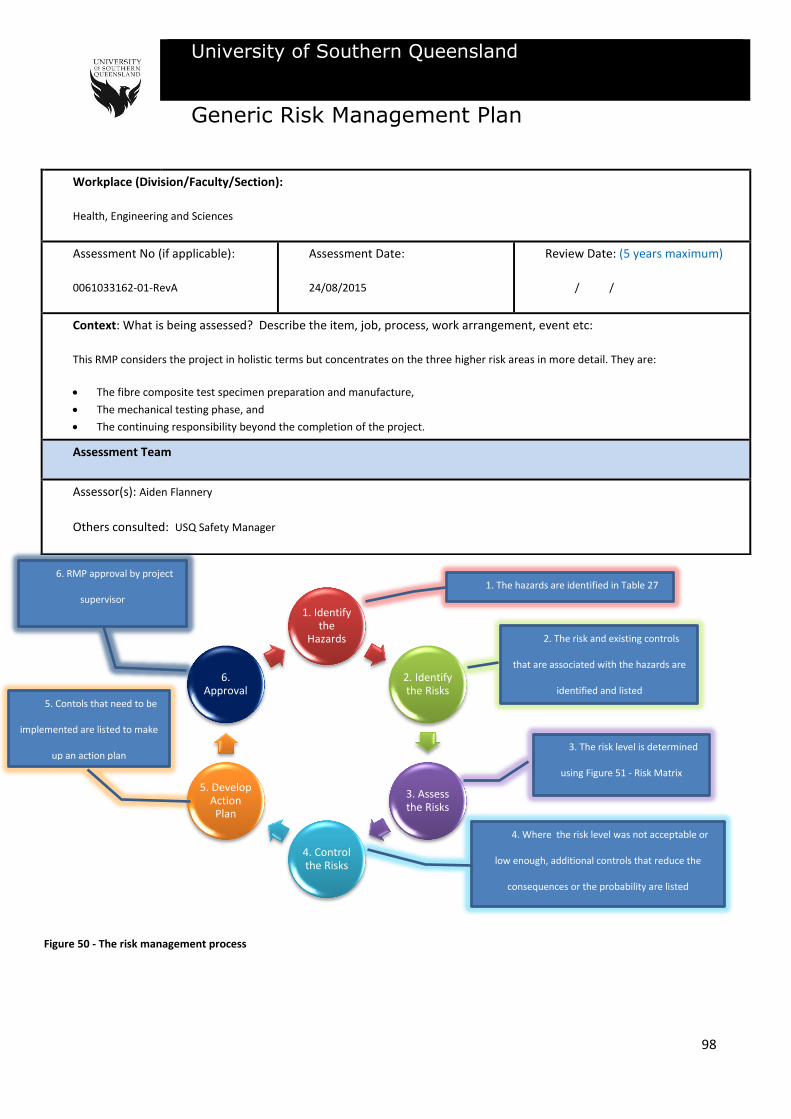
98
1. Identify the
Hazards
2. Identify the Risks
3. Assess the Risks
4. Control the Risks
5. Develop Action Plan
6. Approval
University of Southern Queensland
Generic Risk Management Plan
Workplace (Division/Faculty/Section):
Health, Engineering and Sciences
Assessment No (if applicable):
0061033162-01-RevA
Assessment Date:
24/08/2015
Review Date: (5 years maximum)
/ /
Context: What is being assessed? Describe the item, job, process, work arrangement, event etc:
This RMP considers the project in holistic terms but concentrates on the three higher risk areas in more detail. They are:
The fibre composite test specimen preparation and manufacture,
The mechanical testing phase, and
The continuing responsibility beyond the completion of the project.
Assessment Team
Assessor(s): Aiden Flannery
Others consulted: USQ Safety Manager
1. The hazards are identified in Table 27
2. The risk and existing controls
that are associated with the hazards are
identified and listed
3. The risk level is determined
using Figure 51 - Risk Matrix
4. Where the risk level was not acceptable or
low enough, additional controls that reduce the
consequences or the probability are listed
5. Contols that need to be
implemented are listed to make
up an action plan
6. RMP approval by project
supervisor
Figure 50 - The risk management process

99
Table 27 – Identified hazards
Step 1 - Identify the hazards
General Work Environment
Sun exposure Water (creek, river, beach,
dam)
Sound / Noise
Animals / Insects Storms /
Weather/Wind/Lightning
Temperature (heat, cold)
Air Quality Lighting Uneven Walking Surface
Trip Hazards Confined Spaces Restricted access/egress
Pressure (Diving/Altitude) Smoke
Machinery, Plant and Equipment
Machinery (fixed plant) Machinery (portable) Hand tools
Laser (Class 2 or above) Elevated work platforms Traffic Control
Non-powered equipment Pressure Vessel Electrical
Vibration Moving Parts Acoustic/Noise
Vehicles Trailers Hand tools
Manual Tasks / Ergonomics
Manual tasks (repetitive, heavy) Working at heights Restricted space
Vibration Lifting Carrying Pushing/pulling
Reaching/Overstretching Repetitive Movement Bending
Eye strain Machinery (portable) Hand tools
Biological (e.g. hygiene, disease, infection)
Human tissue/fluids Virus / Disease Food handling
Microbiological Animal tissue/fluids Allergenic
Chemicals Note: Refer to the label and Safety Data Sheet (SDS) for the classification and management of all chemicals.
Non-hazardous chemical(s) ‘Hazardous’ chemical (Refer to a completed hazardous chemical risk assessment)
Engineered nanoparticles Explosives Gas Cylinders
Critical Incident – resulting in:
Lockdown Evacuation Disruption
Public Image/Adverse Media Issue Violence Environmental Issue
Radiation
Ionising radiation Ultraviolet (UV) radiation Radio frequency/microwave
infrared (IR) radiation Laser (class 2 or above)
Energy Systems – incident / issues involving:
Electricity (incl. Mains and Solar) LPG Gas Gas / Pressurised containers
Facilities / Built Environment
Buildings and fixtures Driveway / Paths Workshops / Work rooms
Playground equipment Furniture Swimming pool
People issues
Students Staff Visitors / Others
Physical Psychological / Stress Contractors
Fatigue Workload Organisational Change
Workplace Violence/Bullying Inexperienced/new personnel
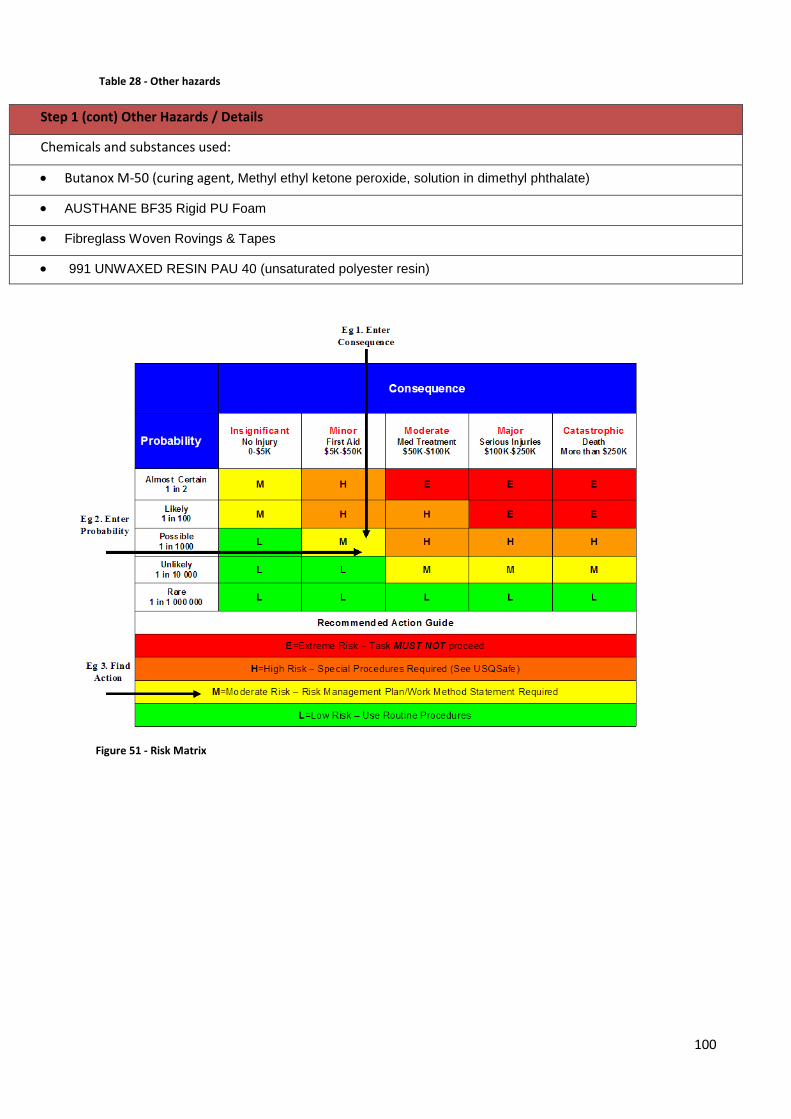
100
Table 28 - Other hazards
Step 1 (cont) Other Hazards / Details
Chemicals and substances used:
Butanox M-50 (curing agent, Methyl ethyl ketone peroxide, solution in dimethyl phthalate)
AUSTHANE BF35 Rigid PU Foam
Fibreglass Woven Rovings & Tapes
991 UNWAXED RESIN PAU 40 (unsaturated polyester resin)
Figure 51 - Risk Matrix
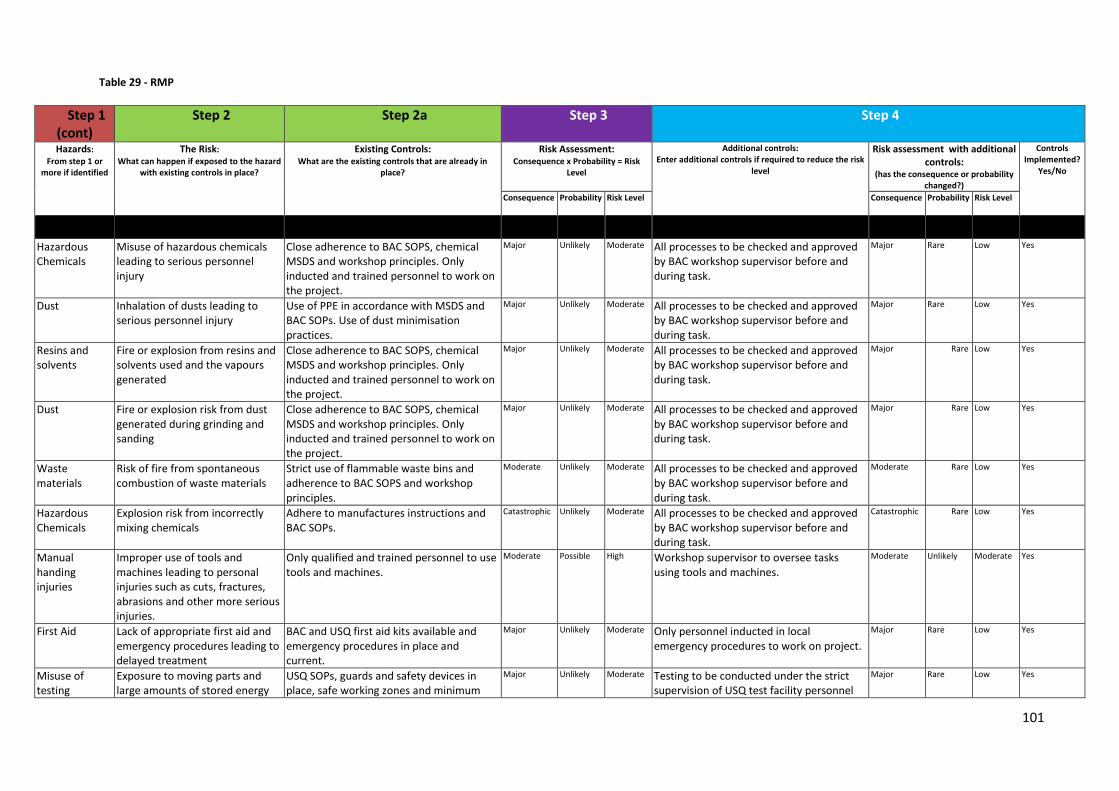
101
Table 29 - RMP
Step 1 (cont)
Step 2 Step 2a Step 3 Step 4
Hazards:
From step 1 or more if identified
The Risk:
What can happen if exposed to the hazard with existing controls in place?
Existing Controls: What are the existing controls that are already in
place?
Risk Assessment: Consequence x Probability = Risk
Level
Additional controls: Enter additional controls if required to reduce the risk
level
Risk assessment with additional controls:
(has the consequence or probability changed?)
Controls Implemented?
Yes/No
Consequence Probability Risk Level Consequence Probability Risk Level
Moderate
Unlikely
Moderate
Yes or No
Hazardous Chemicals
Misuse of hazardous chemicals leading to serious personnel injury
Close adherence to BAC SOPS, chemical MSDS and workshop principles. Only inducted and trained personnel to work on the project.
Major Unlikely Moderate All processes to be checked and approved by BAC workshop supervisor before and during task.
Major Rare Low Yes
Dust Inhalation of dusts leading to serious personnel injury
Use of PPE in accordance with MSDS and BAC SOPs. Use of dust minimisation practices.
Major Unlikely Moderate All processes to be checked and approved by BAC workshop supervisor before and during task.
Major Rare Low Yes
Resins and solvents
Fire or explosion from resins and solvents used and the vapours generated
Close adherence to BAC SOPS, chemical MSDS and workshop principles. Only inducted and trained personnel to work on the project.
Major Unlikely Moderate All processes to be checked and approved by BAC workshop supervisor before and during task.
Major Rare Low Yes
Dust Fire or explosion risk from dust generated during grinding and sanding
Close adherence to BAC SOPS, chemical MSDS and workshop principles. Only inducted and trained personnel to work on the project.
Major Unlikely Moderate All processes to be checked and approved by BAC workshop supervisor before and during task.
Major Rare Low Yes
Waste materials
Risk of fire from spontaneous combustion of waste materials
Strict use of flammable waste bins and adherence to BAC SOPS and workshop principles.
Moderate Unlikely Moderate All processes to be checked and approved by BAC workshop supervisor before and during task.
Moderate Rare Low Yes
Hazardous Chemicals
Explosion risk from incorrectly mixing chemicals
Adhere to manufactures instructions and BAC SOPs.
Catastrophic Unlikely Moderate All processes to be checked and approved by BAC workshop supervisor before and during task.
Catastrophic Rare Low Yes
Manual handing injuries
Improper use of tools and machines leading to personal injuries such as cuts, fractures, abrasions and other more serious injuries.
Only qualified and trained personnel to use tools and machines.
Moderate Possible High Workshop supervisor to oversee tasks using tools and machines.
Moderate Unlikely Moderate Yes
First Aid Lack of appropriate first aid and emergency procedures leading to delayed treatment
BAC and USQ first aid kits available and emergency procedures in place and current.
Major Unlikely Moderate Only personnel inducted in local emergency procedures to work on project.
Major Rare Low Yes
Misuse of testing
Exposure to moving parts and large amounts of stored energy
USQ SOPs, guards and safety devices in place, safe working zones and minimum
Major Unlikely Moderate Testing to be conducted under the strict supervision of USQ test facility personnel
Major Rare Low Yes
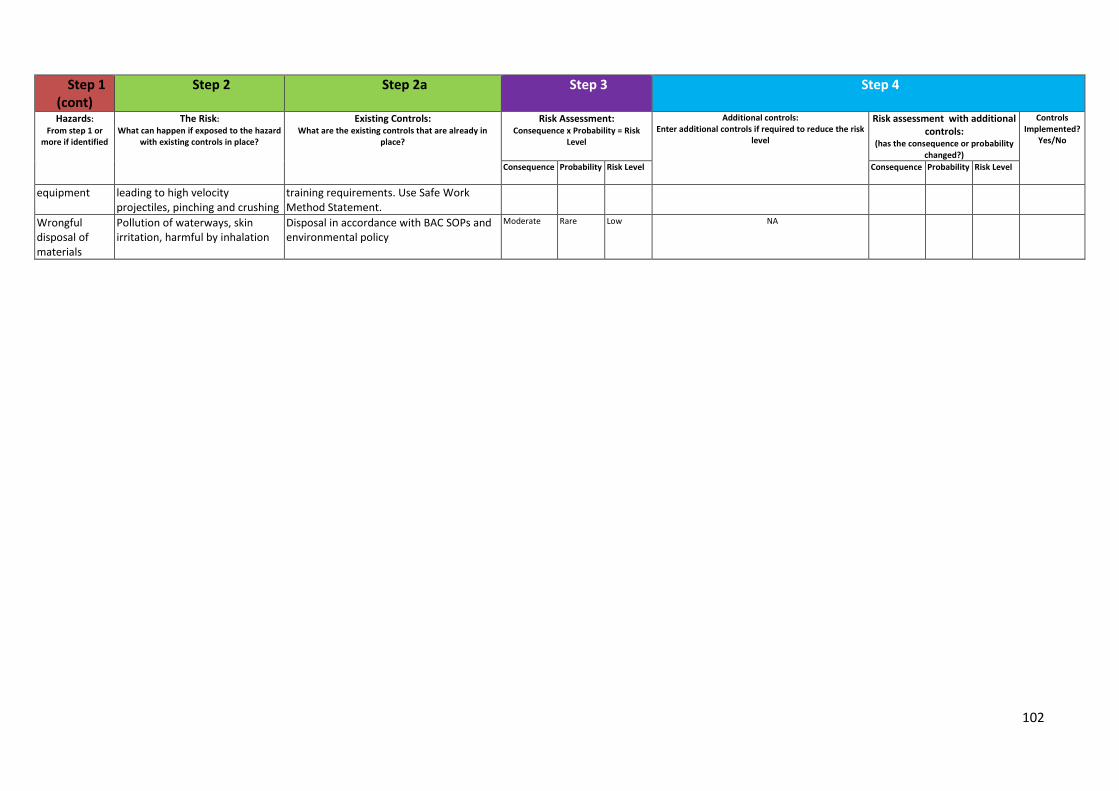
102
Step 1 (cont)
Step 2 Step 2a Step 3 Step 4
Hazards:
From step 1 or more if identified
The Risk:
What can happen if exposed to the hazard with existing controls in place?
Existing Controls: What are the existing controls that are already in
place?
Risk Assessment: Consequence x Probability = Risk
Level
Additional controls: Enter additional controls if required to reduce the risk
level
Risk assessment with additional controls:
(has the consequence or probability changed?)
Controls Implemented?
Yes/No
Consequence Probability Risk Level Consequence Probability Risk Level
equipment leading to high velocity projectiles, pinching and crushing
training requirements. Use Safe Work Method Statement.
Wrongful disposal of materials
Pollution of waterways, skin irritation, harmful by inhalation
Disposal in accordance with BAC SOPs and environmental policy
Moderate Rare Low NA
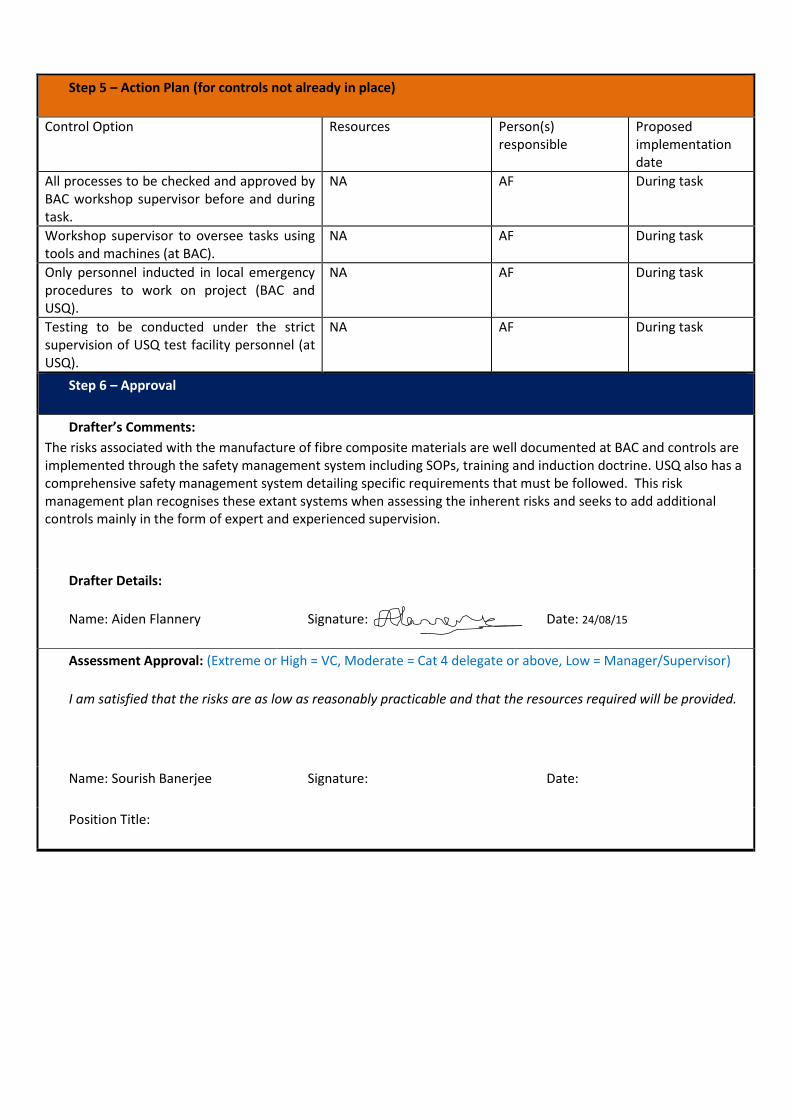
Step 5 – Action Plan (for controls not already in place)
Control Option Resources Person(s) responsible
Proposed implementation date
All processes to be checked and approved by BAC workshop supervisor before and during task.
NA AF During task
Workshop supervisor to oversee tasks using tools and machines (at BAC).
NA AF During task
Only personnel inducted in local emergency procedures to work on project (BAC and USQ).
NA AF During task
Testing to be conducted under the strict supervision of USQ test facility personnel (at USQ).
NA AF During task
Step 6 – Approval
Drafter’s Comments:
The risks associated with the manufacture of fibre composite materials are well documented at BAC and controls are implemented through the safety management system including SOPs, training and induction doctrine. USQ also has a comprehensive safety management system detailing specific requirements that must be followed. This risk management plan recognises these extant systems when assessing the inherent risks and seeks to add additional controls mainly in the form of expert and experienced supervision.
Drafter Details:
Name: Aiden Flannery
Signature:
Date: 24/08/15
Assessment Approval: (Extreme or High = VC, Moderate = Cat 4 delegate or above, Low = Manager/Supervisor)
I am satisfied that the risks are as low as reasonably practicable and that the resources required will be provided.
Name: Sourish Banerjee Signature: Date:
Position Title:
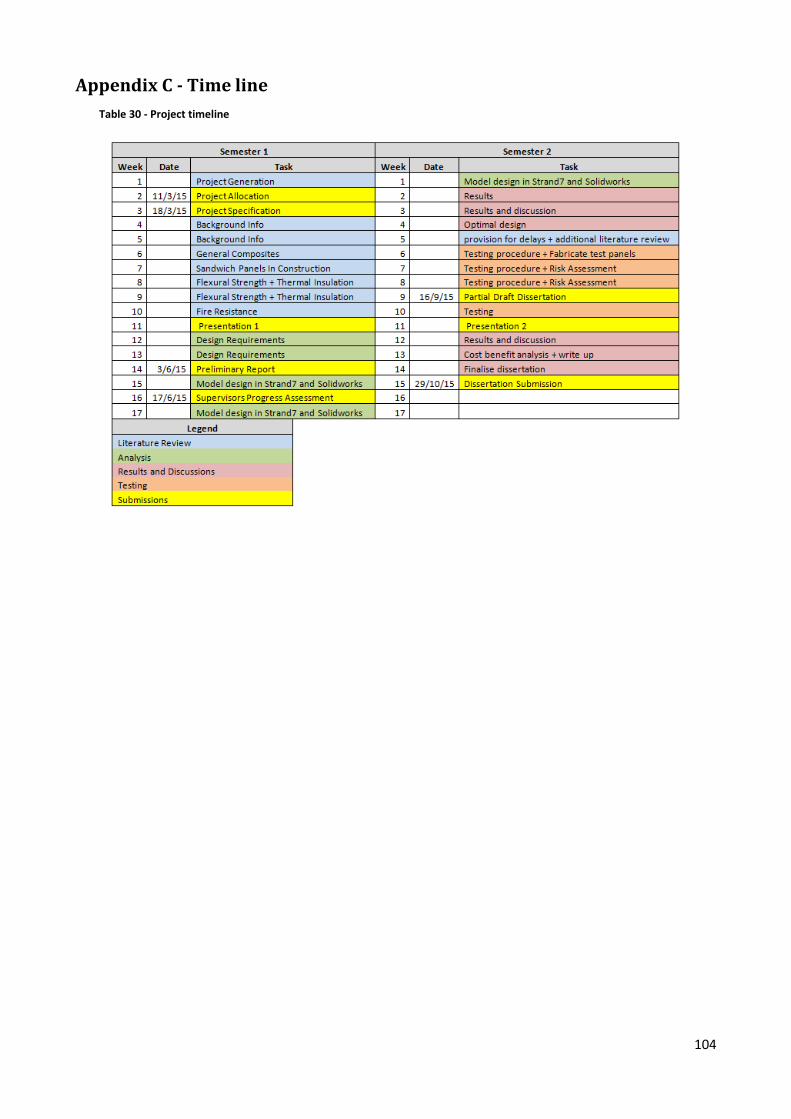
104
Appendix C - Time line
Table 30 - Project timeline
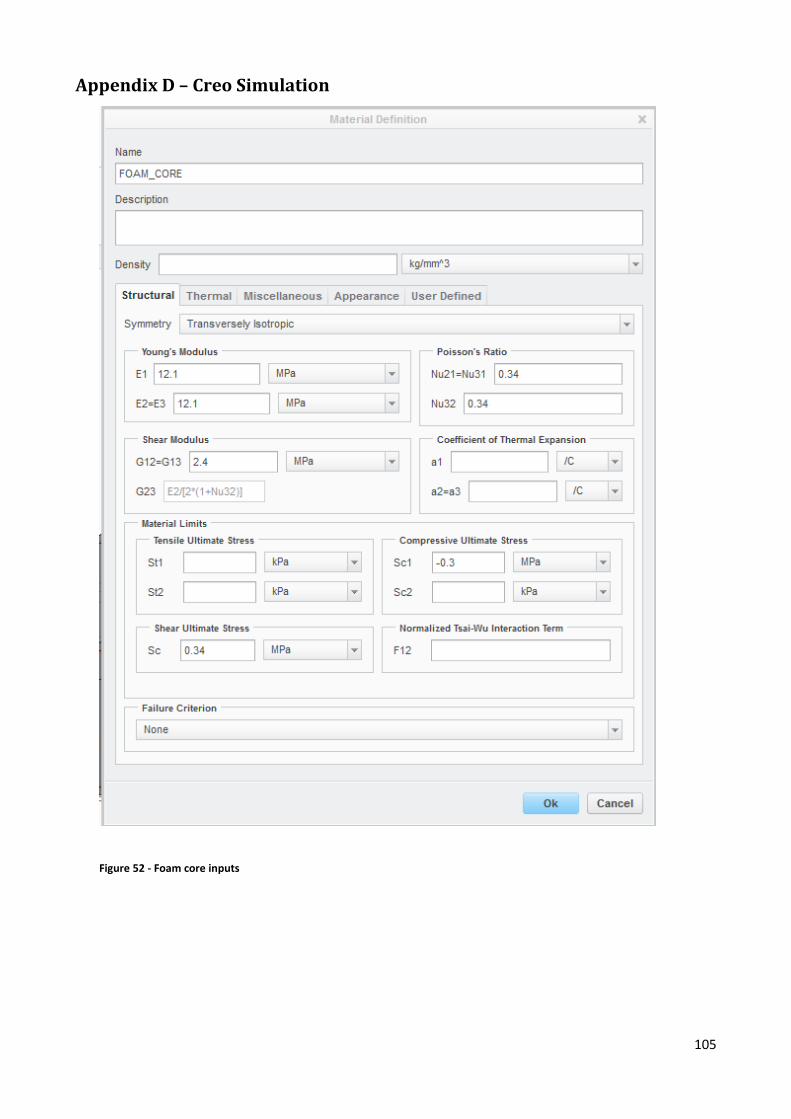
105
Appendix D – Creo Simulation
Figure 52 - Foam core inputs
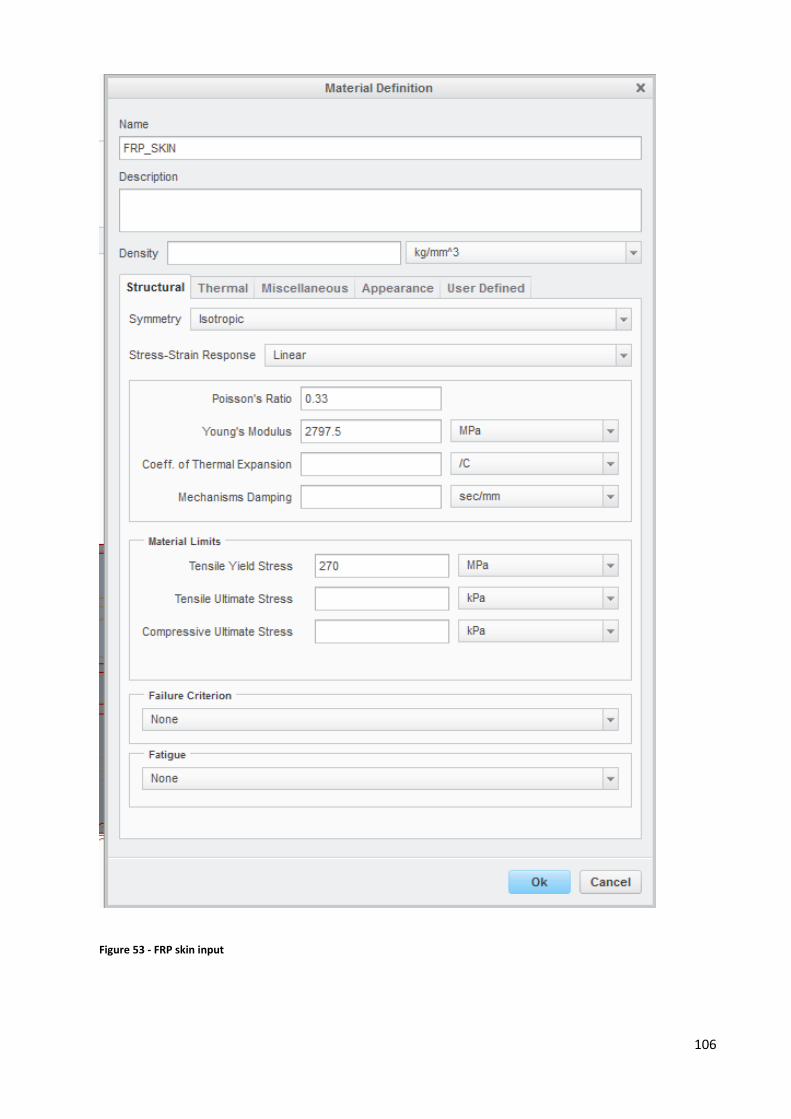
106
Figure 53 - FRP skin input
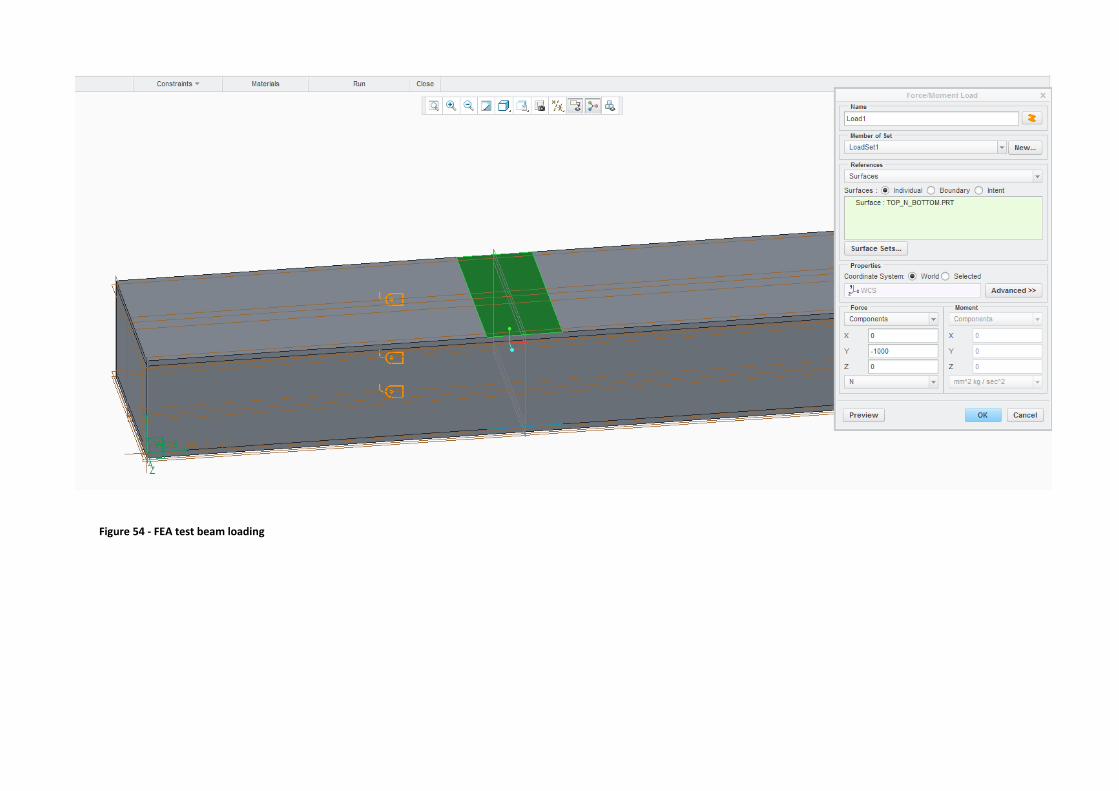
Figure 54 - FEA test beam loading
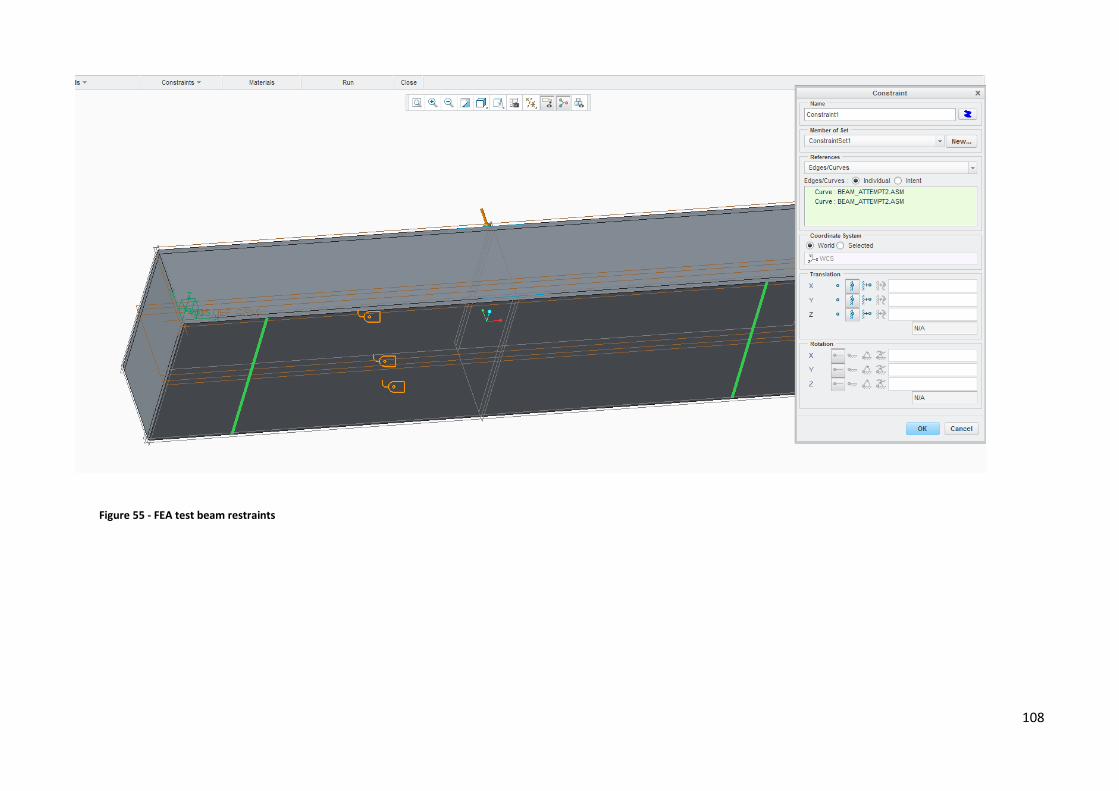
108
Figure 55 - FEA test beam restraints
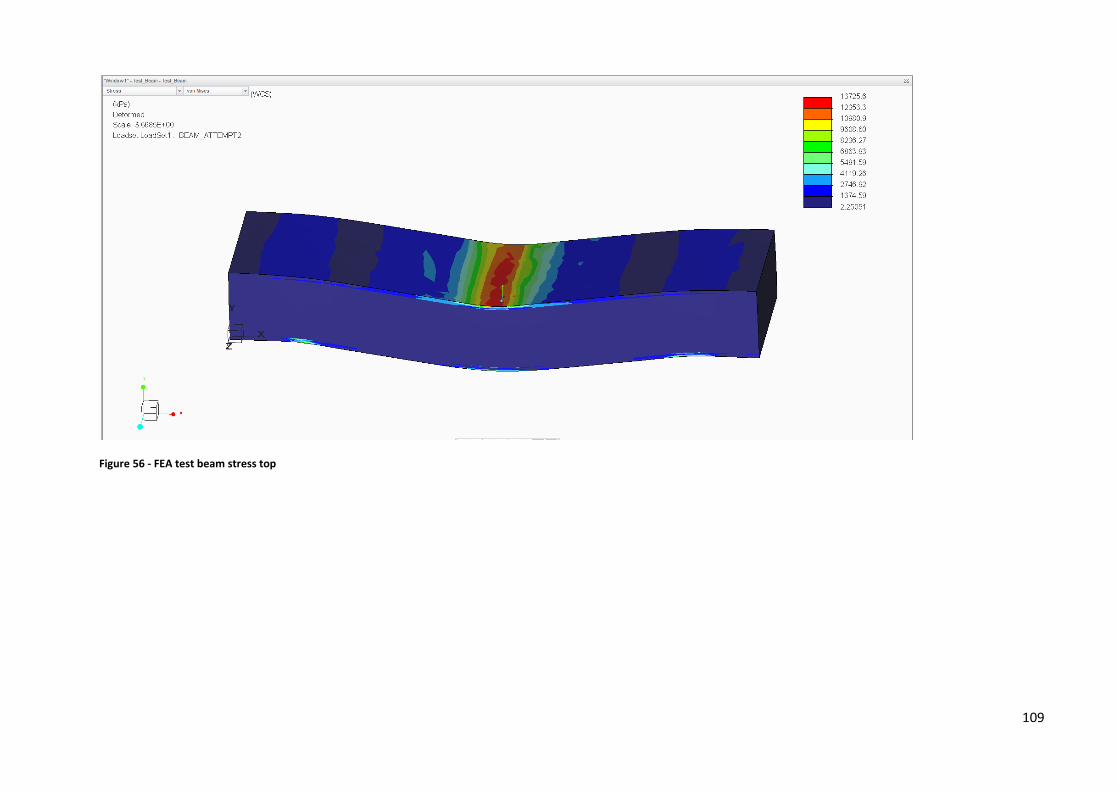
109
Figure 56 - FEA test beam stress top
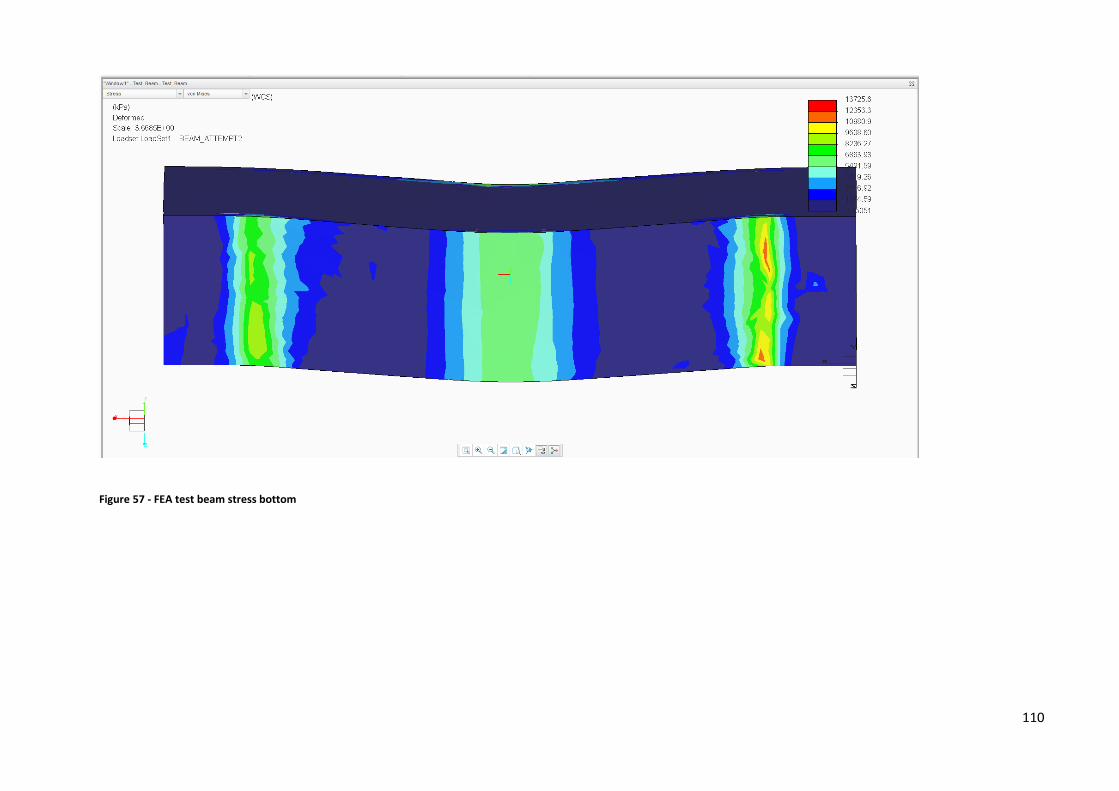
110
Figure 57 - FEA test beam stress bottom
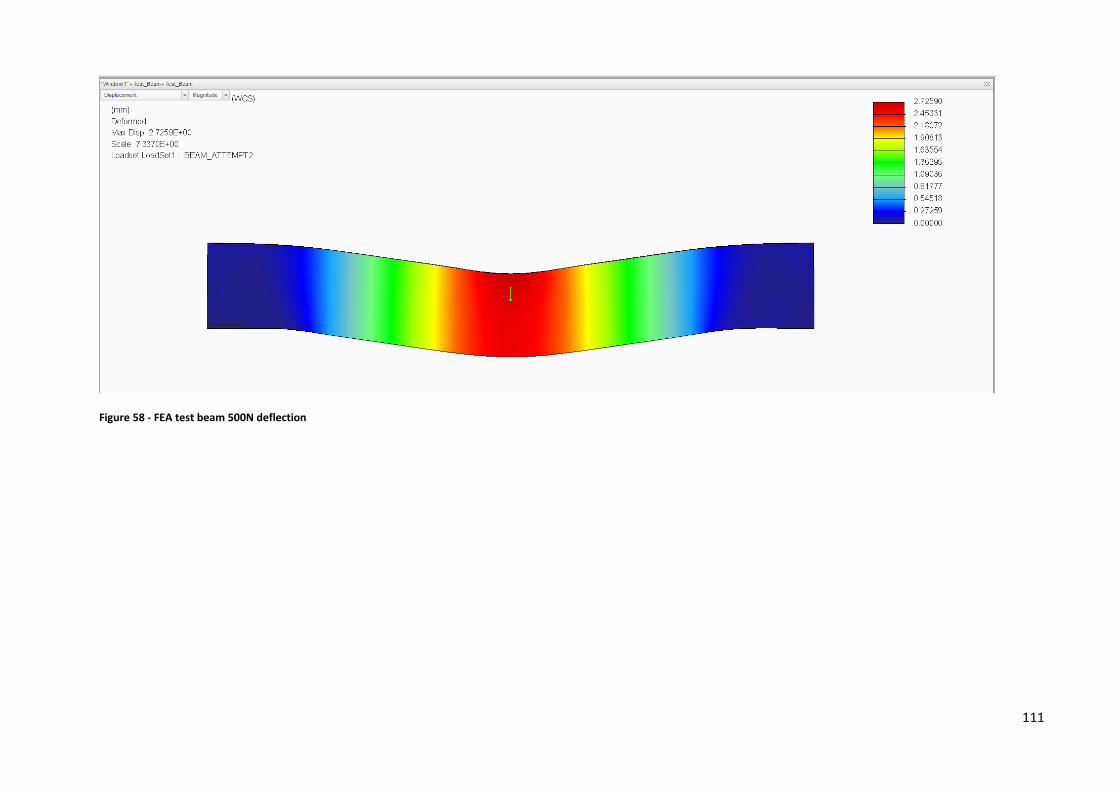
111
Figure 58 - FEA test beam 500N deflection
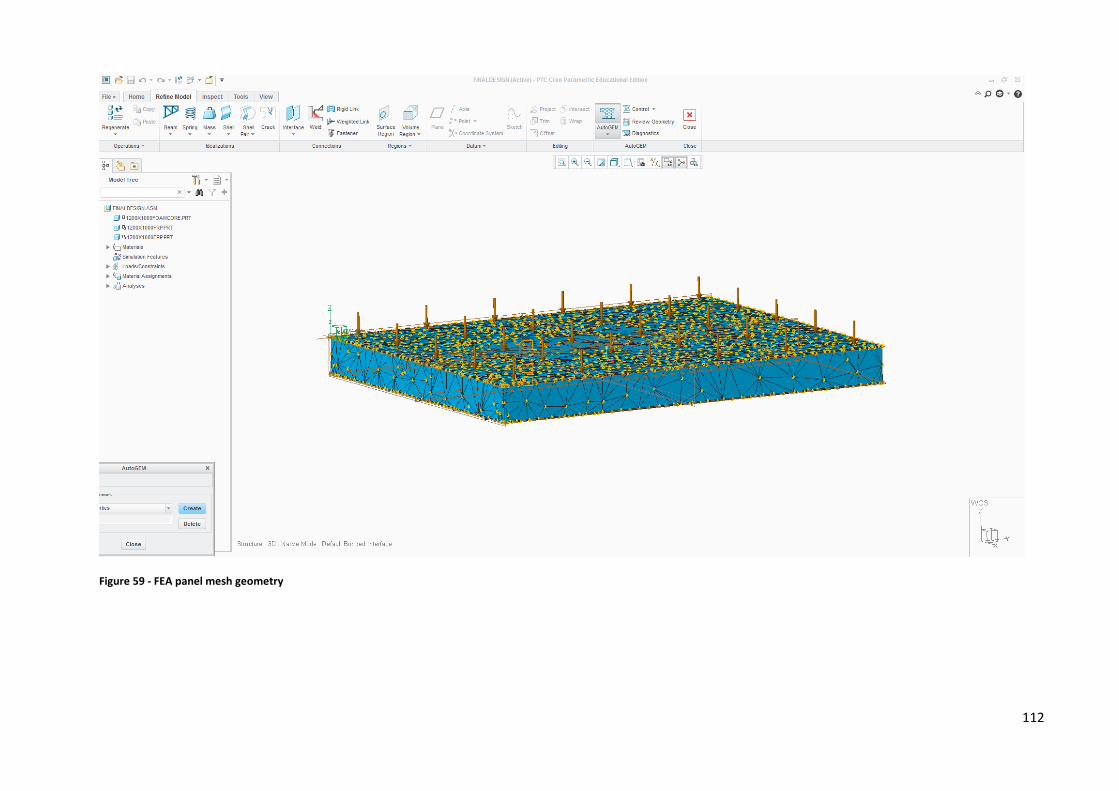
112
Figure 59 - FEA panel mesh geometry