Embed Size (px)
Citation preview

Low Velocity Impact Properties of Sandwich Insulated Panels with Textile -
Reinforced Concrete Skin and Aerated Concrete Core
by
Vikram Dey
A Thesis Presented in Partial Fulfillment
of the Requirements for the Degree
Master of Science
Approved November 2012 by the
Graduate Supervisory Committee:
Barzin Mobasher, Chair
Subramaniam D. Rajan
Narayanan Neithalath
ARIZONA STATE UNIVERSITY
December 2012
i
ABSTRACT
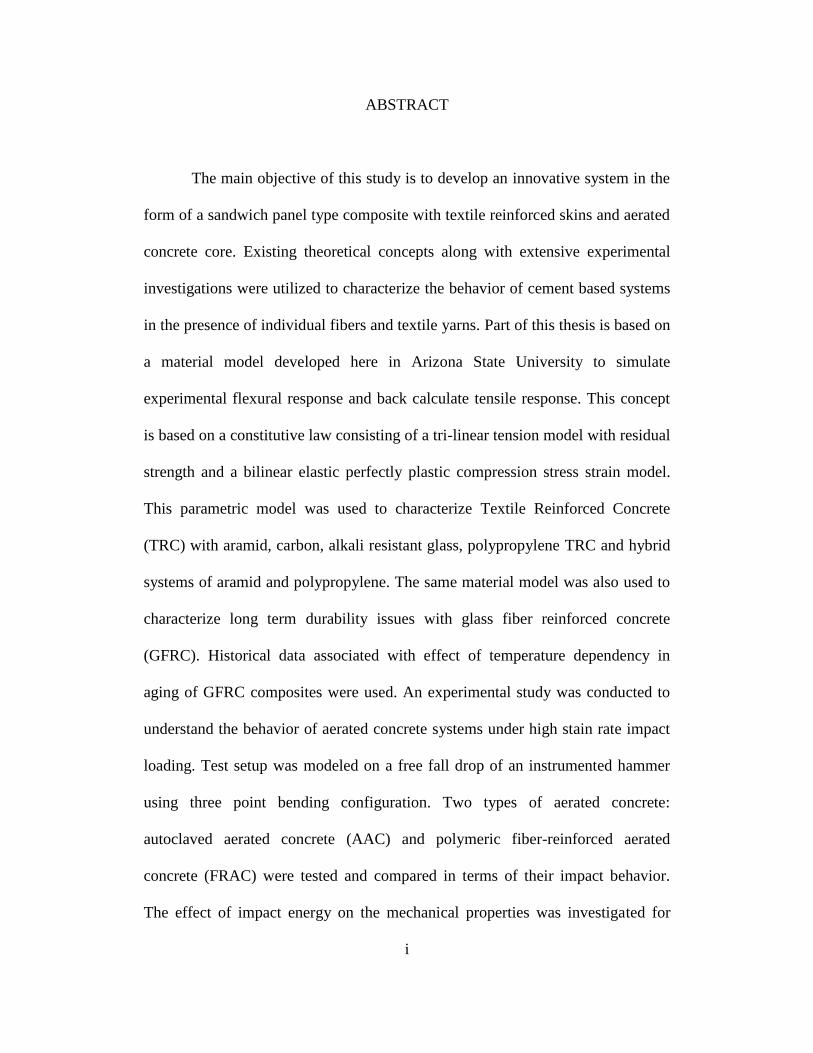
The main objective of this study is to develop an innovative system in the
form of a sandwich panel type composite with textile reinforced skins and aerated
concrete core. Existing theoretical concepts along with extensive experimental
investigations were utilized to characterize the behavior of cement based systems
in the presence of individual fibers and textile yarns. Part of this thesis is based on
a material model developed here in Arizona State University to simulate
experimental flexural response and back calculate tensile response. This concept
is based on a constitutive law consisting of a tri-linear tension model with residual
strength and a bilinear elastic perfectly plastic compression stress strain model.
This parametric model was used to characterize Textile Reinforced Concrete
(TRC) with aramid, carbon, alkali resistant glass, polypropylene TRC and hybrid
systems of aramid and polypropylene. The same material model was also used to
characterize long term durability issues with glass fiber reinforced concrete
(GFRC). Historical data associated with effect of temperature dependency in
aging of GFRC composites were used. An experimental study was conducted to
understand the behavior of aerated concrete systems under high stain rate impact
loading. Test setup was modeled on a free fall drop of an instrumented hammer
using three point bending configuration. Two types of aerated concrete:
autoclaved aerated concrete (AAC) and polymeric fiber-reinforced aerated
concrete (FRAC) were tested and compared in terms of their impact behavior.
The effect of impact energy on the mechanical properties was investigated for
ii
various drop heights and different specimen sizes. Both materials showed similar
flexural load carrying capacity under impact, however, flexural toughness of
fiber-reinforced aerated concrete was proved to be several degrees higher in
magnitude than that provided by plain autoclaved aerated concrete. Effect of
specimen size and drop height on the impact response of AAC and FRAC was
studied and discussed. Results obtained were compared to the performance of
sandwich beams with AR glass textile skins with aerated concrete core under
similar impact conditions. After this extensive study it was concluded that this
type of sandwich composite could be effectively used in low cost sustainable
infrastructure projects.
iii
ACKNOWLEDGEMENTS
I would like to express my sincere gratitude to my advisor and committee
chair, Dr. Barzin Mobasher, for his undivided attention, guidance, encouragement
and motivation throughout my research. I would like to extend my regards to Dr.
Subramaniam D. Rajan and Dr. Narayanan Neithalath for being in my thesis
committee and providing me insight into several technical nuances that I tried to
utilize throughout my Master’s degree program. I would also like to acknowledge
Dr. Amir Bonakdar for continuously challenging yet supporting me throughout
my research work. I greatly appreciate the assistance provided by Peter Goguen
and Kenneth Witczak for all the laboratory works. I would like to acknowledge all
my classmates and colleagues, especially Sean Krauss, Arumugam
Deivanayagam, and Yiming Yao. I would also thank Giulio Zani, Christopher
Barsby, Dr. Deju Zhu and Zvi Cohen for their assistance in some of my work. I
am very glad to have the moral support from all my friends Lavannya, Vaidehi,
Aditi, Nikhil, Vamsi, Abhinav and Deepak. I would also like to express my
gratitude to all the SSEBE and ASU administrative staffs for their kind help and
support. I would like to acknowledge Navajo Flexcrete Building Systems and
AAC Structures of Arizona for providing me some of the necessary material
resources for this study.

iv
I dedicate this to my grandmother, Late Anita Nag, my parents Radha and Dilip
Kumar Dey, my brother Ankur Dey, my teacher Chitra Bhattacharjee. Without
their love, mentoring and motivation this journey would not have been possible.

v
TABLE OF CONTENTS
Page
LIST OF TABLES ......................................................................................... viii
LIST OF FIGURES ...........................................................................................x
CHAPTER
1. INTRODUCTION .................................................................................1
2. CHARACTERIZATION OF FABRIC REINFORCED CEMENT-
BASED SKIN COMPOSITES ..............................................................7
2.1 Constitutive Law for Homogenized Fiber Reinforced Concrete .....8
2.2 Closed Form Solutions for Moment-Curvature Relationship ..........9
2.3 Crack Localization Rules and Load Deflection Prediction ............13
2.4 Experimental Plan ..........................................................................16
2.5 Analysis - Prediction of Load Deflection Response of Fabric
Cement Composites .............................................................................21
2.5.1 100 % Systems ................................................................22
2.5.2 Polypropylene – Aramid Hybrid Systems ......................28
2.6 Conclusions ....................................................................................35
3. MODELING OF DURABILITY OF TEXTILE AND GLASS FIBER
REINFORCED CEMENT COMPOSITES .........................................37
3.1 Effect of matrix ingredients in durability of GFRC composites ....41
3.1.1 Inverse Analysis ..............................................................43
vi
CHAPTER Page
3.1.2 Results and Discussions ..................................................44
3.1.3 Comparison between model parameters due to the aging
affect ........................................................................................50
3.2 Temperature dependence in ageing of GFRC composites .............52
3.2.1 Comparison of the present Model with Historical Data .52
3.2.2 Inverse Analysis ..............................................................54
3.3 Conclusions ....................................................................................58
4. IMPACT RESPONSE OF FIBER REINFORCED AERATED
CONCRETE AS THE CORE MATERIAL ........................................59
4.1 Introduction to Aerated Concrete ...................................................60
4.2 Experimental Program ...................................................................67
4.2.1Material Properties ...........................................................67
4.2.2 Impact test procedure and instrumentation .....................70
4.2.3 Theoretical background ..................................................72
4.3 Analysis of test data .......................................................................75
4.4 Discussion of Test Results .............................................................82
4.4.2 Size Effect .......................................................................85
4.4.3 Comparison between FRAC and AAC specimen ...........88
4.5 Energy Absorption .........................................................................92
4.6 Crack Propagation ..........................................................................94
4.7 Conclusions ..................................................................................100
vii
CHAPTER Page
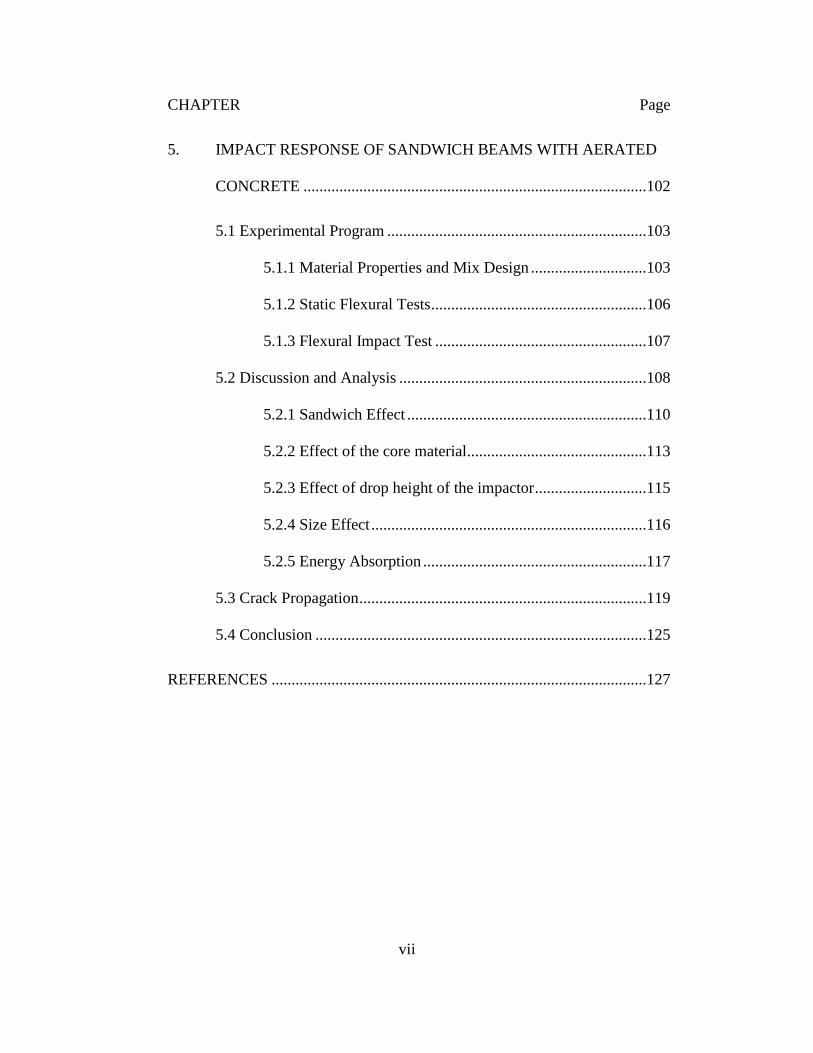
5. IMPACT RESPONSE OF SANDWICH BEAMS WITH AERATED
CONCRETE ......................................................................................102
5.1 Experimental Program .................................................................103
5.1.1 Material Properties and Mix Design .............................103
5.1.2 Static Flexural Tests ......................................................106
5.1.3 Flexural Impact Test .....................................................107
5.2 Discussion and Analysis ..............................................................108
5.2.1 Sandwich Effect ............................................................110
5.2.2 Effect of the core material.............................................113
5.2.3 Effect of drop height of the impactor ............................115
5.2.4 Size Effect .....................................................................116
5.2.5 Energy Absorption ........................................................117
5.3 Crack Propagation ........................................................................119
5.4 Conclusion ...................................................................................125
REFERENCES ..............................................................................................127
viii
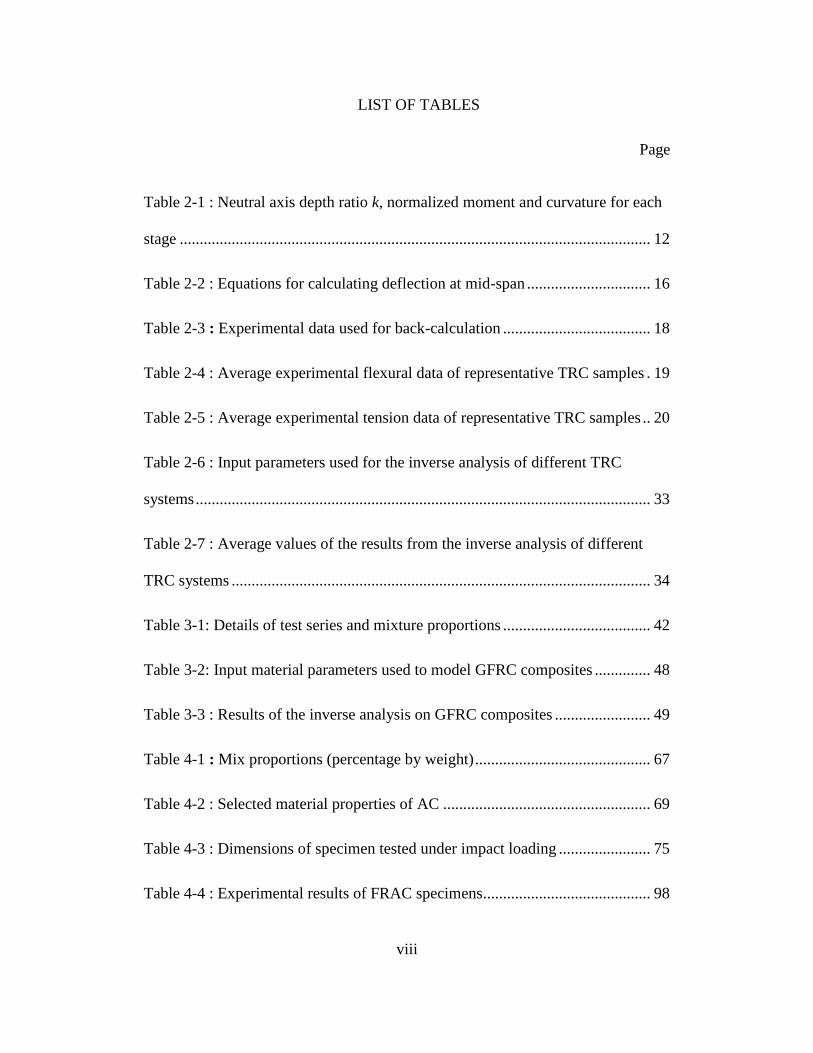
LIST OF TABLES
Page
Table 2-1 : Neutral axis depth ratio k, normalized moment and curvature for each
stage ...................................................................................................................... 12
Table 2-2 : Equations for calculating deflection at mid-span ............................... 16
Table 2-3 : Experimental data used for back-calculation ..................................... 18
Table 2-4 : Average experimental flexural data of representative TRC samples . 19
Table 2-5 : Average experimental tension data of representative TRC samples .. 20
Table 2-6 : Input parameters used for the inverse analysis of different TRC
systems .................................................................................................................. 33
Table 2-7 : Average values of the results from the inverse analysis of different
TRC systems ......................................................................................................... 34
Table 3-1: Details of test series and mixture proportions ..................................... 42
Table 3-2: Input material parameters used to model GFRC composites .............. 48
Table 3-3 : Results of the inverse analysis on GFRC composites ........................ 49
Table 4-1 : Mix proportions (percentage by weight) ............................................ 67
Table 4-2 : Selected material properties of AC .................................................... 69
Table 4-3 : Dimensions of specimen tested under impact loading ....................... 75
Table 4-4 : Experimental results of FRAC specimens .......................................... 98
ix
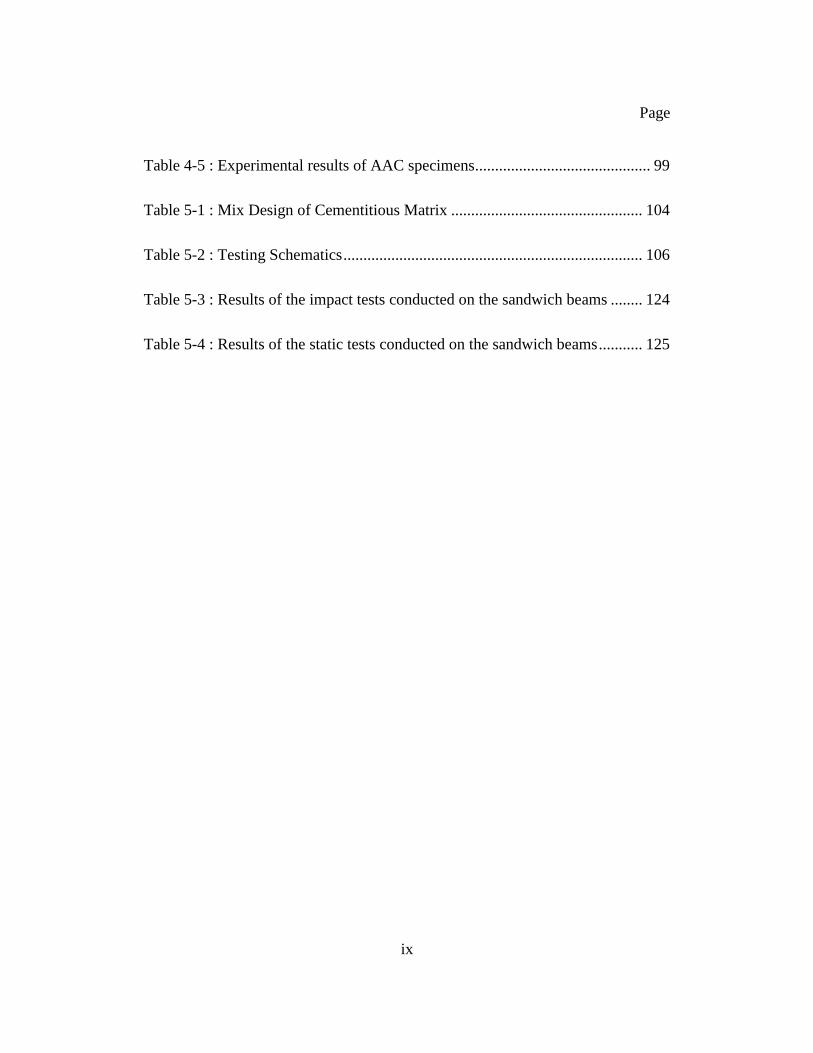
Page
Table 4-5 : Experimental results of AAC specimens ............................................ 99
Table 5-1 : Mix Design of Cementitious Matrix ................................................ 104
Table 5-2 : Testing Schematics ........................................................................... 106
Table 5-3 : Results of the impact tests conducted on the sandwich beams ........ 124
Table 5-4 : Results of the static tests conducted on the sandwich beams ........... 125

x
LIST OF FIGURES
Page
Figure 1-1 : Plan of this study ................................................................................. 2
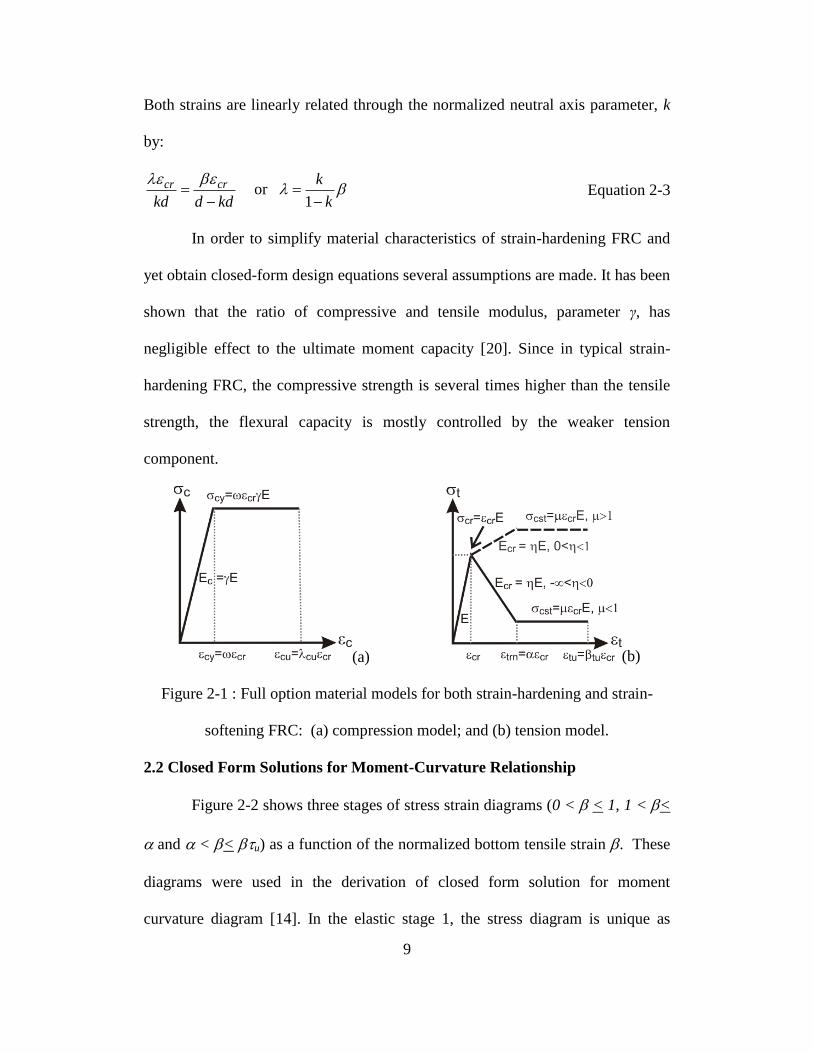
Figure 2-1 : Full option material models for both strain-hardening and strain-
softening FRC: (a) compression model; and (b) tension model. ............... 9
Figure 2-2 : Different stages of constitutive stress-strain diagram ....................... 10
Figure 2-3 : (a) Four point bending test, (b): Moment curvature response and
crack localization rule ............................................................................... 13
Figure 2-4 : Moment-Curvature relationship of strain-hardening FRC and its
bilinear idealization. .................................................................................. 15
Figure 2-5 : 100 % Aramid; (a) Flexural, (b) Tension responses ......................... 23
Figure 2-6 : 100 % Carbon; (a) Flexural, (b) Tension responses.......................... 25
Figure 2-7 : 100 % Glass; (a) Flexural, (b) Tension responses ............................ 26
Figure 2-8 : 100 % Polypropylene; (a) Flexural, (b) Tension responses .............. 27
Figure 2-9 : Comparison between 100 % systems; ; (a) Flexural, (b) Tension
responses ................................................................................................... 28
Figure 2-10 : Hybrid of 75 % Aramid + 25 % Polypropylene; (a) Flexural, (b)
Tension responses ..................................................................................... 29
Figure 2-11 : Hybrid of 50 % Aramid + 50 % Polypropylene; (a) Flexural, (b)
Tension responses ..................................................................................... 29
Figure 2-12 : Hybrid of 25 % Aramid + 75 % Polypropylene; (a) Flexural, (b)
Tension responses ..................................................................................... 30
xi
Page
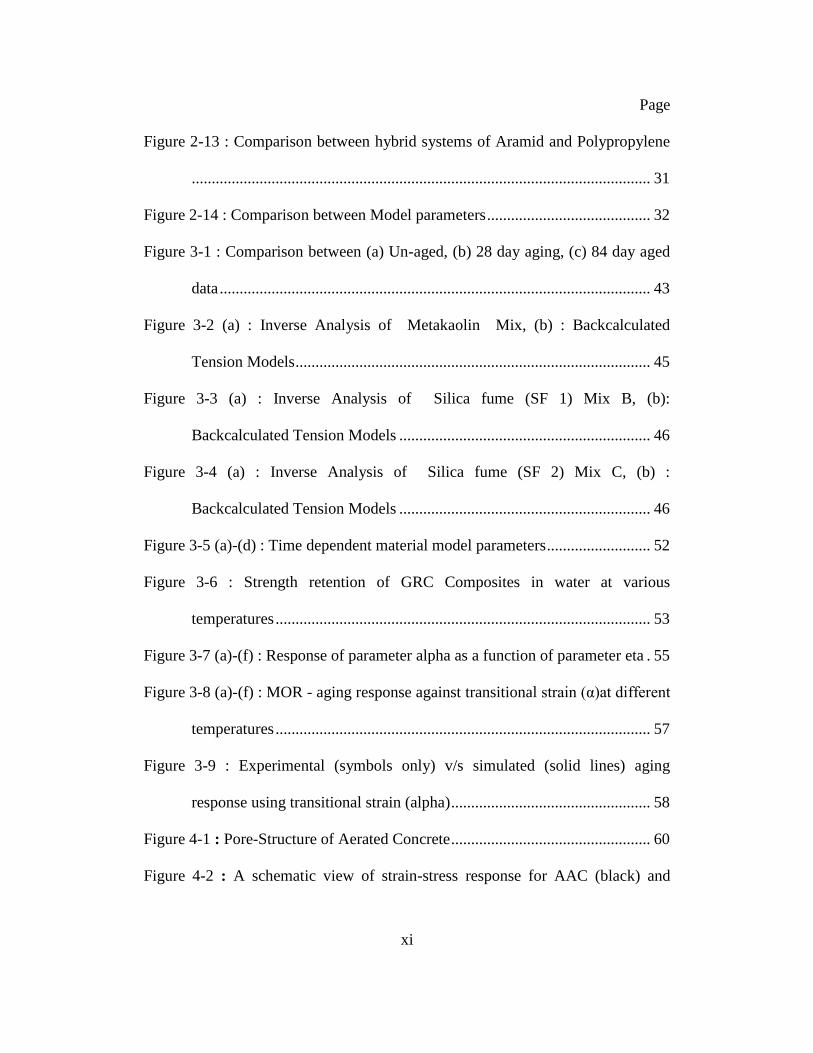
Figure 2-13 : Comparison between hybrid systems of Aramid and Polypropylene
................................................................................................................... 31
Figure 2-14 : Comparison between Model parameters ......................................... 32
Figure 3-1 : Comparison between (a) Un-aged, (b) 28 day aging, (c) 84 day aged
data ............................................................................................................ 43
Figure 3-2 (a) : Inverse Analysis of Metakaolin Mix, (b) : Backcalculated
Tension Models ......................................................................................... 45
Figure 3-3 (a) : Inverse Analysis of Silica fume (SF 1) Mix B, (b):
Backcalculated Tension Models ............................................................... 46
Figure 3-4 (a) : Inverse Analysis of Silica fume (SF 2) Mix C, (b) :
Backcalculated Tension Models ............................................................... 46
Figure 3-5 (a)-(d) : Time dependent material model parameters .......................... 52
Figure 3-6 : Strength retention of GRC Composites in water at various
temperatures .............................................................................................. 53
Figure 3-7 (a)-(f) : Response of parameter alpha as a function of parameter eta . 55
Figure 3-8 (a)-(f) : MOR - aging response against transitional strain (α)at different
temperatures .............................................................................................. 57
Figure 3-9 : Experimental (symbols only) v/s simulated (solid lines) aging
response using transitional strain (alpha) .................................................. 58
Figure 4-1 : Pore-Structure of Aerated Concrete .................................................. 60
Figure 4-2 : A schematic view of strain-stress response for AAC (black) and
xii
Page
FRAC (gray) [86] ...................................................................................... 63
Figure 4-3 : Setup of static flexural test conducted on notched AC beams
(150x150x450 mm) ................................................................................... 69
Figure 4-4 : Static flexural load versus deflection for (a) AAC and (b) FRAC.... 70
Figure 4-5 : Schematic diagram (a) and actual picture (b) of impact test set-up .. 71
Figure 4-6 : Different stages involved in processing of experimental data .......... 78
Figure 4-7 : Flow Chart explaining the analysis involved .................................... 79
Figure 4-8 (a)-(d) : Post analysis response of an impact test event ...................... 80
Figure 4-9 : Time history of impact event of FRAC under low velocity impact.. 82
Figure 4-10 (a)-(b) : Response of replicate FRAC-B specimens tested for same
drop height ................................................................................................ 82
Figure 4-11 (a)-(b) : Effect of drop height on FRAC specimen ........................... 84
Figure 4-12 (a)-(b) : Effect of drop height on AAC specimens ............................ 85
Figure 4-13 (a)-(b) : Size effect on FRAC specimen ............................................ 86
Figure 4-14 (a)-(b) : Size effect on AAC specimen subjected to impact loads .... 88
Figure 4-15 (a)-(c) : Comparison between FRAC and AAC under impact loading
................................................................................................................... 90
Figure 4-16 (a)-(c) : Flexural strength and initial stiffness of FRAC and AAC
specimens .................................................................................................. 91
Figure 4-17 (a)-(b) : Effect of drop heights on the absorbed energy and ratio of
absorbed energy to the input potential energy for AC specimens ............ 93

xiii
Page
Figure 4-18 : Potential energy of the drop compared to the energy absorbed /
toughness of AC ........................................................................................ 94
Figure 4-19 : Crack propagation of a representative FRAC-C specimen under a
drop height of 75 mm ................................................................................ 96
Figure 4-20 : Crack propagation of a representative AAC-C specimen under a
drop height of 75 mm ................................................................................ 97
Figure 5-1 : Macro-structure of sandwich panel ................................................. 103
Figure 5-2 : Fabrication process of sandwich composites .................................. 105
Figure 5-3 : Experimental setup of static flexural tests on sandwich panels ...... 107
Figure 5-4 : Experimental setup of impact tests on sandwich panels ................. 108
Figure 5-5 : Replicates of SWFRAC tested under static load; (a) Deflection
(LVDT) vs. Load Response; (b) Displacement (Actuator) vs. Load
Response ................................................................................................. 109
Figure 5-6 : Replicates of SWFRAC tested under impact loading; (a)Drop height
of 25 mm; (b) Drop height of 150 mm ................................................... 109
Figure 5-7 : Comparison between FRAC and SWFRAC under static loads ...... 110
Figure 5-8 : FRAC-A specimen under static flexural loading ............................ 111
Figure 5-9 : SWFRAC-A specimen under static flexural loading ...................... 111
Figure 5-10 : Effect of textile reinforcement on FRAC (blue) and AAC (red) .. 112
Figure 5-11 : Effect of textile reinforcement on flexural strength and stiffness
under (a) Drop height of 75 mm; (b) Drop height of 150 mm under impact

xiv
Page
loading..................................................................................................... 113
Figure 5-12 : SWFRAC (blue) versus SWAAC(red(; (a) Impact force versus
deflection; (b) Flexural Strength versus deflection ................................. 114
Figure 5-13 : Crack propagation of SWFRAC-A and SWAAC-A under different
heights of the impactor; (a) 25 mm; (b) 75 mm; (c) 150 mm ................. 114
Figure 5-14 : Effect of drop height of the impactor ............................................ 116
Figure 5-15 : Size effect on SWFRAC (blue) and SWAAC (red) beams ......... 117
Figure 5-16 : Effect of textile reinforcement on energy absorption ................... 118
Figure 5-17 : Crack propagation of SWFRAC beams under static load............. 119
Figure 5-18 : Typical Load-Deflection response of a SWFRAC-B beam under
impact load .............................................................................................. 121
Figure 5-19 : Typical Load-Deflection response of a SWAAC-B beam under
impact load .............................................................................................. 121

1
1. INTRODUCTION
One of the major challenges for the 21st century is to provide support for
civil infrastructure systems to sustain economic growth and continuous societal
developments. There is an urgent need to address to the concerns of global
warming, ever increasing resource cost, and efficient energy usage. Concept of
sustainability has gained immense importance over the years and is probably the
only way ahead. From a global perspective, amongst the several sections of this
society there is a staggering demand of building material sustaining the
exponential growth of infrastructure. Concrete being one of the most consumed
building materials; a lot of research is going on to increase durability, design light
weight structural members, and develop building systems with low cement and
utilize renewable energy resources. Lowering the cost of building materials is also
one of the key aspects of sustainable infrastructure especially in the developing
nations. This study is majorly based on evaluating the performance of fiber and
textile reinforcement in brittle cementitious matrices. Plain concrete has always
been known as a brittle material with weak tension capacities. Fabric based
cement composites aid in improving tensile strength and stiffness along with
introduction of ductility in the infrastructure systems. This type of fabric
reinforced concrete could be used in wide range of structural and non-structural
applications [1]. The main advantages of addition of fibers are to control crack
propagations and provide post-cracking strength and ductility [2]. However
considering this as a rather contemporary material, a lot of work is being done to
theoretically characterize the behavioral changes incorporated in concrete systems

2
due to fabric additions [3]. Guidelines for design methodologies are needed to be
incorporated in design and analysis of such exotic composite systems [1]. Another
approach of this study is to study how to modify the cementitious matrix itself
with cellular concrete system characterized by high fly ash substitution. Avoiding
usage of coarse aggregates is another way to address the issue of sustainability, by
making the structure light-weight. However with this sort of a material
constitution, the strength of the system gets compromised. Although with the
advantages of thermal efficiency, aerated (cellular) concrete could be used as a
viable, cost effective, green construction material. Again internal reinforcement
with fibers could be applied in order to improvise some of the structural
properties of aerated concrete. Addition of low volume fine polymeric
polypropylene fibers inside the aerated concrete matrix was studied in detail.
Another alternative is textile reinforced sandwich composite with aerate concrete
as the core material was investigated. This new-age sustainable cement-based
sandwich composite can be considered as a competent alternative to traditional
infrastructural material.
Figure 1-1 : Plan of this study
Fabric stress
SKIN
Enhanced Tension Capacity
Improved Toughness
Ductility
Cellular concrete
CORE
Lightweight
Energy Efficient
Cost Saving
Sandwich Composite
(SKIN + CORE) + =
3
This study has been summarized in Figure 1-1 and the objectives of the
individual chapters of this thesis have been briefly introduced in the subsequent
sections of this chapter.
1.1 Textile reinforced cementitious composites
With a significant degree of strength, ductility, and versatility, the field of
Strain Hardening Cement Composites (SHCC) has been led by novel cement
based materials such as Textile Reinforced Concrete (TRC) [4]. With as much as
one order of magnitude higher strength and two orders of magnitude higher
ductility than fiber reinforced concrete (FRC), TRC’s development has utilized
innovative textiles, cementitious matrices, and manufacturing processes. A variety
of individual fiber and textile systems such as alkali resistant glass (G) fibers,
polypropylene (P), aramid (A), and carbon (C) have been utilized [1][5][6].
Mechanical properties of the composites under uniaxial tensile, flexural, and shear
tests indicate superior performance such as tensile strength as high as 25 MPa,
and strain capacity of 1-8%. In order to fully utilize these materials, material
properties and design guidelines are needed to determine the size and dimensions,
and expected load carrying capacity of structural members constructed with them.
This chapter presents an approach applicable to the back calculation of material
properties and design of TRC materials.
1.2 Aging of glass-fiber reinforced cement composite
Glass fiber reinforced concrete is a cement based composite that is
generally used in the manufacturing of cladding panels and architectural accents.
High strength alkali resistant glass fiber (AR-Glass) is used in a spray up
4
production technique with a blended Portland cement with polymers added in for
curing aid. Short and chopped fibers bridge the micro cracks and by the process of
de-bonding and pullout serve to transfer the load across the crack faces. GFRC is
a high fiber content composite, typically it contains between 3% and 5% AR glass
fibers of the total composite weight. The high fiber loading makes GFRC
different from many other fiber-reinforced concrete materials which typically
have fiber dosages less than 1% by weight. GFRC has proved to be a very
durable building material for many products such as architectural panels of all
types, utility products, roofing products, portable buildings, artificial rockwork,
highway noise barriers, agricultural products, and many other products.
Long term properties of fiber reinforced composite exposed to humid
environments exhibit embitterment and loss of flexural strength over time [7, 8,
9]. The deterioration is primarily caused by the chemical and physical processes.
Glass fibers chemically degrade in the alkaline environment of hydrated cement
paste and with time lose some of their tensile strength. The physical cause of
strength reduction comes from the hydration products, especially calcium
hydroxide which fills spaces between the fiber filaments and reduces the
compliance of the fiber yarn. This causes stress concentration and excessive
bonding at the surface of fibers, changing fiber pullout mechanism to fiber
breakage under tension loading. The aging problem of glass fiber in alkaline
environment led to the development of several measures such as the invention of
alkali-resistant glass fibers, use of polymer emulsions in cement matrix, and
addition of pozzolanic materials to react with calcium hydroxide. In order to
5
evaluate the improvement of GFRC for various treatments, accelerated aging
procedures have been developed and the test results can be correlated with the
natural aging collected from the fields [10,11,12,13]. An analytical model has
been recently developed for predicting flexural behavior of fiber reinforced
concrete [14,15]. This approach has been extended to both strain softening and
strain hardening materials [16]. Therefore a rational modeling approach for
GFRC is possible. The main objective of this chapter is to develop a procedure for
using the aging flexural test data to predict the long term flexural and tensile
behavior of GFRC.
1.3 Flexural impact tests on aerated concrete
Structural elements may be exposed to severe impact loads characterized
by very high strain rates though for only a short duration. During the life span of
structural members such as wall panels, hydraulic structures, floor panels; impact
events due to hurricanes, wind and seismic loads, and ballistic projectile are
expected. During such events, large amount of energy is transmitted to the
structure in the form of dynamic loads. Certain impact events are characterized
by low impact velocity, but high projectile mass which may cause significant
damage. Structures generally respond through a variety of interactive mechanical
properties which include strength, absorbed energy, deformation capacity and
ductility. Cement-based materials generally exhibit low tensile strength and are
inherently brittle by nature. Exposure to impact loading can thus cause extensive
damage characterized by severe cracking, and ultimately complete failure. Fiber
reinforcement aids in improvement of ductility, tensile, impact and flexural
6
performance of concrete systems. This makes them ideal for use under blast,
impact, seismic and dynamic loads. However they have rate-dependent
mechanical properties such as Young’s modulus, ultimate strength, and fracture
toughness. Considering the unique characteristics of fiber-reinforced concrete
composites, the same finds its application as a tool to withstand high energy
explosives [1]. Impact properties were investigated under three point bending
conditions using an instrumented drop weight impact system. The instrumentation
includes a conventional strain gage based load cell to record the impact loading, a
linear variable differential transformer to measure mid-span deflection of the
specimen, and an accelerometer mounted on its tension zone to determine
acceleration of the specimen. Study was conducted based on the influence of
different drop heights of hammer (dropping mass), size of specimen, along with
effect of inherent material properties of aerated concrete. Specimens were tested
at initial heights of 25 mm, 75 mm, and 150 mm of the impactor. Time history of
the load, acceleration, deflection responses, absorbed energy of the specimen are
discussed in detail. Processing, analysis and interpretation of raw and filtered
experimental responses have been mentioned in subsequent sections.
7
2. CHARACTERIZATION OF FABRIC REINFORCED CEMENT-
BASED SKIN COMPOSITES
Textile reinforcement in concrete has been a topic of interest in several
research initiatives. Reinforcement in the form of yarns of textiles brings about
improved tensile strength, strain capacity and enhanced toughness [17]. In this
chapter, experimental flexural and tension tests conducted on mono-fibre type
textile reinforced concrete with carbon alkali resistant (AR) glass, aramid, and
polypropylene textile reinforced concrete have been discussed. Hybrid systems
with multi-layer fabrics help in adding up the benefits of individual yarns into a
unique superior composite material. Thus optimal performance of such
composites can be achieved by combining different fabrics in hybrid formation.
Proper characterization of such innovative materials can help us in controlling
desired material properties by orienting the fabric of varied stiffness and strengths
along specific directions of loading.
A parametric model [1] for simulation of tensile behaviour of reinforced
cement-based composites is used to correlate the tensile stress - strain constitutive
relation with flexural load carrying capacity of Textile Reinforced Concrete
(TRC) composites. Using a back-calculation approach, the results of tensile
experiments of composites are converted to a parametric model of a strain
hardening/softening material and closed form equations for representation of
flexural response of sections are obtained. Results are then implemented as
average moment-curvature relationship in the structural design and analysis of
beam specimens. This procedure can be used as a design methodology. The

8
correlation of material properties with simplified response of a series of TRC
composites with individual and hybrid textiles are shown.
2.1 Constitutive Law for Homogenized Fiber Reinforced Concrete
The behavior of TRC systems can be predicted with a tri-linear model
associated with a strain hardening tensile response. A general strain hardening
tensile model, and an elastic perfectly plastic compression model as derived by
Soranakom and Mobasher [18] and shown in Figure 2-1 is used to further
simplify the tension stiffening model. By normalizing all parameters with respect
to minimum number of variables, closed form derivations are obtained [19].
Tensile response is defined by tensile stiffness, E, first crack tensile strain cr,
cracking tensile strength, σcr, =Ecr, ultimate tensile capacity, tu, and post crack
modulus Ecr. The hardening/softening range is shown as a constant stress level
μEcr. The compression response is defined by the compressive strength σcy
defined as ωγEcr. Material parameters required for the simplified models are
summarized as follows. Parameters, α, μ, η, ω are defined respectively as
normalized tensile strain at peak strength, post-crack modulus, and compressive
yield strain:
trn
cr
, crE
E , cy cy
cr crE
Equation 2-1
Applied tensile and compressive strains at bottom and top fibers, β and λ are
defined as:
t
cr
,
c
cr
Equation 2-2
9
Both strains are linearly related through the normalized neutral axis parameter, k
by:
or 1
cr cr k
kd d kd k
Equation 2-3
In order to simplify material characteristics of strain-hardening FRC and
yet obtain closed-form design equations several assumptions are made. It has been
shown that the ratio of compressive and tensile modulus, parameter γ, has
negligible effect to the ultimate moment capacity [20]. Since in typical strain-
hardening FRC, the compressive strength is several times higher than the tensile
strength, the flexural capacity is mostly controlled by the weaker tension
component.
(a) (b)
Figure 2-1 : Full option material models for both strain-hardening and strain-
softening FRC: (a) compression model; and (b) tension model.
2.2 Closed Form Solutions for Moment-Curvature Relationship
Figure 2-2 shows three stages of stress strain diagrams (0 < < 1, 1 < <
and < < u) as a function of the normalized bottom tensile strain . These
diagrams were used in the derivation of closed form solution for moment
curvature diagram [14]. In the elastic stage 1, the stress diagram is unique as

10
shown in the Fig. 2(a) while stage 2 and 3 have two possible scenarios: the
compressive strain at the top fiber is either elastic (0< < ) or plastic ( < <
cu) and the derivations for these two stages were treated separately. The neutral
axis depth ratio k is found by solving equilibrium of forces. The moment capacity
is then calculated from internal forces and the neutral axis location; the
corresponding curvature is obtained by dividing the top compressive strain with
the neutral axis depth.
Figure 2-2 : Different stages of constitutive stress-strain diagram
Finally, the moment Mi and curvature i for each stage i are normalized
with their cracking moment Mcr and cracking curvature cr to obtain the
normalized moment Mi’ and curvature i’, respectively. Expressions for
calculating neutral axis depth ratio, moment and curvature are given in Table 2-1.
1
2.1
1
2.2
1
3.1
1
3.2
1

11
21
6i i cr cr crM M ' M ; M bd E Equation 2-4
2' ; cr
i i cr crd
Equation 2-5
As mentioned earlier, the compressive strain at the top fiber in stage 2 or
3 could be either in elastic or plastic range, depending on the applied tensile strain
and neutral axis parameter k. The range can be identified by assuming <
[Figure 2(b.1) or 2(c.1)] and using the expression k21 or k31 in Table 1 to
determine from Equation (5). If <
otherwise > and the expression k22 or k32 is used instead. Once, the neutral
axis parameter k and the applicable case are determined, the appropriate
expressions for moment and curvature in Table 1 and Equations (6) and (7) are
used.

12
Table 2-1 : Neutral axis depth ratio k, normalized moment and curvature for each
stage
Stage k Mi’ and i’
1
0<β<1 1
1 for =1
2
1 for <1 or >1
1
k
3 21 1 1
11
2 1 3 3 1'
1
k k kM
k
11
'2 1 k
2.1
1< β <α
0< <
2 2 4 221 21
2121
D Dk
D
221
2
2 1
2 1
D
3 221 21 21 21 21 21 21
2121
2 3 3'
1
C k C k C k CM
k
3 2 2
21 2
2 3 3 1C
2121
'2 1 k
2.2
1<<
cu
2222
22 2
Dk
D
222
2
2 1
2 1
D
222 22 22 22 22 22' 3 2M C k C k C
3 2 2 3
22 2
2 3 3 1C
2222
'2 1 k
3.1
tu
0
231 31
31 231
D Dk
D
231 2 1
2 2 1
D
3 231 31 31 31 31 31 31
3131
2 3 3'
1
C k C k C k CM
k
2 2 2 2 3
31 2
3 2 1C
3131
'2 1 k
3.2
tu
< c
u
3232
32 2
Dk
D
2 232
2 1
D
232 32 32 32 32 32' 3 2M C k C k C
2 2 2 2 3 3
32 2
3 2 1C
3232
'2 1 k

13
2.3 Crack Localization Rules and Load Deflection Prediction
Steps in calculation of load-deflection response from the moment-
curvature have been discussed in detail in recent publications dealing with strain
hardening [21] and softening type composites [22].Figure 2-3(a) shows a
schematic drawing of four point bending test with localization of smeared crack
that occurs in the mid-zone; while the zones outside the cracking region undergo
unloading during softening [23,24]. The length of the localized zone is defined as
“cS” representing product of a normalized parameter c and loading point spacing
S=L/3, where L is the clear span. For the simulations of GFRC in this chapter, it
was assumed that cracks were uniformly distributed throughout the mid zone and
a value of c=0.5 was used.
(a)
(b)
Figure 2-3 : (a) Four point bending test, (b): Moment curvature response and
crack localization rule
The curvature distribution in a beam specimen for a half-model according
to the internal moment is divided into several areas. The load–deflection response

14
of a beam can be obtained by using the moment–curvature as shown in Figure
2-4, and the moment-area method as follows:
Steps 1 - For a given cross section and material properties, the normalized
tensile strain at the bottom fiber β is incrementally imposed to generate the
moment–curvature response using the expressions given in table 1. For each value
of β in stage 2 and 3, the condition for compressive stress λ <ω or λ>ω is verified
in advance of moment–curvature calculation as shown in Figure 2-4.
Step 2 - The moment-curvature response determines the maximum load
allowed on a beam section, the discrete moment magnitudes are used to calculate
the applied load vector P = 2M/S. Where S is a spacing between the support and
loading point, S=L/2 for three point bending and S=L/3 for four point bending as
shown in Figure 2-4.
Step 3 - The beam is segmented into finite sections. For a given load step,
static equilibrium is used to calculate moment distribution along the beam and
moment–curvature relationship along with crack localization rules to identify the
curvature.
Step 4 - The deflection at mid-span is calculated by numerical moment-
area method of curvature distribution between the support and mid-span. This
procedure is applied at each load step to until a complete load deflection response
is obtained.
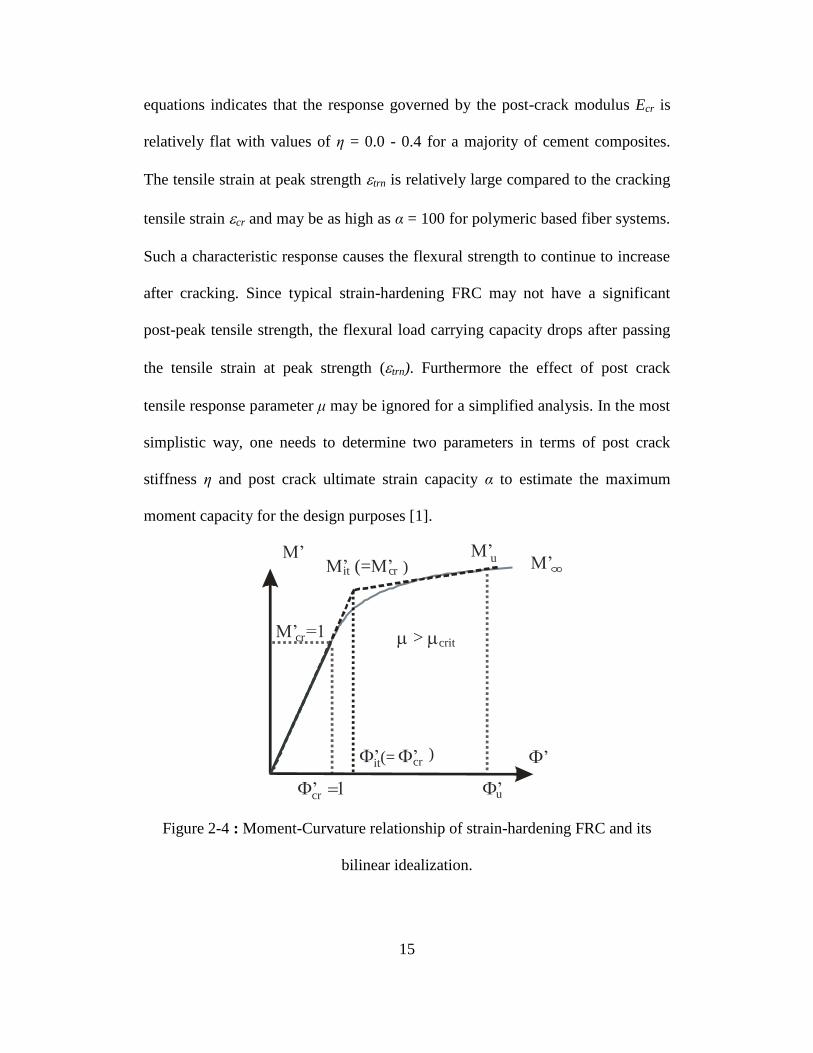
The general profile of moment curvature response as shown in Figure 2-4
assumes that the contribution of fibers is in the post cracking tensile region, where
the response continues to increase after cracking. Parametric Analysis of these
15
equations indicates that the response governed by the post-crack modulus Ecr is
relatively flat with values of η = 0.0 - 0.4 for a majority of cement composites.
The tensile strain at peak strength trn is relatively large compared to the cracking
tensile strain cr and may be as high as α = 100 for polymeric based fiber systems.
Such a characteristic response causes the flexural strength to continue to increase
after cracking. Since typical strain-hardening FRC may not have a significant
post-peak tensile strength, the flexural load carrying capacity drops after passing
the tensile strain at peak strength (trn). Furthermore the effect of post crack
tensile response parameter μ may be ignored for a simplified analysis. In the most
simplistic way, one needs to determine two parameters in terms of post crack
stiffness η and post crack ultimate strain capacity α to estimate the maximum
moment capacity for the design purposes [1].
M’M’it (=M’cr )
M’ =1cr
M’u M’
F’u
F’it (= F’cr)
F 1’cr
> crit
F’
Figure 2-4 : Moment-Curvature relationship of strain-hardening FRC and its
bilinear idealization.

16
The mid-span deflection is obtained directly using the double integration
of curvature distribution, or by closed form solution of bilinear moment curvature
response. A set of equations for calculating the mid-span deflection (δ) of the
three-point bending at the first cracking (δcr), at ultimate (δu) under the condition
of μ>μcrit are presented in .
Table 2-2.
Table 2-2 : Equations for calculating deflection at mid-span
Deflection Four-point bending Three-point bending
Elastic region 223
216cr crL
21
12cr crL
μ>μcrit
Deflection
hardening
2
1 2
2
1 2
216
,
23 4 4 , 4 4
u u cr
cr
u
La a
Mb
M
a b b a b
2
1 2
2
1 2
24
,
2 , 4
u u cr
cr
u
La a
Mb
M
a b b a b
μ<μcrit
Deflection
hardening/softening
2 25
72 27
u u cru
cr
L M L
M
2 2
8 12
u p u cru p p
cr
L M LL L L L
M
2.4 Experimental Plan
The mechanical performance of four different warp mono-fabric
knitted textiles was examined. Two types of composites were studied: (i) mono-
fabric high modulus fiber composites and (ii) hybrid composites as shown in
Table 2-3. Hybrid composites were made with a combination of different yarns of
low and high modulus within a single fabric. Aramid, carbon, and AR glass yarns
were used as the high strength/high stiffness systems and polypropylene yarns
were selected as low strength systems. The response of these composites was
17
evaluated individually. Attention was then focused on the effect of hybrid
composites. Here the aramid system was chosen and different levels of aramid
yarns were replaced with polypropylene yarns, providing a single multi-layered
fabric with combination of those two yarns. This was in order to evaluate if a
combination of low stiffness fibers in the presence of high stiffness fibers can
provide a level of reinforcement that is comparable to 100% systems, i.e., fabrics
with only one yarn type. The results of 100% systems. i.e., individual aramid,
carbon, glass, and polypropylene fabrics, and the aramid-polypropylene hybrid
system with the two yarns componation within a single fabric are discussed here.
Two sets of laminated cement boards were prepared: (i) single
(mono) fabric board made from 4 layers of the single yarn type; and (ii) hybrid
sandwich board using combination of aramid and polypropylene yarns. All the
fabric boards were made of four layers of fabric embedded in a cement paste with
water-cement ratio of 0.4. Pultrusion technique was used to manufature these
composites. Aramid and polypropylene yarns were combined in a single fabric,
located along the longitudinal direction of the fabric (warp direction). Different
hybrid combinations of the aramid-polypropylene hybrid yarns were investigated
with ratios of: 100:0, 75:25, 50:50, 25:75, 0:100 %, aramid (A) - polypropylene
(P) respectively, providing five different combinations of fabrics. The fabrics and
the related composites will be referred here as follows: 100A, 75A25P, 50A50P,
25A75P and 100P. In order to achieve such yarn ratios, four warp yarns were
alternated within the fabric, having the formation of: A-A-A-A, A-A-A-P, A-P-A-
P, A-P-P-P, P-P-P-P.
18
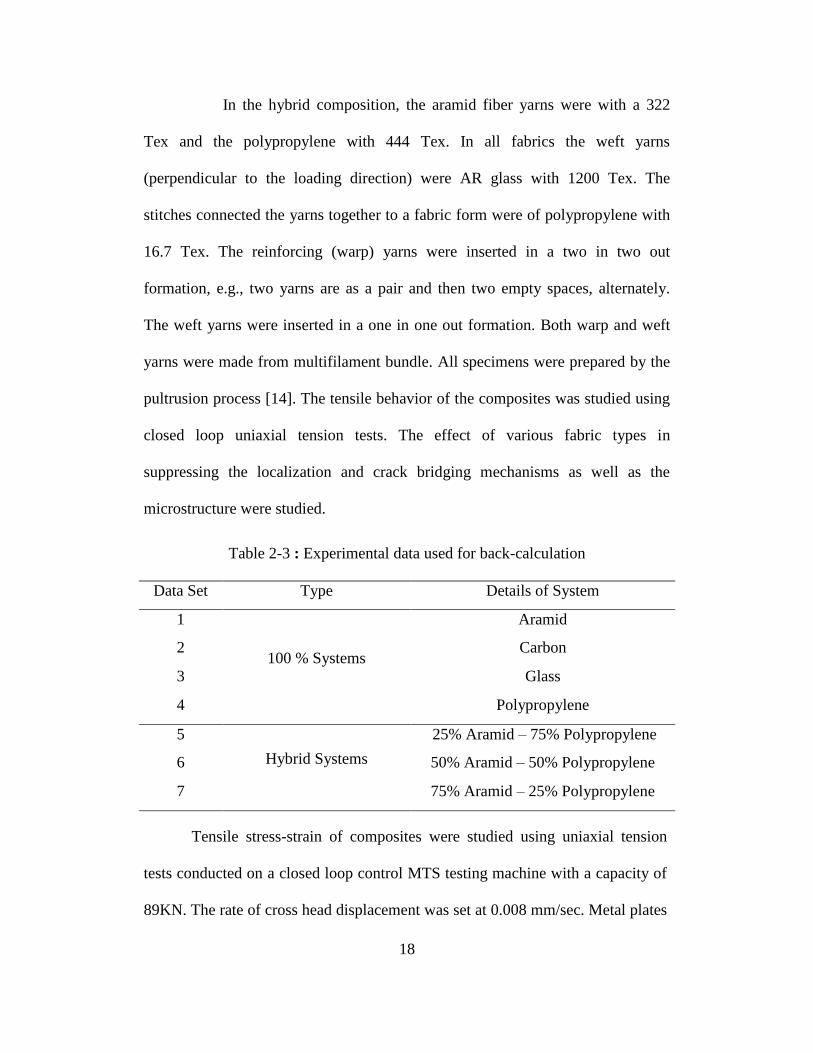
In the hybrid composition, the aramid fiber yarns were with a 322
Tex and the polypropylene with 444 Tex. In all fabrics the weft yarns
(perpendicular to the loading direction) were AR glass with 1200 Tex. The
stitches connected the yarns together to a fabric form were of polypropylene with
16.7 Tex. The reinforcing (warp) yarns were inserted in a two in two out
formation, e.g., two yarns are as a pair and then two empty spaces, alternately.
The weft yarns were inserted in a one in one out formation. Both warp and weft
yarns were made from multifilament bundle. All specimens were prepared by the
pultrusion process [14]. The tensile behavior of the composites was studied using
closed loop uniaxial tension tests. The effect of various fabric types in
suppressing the localization and crack bridging mechanisms as well as the
microstructure were studied.
Table 2-3 : Experimental data used for back-calculation
Data Set Type Details of System
1
100 % Systems
Aramid
2 Carbon
3 Glass
4 Polypropylene
5
Hybrid Systems
25% Aramid – 75% Polypropylene
6 50% Aramid – 50% Polypropylene
7 75% Aramid – 25% Polypropylene
Tensile stress-strain of composites were studied using uniaxial tension
tests conducted on a closed loop control MTS testing machine with a capacity of
89KN. The rate of cross head displacement was set at 0.008 mm/sec. Metal plates
19
with dimension of 25x50 mm and 1 mm thick were glued on the gripping edges
of the specimen to minimize localized damage and allow better load transfer from
the grips. Samples were held using hydraulic grips operated at low pressure to
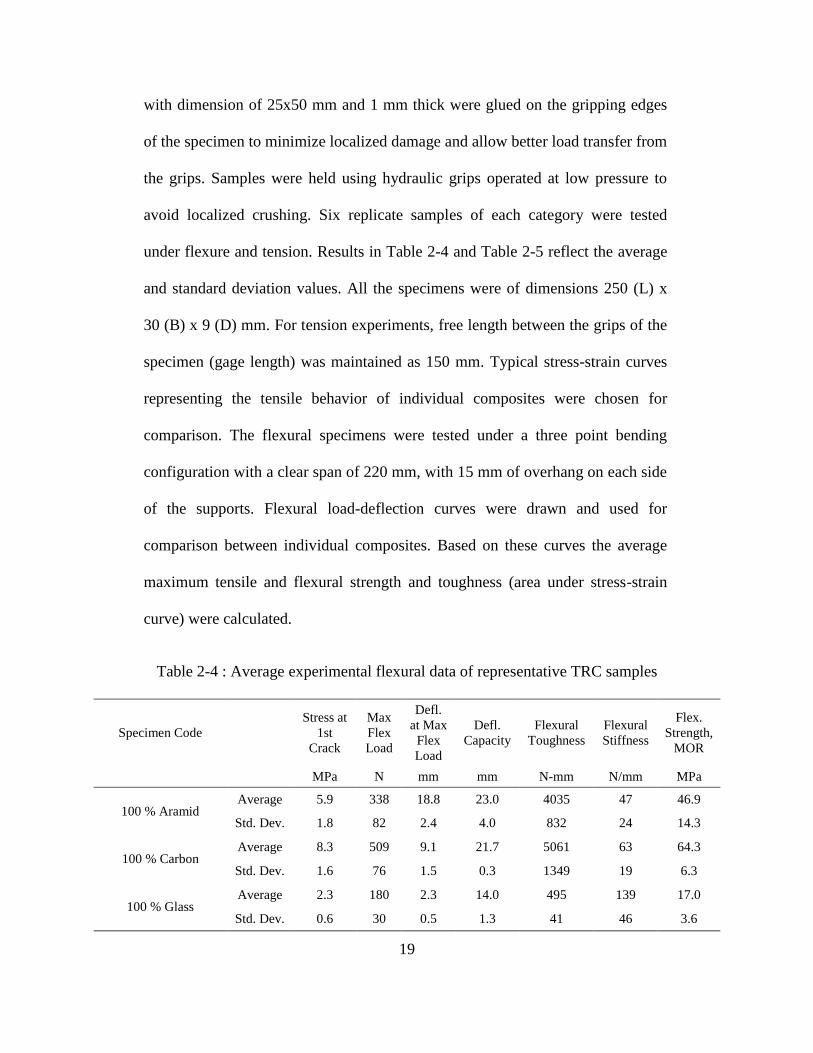
avoid localized crushing. Six replicate samples of each category were tested
under flexure and tension. Results in Table 2-4 and Table 2-5 reflect the average
and standard deviation values. All the specimens were of dimensions 250 (L) x
30 (B) x 9 (D) mm. For tension experiments, free length between the grips of the
specimen (gage length) was maintained as 150 mm. Typical stress-strain curves
representing the tensile behavior of individual composites were chosen for
comparison. The flexural specimens were tested under a three point bending
configuration with a clear span of 220 mm, with 15 mm of overhang on each side
of the supports. Flexural load-deflection curves were drawn and used for
comparison between individual composites. Based on these curves the average
maximum tensile and flexural strength and toughness (area under stress-strain
curve) were calculated.
Table 2-4 : Average experimental flexural data of representative TRC samples
Specimen Code
Stress at
1st
Crack
Max
Flex
Load
Defl.
at Max
Flex
Load
Defl.
Capacity
Flexural
Toughness
Flexural
Stiffness
Flex.
Strength,
MOR
MPa N mm mm N-mm N/mm MPa
100 % Aramid Average 5.9 338 18.8 23.0 4035 47 46.9
Std. Dev. 1.8 82 2.4 4.0 832 24 14.3
100 % Carbon Average 8.3 509 9.1 21.7 5061 63 64.3
Std. Dev. 1.6 76 1.5 0.3 1349 19 6.3
100 % Glass Average 2.3 180 2.3 14.0 495 139 17.0
Std. Dev. 0.6 30 0.5 1.3 41 46 3.6

20
Specimen Code
Stress at
1st
Crack
Max
Flex
Load
Defl.
at Max
Flex
Load
Defl.
Capacity
Flexural
Toughness
Flexural
Stiffness
Flex.
Strength,
MOR
MPa N mm mm N-mm N/mm MPa
100 % Polypropylene Average 3.0 89 32.7 32.9 2026 97 12.2
Std. Dev. 0.8 8 8.3 8.2 789 17 1.7
75 % Aramid + 25 %
Polypropylene
Average 9.1 405 21.5 29.4 5673 48 60.7
Std. Dev. 3.3 119 3.8 0.2 1593 18 20.4
50 % Aramid + 50 %
Polypropylene
Average 5.1 316 21.9 29.6 5495 88 44.3
Std. Dev. 1.3 60 2.9 0.0 1537 38 8.1
25 % Aramid + 75 %
Polypropylene
Average 4.5 214 22.9 29.6 3778 66 31.2
Std. Dev. 1.8 52 3.7 0.1 567 19 7.0
Table 2-5 : Average experimental tension data of representative TRC samples
Specimen code Cracking
Load
Stress at
1st Crack
Maximum
Load
Displacement at
Max Load Stiffness
Tensile
Strength
N MPa N mm N/mm MPa
100 % Aramid Average 286.2 1.0 7086 4.1 16642 25.9
Std. Dev. 89.9 0.5 589 0.4 7149 3.1
100 % Carbon Average 360.9 1.3 22207 2.9 35947 79.5
Std. Dev. 153.0 0.8 2097 0.4 16887 10.7
100 % Glass Average 398.7 1.3 2077 0.9 2521 6.6
Std. Dev. 161.2 0.5 362 0.2 466 1.1
100 %
Polypropylene
Average 404.8 1.5 3047 18.3 8340 11.7
Std. Dev. 213.1 0.8 834 4.1 2712 3.1
75%Aramid+25
% Polypropylene
Average 175.9 0.6 5595 3.9 15900 20.5
Std. Dev. 95.5 0.4 1460 0.5 10909 6.5
50%Aramid+50
% Polypropylene
Average 200.3 0.7 3986 3.9 23171 14.8
Std. Dev. 68.4 0.2 813 0.3 5691 2.8
25%Aramid+75
% Polypropylene
Average 303.8 1.2 2883 8.3 10231 11.0
Std. Dev. 96.7 0.3 507 10.1 6682 1.7

21
2.5 Analysis - Prediction of Load Deflection Response of Fabric Cement
Composites
Upper and lower bound mechanical properties of different TRC
composites were documented [1]. In order to correlate the responses,
experimental data from a set of specimens under uniaxial tension and three point
bending tests were used. No attempt was made to obtain a best fit curve to the
flexural or tensile response. The material parameters for the tension model were
determined by fitting the hardening model to both the uniaxial tension test and
flexural test. The result is shown by the simulated upper and lower bounds
encompassing all the selected composites. Figure 7a shows the predicted flexural
load deflection response of cement composites and Figure 7b shows the tensile
stress-strain responses used in the simulation compared with experimentally
obtained results. These key parameters α, η, and μ are changed to fit the
experimental load-deflection and obtain the predicted tensile stress strain curves.
There are two ways to accomplish the curve fitting, forward calculation using
tension data and back-calculation using the flexural data. In the present approach
only the back-calculation approach is used, however since independent tension
data are also available, this enables an independent verification of the back
calculation models. Simulations that use direct tension data to calculate the
flexural response tend to underestimate the equivalent flexural stress. This is due
to several factors including the size effect, uniformity in tension loading vs. the
linear strain distribution in flexure, and variation in lamina orientation which may
lead to a wider range of variation among the flexural samples. In addition
22
phenomenological effects such as fiber matrix de-bonding which leads to
inefficient fiber performance can also lead significantly to the differences between
the tensile and flexural response. In a tension test, the textile phase is held, often
quite tightly in the grips, whereas in a flexural test, due to the high transverse
shear loads, the end of the sample may easily de-bond, thus resulting in inefficient
load transfer and thus low flexural values. These issues contribute to the
performance characterization of these systems since a majority of the loading is
primarily through the flexural loading mode. On the other hand flexural tests may
overestimate the tensile results primarily due to the size effect. The
underestimation of the flexural capacity can be addressed by increasing the
apparent tensile capacity using scalar scaling parameters as discussed earlier [21].
These topics are not beyond the scope of present work, however, proper
characterization of the observed differences between test methods points out the
differences that are not captured using data reduction techniques. The procedure
for the use of the flexural response to develop a moment-curvature response based
on back-calculation however provides a potential way where the flexural results
can be applied to the design of flexural load cases.
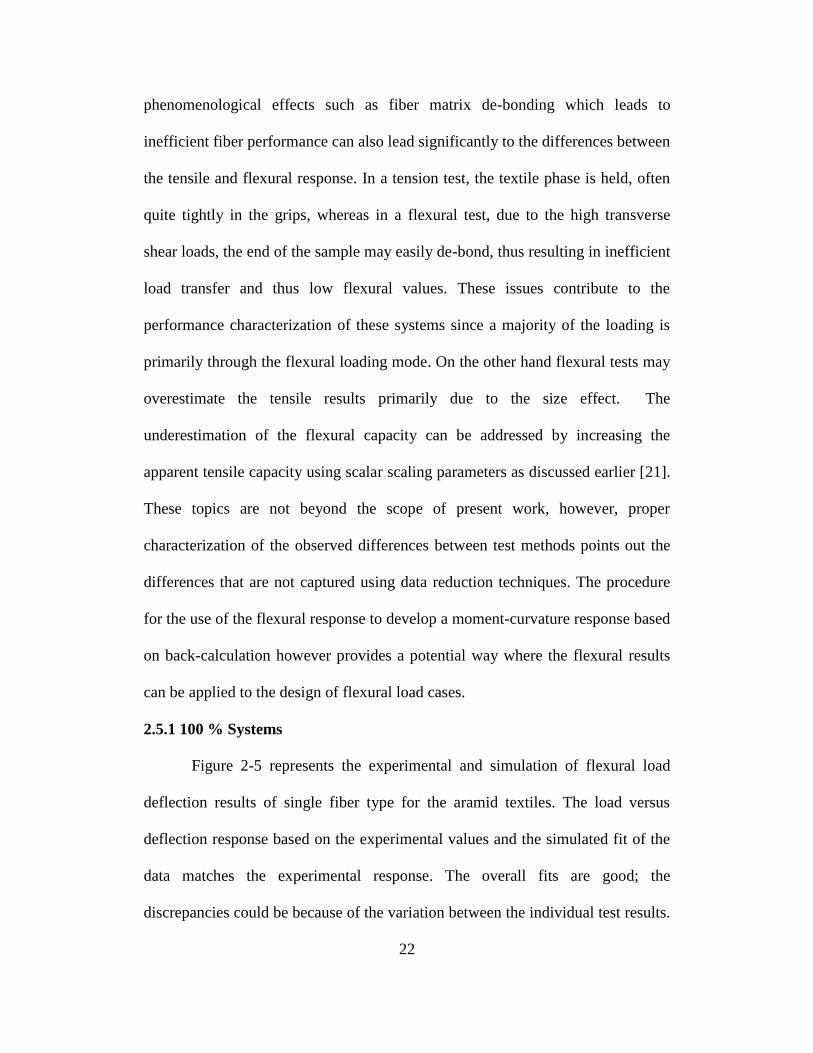
2.5.1 100 % Systems
Figure 2-5 represents the experimental and simulation of flexural load
deflection results of single fiber type for the aramid textiles. The load versus
deflection response based on the experimental values and the simulated fit of the
data matches the experimental response. The overall fits are good; the
discrepancies could be because of the variation between the individual test results.

23
Representative properties for the simulation of upper and lower bound values
obtained from the 100 % Aramid specimens were: E = 2900 – 5900 MPa, α = 18
– 90, μ = 7 – 14, η = 0.07 – 0.76, εcr = 400 – 970 μstr. The constants were γ = 1,
and ω = 11. The limits of the modeling were βtu = 23 – 105 and λcu = 71. As
clearly evident, there is a direct correlation between samples that show a low
flexural response and their associated lower than normal constitutive models.
Tensile stress-strain responses are shown in Figure 7b which exhibits the
back calculated tension response from the flexural data and compares them with
the experimentally obtained tension response. Note that the initial linear portion
of the curve is not well captured since the experimental data were not collected
using strain gages to record the first crack strain accurately. The model however is
quite accurate in predicting the overall post crack stiffness, stress capacity, strain
capacity, and ductility response of the tensile samples.
(a) (b)
Figure 2-5 : 100 % Aramid; (a) Flexural, (b) Tension responses
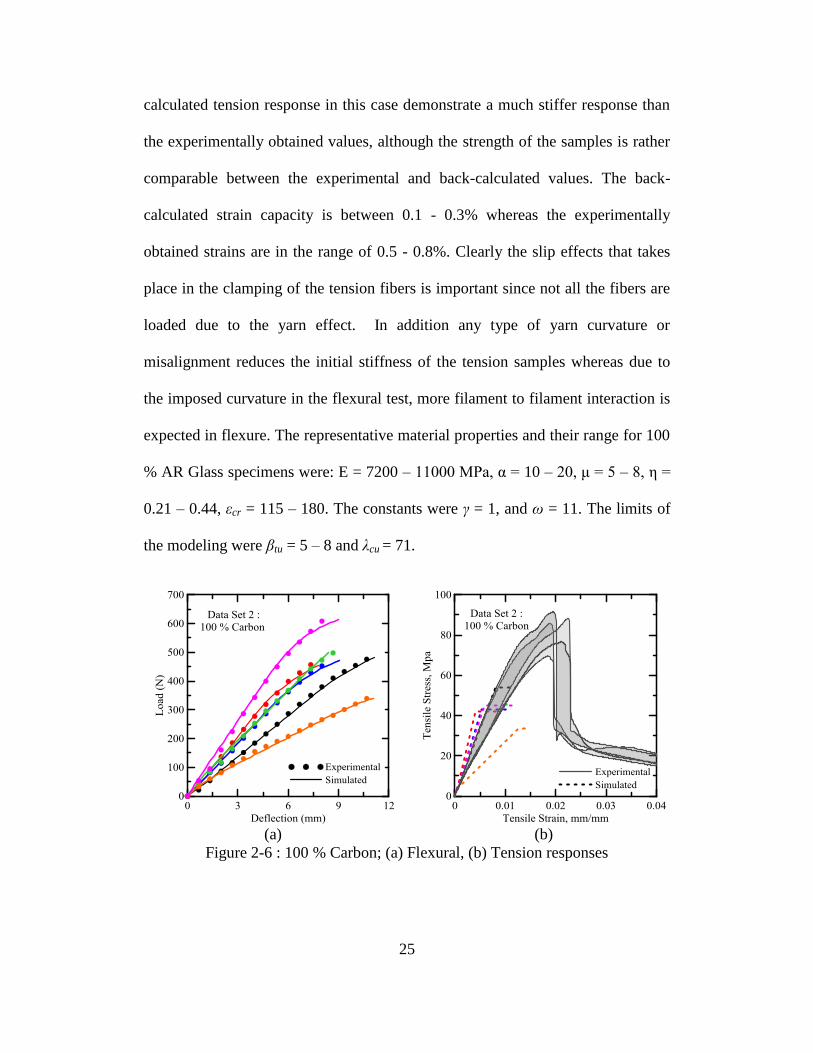
The results of carbon fibers are shown in Figure 2-6(a) which shows the
flexural load vs. deflection for both experimental and simulated responses. Figure

24
2-6(b) shows the back-calculated tension results compared with the
experimentally obtained data. While it is clearly possible to fit the experimentally
flexural tests, the resulting back-calculated tension response significantly
underestimates the experimental response. This may be attributed to the
differences in the actual bond mechanisms that are operative in the two tests. In
the flexural tests, the load transfers to the carbon yarns through the interfacial
zones in order to carry the load. Due to the weak bond properties of carbon
systems, the capacity is rather low. In the tension test the carbon fibers are
effectively clamped, therefore the load carries into the fibers quite efficiently.
This explains why the tension results of carbon composites are superior to the
other textile systems. The experimental tensile stress is about 40 MPa whereas the
simulated tensile strengths are as high as 90 MPa. These responses are however
characteristic of the carbon yarn response and though not the response of the
overall composite, a loading condition that is not attainable in a flexural test. The
lower and upper bound values of the representative material properties for the 100
% Carbon specimens were: E = 6000 – 8500 MPa, α = 5 – 18, μ = 7 – 9, η = 0.41
– 1.50, εcr = 660 – 1000. The constants were γ = 1, and ω = 11. The limits of the
modeling were βtu = 11 – 21 and λcu = 71. Values shown are for a preliminary set
of data and proper model optimization with upper and lower bound values for
each variable are required. The results of AR-glass fibers are shown in Figure 2-7
which shows the flexural load vs. deflection for both experimental and simulated
response. In this case the results of the tension back-calculated response and
experimentally obtained tension responses are shown in Figure 9b. The back
25
calculated tension response in this case demonstrate a much stiffer response than
the experimentally obtained values, although the strength of the samples is rather
comparable between the experimental and back-calculated values. The back-
calculated strain capacity is between 0.1 - 0.3% whereas the experimentally
obtained strains are in the range of 0.5 - 0.8%. Clearly the slip effects that takes
place in the clamping of the tension fibers is important since not all the fibers are
loaded due to the yarn effect. In addition any type of yarn curvature or
misalignment reduces the initial stiffness of the tension samples whereas due to
the imposed curvature in the flexural test, more filament to filament interaction is
expected in flexure. The representative material properties and their range for 100
% AR Glass specimens were: E = 7200 – 11000 MPa, α = 10 – 20, μ = 5 – 8, η =
0.21 – 0.44, εcr = 115 – 180. The constants were γ = 1, and ω = 11. The limits of
the modeling were βtu = 5 – 8 and λcu = 71.
(a) (b)
Figure 2-6 : 100 % Carbon; (a) Flexural, (b) Tension responses

26
(a) (b)
Figure 2-7 : 100 % Glass; (a) Flexural, (b) Tension responses
Results of polypropylene fabrics are shown in Figure 2-8. As evident, the
model underpredicts the tension response for these fabrics. The simulated tensile
strength is within 4 – 6 MPa, whereas the experimental tensile response is in the
range of 10 – 15 MPa. The range of material properties for 100 % AR Glass
specimens obtained from the simulations were: E = 5800 – 8200 MPa, α = 165 –
275, μ = 8 – 9, η = 0.007 – 0.012, εcr = 190 – 335. The constants were again γ = 1,
and ω = 11. The limits of the modeling were βtu = 200 – 400 and λcu = 71.

27
(a) (b)
Figure 2-8 : 100 % Polypropylene; (a) Flexural, (b) Tension responses
A comparison of the response of the 100% systems is shown in Figure 2-9.
Note that the carbon fiber system shows an exceedingly high tensile response
however the flexural capacity is only shown by the high stiffness as compared to
the glass, aramid and polypropylene. The polypropylene system shows the lowest
flexural stiffness, largest deflection among the systems studied. The comparison
of the tension simulated and experimental tensile responses indicate that the
largest discrepancy can observed in the results obtained for the carbon fibers
followed by the aramid, glass and polypropylene respectively. The back-
calculated values for the aramid and glass are both in the same response range;
however both methods overestimate the post cracking stiffness in these systems
with an average tensile strength of 30 and 10 MPa respectively.

28
(a) (b)
Figure 2-9 : Comparison between 100 % systems; ; (a) Flexural, (b) Tension
responses
2.5.2 Polypropylene – Aramid Hybrid Systems
Results of hybridization are shown in Figure 2-10 - Figure 2-12. Figure
2-10(a) shows the flexural load vs. deflection for both experimental and simulated
response of 75A25P samples. Comparison of the back-calculated tension and
experimentally obtained tension responses are shown in Figure 2-10(b). The back
calculated tension response in this case demonstrates a stiffer response than the
experimentally obtained values, with a slightly higher strength of the samples.
There is however a good correlation between the experimental and back-
calculated values. The back-calculated strain capacity is about 0.2-0.3% whereas
the experimentally obtained strains are in the range of 0.2-0.4%.
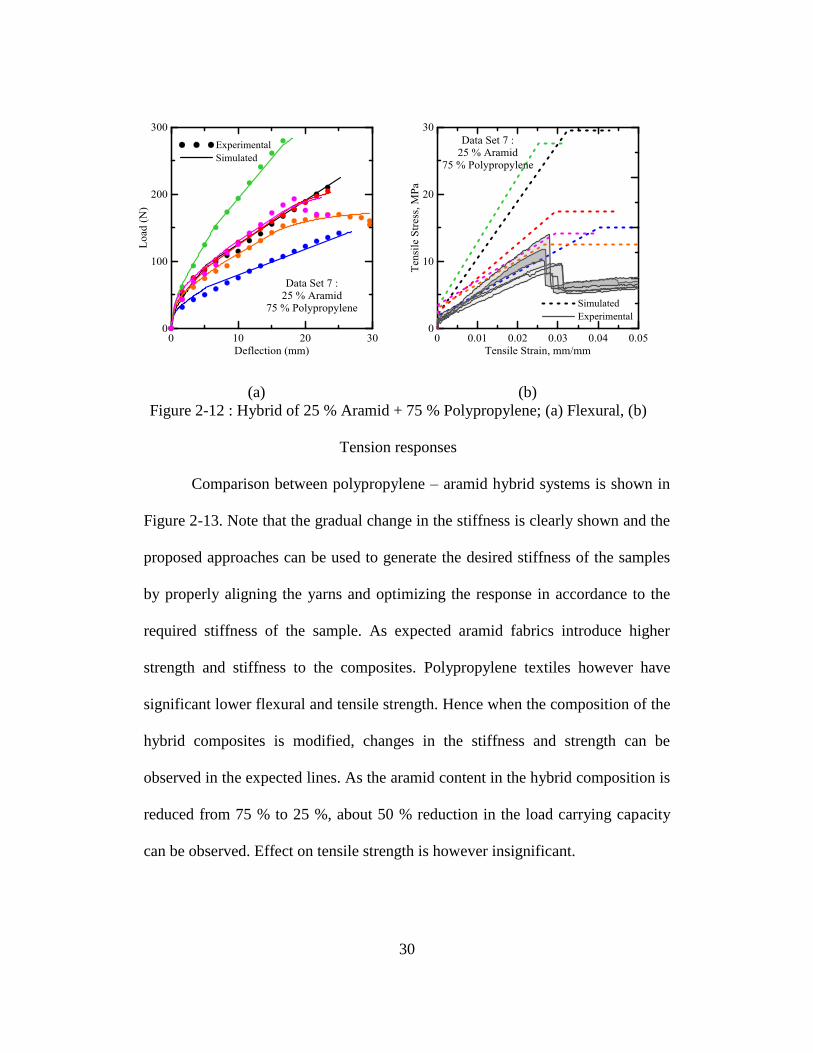
Results of 50A50P and 25A75P are shown in Figure 2-11 and Figure 2-12.
In both these systems it is shown that the combination of the two yarns helps with
the general behavior of the composite and there is a change in the response based
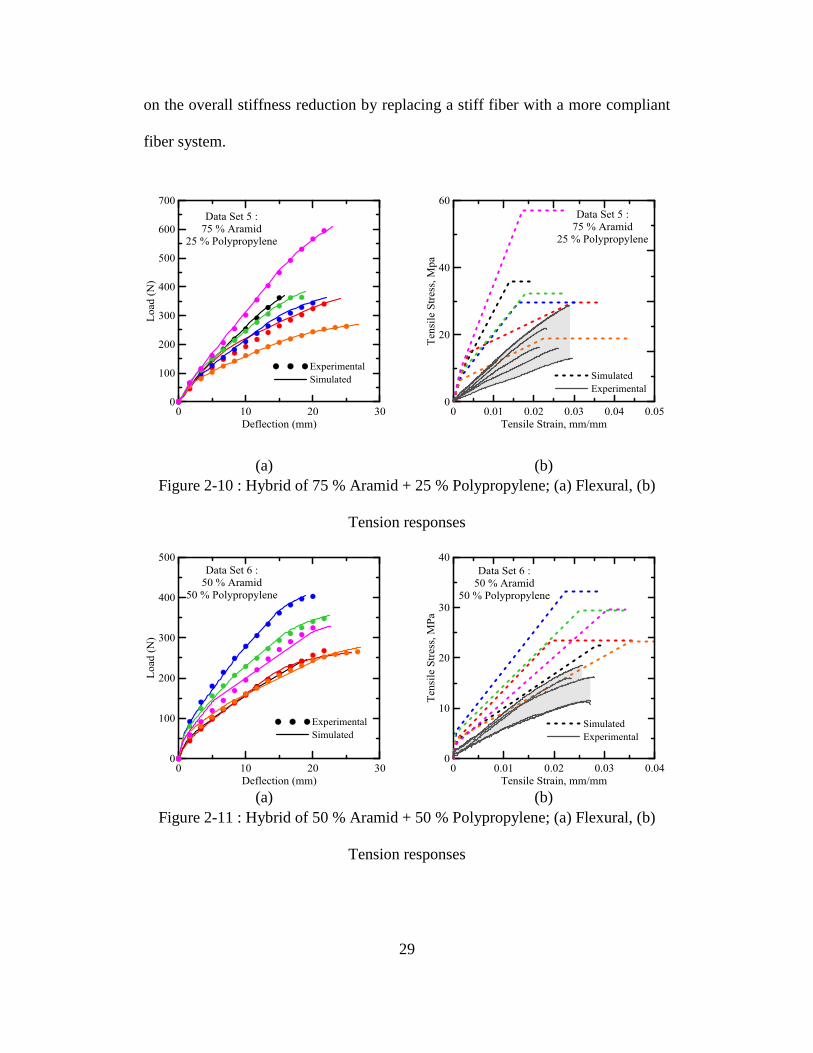
29
on the overall stiffness reduction by replacing a stiff fiber with a more compliant
fiber system.
(a) (b)
Figure 2-10 : Hybrid of 75 % Aramid + 25 % Polypropylene; (a) Flexural, (b)
Tension responses
(a) (b)
Figure 2-11 : Hybrid of 50 % Aramid + 50 % Polypropylene; (a) Flexural, (b)
Tension responses
30
(a) (b)
Figure 2-12 : Hybrid of 25 % Aramid + 75 % Polypropylene; (a) Flexural, (b)
Tension responses
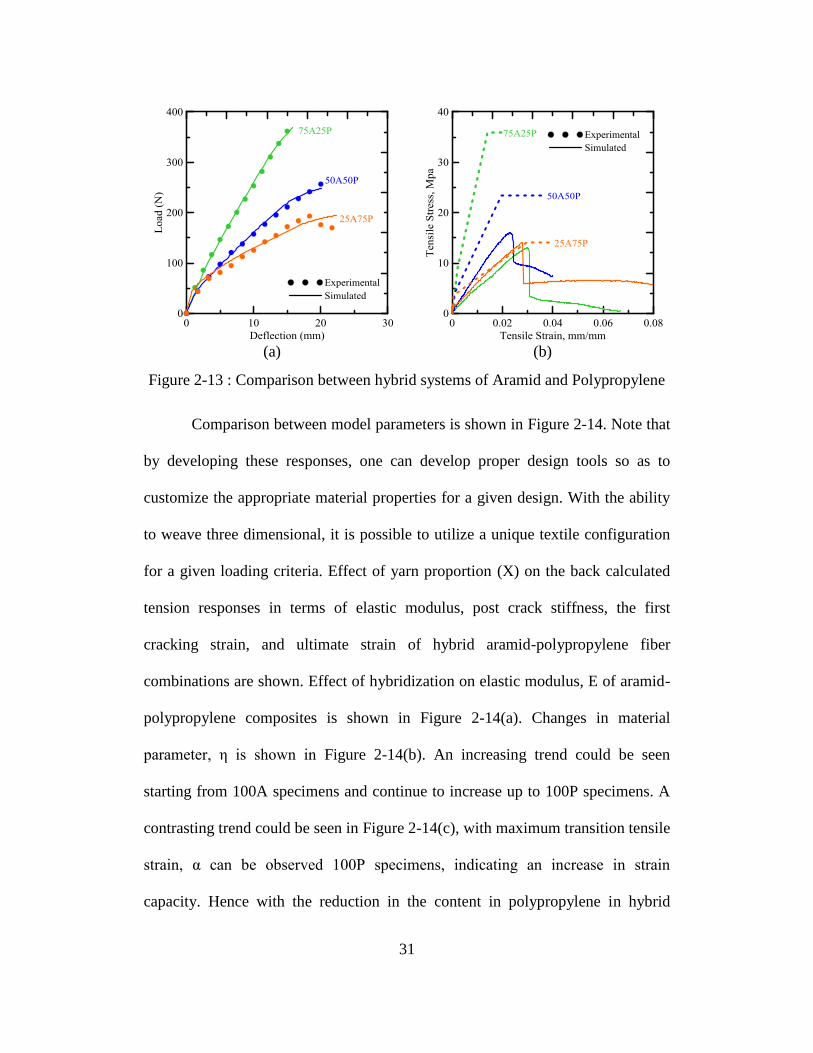
Comparison between polypropylene – aramid hybrid systems is shown in
Figure 2-13. Note that the gradual change in the stiffness is clearly shown and the
proposed approaches can be used to generate the desired stiffness of the samples
by properly aligning the yarns and optimizing the response in accordance to the
required stiffness of the sample. As expected aramid fabrics introduce higher
strength and stiffness to the composites. Polypropylene textiles however have
significant lower flexural and tensile strength. Hence when the composition of the
hybrid composites is modified, changes in the stiffness and strength can be
observed in the expected lines. As the aramid content in the hybrid composition is
reduced from 75 % to 25 %, about 50 % reduction in the load carrying capacity
can be observed. Effect on tensile strength is however insignificant.
31
Comparison between model parameters is shown in Figure 2-14. Note that
by developing these responses, one can develop proper design tools so as to
customize the appropriate material properties for a given design. With the ability
to weave three dimensional, it is possible to utilize a unique textile configuration
for a given loading criteria. Effect of yarn proportion (X) on the back calculated
tension responses in terms of elastic modulus, post crack stiffness, the first
cracking strain, and ultimate strain of hybrid aramid-polypropylene fiber
combinations are shown. Effect of hybridization on elastic modulus, E of aramid-
polypropylene composites is shown in Figure 2-14(a). Changes in material
parameter, η is shown in Figure 2-14(b). An increasing trend could be seen
starting from 100A specimens and continue to increase up to 100P specimens. A
contrasting trend could be seen in Figure 2-14(c), with maximum transition tensile
strain, α can be observed 100P specimens, indicating an increase in strain
capacity. Hence with the reduction in the content in polypropylene in hybrid
(a) (b)
Figure 2-13 : Comparison between hybrid systems of Aramid and Polypropylene

32
composition, transition tensile strain, α continues to decrease. First cracking
tensile strain values of these fabric combinations are shown in Figure 2-14(d).
(a) (b)
(c) (d)
Parameter Polynomial Fit Equation R2 value
E E = 7000 – 5556 * X + 69556 *X2 - 155644 * X
3+ 89244 * X
4 0.6
η η = 0.0097 + 0.99 * X - 5.16 * X2 + 10.04 * X
3- 5.51 * X
4 0.6
εcr εcr = 262.5 + 6988* X – 47328 * X2 + 97338 * X
3- 5650 7 * X
4 1
α α = 195.83 - 779.69 * X + 2137 * X2- 3064* X
3+ 1546 * X
4 1
Figure 2-14 : Comparison between Model parameters

33
Table 2-6 : Input parameters used for the inverse analysis of different TRC
systems
Sample ID
Model Input
Material Parameters Tension Model Parameters
E (MPa) εcr
(μstr) α γ η μ βtu
100A Avg. 4600 753 36 1 0.37 10 44
SD 1226 201 27 0 0.23 3 31
100C Avg. 7050 785 10 1 0.96 8 15
SD 952 119 5 0 0.39 1 4
100G Avg. 9417 152 16 1 0.36 6 27
SD 1849 32 5 0 0.08 2 8
100P Avg. 7000 263 196 1 0.01 3 268
SD 759 50 41 0 0.002 0 74
75A25P Avg. 4533 2067 10 1 0.34 4 17
SD 557 826 3 0 0.20 1 7
50A50P Avg. 7733 560 54 1 0.13 7 69
SD 2202 169 26 0 0.05 2 28
25A75P Avg. 7875 352 93 1 0.07 7 130
SD 360 73 37 0 0.04 3 44

34
Table 2-7 : Average values of the results from the inverse analysis of different TRC systems
Sample
ID
Model Output
Back calculated Flexural properties Back calculated Tensile properties
Stiff-
ness
Defl.
at 1st
Crack
Strength
at 1st
Crack
Max
Load
Defl.
at Max
Load
MOR Tough
-ness
Strengt
h at 1st
Crack,
σcr
Transit
-ion
Strain,
εtrn
Ulti-
mate
Strain,
εtu
Residual
Strength
Paramete
r, μσcr
Tough
-ness
N/mm mm MPa N mm MPa N-mm MPa μstr μstr MPa MPa
100A Avg. 39 0.68 3.32 327 21.01 45 5005 3.32 22793 28717 33.0 0.58
SD 12 0.19 0.83 73 3.54 12 1725 0.83 7380 7913 10.0 0.20
100C Avg. 63 0.70 5.49 476 7.10 61 2609 5.48 7565 11513 43.9 0.34
SD 17 0.13 0.67 87 2.53 9 501 0.67 3175 1950 6.6 0.06
100G Avg. 161 0.11 1.41 174 2.27 14 253 1.41 2470 4043 8.7 0.03
SD 30 0.02 0.32 27 0.64 2 87 0.32 940 1176 1.8 0.01
100P Avg. 57 0.24 1.83 83 33.27 11 2629 1.83 50583 68863 5.4 0.28
SD 7 0.05 0.37 11 8.11 2 941 0.37 9799 17754 0.9 0.09
75A25P Avg. 33 1.93 9.18 393 21.79 58 17854 9.18 19567 31100 33.9 0.74
SD 4 0.77 2.98 114 3.89 17 32086 2.98 5659 8193 12.7 0.23
50A50P Avg. 61 0.52 4.04 312 22.65 44 5485 4.11 26833 34767 26.9 0.62
SD 20 0.17 0.87 61 3.36 8 1390 0.98 5755 5266 4.4 0.11
25A75P Avg. 58 0.33 2.79 208 25.76 30 4742 2.79 30558 43318 19.3 0.56
SD 6 0.06 0.67 54 3.46 7 1029 0.67 5378 7244 7.3 0.14
35
Table 2-6 and Table 2-7 summarize the input parameters used and the
results obtained from the inverse analysis for 100 % systems and hybrid systems
investigated in this chapter, respectively. Only average and standard deviation
values of each of the parameters are reported. α and βtu are unit less scalars that
apply to the first crack strain, εcr. Parameters γ and η are unit less scalars that
apply to the stiffness E. Parameter, μ is a unit less scalar that applies to the first
crack tensile strength, σcr. The key back-calculated flexural and tension
parameters (only average and standard deviation values) obtained from the
inverse analysis are also mentioned.
2.6 Conclusions
The material model based on a constitutive stress-strain relationship of fiber
reinforced concrete developed earlier here in Arizona State University was used
to study experimental response of various TRC composites. Various alternatives
of fabric material (aramid, carbon, glass, and polypropylene) were individually
evaluated in terms of their flexural and tensile characteristics. An innovative idea
of using hybrid type fabric combination was also investigated. Idea behind
hybridization of multiple fabric layers was to obtain optimal performance of
individual fabrics by combine them into a single TRC board. Prospect of using a
hybrid combination of aramid (high strength) and polypropylene (cheap, low
strength) was thoroughly investigated by using different proportions of these
fabrics inside one composite board. Hybrid fabrics made out of aramid and
polypropylene was found to significant enhance the flexural and tensile strength
under static conditions when compared to mono layer polypropylene textiles.

36
With such an idea, different hybrid fabrics with varied ratios of constituent
textiles can be manufactured to model a wide range of TRC composites
constituted by brittle response to highly ductile composite with very high strain
capacity. This could cater to different design requirements of structural systems.

37
3. MODELING OF DURABILITY OF TEXTILE AND GLASS FIBER
REINFORCED CEMENT COMPOSITES
One of the key parameters in assessing the performance of cement based
composites is their ability to withstand the environmental conditions imposed
during service life. It is imperative that any new system developed will have
sufficient long term performance that can ensure proper and sustainable life cycle.
It is therefore important to use the same methodology that is used for the design
of cement composites and extend the procedures developed in order to simulate
both the early strength and also long term performance of the proposed systems.
In this chapter the methodologies developed for back calculation of material
properties are extended to develop a model for aging and durability for the
response of general cement based composite systems. These models can be used
in order to simulate the textile reinforced concrete as well as any other type of
system that can be exposed to simulated aging conditions. While there are a
significant number of experimental durability studies are available, very little
analytical tools are available to simulate the durability mechanics, and develop a
comparative basis for evaluation of different systems.
This chapter develops procedures for modeling the aging of cement
composites for long term performance based on back calculated properties
measured. The aging parameters and functions are calculated by means of model
calibration using existing long term durability data that are available for GFRC.
The same constitutive law for fiber reinforced concrete described in the previous
chapter was used for characterization and prediction of long term flexural

38
behavior of GFRC materials using existing and historical data. Experimental
flexural test data was back-calculated to obtain material parameters and establish
their relationships with aging. The material behavior as described before is
controlled mainly by three parameters: Young’s modulus, first cracking strain and
a normalized transitional tensile strain parameter. Once the relationships between
the parameters and age were established, the time dependent flexural performance
of the mixes was simulated. Test results reported by Marikunte et. al. [25] which
addressed mixtures containing metakaolin, silica fume without polymers and
silica fume with polymers were subjected to hot water accelerated aging at three
levels (un-aged, 28, and 84 days of aging). Results reveal that addition of
metakaolin and silica fume enhances the flexural strength and also reduces the
deterioration of moment and ductility as material ages with time. GFRC
composite containing metakaolin shows improved strength retention and
durability in the long term when compared to silica fume. A similar approach was
used to study the classical ageing response of GFRC composites as published by
Litherland et. al. [26]. In this study the effect of accelerated ageing of GFRC in
hot water at different temperatures and various durations of time was investigated.
Development of GFRC was possible with the design of a sodium-
zirconium-silicate alkali-resistant (AR) glass by the Building Research
Establishment (BRE) and Pilkington Brothers Ltd. in 1971. GFRC shows a
reduction in strength, ductility, toughness, and impact resistance over time [27]
and assuming that fiber corrosion was the main degradation mechanism,
accelerated aging procedures such as the “strand in cement” (SIC) test were

39
developed to predict long term strength of the composite [10]. The accelerated
aging tests were then compared with weathering data to obtain empirical
relationships for weathering acceleration factors for a range of climatic
temperatures between 5 and 80°C and [28, 29 and 30]. The relationship between
time in accelerated aging (different temperatures) and exposure to weathering was
proposed as a basis for testing GFRC products [30]. Further investigations
established that material properties are influenced by more complex mechanisms
than glass fiber corrosion, and other aging mechanisms including densification of
the fiber-cement interface with time, and calcium hydroxide filling of the space
between the filaments in a strand, reducing its flexibility were identified [31, 32].
In addition to strength loss, reduction in strain capacity and total ductility of
GFRC composites was also noted [33,34]. Based on the identification of
degradation mechanisms, development of improved long term durability of GFRC
addressed modified matrices such as ground granulated blast furnace slag, silica
fume [35], fly ash [36], and/or calcium aluminate or sulpho-aluminate based
cements [37].
It has been observed that far fewer Ca(OH)2 crystals precipitate in fiber
bundles in non-OPC GFRC [27]. Sulpho-aluminate modified cements produce
little, if any Ca(OH)2 and in metakaolin-type matrices Ca(OH)2 content is
decreased [38] or precipitate away from the fibers. Fiber push out tests and
microstructural studies have shown that densification within the fiber bundle does
not occur with aging in GFRC metakaolin modified GFRC [39]. Both these
composites have improved durability compared to traditional OPC GFRC

40
according to accelerated aging tests, however strength loss still occurs, to less
extent though [41,39].
Glass is chemically attacked by hydration products (hydroxyl ions), leading to
a break-up of the Si-O-Si glass network, which leads to a weak glass surface.
Orlowsky [40] proposed a model based on physico-chemical degradation. Initial
corrosion rate is linear with time, but the process slows down with increasing
zirconium concentration in the deeper layer and becomes diffusion controlled.
Formation of hydration products in the interface zone of a glass fiber-concrete
may increase transversal shearing on the filament and lead to embrittlement (loss
of ductility) and is considered as mechanical attack. It is believed [31, 32, and 27]
that embrittlement due to the growth of hydration products around glass filaments,
particularly Ca(OH)2 crystals, occurs at an early stage of curing of the composite,
which leads to loss of filament strength before the chemical attack. Delayed
fracture may also occur under static load due to the introduction of small defects
in the production process [43].
Variations in matrix ingredients include use of metakaolin [41,42,43]
acrylic polymer [44, 45, 46], and cement types, such as sulpho-aluminate cement
(SAC) [47,48,49, and[50], inorganic phosphate cement (IPC) [51,52,53, 54] and
calcium aluminate cement (CAC) [55,56]. Marikunte et al. [41] studied the hot-
water durability of AR-glass fiber reinforced composites in blended cement
matrix and were rated for their flexural and tensile performance. Different
matrices selected were (a) cement; (b) cement + 25% metakaolin; and (c) cement
+ 25% silica fume. Specimens after normal curing of 28 days were immersed in a

41
hot water bath at 50 degrees C for up to 84 days and then tested under flexural
and tensile stresses. The results indicate that the blended cement consisting of
metakaolin significantly improves the durability of GFRC composite. Flexural
stress and strain at failure (MOR) are considered as a measure to assess durability
[41].
Beddows and Purnell [42] and Purnell and Beddows [43] developed a
durability model for GFRC samples including OPC I and OPC II, and GFRC with
metakaolin, polymers and sulfo-aluminates and concluded that AR-glass
composites with OPC+5% polymer + sulpho-aluminate based additives was the
most durable of the GFRCs tested. Beddows and Purnell [42] present a
comparison of acceleration factors advanced by Litherland et al. [10] and
Purnell’s model for OPC II and M II (matrix modified with metakaolin).
3.1 Effect of matrix ingredients in durability of GFRC composites
The aging effects on flexural and tensile mechanical responses of GFRC
reported by Marikunte et. al. [25], were analyzed with the proposed model. Test
was categorized on the basis of ingredients involved in mix design and curing
conditions to which they were exposed. Three test series of mixes involving
metakaolin (MK) and silica fume (SF - with and without polymers) are
considered. Cement used was a U.S white Portland cement, the silica fume was
Elkem air densified microsilica, metakaolin was Englehard Metamax, the polymer
was Forton acrylic polymer and the super plasticizer was Sikament 10 and the
AR-glass fiber was Cem-FIL. Table 3-1 presents the proportions of mixture

42
ingredients. Mixing was done inside a high shear mixer with mortar and chopped
glass fibers sprayed in the mold in four crossed layers and later roller compacted.
Table 3-1: Details of test series and mixture proportions
Mix
Ingredients
GFRC Mixes (in kg)
A - Metakaolin
(MK)
B – Silica Fume
(SF 1)
C - Silica Fume
(SF 2)
Cement 100 100 100
Sand 100 100 100
Metakaolin 25 - -
Silica Fume - 25 25
Water 44 45.9 45.9
Polymer 12.3 - 12.3
Super
plasticizer
3 3 3
AR Glass
fibers
5% by weight of
composite
5% by weight of
composite
5% by weight of
composite
Specimens were initially exposed to normal curing for 28 days. In order to
simulate the long term performance the specimens after normal curing were
immersed in a hot water bath at 50 ºC. Samples were segregated and categorized
further based on exposure to two levels of accelerated aging, 28 and 84 days. Four
point flexural test and uniaxial tension test were then conducted to evaluate their
flexural performance and tensile properties. Flexural tests were conducted on
specimens of size 50 x 10 x 225 mm with a clear span of 205 mm and mid-point
deflections were measured. Stress and strain corresponding to the limit of
proportionality (LOP) and failure (MOR) were observed. Tension tests were
conducted on notched specimen, and crack mouth opening displacement (CMOD)
was measured. Flexural performances of GFRC composites at different levels of

43
aging were further compared to understand the effect of the mixture ingredients.
Figure 3-1 (a) – (c) compares the said responses based on aging effects.
(a) (b)
(c)
Figure 3-1 : Comparison between (a) Un-aged, (b) 28 day aging, (c) 84 day aged
data
3.1.1 Inverse Analysis
Since the compressive strength of concrete materials is several times
higher than its tensile strength, tensile characteristics control the flexural behavior
of a beam specimen. The tensile properties of GFRC can therefore be estimated
by inverse analysis from flexural response. For typical high dosage fiber GFRC
44
that show deflection hardening followed by brittle failure in the post peak region,
it is sufficient to describe the material behavior with three parameters: Young’s
elastic modulus E, first cracking strain εcr, and strain at peak stress εtrn (or
transitional strain). The constant stress in the last post crack region σcst for all test
series was assumed according to the experimental post peak response which is
predominantly brittle. The compressive response was assumed in linear elastic
range as compressive strength is relatively higher when compared to weaker
tensile strength.
The inverse analysis was performed by first adjusting Young’s modulus
until the initial slopes of the predicted and experimental flexural stress deflection
responses matched. Next, the first cracking strain was adjusted until the predicted
post crack response matched the proportional limit (LOP) of the experiments.
Finally, the strain at peak stress was adjusted until the predicted and experimental
peak stresses were similar.
3.1.2 Results and Discussions
Figure 3-2 - Figure 3-4 shows the results of inverse analysis conducted on
the mixes exposed to three levels of aging. With the addition of metakaolin in the
mix (A), the long term flexural behavior shows very less strength reduction and
durability as can be seen in Figure 3-2 - (a) and (b). The initial slope of flexural
response slightly increases between un-aged and 28 days of aging and then
decreases when it reaches 84 days. Drop of flexural strength from the un-aged to
the age of 84 days is marginal. The ductility as defined by an area under curve
decreases slightly with aging. Figure 3-2(b) reveals the inverse analysis results,

45
which resembles to the equivalent flexural stress but is less than an half in
magnitude. This difference is due to the stress definitions assumed by each model.
The equivalent flexural stress assumes a linear elastic stress distribution, having a
triangular shape, for pre-crack to post-crack responses while the proposed model
assumes more realistic shape of tensile stress as previously described in Figure
3-2(b).
(a) (b)
Figure 3-2 (a) : Inverse Analysis of Metakaolin Mix, (b) : Backcalculated
Tension Models
Addition of silica fume without any polymer in the mixture matrix (B),
changes the behavior of the composite to a great extent. The long term flexural
behavior shows deterioration when compared to the control mix. Figure 3-3(a)
and (b) show that the 28 day samples show higher flexural strength and back
calculated tensile strength, followed by the un-aged samples and 84 day samples.
Addition of silica fume with polymer in the mix (C) shows similar trend as the
previous case (mix B). Addition of polymers shows marginal improvement in

46
terms of the overall flexural and tensile behavior across all ages when compared
to the mix (B) without polymer. Figure 3-4(a) and (b) show that the 28 day
samples show higher flexural and tensile strength, followed by the un-aged
samples and 84 day samples, similar to mix (B).
(a) (b)
Figure 3-3 (a) : Inverse Analysis of Silica fume (SF 1) Mix B, (b):
Backcalculated Tension Models
(a) (b)
Figure 3-4 (a) : Inverse Analysis of Silica fume (SF 2) Mix C, (b) :
Backcalculated Tension Models

47
Parameters used in the material for simulating the performance of GFRC
composites with metakaolin and silica fume are presented in Table 3-2. Flexural
strength parameters calculated from the material model are presented in Table
3-3. Clearly GFRC matrix with metakaolin (mix A) has superior long-term
strength retention. Enhanced load carrying capacity and toughness could be
achieved only with metakaolin mixes with ageing. Insignificance of addition of
silica fume in terms of long term durability of GFRC mixes is evident.

48
Table 3-2: Input material parameters used to model GFRC composites
Model Input
Sample ID
Material Parameters Tension Compression
E εcr(μstr) α γ η μ βtu ω λ
GPa mm/mm mm/mm MPa/MPa MPa/MPa MPa/MPa mm/mm mm/mm mm/mm
Mix A (MK): Cement + 25% Metakaolin
A28 - M3 - 07 30 280 40 1 0.039 1.05 150 12 26
A28 - M3 - 08 30 210 50 1 0.039 0.05 150 12 26
A28 - M3 - 09 30 215 50 1 0.039 0.05 150 12 26
A84 - M3 - 13 27 260 48 1 0.018 1.05 55 12 26
A84 - M3 - 14 27 280 45 1 0.019 1.05 55 12 26
A84 - M3 - 15 27 260 45 1 0.019 1.05 55 12 26
C28 - M3 - 01 26 320 70 1 0.021 0.05 126 12 26
C28 - M3 - 02 26 270 70 1 0.02 0.05 126 12 26
C28 - M3 - 03 26 300 70 1 0.019 0.05 126 12 26
Mix B (SF 1): Cement + 40% Slag + 20% NRS (w/o Polymer)
A28 - M4 - 07 30 250 70 1 0.022 0.05 145 12 26
A28 - M4 - 08 30 240 75 1 0.022 0.05 145 12 26
A28 - M4 - 09 30 220 75 1 0.022 0.05 145 12 26
A84 - M4 - 13 27 200 60 1 0.016 0.05 100 12 26
A84 - M4 - 14 27 200 60 1 0.015 0.05 100 12 26
A84 - M4 - 15 27 200 56 1 0.017 0.05 100 12 26
C28 - M4 - 01 26 190 80 1 0.022 0.05 126 12 26
C28 - M4 - 02 26 200 80 1 0.023 0.05 140 12 26
C28 - M4 - 03 26 190 80 1 0.0205 0.05 140 12 26
Mix C (SF 2): Cement + 40% Slag + 20% NRS (with Polymer)
A28 - M5 - 07 30 340 40 1 0.014 0.1 100 12 26
A28 - M5 - 08 30 400 35 1 0.016 0.1 100 12 26
A28 - M5 - 09 30 380 35 1 0.016 0.1 80 12 26
A84 - M5 - 13 27 310 30 1 0.01 0.1 90 12 26
A84 - M5 - 14 27 270 30 1 0.01 0.1 90 12 26
A84 - M5 - 15 27 280 25 1 0.012 0.1 80 12 26
C28 - M5 - 01 26 310 45 1 0.008 0.1 95 12 26
C28 - M5 - 02 26 320 45 1 0.008 0.1 95 12 26
C28 - M5 - 03 26 380 45 1 0.009 0.1 95 12 26

49
Table 3-3 : Results of the inverse analysis on GFRC composites
Inverse Analysis Output
Sample ID
Bending
Stress,
MOR
Flexural
Stiffness
Load at
first
crack
Defl. at
first
crack
Stress
at first
crack
Max
Flexural
Load
Defl. at
Max
Flexural
Load
Flexur
al
Tough
ness
MPa N/mm N mm MPa N mm N.mm/
mm2
Mix A (MK): Cement + 25% Metakaolin
A28 - M3 - 07 32.163 618.36 133.33 0.22 6.0 714.74 4.94 8.60
A28 - M3 - 08 33.771 618.36 140.00 0.23 6.3 750.48 5.19 9.48
A28 - M3 - 09 34.575 618.36 143.33 0.23 6.5 768.34 5.31 9.93
A84 - M3 - 13 27.456 556.52 156.00 0.28 7.0 610.12 7.95 8.37
A84 - M3 - 14 29.288 556.52 168.00 0.30 7.6 650.85 8.07 9.68
A84 - M3 - 15 27.196 556.52 156.00 0.28 8.1 604.36 7.50 8.34
C28 - M3 - 01 40.345 535.91 184.89 0.35 8.3 896.55 10.31 20.24
C28 - M3 - 02 33.350 535.91 156.00 0.29 7.0 741.12 8.67 14.11
C28 - M3 - 03 36.285 535.91 173.33 0.32 7.8 806.32 9.60 17.05
Mix B (SF 1): Cement + 40% Slag + 20% NRS (w/o Polymer)
A28 - M4 - 07 37.102 618.36 166.67 0.27 7.5 824.48 8.08 15.48
A28 - M4 - 08 36.872 618.36 160.00 0.26 7.2 819.38 8.29 15.52
A28 - M4 - 09 33.800 618.36 146.67 0.24 6.6 751.10 7.59 13.04
A84 - M4 - 13 21.991 556.52 120.00 0.22 5.4 488.70 5.40 5.67
A84 - M4 - 14 21.521 556.52 120.00 0.22 5.4 478.25 5.48 5.56
A84 - M4 - 15 21.798 556.52 120.00 0.22 5.4 484.39 5.17 5.43
C28 - M4 - 01 26.143 535.91 109.78 0.20 4.9 580.95 6.98 8.51
C28 - M4 - 02 28.089 535.91 115.56 0.22 5.2 624.21 7.37 10.18
C28 - M4 - 03 25.322 535.91 109.78 0.20 4.9 562.72 6.94 8.68
Mix C (SF 2): Cement + 40% Slag + 20% NRS (with Polymer)
A28 - M5 - 07 34.793 618.36 226.67 0.37 10.2 773.17 6.41 12.74
A28 - M5 - 08 40.406 618.36 266.67 0.43 12.0 897.90 6.74 16.14
A28 - M5 - 09 38.385 618.36 253.33 0.41 11.4 853.01 6.41 13.35
A84 - M5 - 13 24.759 556.52 186.00 0.33 8.4 550.21 4.51 6.92
A84 - M5 - 14 21.565 556.52 162.00 0.29 7.3 479.21 3.93 5.25
A84 - M5 - 15 21.951 556.52 168.00 0.30 7.6 487.80 3.50 4.78
C28 - M5 - 01 25.425 535.91 179.11 0.33 8.1 565.01 6.39 9.03
C28 - M5 - 02 26.245 535.91 184.89 0.35 8.3 583.23 6.59 9.62
C28 - M5 - 03 31.822 535.910 219.55
6 0.410 9.880 707.15 7.849 13.78

50
3.1.3 Comparison between model parameters due to the aging affect
The relationships between material parameters and accelerated aging were
studied in Figure 3-5 (a)-(d). Time dependent material parameter were fit using a
second degree polynomial (quadratic) fit, and associated fit equations of which
are mentioned. The elastic Young’s modulus for samples is the maximum at age
of 28 days, followed by the 85 days aged samples and the un-aged samples. The
elastic modulus values were assumed to be the same for all mixes, to simplify the
simulations. Figure 3-5 (a) shows the variation of the back-calculated elastic
modulus with aging. Material parameter, η was also studied for its effect due to
aging of the samples. The material parameter, η for 28 day samples were
maintained at a moderately higher value over the un-aged and 84 day samples for
all the mixes. Variation of the parameter within replicate samples was pretty
much negligible apart from one data point recorded for 28 day samples. Figure
3-5 (b) projects the change in the material parameter, η with aging. Mixes with
silica fume without polymer (mix B) and metakaolin (mix A) show close trends
with their values several degrees higher than mix without polymer. The effect of
first cracking tensile strain, εcr due to aging is predicted in Figure 3-5 (c). The
values of strain due to the first crack show an interesting trend as the silica fume
samples with polymers (mix C) report larger strain through all ages, than the
GFRC matrix with metakaolin (mix A), followed by mix with silica fume without
polymers (mix B). Normalized transition strain, α shows a decrease trend with
aging across all mixes. For the mix with silica fume without polymers (mix B)
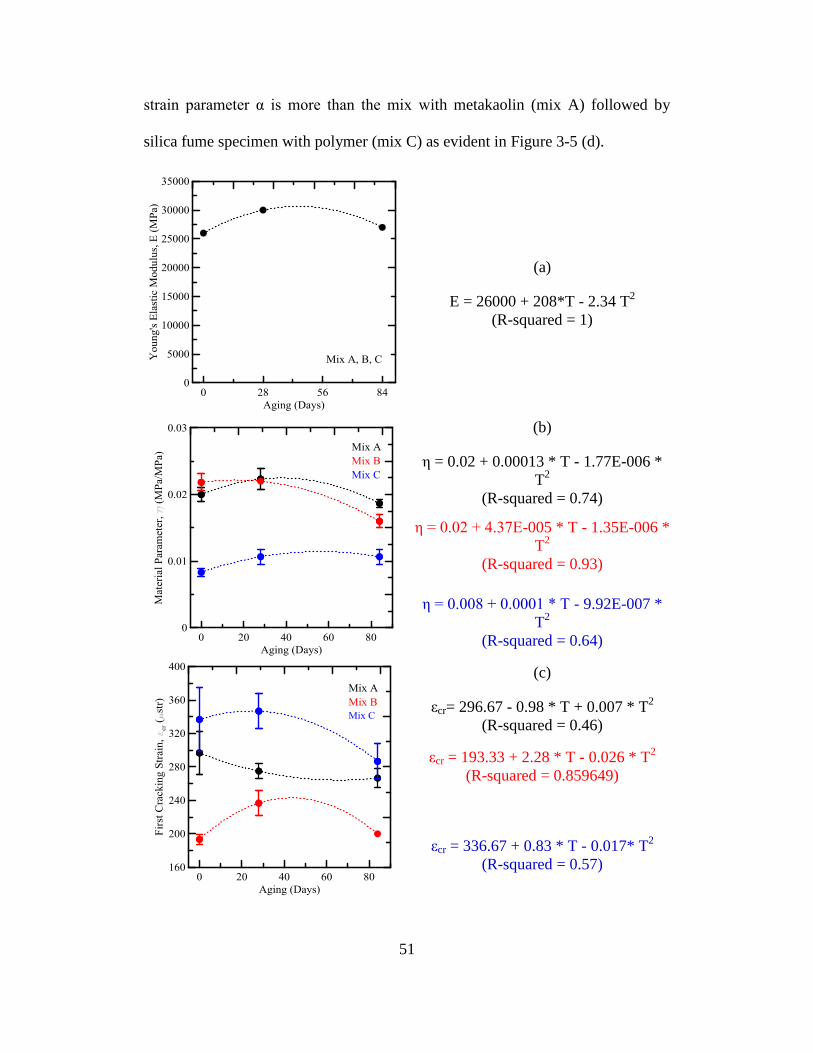
51
strain parameter α is more than the mix with metakaolin (mix A) followed by
silica fume specimen with polymer (mix C) as evident in Figure 3-5 (d).
(a)
E = 26000 + 208*T - 2.34 T2
(R-squared = 1)
(b)
η = 0.02 + 0.00013 * T - 1.77E-006 *
T2
(R-squared = 0.74)
η = 0.02 + 4.37E-005 * T - 1.35E-006 *
T2
(R-squared = 0.93)
η = 0.008 + 0.0001 * T - 9.92E-007 *
T2
(R-squared = 0.64)
(c)
εcr= 296.67 - 0.98 * T + 0.007 * T2
(R-squared = 0.46)
εcr = 193.33 + 2.28 * T - 0.026 * T2
(R-squared = 0.859649)
εcr = 336.67 + 0.83 * T - 0.017* T2
(R-squared = 0.57)
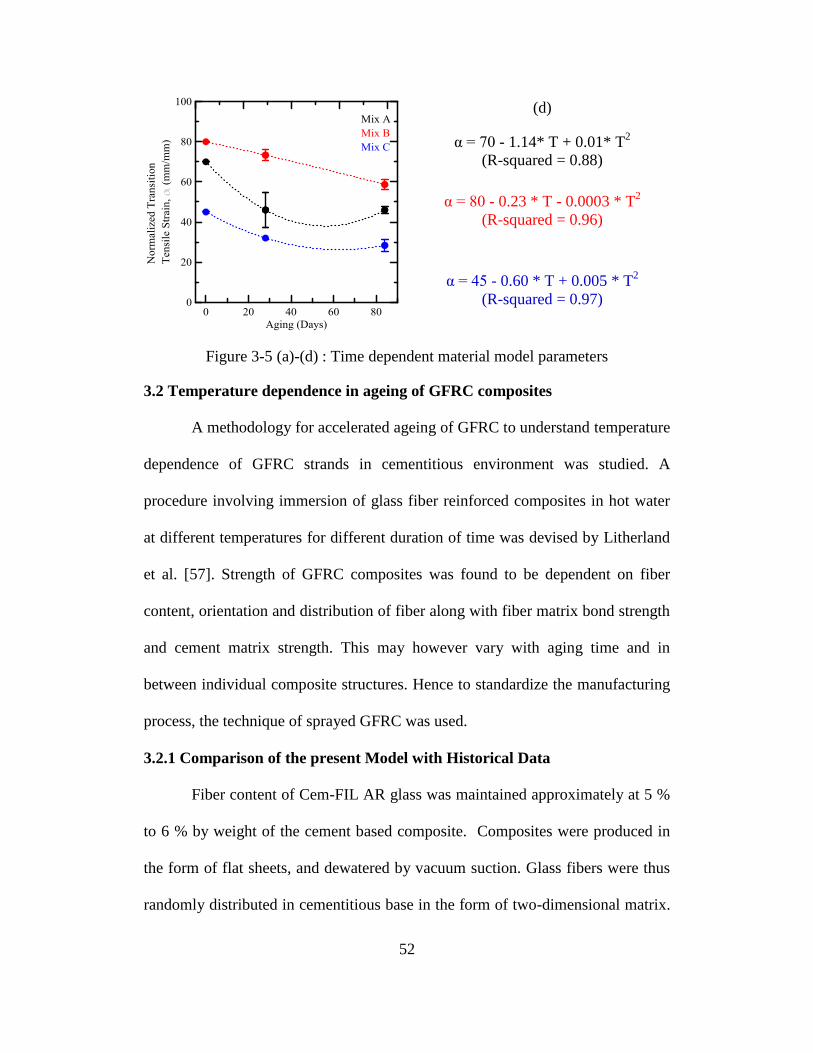
52
(d)
α = 70 - 1.14* T + 0.01* T2
(R-squared = 0.88)
α = 80 - 0.23 * T - 0.0003 * T2
(R-squared = 0.96)
α = 45 - 0.60 * T + 0.005 * T2
(R-squared = 0.97)
Figure 3-5 (a)-(d) : Time dependent material model parameters
3.2 Temperature dependence in ageing of GFRC composites
A methodology for accelerated ageing of GFRC to understand temperature
dependence of GFRC strands in cementitious environment was studied. A
procedure involving immersion of glass fiber reinforced composites in hot water
at different temperatures for different duration of time was devised by Litherland
et al. [57]. Strength of GFRC composites was found to be dependent on fiber
content, orientation and distribution of fiber along with fiber matrix bond strength
and cement matrix strength. This may however vary with aging time and in
between individual composite structures. Hence to standardize the manufacturing
process, the technique of sprayed GFRC was used.
3.2.1 Comparison of the present Model with Historical Data
Fiber content of Cem-FIL AR glass was maintained approximately at 5 %
to 6 % by weight of the cement based composite. Composites were produced in
the form of flat sheets, and dewatered by vacuum suction. Glass fibers were thus
randomly distributed in cementitious base in the form of two-dimensional matrix.

53
Strength-time curves of these composites were characterized by two distinct
regions, a steadily degrading initial region, followed by a rather constant strength
portion. This can be observed in Figure 3-6 wherein the GFRC composites in the
form of strips of dimension 150 mm x 50 mm and thickness varied between 6 – 8
mm, were immersed in water at various temperatures.
Figure 3-6 : Strength retention of GRC Composites in water at various
temperatures
About six replicate specimens were tested at various temperatures for their
flexural strength after various ageing periods. The data points in the figure
represent the average results obtained from several repetitions of these tests based
on variations in temperature and ageing periods. At accelerated ageing
temperatures of 60 ○C and 80
○C there is a rapid fall in initial strength followed by
a constant strength portion referring to the long term strength of these composites.
For lower ageing temperatures of 4 ○C, 19
○C and 35
○C the initial strength loss is
much slower. This indicates that the initial strength loss of GFRC composites is

54
more rapid at high temperatures. For the ageing temperature of 50 ○C the
transition between the initial and the long term strength is much smoother unlike
the higher temperatures wherein this transitional phase is more drastic. Earlier
research has shown that long term strength of GFRC composites is rather
temperature independent, with gradual strength loss in the later stages of ageing.
3.2.2 Inverse Analysis
Objective of this study is to use the material model discussed in the
previous sections and observe the trend in the model parameters based on the loss
of flexural strength when GFRC specimens were tested at different temperatures.
Each set of temperature data was individually considered and the modulus of
rupture (MOR) value of each their data points were fed to the material model.
Based on the individual MOR values, model parameters were developed and
simulated MOR values were matched against the experimental trend. Until both
MOR values – simulated (model) and experimental (digitized) match to their
second place of decimal, the model parameter were varied until they reach their
individual threshold. To simplify this procedure, only one parameter was
iteratively modified, while the rest were kept constant throughout this analysis.
The parameter to be modified was decided based on their ability to match the
trend in experimental MOR, when they were iteratively varied. After many
attempts, the model parameters “alpha (α)” and “eta (η)” which are the
transitional tensile strain and first cracking tensile strain respectively were
selected because of their relative accuracy in matching the experimental MOR
values.

55
(a)
(b)
c)
(d)
(e)
(f)
Figure 3-7 (a)-(f) : Response of parameter alpha as a function of parameter eta
Figure 3-7 (a)-(f) shows the response of parameter α against experimental
aging response at different η values. Amongst the simulations controlled by
56
parameter η, one series of α as a function of η is selected and compared in the
following figures. Next up the back calculated parameter, α was plotted against
the experimental MOR and the latter is plotted against the digitized aging data, all
in one plot as shown is Figure 3-8 (a)-(f). This is done to check the correctness of
the prediction, and also to facilitate comparison between the model parameter and
the experimental responses.
Figure 3-9 shows the comparison between the experimental responses
between MOR, ageing period and back calculated model parameter (normalized
transitional tensile strain, α). The latter as explained before is obtained from the
material model. It is to be noted that the idea behind this study was to simulate the
long term response of GFRC composites. Hence even though the model response
does not accurately replicate the experimental data points, the response of the
material model could predict a trend similar to the experimental trends.
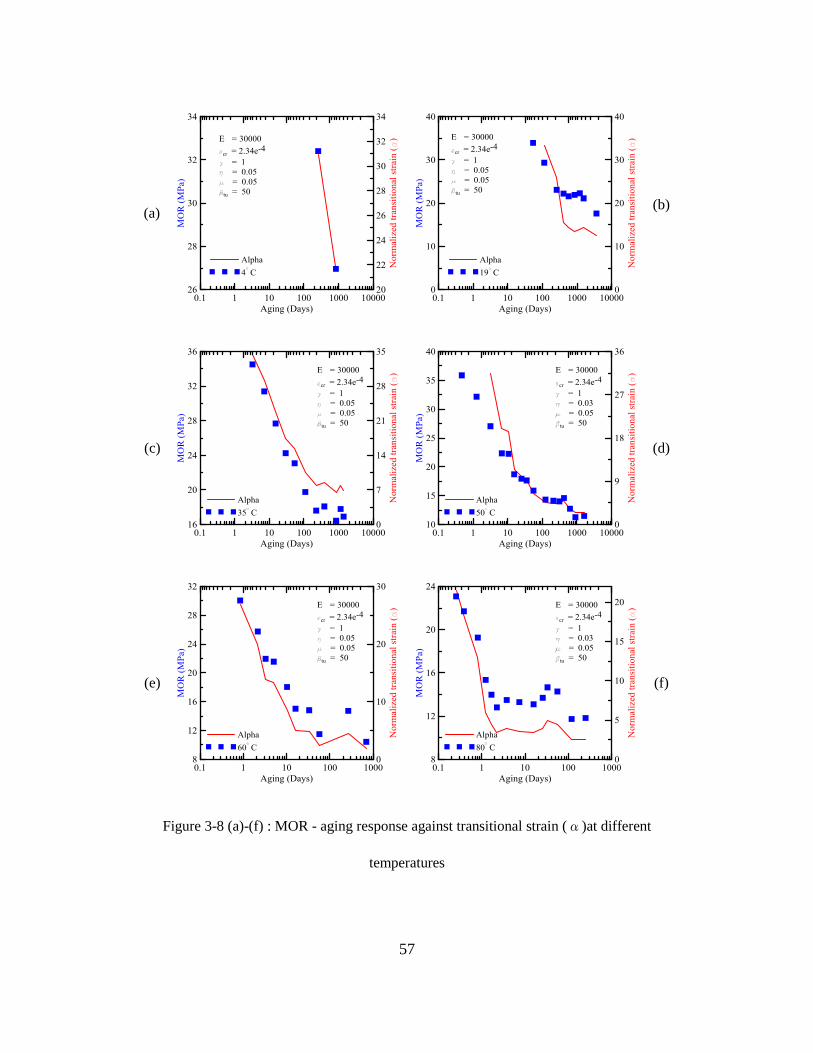
57
(a)
(b)
(c)
(d)
(e)
(f)
Figure 3-8 (a)-(f) : MOR - aging response against transitional strain (α)at different
temperatures

58
Figure 3-9 : Experimental (symbols only) v/s simulated (solid lines) aging
response using transitional strain (alpha)
3.3 Conclusions
The objective of the existing material model was used to characterize and
simulate the aging effect in GFRC mixtures. Effect of aging on material responses
described by the four parameters: Young’s modulus, first cracking tensile strain,
first cracking tensile strain and strain at peak stress were established and studied
closely. In this study, effects modifications in the cementitious matrix in the form
of metakaolin, silica fume and their contribution in long term durability of GFRC
composite was studied in detail. Metakaolin has more profound influence in
strength retention than silica fume. Temperature dependence through accelerated
ageing of GFRC composites was also investigated.

59
4. IMPACT RESPONSE OF FIBER REINFORCED AERATED
CONCRETE AS THE CORE MATERIAL
The objective of this chapter is to investigate the various lightweight
cementitious core materials from the view point of sustainability and long term
performance. Aerated concrete products have been a very mature technology for
construction that has been used for several years. An alternative material that is
being considered for the core in the sandwich composite is a new generation of
aerated concrete materials that is reinforced with polymeric fibers. This is chosen
since the overall material provides good thermal characteristics in terms of
conductivity and heat capacity, sound isolation, ductility, fire resistance, and ease
of construction. The core material is also quite compatible to the cement based
skin, so no additional bonding agent is needed in the construction of the sandwich
panels. The core is also compatible in terms of thermal expansion and contraction,
moisture migration is limited due to isolated, closed pore system, and finally, the
material is non-toxic in the case of fire and has excellent resistance to UV
radiations. An experimental based study was conducted on this novel green
construction material in order to address the potential ductility especially in cases
where the sandwich panel may be exposed to high strain rates. Behavior of this
material was evaluated under high strain flexural impact loading in order to
document the potential benefits of fiber reinforcement in the aerated concrete
products.

60
4.1 Introduction to Aerated Concrete
Aerated or cellular concrete (AC) is a lightweight, noncombustible, low
cement content material with good thermal characteristics. As mentioned in ACI
523.2R [58], aerated concrete is manufactured from a mixture of Portland cement,
fly ash or other sources of silica, quick lime, gypsum, water, and aluminum
powder or paste. This mixture, if autoclaved for accelerated strength gain, is
referred to as Autoclaved Aerated Concrete (AAC). Aerated concrete is
characterized by a highly porous structure, with micro air-pores to macro air-
pores [59] with the pore diameter in the range of 0.1 to 1 mm. This results in
lower density and compressive strength, but good thermal insulation when
compared to normal-weight concrete. Figure 1.2.1 shows their pore-structure
using a scanning electron microscope and a typical gray-scale image obtained by
image analysis.
Figure 4-1 : Pore-Structure of Aerated Concrete
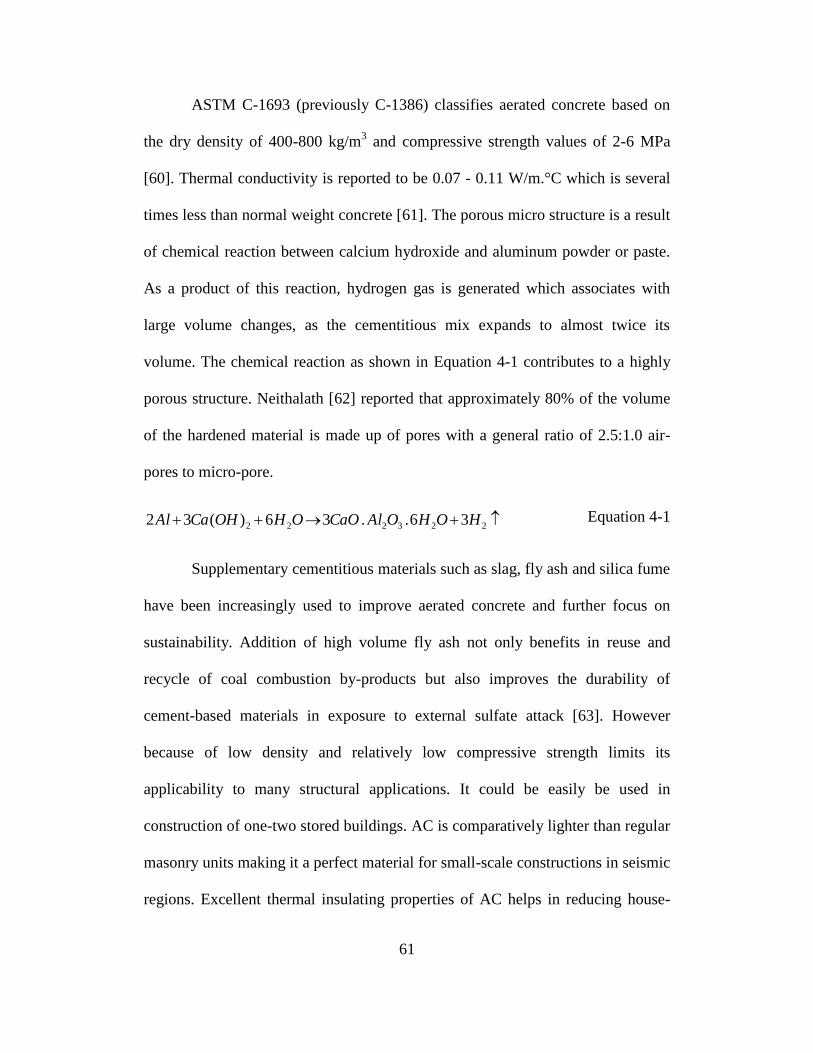
61
ASTM C-1693 (previously C-1386) classifies aerated concrete based on
the dry density of 400-800 kg/m3 and compressive strength values of 2-6 MPa
[60]. Thermal conductivity is reported to be 0.07 - 0.11 W/m.°C which is several
times less than normal weight concrete [61]. The porous micro structure is a result
of chemical reaction between calcium hydroxide and aluminum powder or paste.
As a product of this reaction, hydrogen gas is generated which associates with
large volume changes, as the cementitious mix expands to almost twice its
volume. The chemical reaction as shown in Equation 4-1 contributes to a highly
porous structure. Neithalath [62] reported that approximately 80% of the volume
of the hardened material is made up of pores with a general ratio of 2.5:1.0 air-
pores to micro-pore.
223222 36..36)(32 HOHOAlCaOOHOHCaAl Equation 4-1
Supplementary cementitious materials such as slag, fly ash and silica fume
have been increasingly used to improve aerated concrete and further focus on
sustainability. Addition of high volume fly ash not only benefits in reuse and
recycle of coal combustion by-products but also improves the durability of
cement-based materials in exposure to external sulfate attack [63]. However
because of low density and relatively low compressive strength limits its
applicability to many structural applications. It could be easily be used in
construction of one-two stored buildings. AC is comparatively lighter than regular
masonry units making it a perfect material for small-scale constructions in seismic
regions. Excellent thermal insulating properties of AC helps in reducing house-

62
hold energy consumption by about 7% by controlling the cooling energy
associated with the HVAC systems in residential structures [64]. A unique
variation of aerated concrete is Fiber-Reinforced Aerated Concrete (FRAC)
wherein autoclaving process is eliminated from the production and curing is
performed at room temperature. FRAC as the name suggests is additionally
reinforced with short polymeric fibers such as polypropylene. Thus making it a
pseudo-ductile composite characterized by a ductile elasto–plastic load –
deformation behavior [65]. The reason behind elimination of autoclaving
conditioning process is to protect the polymeric fibers, but this affects the overall
strength and affects the homogeneity of the system. However cost effectiveness
and energy efficiency can be achieved by eliminating the autoclaving process.
Thus FRAC can serve as a novel green construction material. Short polymeric
fibers induce bridging action during crack formation in elastic and plastic stages
due to the mechanical forces, shrinkage, or standard heating-cooling cycles.
Research conducted [66] to assess the effect of adding short polypropylene fibers
to lightweight cementitious panels have reported marked improvement in
mechanical properties such as modulus of rupture and toughness along with
improved resistance to cracking and crack propagation [65]. Aerated concrete
products can exhibit a considerable amount of residual compressive strength after
reaching the peak strength [67]. Ratio of residual strength to peak strength for
FRAC is however typically more than AAC due to the role of uniform
distribution of randomly oriented fibers in integrating the cellular structure. Thus
AAC is characteristically more brittle than FRAC which shows a predominantly

63
ductile response under flexural and tensile loading, as evident in Figure 4-2. Post
peak response under compression is predominantly characterized by sequential
crushing of pores, and collapse of cellular walls. Under tensile/flexural load,
ductility in FRAC can be observed after reaching its ultimate strength whereas
AAC shows characteristically brittle response, as discussed earlier.
Figure 4-2 : A schematic view of strain-stress response for AAC (black) and
FRAC (gray) [86]
Literature Review
Impact behavior of materials has been the topic for several investigations
especially based on low-velocity impact on fiber-reinforced concrete composites.
Type of impact test can be broadly classified as: Charpy, Izod, drop-weight, split
Hopkinson bar (SHB), explosive, and ballistic type tests. These tests can be either
instrumented or heuristically based and the resistance can be measured based on
fracture energy, damage accumulation, and measurement of the number of drops
to achieve a desired damage or stress level [1]. Testing variables can be size of
specimen, machine compliance, strain rate, type of instrumentation, or the test set-
up itself. Natural fiber-reinforced cement composites under similar three point

64
bending configuration based impact testing system using a drop weight
mechanism was conducted by Silva et al. [68]. They observed no significant
effect of strain rate on the ultimate strength of the composites under impact
loading when compared to static tests. Energy absorption showed an increasing
trend with increase in drop height. Zhu et al. [69] studied alkali resistant (AR)
glass fabric reinforced cement composites and crack pattern. Specimen with beam
type orientation show a higher load carrying capacity and lesser deflection when
compared to plate type orientated specimens. Maximum flexural stress and
absorbed energy of beam specimen increased with the number of fabric layers,
whereas plate specimen show reverse trend. Initial stiffness degradation is
observed after first crack formation; however initial stiffness as a function of
impact energy was insignificant. Impact properties of polyethylene (PE) fabric
were investigated by Gencoglu et al. [70] and compared to AR glass fabric. PE
fabric composites as they exhibit more load carrying capacity at large deflections
and hence more ductile than AR glass fabric systems. However PE fabric
composites displayed lesser strength than AR glass composites, which showed
brittle behavior.
Charpy impact tests and static three point bending tests were conducted by Silva
et al. on sisal pulp fiber-reinforced cement composites with a fiber mass fraction
of 14%. Insignificant difference was observed between maximum force obtained
from static and impact test [71,72]. Modified SHB used by Romano and Silva et
al. to characterize steel fiber-reinforced concrete (SFRC), showed an increase in
both toughness and ultimate strength when compared to static compression test
65
[73]. Bindiganavile and Banthia [74,75] showed that flexural strength is higher
when subjected impact loading in comparison to quasi-static loading for fiber-
reinforced concrete. Polymeric fibers reinforced concrete reported an
improvement in energy absorption under impact loading. Manolis et al.[76] also
showed that fibrillated polypropylene fibers significantly improved the impact
resistance of concrete slabs. Lok and Zhao [77] reported that at strain rates
exceeding 50s-1
, post-peak ductility of steel fiber-reinforced concrete (SFRC) is
lost owing to the loss of bond between the concrete fragments and steel fibers.
Choi and Lim [78] addressed the impact response of composite laminates using
the concept of linearized contact law approach. Wang et al. [79] identified two
different damage mechanisms for fiber-reinforced concrete (FRC) under drop
weight impact. Fiber fracture dominates the failure mechanism for fiber fractions
lower than the critical fiber volume (CFV). Whereas FRC with fiber fraction
higher than the CFV, fiber pull-out mechanism dominates the impact response.
The critical value for the hooked steel fibers was found to be in between 0.5% and
0.75%. Li et al.[80] investigated the behavior of extruded sheets with short fibers
of polyvinyl alcohol (PVA) and glass under static and impact loads. Glass fibers
were found to be more effective in improving the tensile strength and impact
properties, while PVA fibers increased the tensile strain and absorbed energy of
specimens. Low velocity impact (LVI) response of autoclaved aerated concrete
(AAC) was investigated by Serrano-Perez et al.[81] and their load carrying
capacity was stated to be limited due its brittle nature. However sandwich plates
made with carbon fibers and AAC as core material, were found to be considerably
66
ductile when subjected to similar impacts. AAC units under high-intensity pulses
using specially developed micro-explosions were studied for the characteristics of
dynamic cracking and comparison was made to plain hardened cement paste
(HCP) by Yankelevsky and Avnon [82]. Textile fabric glued to AAC with PVA
as surface reinforcement was found to increase the tensile strength and ductility
along with improved resistance to spalling cracks due to the explosion. Influence
of addition of hydrophilized and non-hydrophilized fibers to AAC, at different
fiber contents between 0.1 % - 0.4 % was studied by Laukaitis et al [83]. Carbon,
polypropylene, basalt and kaoline fibers were used for this project. Compression
and flexural strengths were investigated for various fibrous additions. Carbon
fibers showed maximum strength followed by polypropylene, basalt and kaoline
fibers. Hydrophilized fibrous additives contribute more to the increase in
compressive and flexural strengths than non-hydrophilized fibers. Micro-
structural properties were studied using scanning electron microscope in terms of
chemical interaction of fibers with concrete matrix, which ultimately influences
the macro-structural properties. Fiber filaments which were chemically inert
showed higher strength, when compared to kaoline filaments which interact
chemically with concrete matrix resulting in loss of strength. Fracture toughness
of AAC was investigated by Wittmann and Gheorghita [84] through compression
tests on ring beams, beams in the shape of prisms were tested under three point
bending and a compact tension (CT) specimen. Fracture energy of AAC was
found to be about one-tenth of normal weight concrete. Compressive, splitting
tensile strength, impact resistance properties of nylon and polypropylene fiber
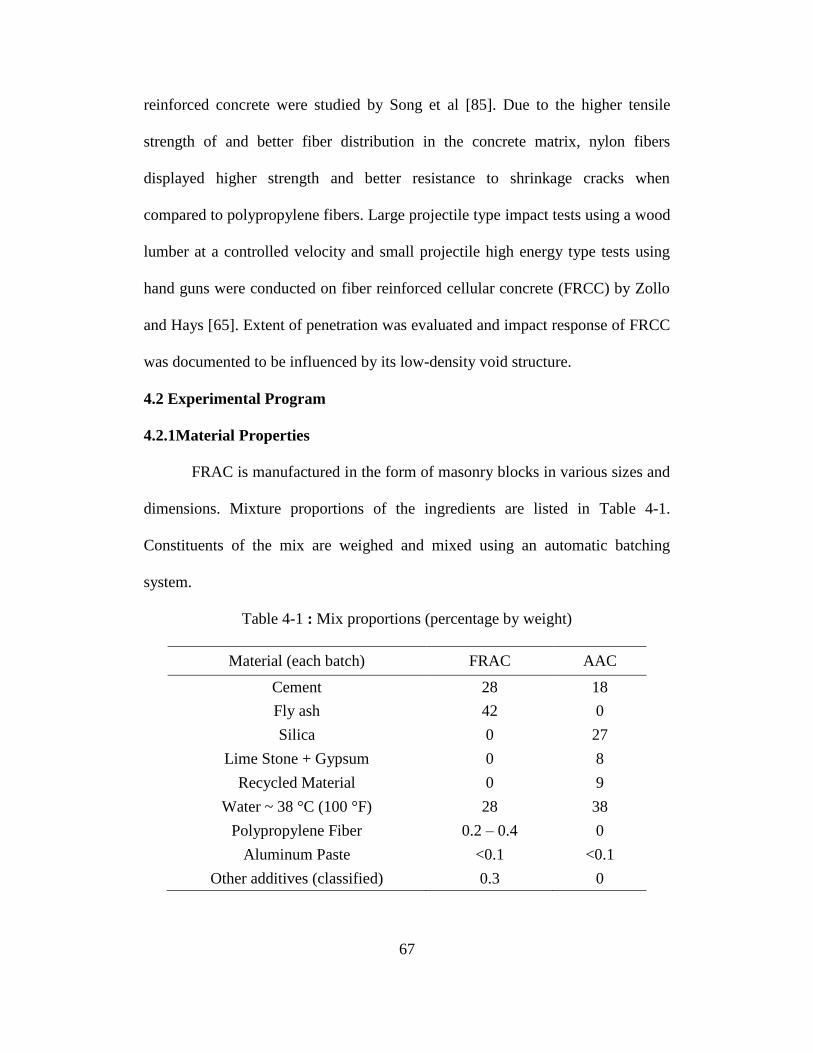
67
reinforced concrete were studied by Song et al [85]. Due to the higher tensile
strength of and better fiber distribution in the concrete matrix, nylon fibers
displayed higher strength and better resistance to shrinkage cracks when
compared to polypropylene fibers. Large projectile type impact tests using a wood
lumber at a controlled velocity and small projectile high energy type tests using
hand guns were conducted on fiber reinforced cellular concrete (FRCC) by Zollo
and Hays [65]. Extent of penetration was evaluated and impact response of FRCC
was documented to be influenced by its low-density void structure.
4.2 Experimental Program
4.2.1Material Properties
FRAC is manufactured in the form of masonry blocks in various sizes and
dimensions. Mixture proportions of the ingredients are listed in Table 4-1.
Constituents of the mix are weighed and mixed using an automatic batching
system.
Table 4-1 : Mix proportions (percentage by weight)
Material (each batch) FRAC AAC
Cement 28 18
Fly ash 42 0
Silica 0 27
Lime Stone + Gypsum 0 8
Recycled Material 0 9
Water ~ 38 °C (100 °F) 28 38
Polypropylene Fiber 0.2 – 0.4 0
Aluminum Paste <0.1 <0.1
Other additives (classified) 0.3 0
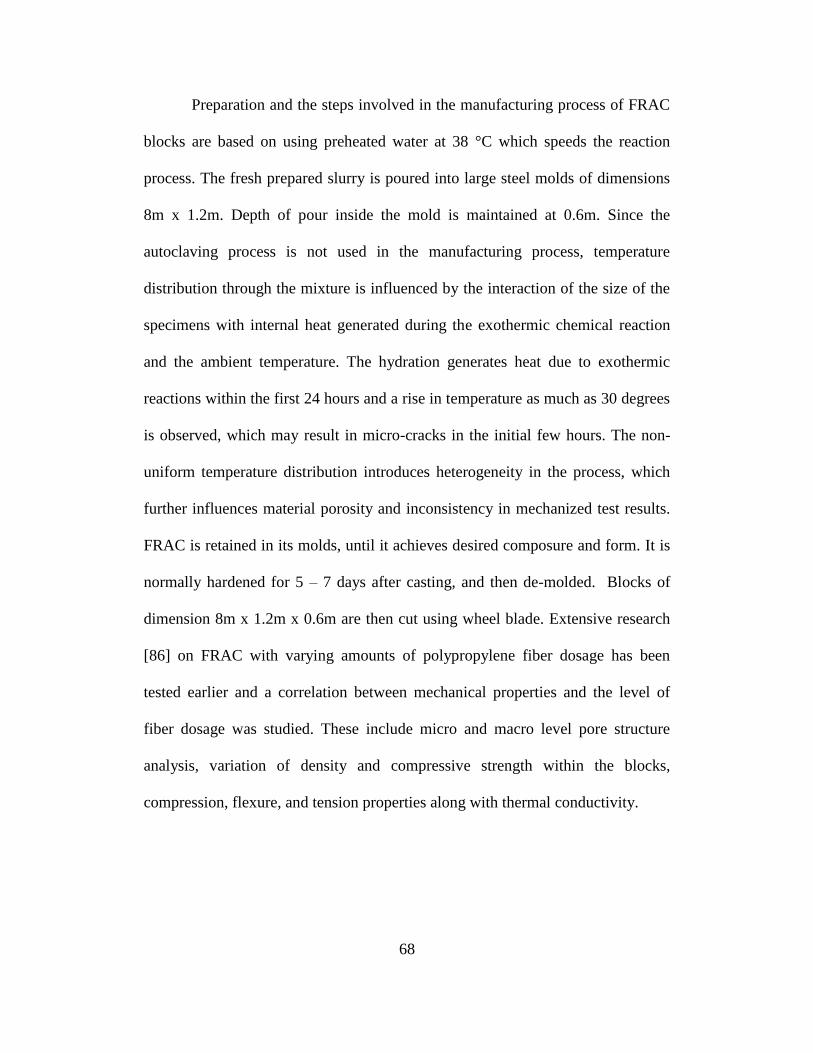
68
Preparation and the steps involved in the manufacturing process of FRAC
blocks are based on using preheated water at 38 °C which speeds the reaction
process. The fresh prepared slurry is poured into large steel molds of dimensions
8m x 1.2m. Depth of pour inside the mold is maintained at 0.6m. Since the
autoclaving process is not used in the manufacturing process, temperature
distribution through the mixture is influenced by the interaction of the size of the
specimens with internal heat generated during the exothermic chemical reaction
and the ambient temperature. The hydration generates heat due to exothermic
reactions within the first 24 hours and a rise in temperature as much as 30 degrees
is observed, which may result in micro-cracks in the initial few hours. The non-
uniform temperature distribution introduces heterogeneity in the process, which
further influences material porosity and inconsistency in mechanized test results.
FRAC is retained in its molds, until it achieves desired composure and form. It is
normally hardened for 5 – 7 days after casting, and then de-molded. Blocks of
dimension 8m x 1.2m x 0.6m are then cut using wheel blade. Extensive research
[86] on FRAC with varying amounts of polypropylene fiber dosage has been
tested earlier and a correlation between mechanical properties and the level of
fiber dosage was studied. These include micro and macro level pore structure
analysis, variation of density and compressive strength within the blocks,
compression, flexure, and tension properties along with thermal conductivity.
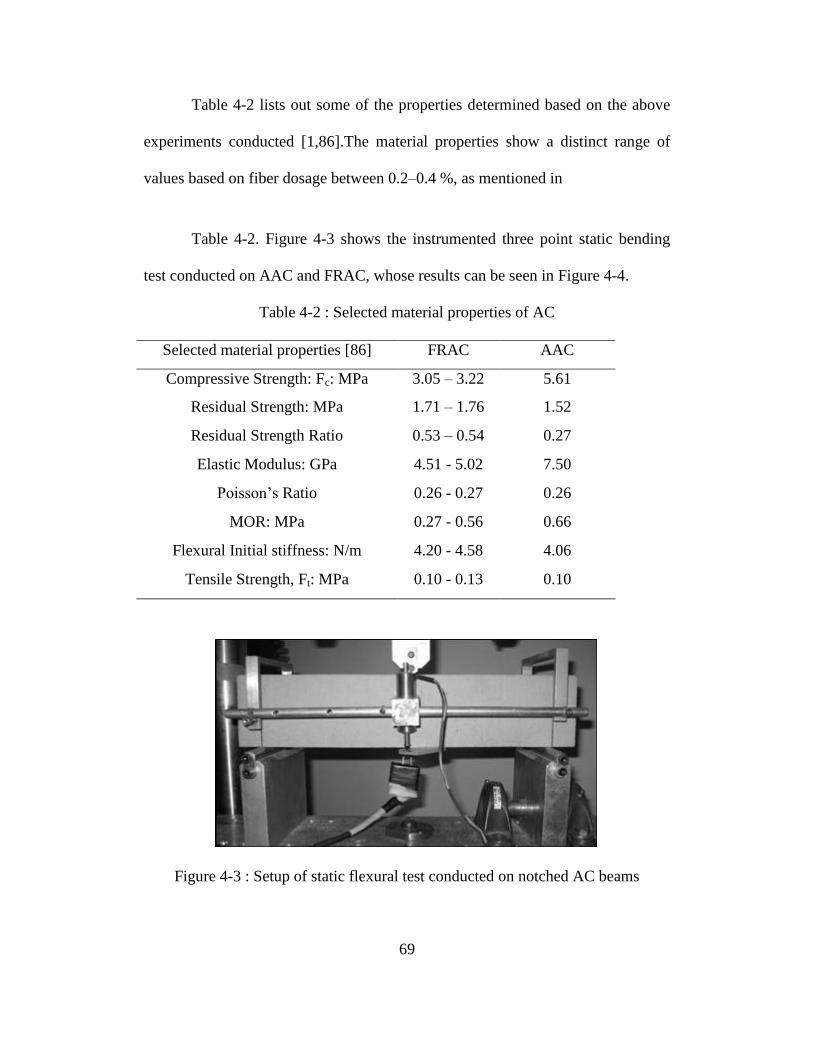
69
Table 4-2 lists out some of the properties determined based on the above
experiments conducted [1,86].The material properties show a distinct range of
values based on fiber dosage between 0.2–0.4 %, as mentioned in
Table 4-2. Figure 4-3 shows the instrumented three point static bending
test conducted on AAC and FRAC, whose results can be seen in Figure 4-4.
Table 4-2 : Selected material properties of AC
Selected material properties [86]
FRAC AAC
Compressive Strength: Fc: MPa 3.05 – 3.22 5.61
Residual Strength: MPa 1.71 – 1.76 1.52
Residual Strength Ratio 0.53 – 0.54 0.27
Elastic Modulus: GPa 4.51 - 5.02 7.50
Poisson’s Ratio 0.26 - 0.27 0.26
MOR: MPa 0.27 - 0.56 0.66
Flexural Initial stiffness: N/m 4.20 - 4.58 4.06
Tensile Strength, Ft: MPa 0.10 - 0.13 0.10
Figure 4-3 : Setup of static flexural test conducted on notched AC beams
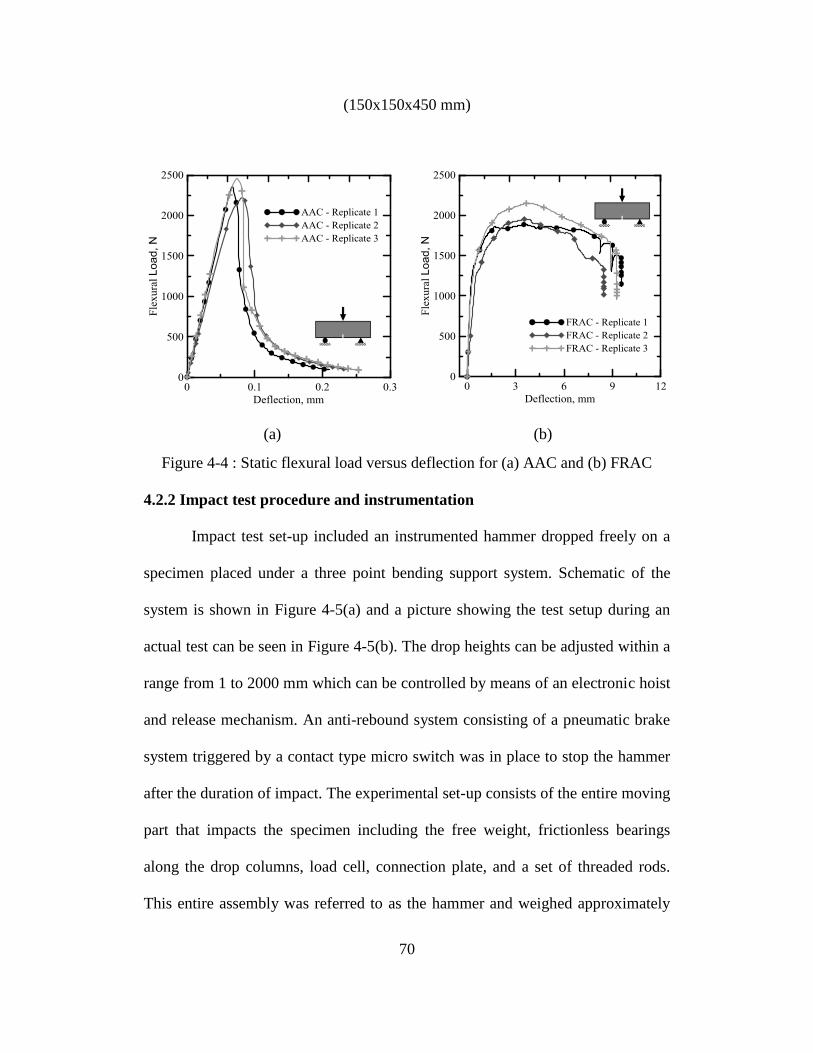
70
(150x150x450 mm)
(a) (b)
Figure 4-4 : Static flexural load versus deflection for (a) AAC and (b) FRAC
4.2.2 Impact test procedure and instrumentation
Impact test set-up included an instrumented hammer dropped freely on a
specimen placed under a three point bending support system. Schematic of the
system is shown in Figure 4-5(a) and a picture showing the test setup during an
actual test can be seen in Figure 4-5(b). The drop heights can be adjusted within a
range from 1 to 2000 mm which can be controlled by means of an electronic hoist
and release mechanism. An anti-rebound system consisting of a pneumatic brake
system triggered by a contact type micro switch was in place to stop the hammer
after the duration of impact. The experimental set-up consists of the entire moving
part that impacts the specimen including the free weight, frictionless bearings
along the drop columns, load cell, connection plate, and a set of threaded rods.
This entire assembly was referred to as the hammer and weighed approximately

71
134 N. In case the test specimen breaks completely, the threaded rods protect the
bottom load cell from the impact of the hammer. The hammer can be released
from a predetermined drop height by means of triggering switch which is backed
by an electronic brake release mechanism.
(a) (b)
Figure 4-5 : Schematic diagram (a) and actual picture (b) of impact test set-up
The impact force induced by the free fall weight was measured by the
strain-gage based load cell with a range of 90 kN mounted on the hammer behind
the blunt shaped impact head. Another load cell with same capacity was mounted
beneath the support plate and is used to measure the force transmitted to the
equipment base. A linear variable differential transformer (LVDT) with a range of
+10 mm was connected to the bottom of specimen (tension zone) by means of a
lever arm. Test specimen is placed on metal clip that is screwed to the lever arm.
An accelerometer with a capacity of ± 500g m/s2 was placed in the tension zone
of the specimen to document the acceleration-time history of the specimen. The
data acquisition system consisted of a PC based National Instruments PCI
Accelerometer
Load Cell
Hammer LVDT

72
acquisition card and LABVIEW VI’s with a trigger function which can record
signals from load cell, accelerometer and the LVDT simultaneously at sampling
rates of up to 100 kHz. For this study, the data acquisition system was conditioned
to collect data at the sampling rate of 20 kHz. The entire duration of the test lasts
200 milliseconds irrespective of the testing conditions. Signal acquisition during a
high dynamic test is strongly conditioned by the nature of the test itself [87], and
its interpretation is problematic. Rapid variation of the kinematic quantities
excites vibrations depending on the initial stiffness and mass of both the specimen
and the hammer resulting in disturbed signals. The interpretation of these signals
is difficult and hence it is mandatory to filter the data [88]. The frequency of data
collection, results in large set of data corresponding to each of the measured
response. Careful investigation of data response is necessary to select the range of
data corresponding to the actual impact on the specimen. In order to address these
challenges, a MATLAB program was developed for data processing and analysis
of raw test data. Steps involved in the analysis along with the fundamental
concepts are discussed in the following section. A high speed digital camera
(Phantom v.7) was set up to record the proceedings during the duration of impact.
The damage caused in the specimen for the different drop heights were then
compared by visual examination.
4.2.3 Theoretical background
The input energy for this test is the potential energy of the hammer and
depends on its drop height, mass and the amount of energy lost during the free fall
of the dropping mass. While a part of the input energy is absorbed by the test

73
specimen and stored in as internal energy, a part of the remaining energy is either
dissipated by friction, or transferred to the test set up through the supports after
the impact event. The input energy or the potential energy of the hammer, Ui is
defined based on the principle of conservation of energy, is stated in Equation
4-2.
2
i 0 d k f d
1U mgH mv U U U U
2 Equation 4-2
In this equation m is the mass of the entire moving assembly measured to
be approximately 134 N, g stands for acceleration due to gravity, H is the drop
height of hammer which is varied accordingly, ov represents the hammer velocity
prior to impact, Ud is the frictional energy dissipated energy between the time of
release of the hammer until just prior to the impact event. Uk represents the energy
absorbed by the specimen which is also the toughness of the material, and Uf
represents the energy remaining in the system after complete failure of the
specimen. This energy may be elastically stored in the specimen resulting in
rebound of the hammer mass, or transmitted through the specimen to the support.
The rebound action of the hammer is generally observed at relatively small drop
heights, and depends on the initial stiffness and strength of the material tested.
The absorbed energy or kinetic energy dissipated in the specimen, Uk, was
defined as in Equation 4-3 [1].
*
0
( ) ( ) ( ) ( )
t t
k
t
U P t v t dt P t d t
Equation 4-3
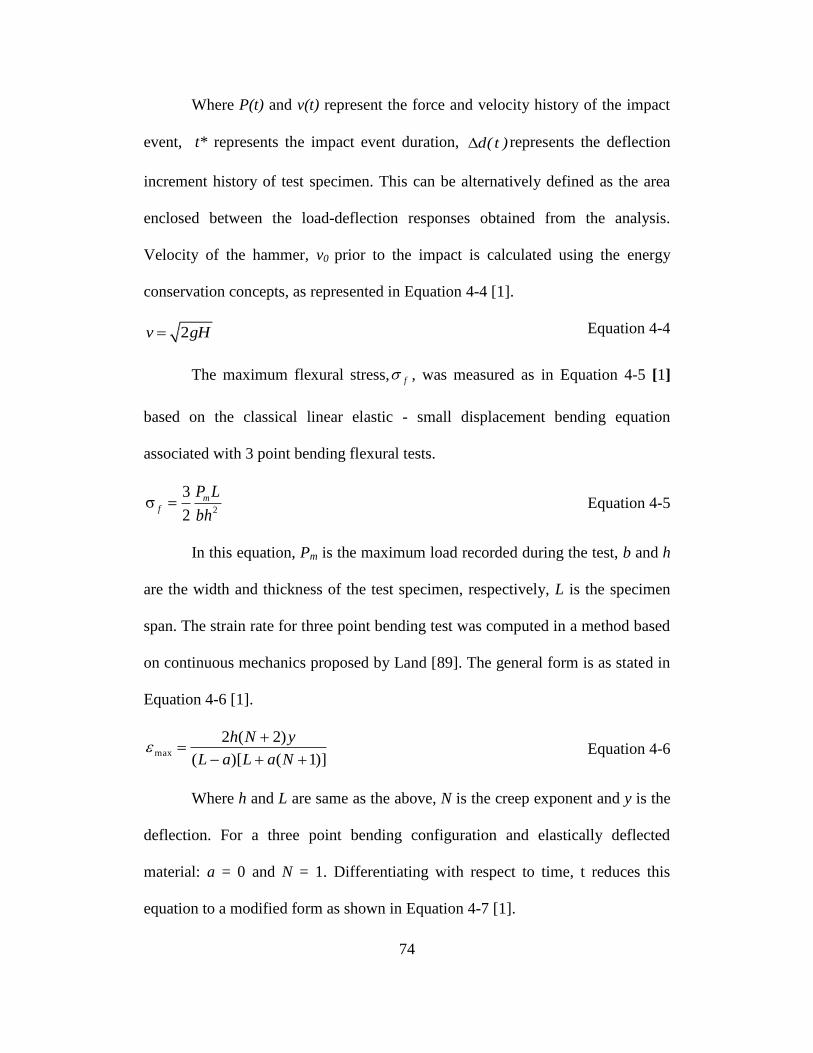
74
Where P(t) and v(t) represent the force and velocity history of the impact
event, t* represents the impact event duration, d( t ) represents the deflection
increment history of test specimen. This can be alternatively defined as the area
enclosed between the load-deflection responses obtained from the analysis.
Velocity of the hammer, v0 prior to the impact is calculated using the energy
conservation concepts, as represented in Equation 4-4 [1].
2v gH Equation 4-4
The maximum flexural stress, f , was measured as in Equation 4-5 [1]
based on the classical linear elastic - small displacement bending equation
associated with 3 point bending flexural tests.
2
3
2
mf
P L
bh Equation 4-5
In this equation, Pm is the maximum load recorded during the test, b and h
are the width and thickness of the test specimen, respectively, L is the specimen
span. The strain rate for three point bending test was computed in a method based
on continuous mechanics proposed by Land [89]. The general form is as stated in
Equation 4-6 [1].
)]1()[(
)2(2max
NaLaL
yNh Equation 4-6
Where h and L are same as the above, N is the creep exponent and y is the
deflection. For a three point bending configuration and elastically deflected
material: a = 0 and N = 1. Differentiating with respect to time, t reduces this
equation to a modified form as shown in Equation 4-7 [1].

75
2
6d Hv
dt L
Equation 4-7
Where v is the velocity of test specimen calculated using the slope of the
displacement - time response.
4.3 Analysis of test data
Un-notched specimens of three different dimensions were tested during
this study, whose brief geometric details are mentioned below in Table 4-3. While
the length and span of the specimen were kept constant at 250 mm and 200 mm,
respectively. Two types of cross-section: square and rectangular cross-section was
considered to understand the size effect of aerated concrete beams when exposed
to impact loading. Width and thickness of the specimen were alternately varied
between 50 mm and 100 mm. Impact tests were conducted at initial heights of 25
mm, 75 mm, and 150 mm of the impactor. Polymeric fiber content of FRAC
specimens tested was kept constant at 0.4%.
Table 4-3 : Dimensions of specimen tested under impact loading
Type of AC Dimensions, mm
(L x B x D)
FRAC
A 250 x 50 x 50 Square X/S
B 250 x 50 x 100 Rectangular X/S
C 250 x 100 x 100 Square X/S
AAC
A 250 x 50 x 50 Square X/S
B 250 x 50 x 100 Rectangular X/S
C 250 x 100 x 100 Square X/S

76
This section discusses the MATLAB program specially developed to
analyze the test data and calculate useful mechanical properties. The idea behind
developing this code was to process the raw data through necessary modifications,
smoothening and filtering of the response to reduce the noise in the data,
characteristic of such dynamic tests. The code was developed in several parts.
First section deals with input parameters which include physical specifications of
test specimens span and overhang length of the sample. Testing variables which
include geometrical details and material properties of the specimen should be
carefully entered, to obtain meaningful and correct results from the analysis.
Control parameters for data reduction of raw response are defined after number of
trials with different combinations of such numbers. Test data is next converted to
international unit (SI) of measurement, and the first row of time, load,
acceleration and deflection responses is modified to start from zero. Each of these
modified responses was further smoothened to reduce their inherent noise. Due to
the dynamic nature of this test, the entire range of all the responses are often
characterized by multiple peaks. Identifying the actual impact and corresponding
range of reduced data is necessary for further processing and meaningful
interpretations. After careful consideration of all the measured responses,
deflection was considered as the basis for selection of the range of the actual
impact. Subsequently a set of data is generated which is smoothened and reduced
based on the above procedure. A linearization fit of the load – time response is
critical to minimize external disturbances and also for comparison between
replicate data. Modified data is further reduced to three segments based on
77
selection of a range of data which represents a somewhat linear load response.
Initial part of load data, prior to the manually selected linear range, corresponds to
the first section. This is followed by the selected linear load-time response and the
remaining non-linear load response. Corresponding acceleration and deflection
data is defined for these three segments. Section of the modified data before the
linear part is ignored, as it is assumed to be caused by the initial disturbances
during the test. Instead a new set of data is defined based on the slope of the linear
part. The non-linear part is retained in its original form. Next, the linearized load-
time curve combining all the segments is shifted to start the time data from origin.
A modified set of data is generated, which is to be used for further calculations.
This concludes the second part of code whose focus was mainly to reduce the raw
response to a rather selective, smoothened response indicating the actual impact
event as shown in Figure 4-6. A series of plots corresponding to all the measured
responses is generated to check the correctness of the analysis. The final part of
the code focuses on applying the theoretical concepts discussed in the previous
section. Impact velocity of the hammer is computed based on Equation 4-4. Stress
generated due to the impact is calculated using Equation 4-5. A polynomial fit of
the displacement-time response is generated, and solving for the unknown in the
equation gives the slope of the displacement-time response. This value
corresponds to the velocity of the sample during the test, which further utilized to
calculate the strain rate using Equation 4-7. The slope of the load-deflection
response corresponds to the rigidity or the Initial stiffness of the specimen. These

78
computed values and responses were further analyzed by generating standard
figures, mentioned in the latter sections.
Figure 4-6 : Different stages involved in processing of experimental data

79
Figure 4-7 : Flow Chart explaining the analysis involved
Read experimental data (Stage 1)
Filter response using a smoothening function (Stage 2)
Create a new response based on
linear fit of load - time response
Generate modified response (Stage 4)
Shift time response
to origin
Start
Create standard plots of modified response
Compute standard flexural test parameters
Print computed parameters
Print analyzed responses
End
Select actual impact (Stage 3)
Select linear section of load-
time response
Input test specifications
and conversion factors
Flexural
Stress
Impact
Velocity
Max
Impact
Strain Rate
Max
Deflection
Toughnes
StiffnessImpulse

80
(a)
(b)
(c)
(d)
Figure 4-8 (a)-(d) : Post analysis response of an impact test event
Figure 4-8 (a)-(d) and Figure 4-9 presents typical results obtained from
analysis of a FRAC-B specimen tested at a drop height of 25 mm of impact
hammer. A typical flexural stress vs. deflection behavior can be categorized in
five distinct zones as presented in the Figure 4-8(d). Zone I is the linear elastic
range that ends with the formation of the first crack. The stress corresponding to
this point is defined as the limit of proportionality (LOP). This is followed by
Zone II which is characterized by multiple cracks associated with strain softening.
Initial stiffness / rigidity degradation starts in Zone II, and maximum flexural
81
stress values are obtained at the end of this region. Strain softening behavior is
again predominant in zones III and zone IV can be associated with fiber pull-out
mechanism. Depending on the nature of available energy which is a function of
drop height, Zone V can be observed which is characterized by the rebound of the
specimen. If there is sufficient ductility and stiffness in the specimen to absorb the
applied energy, some of the stored energy released causes a rebound that is
characterized by a reduction in deflection of the specimen as the load is
decreased. Time history of load, deflection and acceleration response obtained
from the above test is shown in Figure 4-9. Considerable phase lag can be
observed in deflection signal because maximum deflection of specimen is
recorded when the load acting on it drops significantly. Acceleration of the
specimen initially increases with increase in the load, followed by which it
decelerates before coming to rest. However the load and deflection signals
stabilize much after the specimen fails due to which permanent deflection and
post failure oscillations exist even after the impact event. According to Newton’s
second law of motion, depending on the mass of the FRAC and AAC specimens,
inertial force computed based on the peak acceleration value was found to be
approximately 10% of the maximum impact force. For comparison of impact
responses across different size and material of test specimen, inertial force on the
specimen during impact was neglected.
Five (or more) replicate specimens were tested for each testing condition.
Replicates of FRAC-B specimen tested at drop height of 75 mm are shown in
Figure 4-10 shows the reproducibility of test responses.
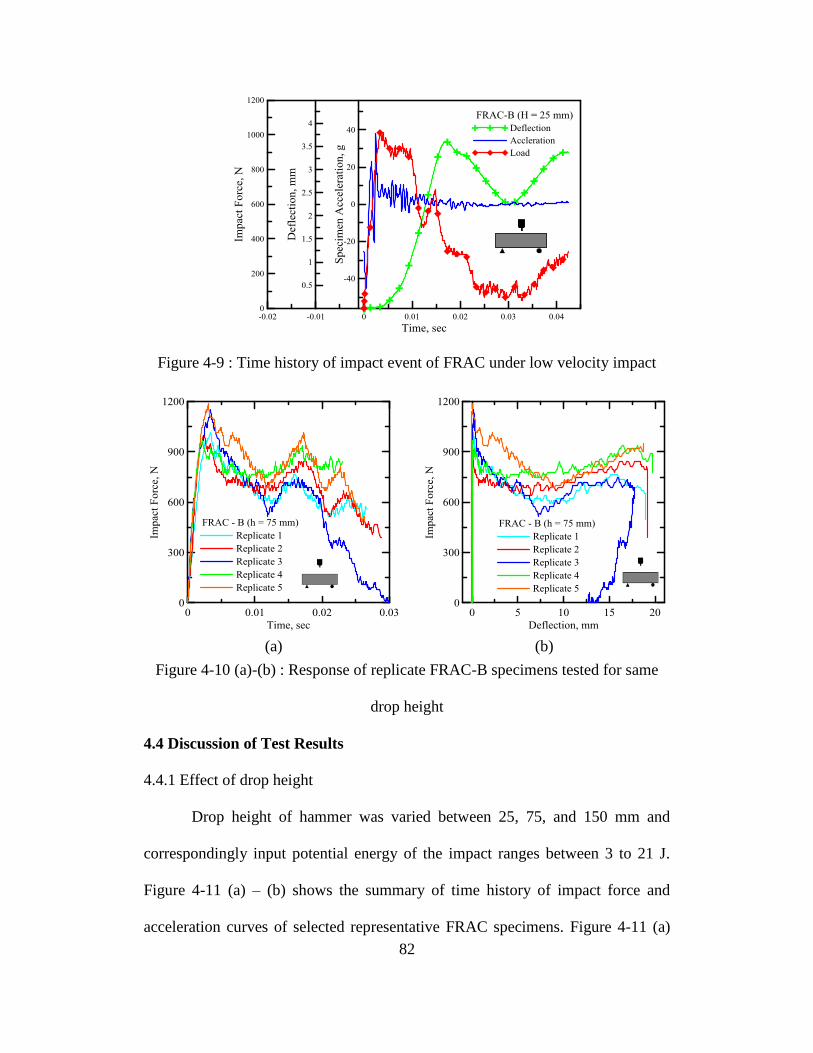
82
Figure 4-9 : Time history of impact event of FRAC under low velocity impact
(a) (b)
Figure 4-10 (a)-(b) : Response of replicate FRAC-B specimens tested for same
drop height
4.4 Discussion of Test Results
4.4.1 Effect of drop height
Drop height of hammer was varied between 25, 75, and 150 mm and
correspondingly input potential energy of the impact ranges between 3 to 21 J.
Figure 4-11 (a) – (b) shows the summary of time history of impact force and
acceleration curves of selected representative FRAC specimens. Figure 4-11 (a)
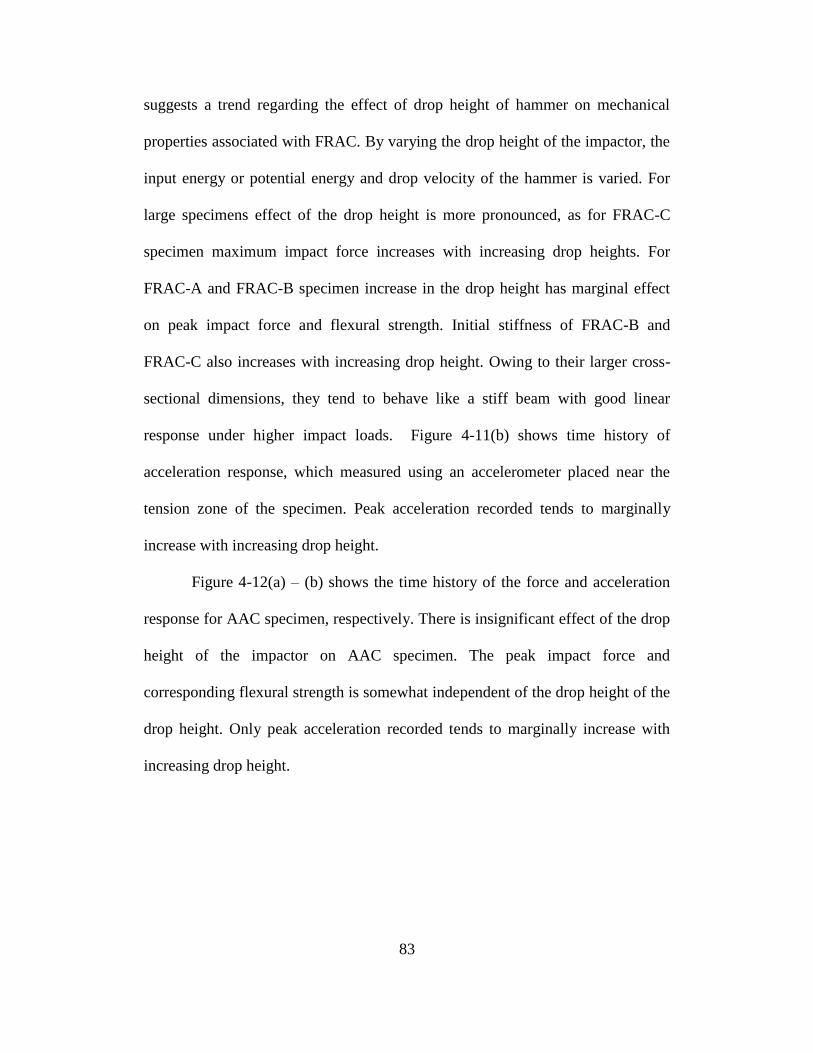
83
suggests a trend regarding the effect of drop height of hammer on mechanical
properties associated with FRAC. By varying the drop height of the impactor, the
input energy or potential energy and drop velocity of the hammer is varied. For
large specimens effect of the drop height is more pronounced, as for FRAC-C
specimen maximum impact force increases with increasing drop heights. For
FRAC-A and FRAC-B specimen increase in the drop height has marginal effect
on peak impact force and flexural strength. Initial stiffness of FRAC-B and
FRAC-C also increases with increasing drop height. Owing to their larger cross-
sectional dimensions, they tend to behave like a stiff beam with good linear
response under higher impact loads. Figure 4-11(b) shows time history of
acceleration response, which measured using an accelerometer placed near the
tension zone of the specimen. Peak acceleration recorded tends to marginally
increase with increasing drop height.
Figure 4-12(a) – (b) shows the time history of the force and acceleration
response for AAC specimen, respectively. There is insignificant effect of the drop
height of the impactor on AAC specimen. The peak impact force and
corresponding flexural strength is somewhat independent of the drop height of the
drop height. Only peak acceleration recorded tends to marginally increase with
increasing drop height.

84
(a)
(b)
Figure 4-11 (a)-(b) : Effect of drop height on FRAC specimen
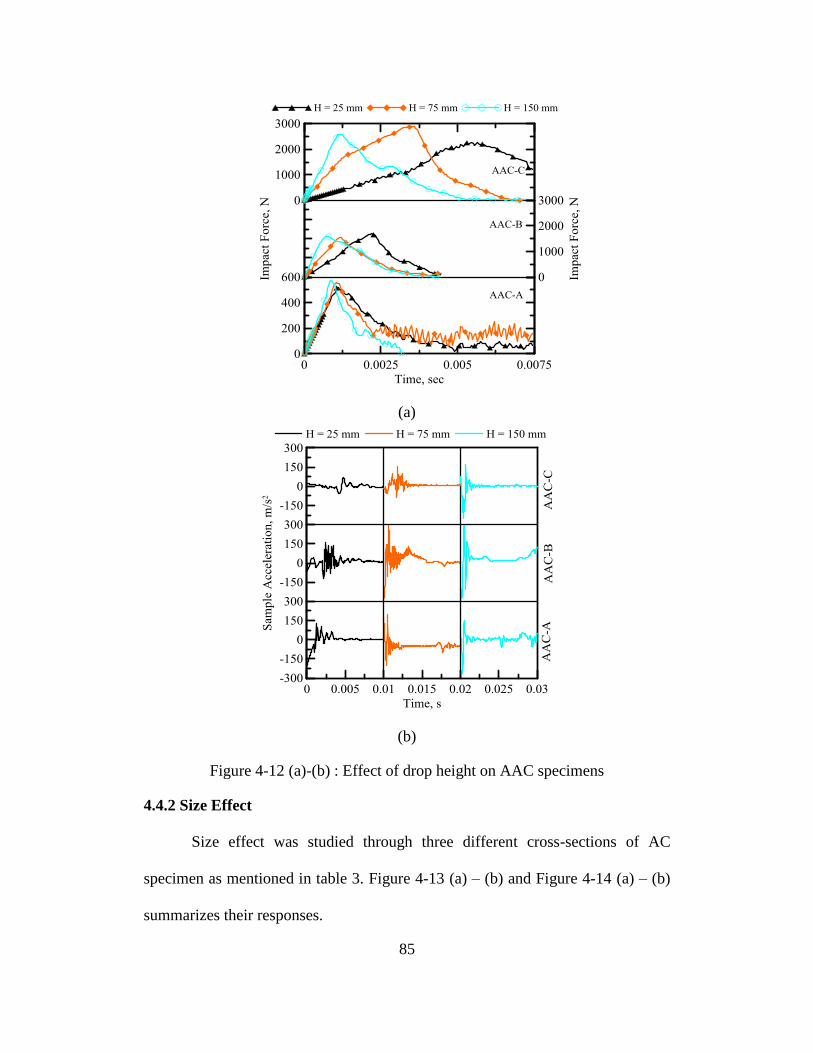
85
(a)
(b)
Figure 4-12 (a)-(b) : Effect of drop height on AAC specimens
4.4.2 Size Effect
Size effect was studied through three different cross-sections of AC
specimen as mentioned in table 3. Figure 4-13 (a) – (b) and Figure 4-14 (a) – (b)
summarizes their responses.
86
(a)
(b)
Figure 4-13 (a)-(b) : Size effect on FRAC specimen
Response of impact force against deflection of representative FRAC and
AAC specimens can be observed in Figure 4-13(a) and Figure 4-14 (a). Rebound
effect can be seen FRAC-C and AAC-C specimen under a drop height of 25 mm.
Due to their comparatively large cross-sectional dimensions, the beams respond
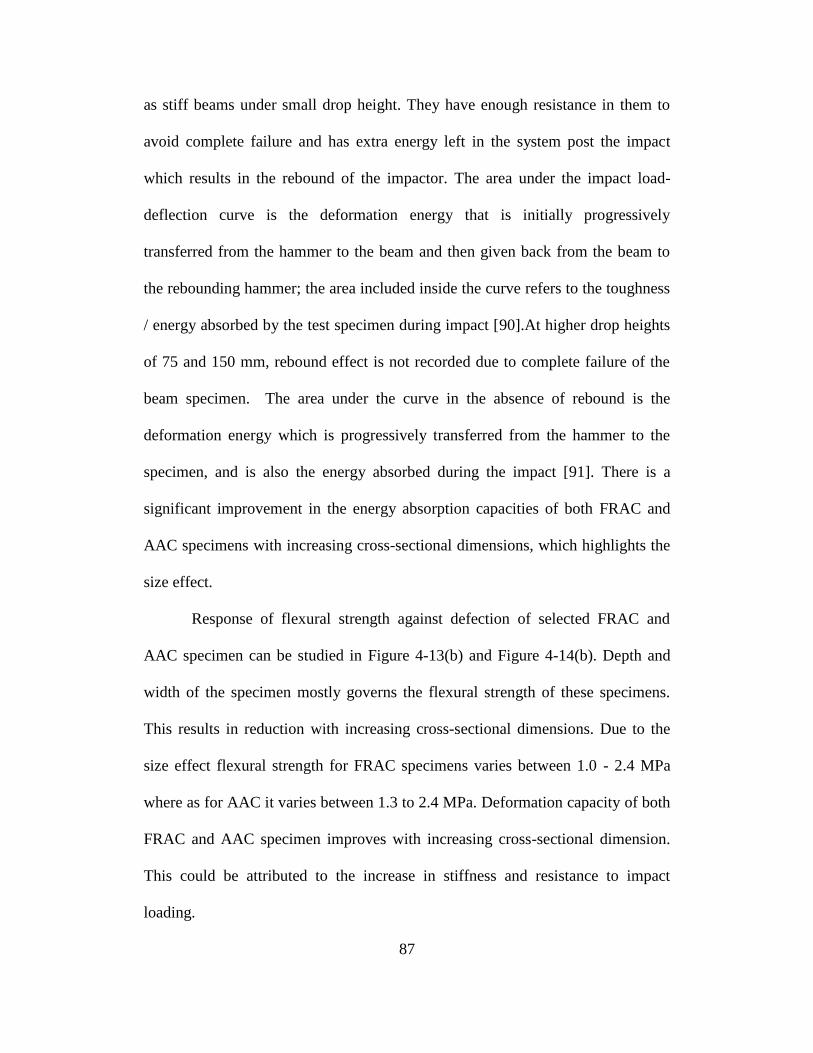
87
as stiff beams under small drop height. They have enough resistance in them to
avoid complete failure and has extra energy left in the system post the impact
which results in the rebound of the impactor. The area under the impact load-
deflection curve is the deformation energy that is initially progressively
transferred from the hammer to the beam and then given back from the beam to
the rebounding hammer; the area included inside the curve refers to the toughness
/ energy absorbed by the test specimen during impact [90].At higher drop heights
of 75 and 150 mm, rebound effect is not recorded due to complete failure of the
beam specimen. The area under the curve in the absence of rebound is the
deformation energy which is progressively transferred from the hammer to the
specimen, and is also the energy absorbed during the impact [91]. There is a
significant improvement in the energy absorption capacities of both FRAC and
AAC specimens with increasing cross-sectional dimensions, which highlights the
size effect.
Response of flexural strength against defection of selected FRAC and
AAC specimen can be studied in Figure 4-13(b) and Figure 4-14(b). Depth and
width of the specimen mostly governs the flexural strength of these specimens.
This results in reduction with increasing cross-sectional dimensions. Due to the
size effect flexural strength for FRAC specimens varies between 1.0 - 2.4 MPa
where as for AAC it varies between 1.3 to 2.4 MPa. Deformation capacity of both
FRAC and AAC specimen improves with increasing cross-sectional dimension.
This could be attributed to the increase in stiffness and resistance to impact
loading.
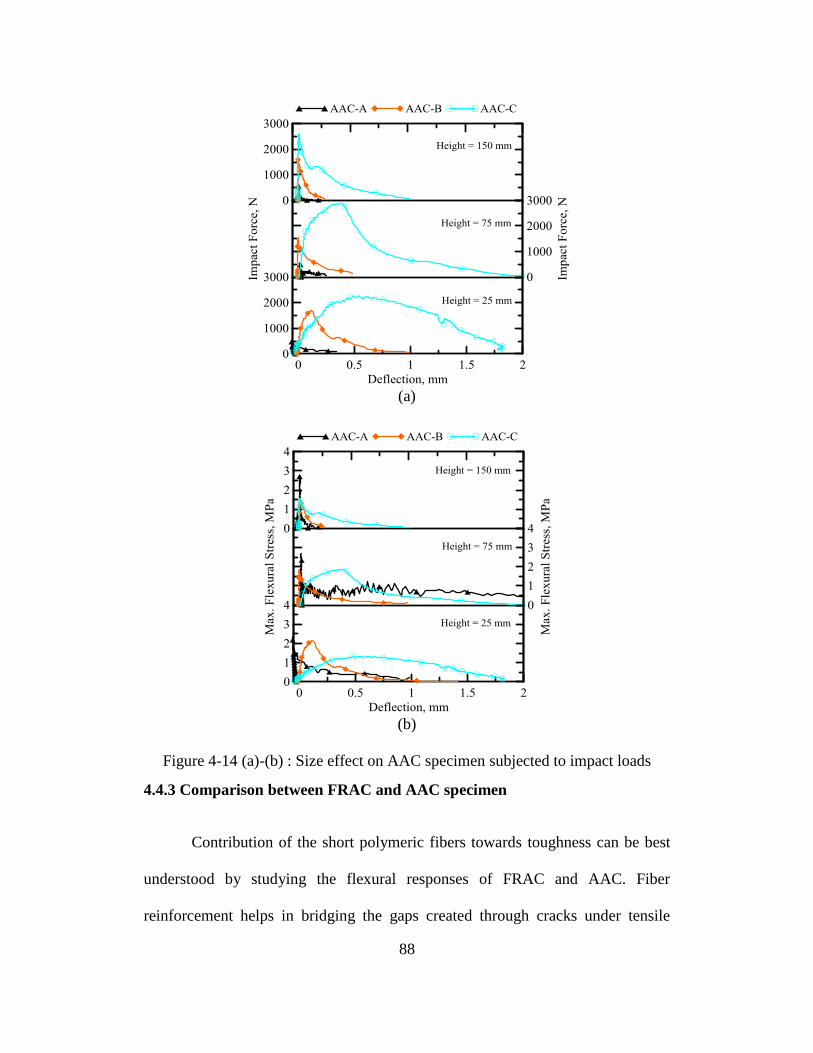
88
(a)
(b)
Figure 4-14 (a)-(b) : Size effect on AAC specimen subjected to impact loads
4.4.3 Comparison between FRAC and AAC specimen
Contribution of the short polymeric fibers towards toughness can be best
understood by studying the flexural responses of FRAC and AAC. Fiber
reinforcement helps in bridging the gaps created through cracks under tensile
89
loading, aiding in higher energy absorption capacity [1]. Typical damage
mechanism involved could be explained to be associated with fiber de-bonding
and nucleation of micro-voids [92]. Figure 4-15 (a) – (c) shows the comparison
between impact responses of different dimensions of FRAC and AAC specimens
tested under different input potential energies. In the absence of fibers, AAC is
practically brittle by nature, and as clearly evident in the figures, it loses its
structural integrity soon after peak load. There is hardly any resistance to
propagation of tensile cracks and post-peak response involves unstable crack
propagation and complete loss of load-carrying capacity [86]. FRAC specimens
exhibit a well-defined post peak response due to the presence of the fibers. Peak
strength is achieved in the non-linear part of the load-deflection response and is
associated with strain hardening. There is an appreciable post peak response and
is associated with large amount of energy dissipation and significant strain
softening. Large area enclosed within the load-deflection response contributes to
higher toughness and greater energy absorption capacity. However AAC exhibits
marginally higher modulus of rupture and load carrying capacity than FRAC.
Figure 4-16 (a) – (c) summarizes the performance in term of flexural strength and
initial stiffness (linear-part only) of three sizes of AC systems tested. Non-linear
part of the load-deflection response after LOP is characterized by stiffness
degradation.
Extent of stiffness degradation in the non-linear part was not evaluated in
this current study. Flexural strength and initial stiffness recorded at different drop
heights of the impactor show contrasting trends. AAC specimens show marginally
90
higher load carrying capacity than FRAC, hence when comparisons are made
between same sized specimens, AAC has higher flexural strength values than
FRAC.
(a) (b)
(c)
Figure 4-15 (a)-(c) : Comparison between FRAC and AAC under impact loading

91
(a) (b)
(c)
Figure 4-16 (a)-(c) : Flexural strength and initial stiffness of FRAC and AAC
specimens
Rigidity or initial stiffness which is measured as the slope of the linear
part of the load – deflection response, shows an increasing trend with increase in
cross-sectional dimensions. This could be attributed to increase in load carrying
capacity in case of large specimens. FRAC specimens however show higher
rigidity when compared to AAC at matching drop heights of the impactor. Effect
of increase in drop height has a significant effect on the stiffness of the
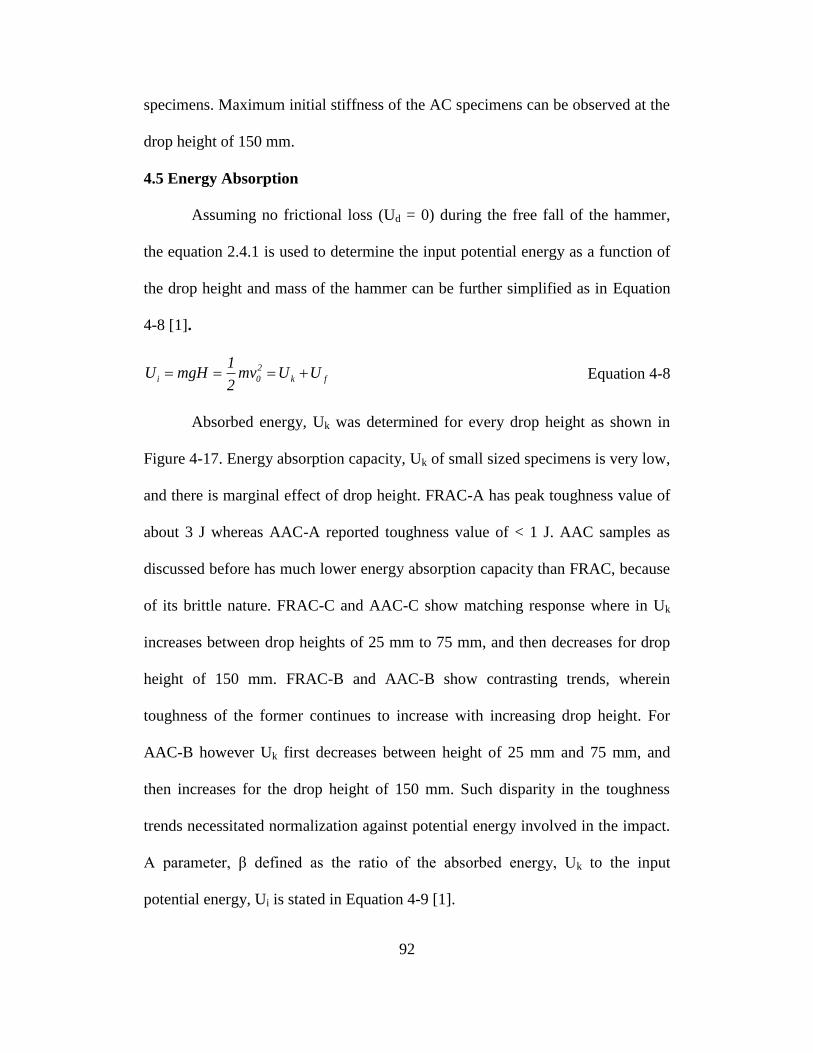
92
specimens. Maximum initial stiffness of the AC specimens can be observed at the
drop height of 150 mm.
4.5 Energy Absorption
Assuming no frictional loss (Ud = 0) during the free fall of the hammer,
the equation 2.4.1 is used to determine the input potential energy as a function of
the drop height and mass of the hammer can be further simplified as in Equation
4-8 [1].
2
i 0 k f
1U mgH mv U U
2 Equation 4-8
Absorbed energy, Uk was determined for every drop height as shown in
Figure 4-17. Energy absorption capacity, Uk of small sized specimens is very low,
and there is marginal effect of drop height. FRAC-A has peak toughness value of
about 3 J whereas AAC-A reported toughness value of < 1 J. AAC samples as
discussed before has much lower energy absorption capacity than FRAC, because
of its brittle nature. FRAC-C and AAC-C show matching response where in Uk
increases between drop heights of 25 mm to 75 mm, and then decreases for drop
height of 150 mm. FRAC-B and AAC-B show contrasting trends, wherein
toughness of the former continues to increase with increasing drop height. For
AAC-B however Uk first decreases between height of 25 mm and 75 mm, and
then increases for the drop height of 150 mm. Such disparity in the toughness
trends necessitated normalization against potential energy involved in the impact.
A parameter, β defined as the ratio of the absorbed energy, Uk to the input
potential energy, Ui is stated in Equation 4-9 [1].
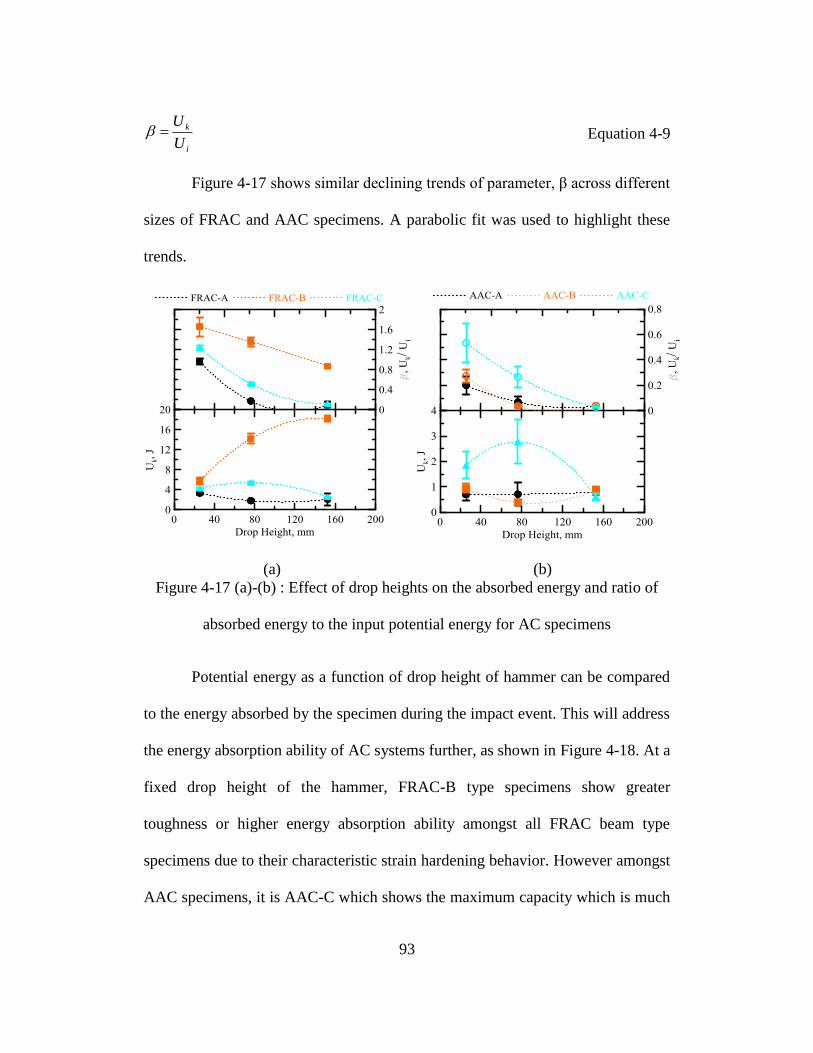
93
i
k
U
U Equation 4-9
Figure 4-17 shows similar declining trends of parameter, β across different
sizes of FRAC and AAC specimens. A parabolic fit was used to highlight these
trends.
(a) (b)
Figure 4-17 (a)-(b) : Effect of drop heights on the absorbed energy and ratio of
absorbed energy to the input potential energy for AC specimens
Potential energy as a function of drop height of hammer can be compared
to the energy absorbed by the specimen during the impact event. This will address
the energy absorption ability of AC systems further, as shown in Figure 4-18. At a
fixed drop height of the hammer, FRAC-B type specimens show greater
toughness or higher energy absorption ability amongst all FRAC beam type
specimens due to their characteristic strain hardening behavior. However amongst
AAC specimens, it is AAC-C which shows the maximum capacity which is much
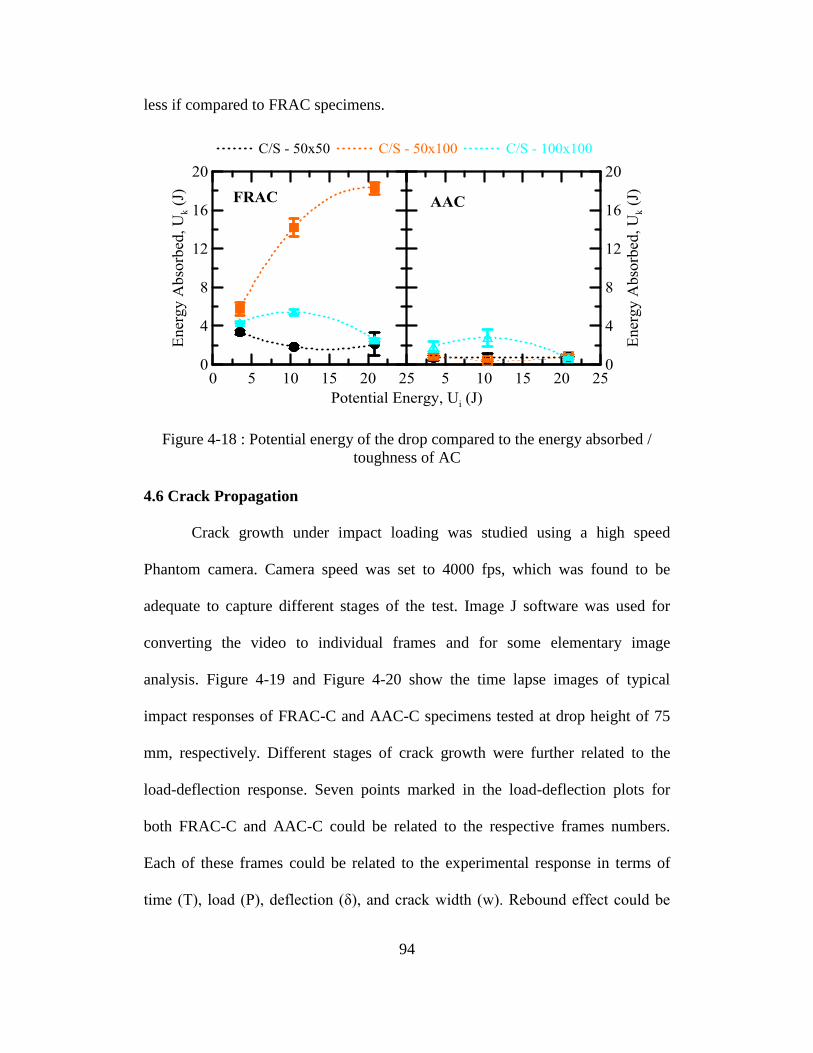
94
less if compared to FRAC specimens.
4.6 Crack Propagation
Crack growth under impact loading was studied using a high speed
Phantom camera. Camera speed was set to 4000 fps, which was found to be
adequate to capture different stages of the test. Image J software was used for
converting the video to individual frames and for some elementary image
analysis. Figure 4-19 and Figure 4-20 show the time lapse images of typical
impact responses of FRAC-C and AAC-C specimens tested at drop height of 75
mm, respectively. Different stages of crack growth were further related to the
load-deflection response. Seven points marked in the load-deflection plots for
both FRAC-C and AAC-C could be related to the respective frames numbers.
Each of these frames could be related to the experimental response in terms of
time (T), load (P), deflection (δ), and crack width (w). Rebound effect could be
Figure 4-18 : Potential energy of the drop compared to the energy absorbed /
toughness of AC

95
noticed in the load deflection response of FRAC-C specimen, which could be
related to the frame titled F7. Deflection value recorded decreases from frame F6,
signifying reduction in crack width due to rebound of the impactor.

96
F1 F2 F3 F4 F5 F6 F7
T = 0 μs
P = 0 N
δ = 0.0 mm
w = 0.0 mm
T = 3970 μs
P = 1513 N
δ = 0.8 mm
w = 0.8 mm
T = 6380 μs
P = 640 N
δ = 2.4 mm
w = 2.2 mm
T = 10210 μs
P = 234 N
δ = 7.2 mm
w = 3.3 mm
T = 13080 μs
P = 468 N
δ = 13.0 mm
w = 3.9 mm
T = 16270 μs
P = 141 N
δ = 17.60 mm
w = 4.2 mm
T = 19770 μs
P = 61 N
δ = 15.53 mm
w = 3.9 mm
Figure 4-19 : Crack propagation of a representative FRAC-C specimen under a drop height of 75 mm
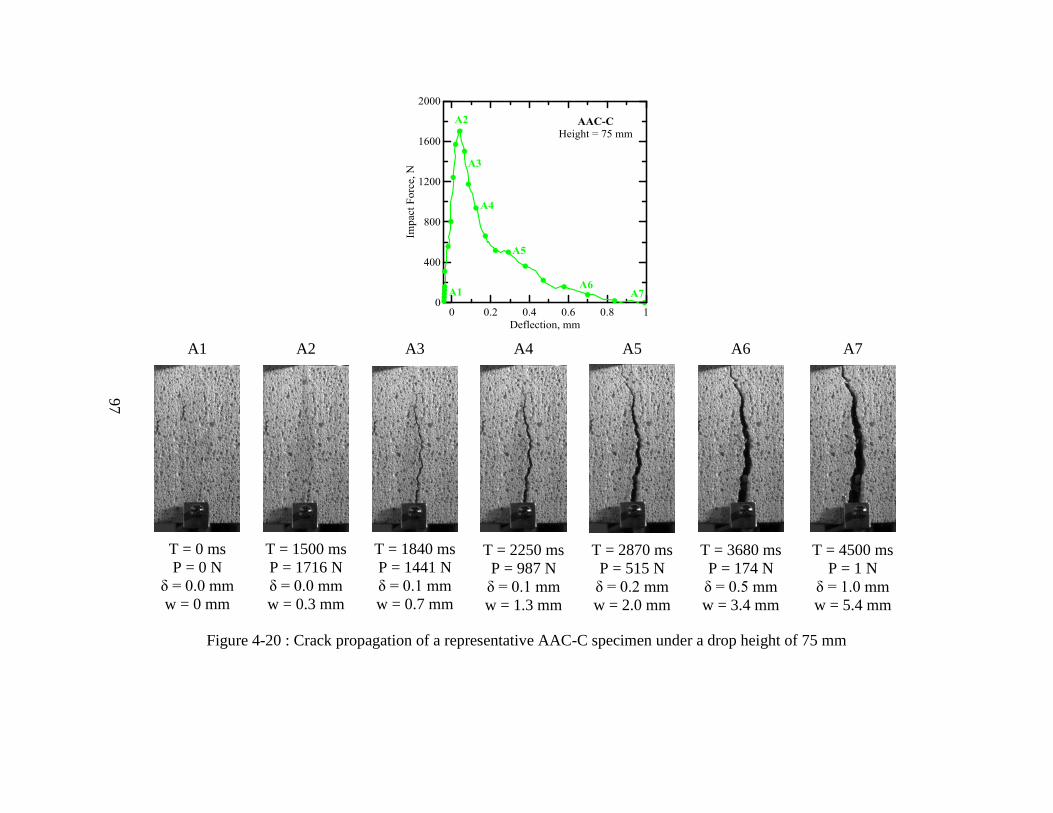
97
A1 A2 A3 A4 A5 A6 A7
T = 0 ms
P = 0 N
δ = 0.0 mm
w = 0 mm
T = 1500 ms
P = 1716 N
δ = 0.0 mm
w = 0.3 mm
T = 1840 ms
P = 1441 N
δ = 0.1 mm
w = 0.7 mm
T = 2250 ms
P = 987 N
δ = 0.1 mm
w = 1.3 mm
T = 2870 ms
P = 515 N
δ = 0.2 mm
w = 2.0 mm
T = 3680 ms
P = 174 N
δ = 0.5 mm
w = 3.4 mm
T = 4500 ms
P = 1 N
δ = 1.0 mm
w = 5.4 mm
Figure 4-20 : Crack propagation of a representative AAC-C specimen under a drop height of 75 mm

98
Table 4-4 : Experimental results of FRAC specimens
Specimen Type
(Dimensions)
Drop
Height
Drop
Velocity-
Hammer
Velocity-
Specimen
Strain
Rate
Max
Impact
Force
Flexural
Strength
Max
Deflection
Potential
Energy
Absorbed
Energy
Initial
Stiffness
mm mm/sec mm/sec sec-1
N MPa mm J J N/mm
FRAC-A
(250 x 50 x 50)
25.4 706 689 2.5 549 2.41 17.70
3.48 3.36 289
(331) (1.2) (85) (0.32) (5.03) (0.40) (53)
76.2 1223 1014 11.2 575 2.41 19.68
10.44 1.83 211
(77) (0.8) (125) (0.33) (0.09) (0.36) (50)
152.4 1729 880 19.5 555 2.38 19.88
20.88 2.12 170
(85) (1.9) (194) (0.65) (0.21) (2.32) (60)
FRAC-B
(250 x 50 x 100)
25.4 706 83 0.3 1214 1.44 11.18
3.48 5.78 306
(94) (0.3) (84) (0.03) (8.08) (1.32) (128)
76.2 1223 965 10.7 1064 1.29 18.88
10.44 14.20 664
(69) (0.8) (99) (0.09) (0.73) (1.95) (105)
152.4 1729 889 19.7 1129 1.39 19.55
20.88 18.27 764
(179) (4.0) (98) (0.16) (0.15) (1.22) (29)
FRAC-C
(250 x 100 x 100)
25.4 706 86 0.3 1613 0.98 6.22
3.48 4.34 644
(93) (0.3) (299) (0.24) (3.05) (0.21) (144)
76.2 1223 668 7.4 1819 1.15 16.68
10.44 5.44 906
(266) (2.9) (114) (0.11) (3.93) (0.45) (220)
152.4 1729 945 20.9 2160 1.31 17.92
20.88 2.55 1055
(97) (2.1) (229) (0.13) (0.79) (0.34) (178)

99
Table 4-5 : Experimental results of AAC specimens
Specimen Type
(Dimensions)
Drop
Height
Drop
Velocity-
Hammer
Velocity-
Specimen
Strain
Rate
Max
Impact
Force
Flexural
Strength
Max
Deflection
Potential
Energy
Absorbed
Energy
Initial
Stiffness
mm mm/sec mm/sec sec-1
N MPa mm J J N/mm
AAC-A
(250 x 50 x 50)
25.4 706 896 3.7 546 2.66 19.59
3.48 0.26 152
(132) (0.4) (112) (0.70) (0.21) (0.48) (57)
76.2 1223 920 12.4 558 2.73 19.72
10.44 0.71 159
(383) (2.1) (28) (0.18) (0.04) (0.90) (32)
152.4 1729 1012 22.4 524 2.81 19.77
20.87 0.79 120
(46) (1.0) (95) (0.70) (0.35) (0.19) (20)
AAC-B
(250 x 50 x 100)
25.4 706 437 1.6 1726 2.17 16.41
3.48 0.95 347
(237) (0.9) (190) (0.25) (7.93) (0.35) (143)
76.2 1223 992 11.0 1541 1.90 19.95
10.44 0.39 443
(165) (1.8) (417) (0.51) (0.39) (0.20) (162)
152.4 1729 1013 22.4 1706 1.92 19.51
20.87 0.86 379
(96) (2.1) (383) (0.51) (0.87) (0.32) (100)
AAC-C
(250 x 100 x 100)
25.4 706 4 0.02 2182 1.31 1.30
3.48 1.86 250
(3) (0.01) (340) (0.23) (0.89) (1.07) (55)
76.2 1223 453 5.0 2943 1.87 11.82
10.44 2.77 743
(406) (4.5) (581) (0.33) (8.87) (1.72) (671)
152.4 1729 802 17.8 2539 1.56 17.42
20.87 0.62 677
(42) (0.9) (169) (0.10) (0.09) (0.27) (168)

100
Table 4-4 and Table 4-5 present the average values of the results obtained
from the analysis of FRAC and AAC specimens, respectively. Average and
standard deviation values of 5 replicate specimens are reported in these tables in
adjacent rows. Analysis was done using the MATLAB code described in the
previous sections. Absorbed energy (toughness) and deformation capacity of the
specimens are reported directly from the output of the computer code wherein
entire history of the load-deflection response is considered. Accurate toughness
values need to be determined by considering individual responses which has to be
reported against a pre-determined deflection value (actual deformation capacity).
This deflection value could be assumed at load level at which specimen does not
have any significant load carrying capacity.
4.7 Conclusions
Impact response of aerated concrete was studied using an instrumented
test based on a three-point bending configuration. Time-history of the load,
acceleration, deflection responses, and absorbed energy of the specimen were
obtained and discussed in details. Plain autoclaved aerated concrete (AAC) and
fiber-reinforced aerated concrete (FRAC) were tested for their flexural impact
behavior. The effect of impact energy on the mechanical properties was
investigated for various drop heights of 25 mm, 75 mm, and 150 mm and different
specimen sizes. It was observed that dynamic flexural strength under impact tests
was more than twice higher than the static flexural strength. FRAC showed more
than thirty times higher flexural toughness compared to AAC which can be
attributed to the role of short fibers in bridging the flexural cracks and absorbing

101
the impact energy. Rebound effect was observed for larger specimens under low
drop heights. The instrumented impact test performed in this chapter was found to
be a good method for studying the impact response of cement-based materials
such as aerated concrete products. The same testing procedure was used to
investigate the impact resistance of sandwich beams with aerated concrete core.
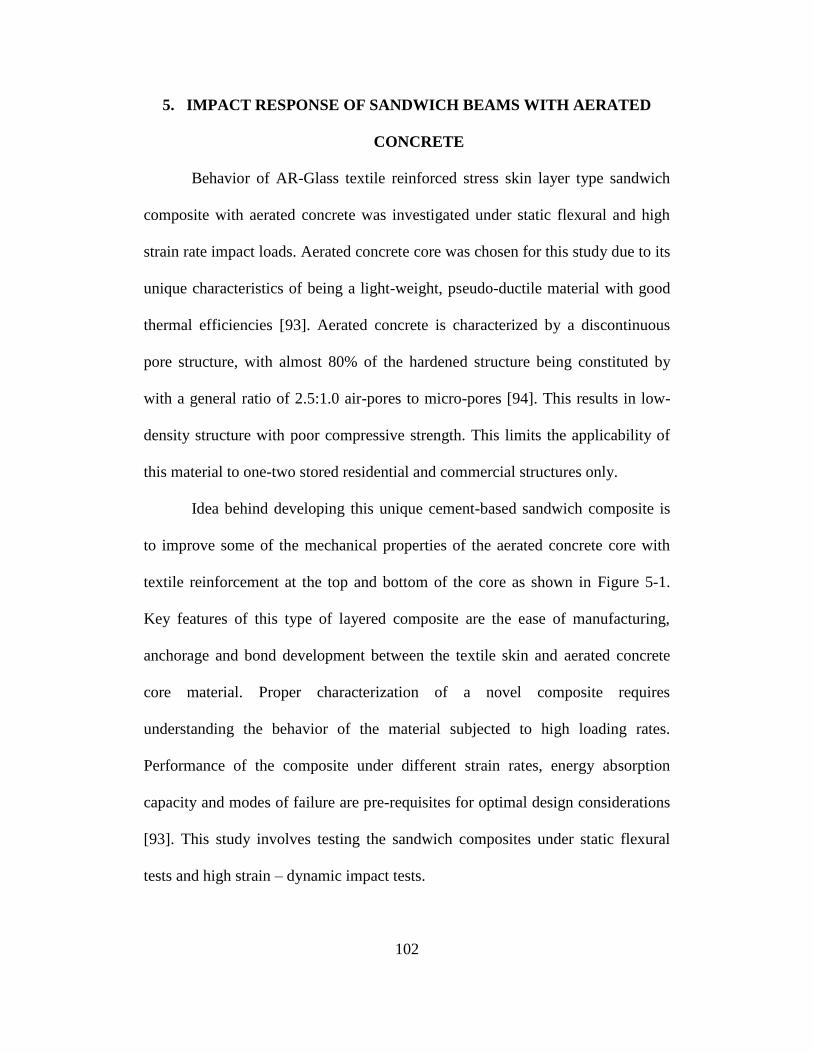
102
5. IMPACT RESPONSE OF SANDWICH BEAMS WITH AERATED
CONCRETE
Behavior of AR-Glass textile reinforced stress skin layer type sandwich
composite with aerated concrete was investigated under static flexural and high
strain rate impact loads. Aerated concrete core was chosen for this study due to its
unique characteristics of being a light-weight, pseudo-ductile material with good
thermal efficiencies [93]. Aerated concrete is characterized by a discontinuous
pore structure, with almost 80% of the hardened structure being constituted by
with a general ratio of 2.5:1.0 air-pores to micro-pores [94]. This results in low-
density structure with poor compressive strength. This limits the applicability of
this material to one-two stored residential and commercial structures only.
Idea behind developing this unique cement-based sandwich composite is
to improve some of the mechanical properties of the aerated concrete core with
textile reinforcement at the top and bottom of the core as shown in Figure 5-1.
Key features of this type of layered composite are the ease of manufacturing,
anchorage and bond development between the textile skin and aerated concrete
core material. Proper characterization of a novel composite requires
understanding the behavior of the material subjected to high loading rates.
Performance of the composite under different strain rates, energy absorption
capacity and modes of failure are pre-requisites for optimal design considerations
[93]. This study involves testing the sandwich composites under static flexural
tests and high strain – dynamic impact tests.
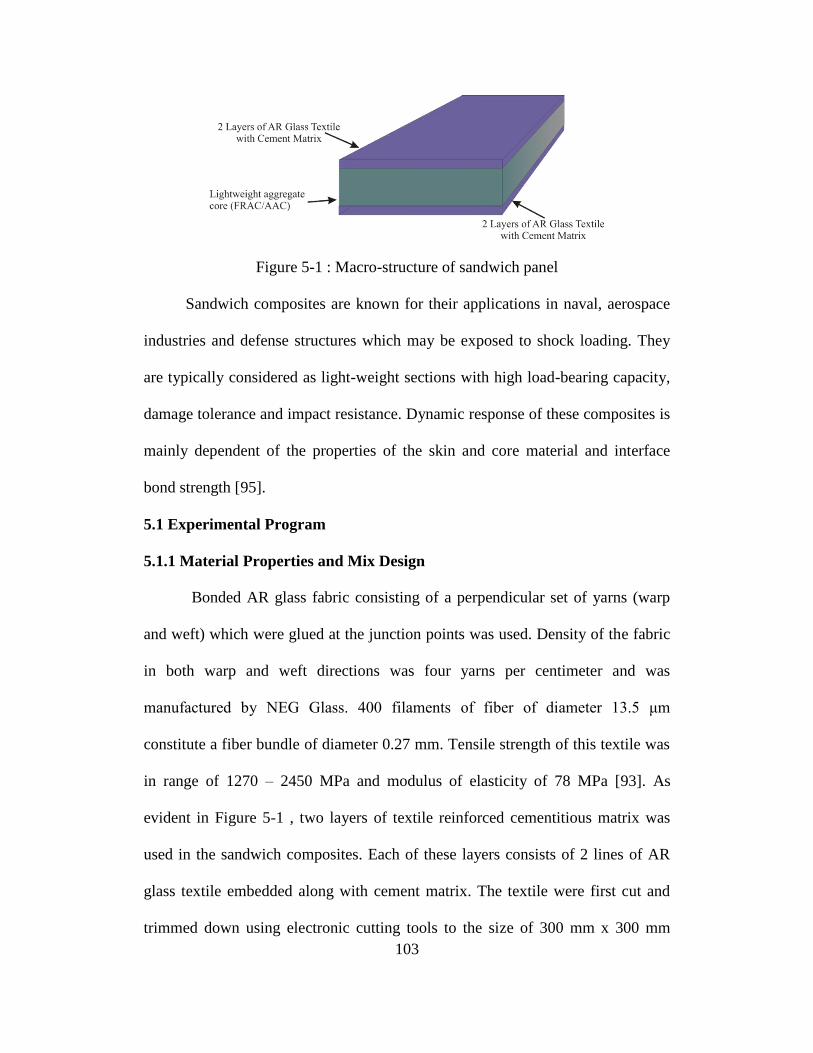
103
Figure 5-1 : Macro-structure of sandwich panel
Sandwich composites are known for their applications in naval, aerospace
industries and defense structures which may be exposed to shock loading. They
are typically considered as light-weight sections with high load-bearing capacity,
damage tolerance and impact resistance. Dynamic response of these composites is
mainly dependent of the properties of the skin and core material and interface
bond strength [95].
5.1 Experimental Program
5.1.1 Material Properties and Mix Design
Bonded AR glass fabric consisting of a perpendicular set of yarns (warp
and weft) which were glued at the junction points was used. Density of the fabric
in both warp and weft directions was four yarns per centimeter and was
manufactured by NEG Glass. 400 filaments of fiber of diameter 13.5 μm
constitute a fiber bundle of diameter 0.27 mm. Tensile strength of this textile was
in range of 1270 – 2450 MPa and modulus of elasticity of 78 MPa [93]. As
evident in Figure 5-1 , two layers of textile reinforced cementitious matrix was
used in the sandwich composites. Each of these layers consists of 2 lines of AR
glass textile embedded along with cement matrix. The textile were first cut and
trimmed down using electronic cutting tools to the size of 300 mm x 300 mm
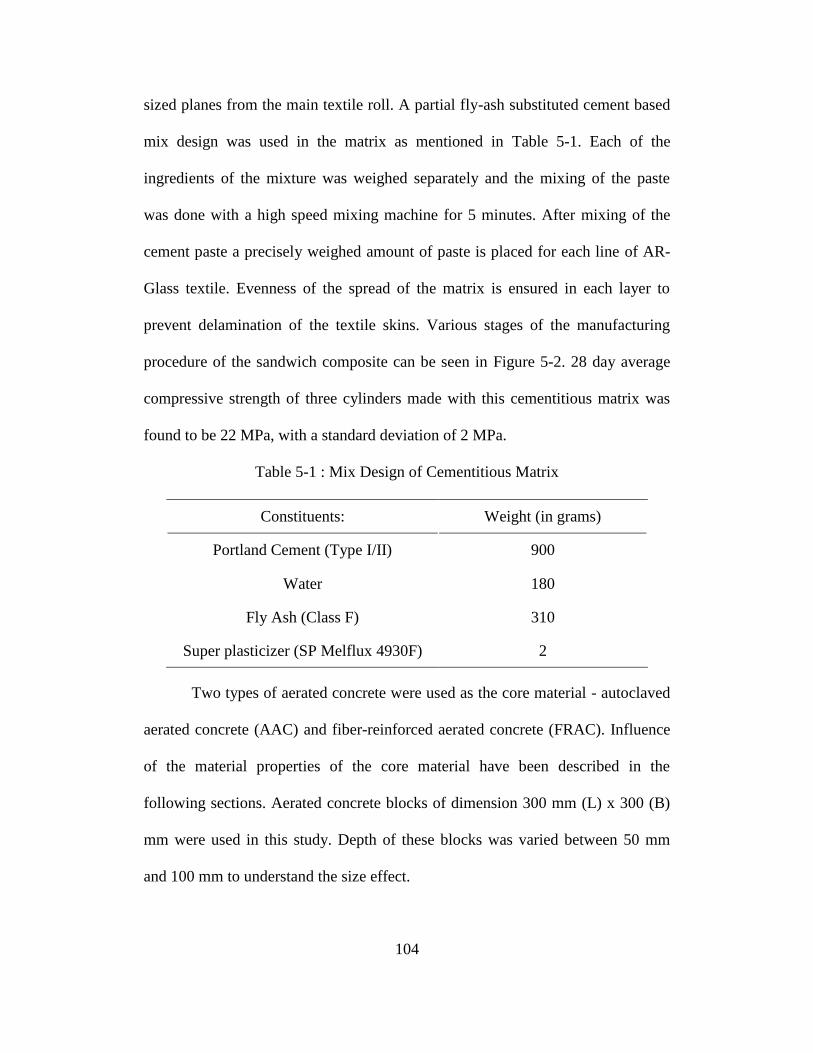
104
sized planes from the main textile roll. A partial fly-ash substituted cement based
mix design was used in the matrix as mentioned in Table 5-1. Each of the
ingredients of the mixture was weighed separately and the mixing of the paste
was done with a high speed mixing machine for 5 minutes. After mixing of the
cement paste a precisely weighed amount of paste is placed for each line of AR-
Glass textile. Evenness of the spread of the matrix is ensured in each layer to
prevent delamination of the textile skins. Various stages of the manufacturing
procedure of the sandwich composite can be seen in Figure 5-2. 28 day average
compressive strength of three cylinders made with this cementitious matrix was
found to be 22 MPa, with a standard deviation of 2 MPa.
Table 5-1 : Mix Design of Cementitious Matrix
Constituents: Weight (in grams)
Portland Cement (Type I/II) 900
Water 180
Fly Ash (Class F) 310
Super plasticizer (SP Melflux 4930F) 2
Two types of aerated concrete were used as the core material - autoclaved
aerated concrete (AAC) and fiber-reinforced aerated concrete (FRAC). Influence
of the material properties of the core material have been described in the
following sections. Aerated concrete blocks of dimension 300 mm (L) x 300 (B)
mm were used in this study. Depth of these blocks was varied between 50 mm
and 100 mm to understand the size effect.

105
Stage A Stage B
Stage C Stage D
Figure 5-2 : Fabrication process of sandwich composites
A mechanical punching machine was used to prevent delamination,
unsoundness of the system and ensure perfect bond between the interfaces. Post
manufacturing treatment consists of wrapping the sandwich panel with plastic
films, followed by curing inside temperature and moisture controlled chamber for
28 days. To maintain consistency in the curing conditions, temperature of the
chamber was maintained at 23 deg. C with 100 % relative humidity. After curing,
the panels were cut to proper dimensions using a mechanical saw. The outside
edges were trimmed out and rejected. Each of these panels was then further
trimmed down to five small beams of dimensions of 250 mm (L) x 50 mm (B).
106
The depth of the specimen was maintained as 50 mm and 100 mm, as mentioned
earlier. Dimensions and types of specimens investigated in this study have been
summarized in Table 5-2.
Table 5-2 : Testing Schematics
Designation of
Sandwich Specimens
Core
Material
Dimensions,
mm
(B x D x L)
SWFRAC A
FRAC 50 x 50 x 250 Square X-Sec.
B 50 x 100 x 250 Rectangle X-Sec.
SWAAC A
AAC 50 x 50 x 250 Square X-Sec.
B 50 x 100 x 250 Rectangle X-Sec.
5.1.2 Static Flexural Tests
Three point bending tests were performed using a servo-hydraulic MTS
machine with a load cell capacity of 222 KN under closed loop conditions. The
tests were run under cross-head displacement control at the rate of 1.3 mm/min.
Deflections at the mid-span were measured using a linear variable differential
transformer (LVDT). Test data recorded from the test includes deflection
(LVDT), bending load (load cell) and cross head displacement (actuator).
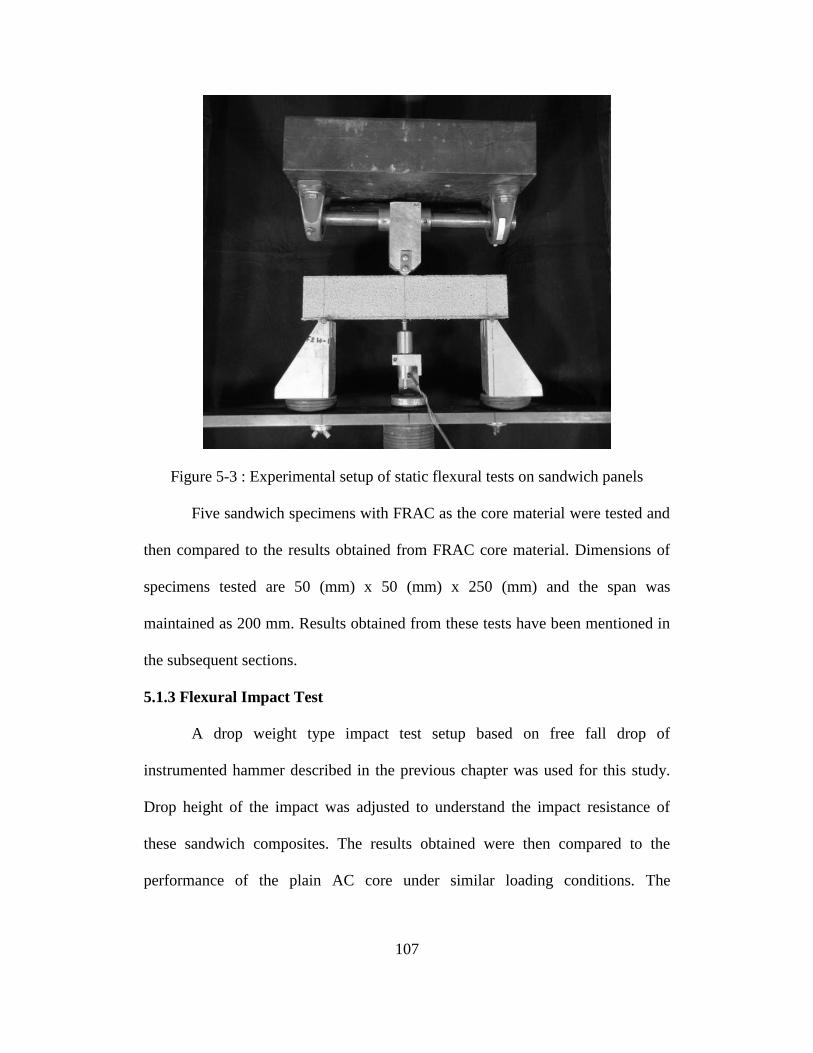
107
Figure 5-3 : Experimental setup of static flexural tests on sandwich panels
Five sandwich specimens with FRAC as the core material were tested and
then compared to the results obtained from FRAC core material. Dimensions of
specimens tested are 50 (mm) x 50 (mm) x 250 (mm) and the span was
maintained as 200 mm. Results obtained from these tests have been mentioned in
the subsequent sections.
5.1.3 Flexural Impact Test
A drop weight type impact test setup based on free fall drop of
instrumented hammer described in the previous chapter was used for this study.
Drop height of the impact was adjusted to understand the impact resistance of
these sandwich composites. The results obtained were then compared to the
performance of the plain AC core under similar loading conditions. The

108
experimental setup used in this study is shown in Figure 5-4. Impact response of
these composites, were recorded with a high-speed digital camera (Phantom v.7).
Figure 5-4 : Experimental setup of impact tests on sandwich panels
5.2 Discussion and Analysis
The experimental response of both static flexural and high speed impact
tests was analyzed using computer programs written using MATLAB. They were
used to smoothen and filter the raw data and calculate some experimental
parameters such as stress, stiff, toughness, etc. The code written for impact test
had an additional feature of reducing the experimental data based on user defined
selection of the actual range of impact. Figure 5-5 shows the analyzed response
obtained for the static tests conducted on five sandwich beams. Displacement of
the test specimens beyond working range of the LVDT, were recorded using the
actuator displacement of testing rig.

109
(a) (b)
Figure 5-5 : Replicates of SWFRAC tested under static load; (a) Deflection
(LVDT) vs. Load Response; (b) Displacement (Actuator) vs. Load Response
(a) (b)
Figure 5-6 : Replicates of SWFRAC tested under impact loading; (a)Drop height
of 25 mm; (b) Drop height of 150 mm
Replicates of sandwich beams (SWFRAC) tested at two different drop
heights (25 mm and 150 mm) of the impactor are shown in Figure 5-6. The effect
of textile reinforcement, influence of the core material, effect of drop height and
effect of specimen have been discussed in the subsequent sections.

110
5.2.1 Sandwich Effect
Static flexural tests were also conducted on core FRAC material under
displacement control rate of 0.4 mm/min. Five beams of FRAC material of
dimension 50 (mm) x 50 (mm) x 250 (mm) and the span was maintained as 200
mm. Results were then compared to the sandwich beams as shown in Figure 5-7.
Figure 5-7 : Comparison between FRAC and SWFRAC under static loads
Image sequence captured from the static flexural tests on FRAC-A and
SWFRAC-A has been shown in Figure 5-8 and Figure 5-9, respectively. Time, T
(min), deflection, δ (mm) and flexural strength, σ (MPa) have been presented
sequentially. Fiber bridging action of plain FRAC core specimens under flexural
loads is clearly evident in Figure 5-11. This explains the pseudo-ductile response
of this material and influences the energy absorption properties of this material.
Also evident is the enhancement in flexural strength from 0.5 MPa for plain
FRAC specimen to 2.9 MPa for sandwich specimen. Deformation capacity also
doubles due to the textile reinforcement on the aerated concrete core.

111
Stage A Stage B Stage C
[T = 0 δ = 0 σ = 0] [T = 7 δ = 1.9 σ = 0.6] [T = 14 δ = 4.5 σ = 0.5]
Figure 5-8 : FRAC-A specimen under static flexural loading
Stage A Stage B Stage C
[T = 0 δ = 0 σ = 0] [T = 7 δ = 4.1 σ = 3.4] [T = 14 δ = 9.4 σ = 2.9]
Figure 5-9 : SWFRAC-A specimen under static flexural loading
Impact tests were conducted on sandwich beams with FRAC and AAC as
the core at three different drop heights 25 mm, 75 mm, and 150 mm. Results
obtained were again compared with the impact tests done on the core material.
Depth of the specimens used for this comparisons were maintained as 50 mm.
Figure 5-10 summarizes the impact resistance of the sandwich beams (dots only)
and plain core beams (solid line). Effect of textile is clearly evident in terms of
load carrying and deflection capacity. With the increase in the peak load response,
flexural strength of the sandwich beams also increases to almost 3 times, when
compared to the plain core material. The presence of textile reinforcement also
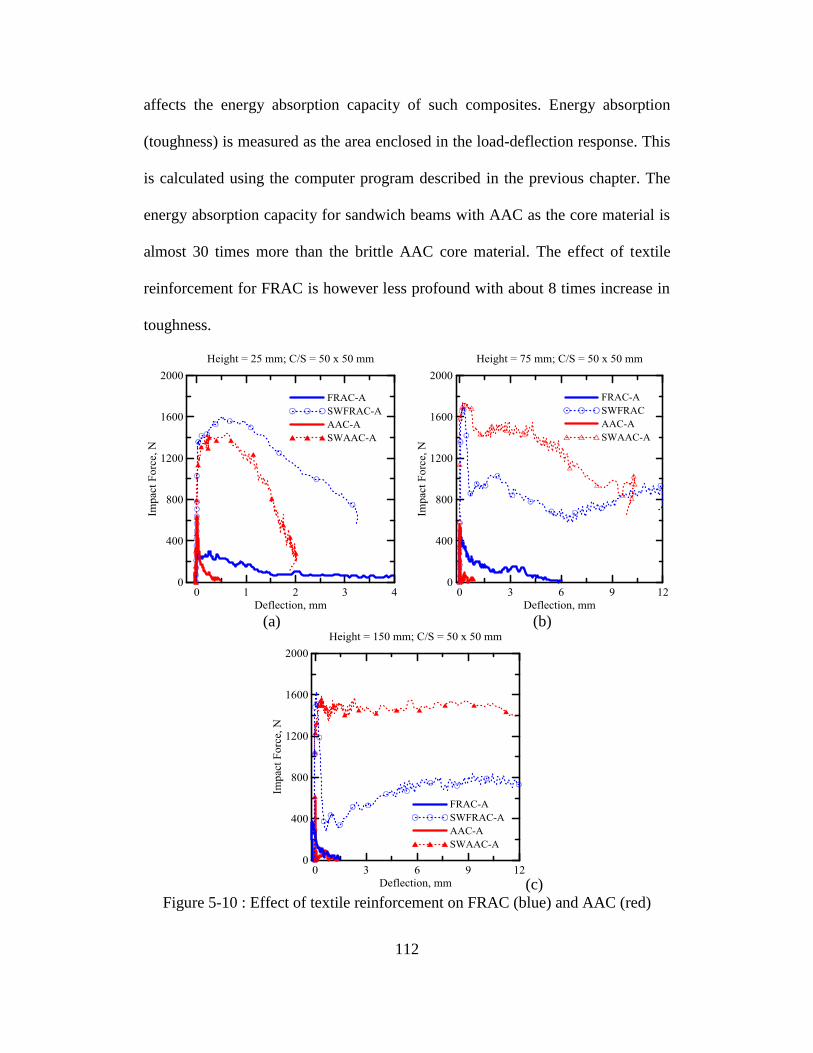
112
affects the energy absorption capacity of such composites. Energy absorption
(toughness) is measured as the area enclosed in the load-deflection response. This
is calculated using the computer program described in the previous chapter. The
energy absorption capacity for sandwich beams with AAC as the core material is
almost 30 times more than the brittle AAC core material. The effect of textile
reinforcement for FRAC is however less profound with about 8 times increase in
toughness.
(a) (b)
(c)
Figure 5-10 : Effect of textile reinforcement on FRAC (blue) and AAC (red)
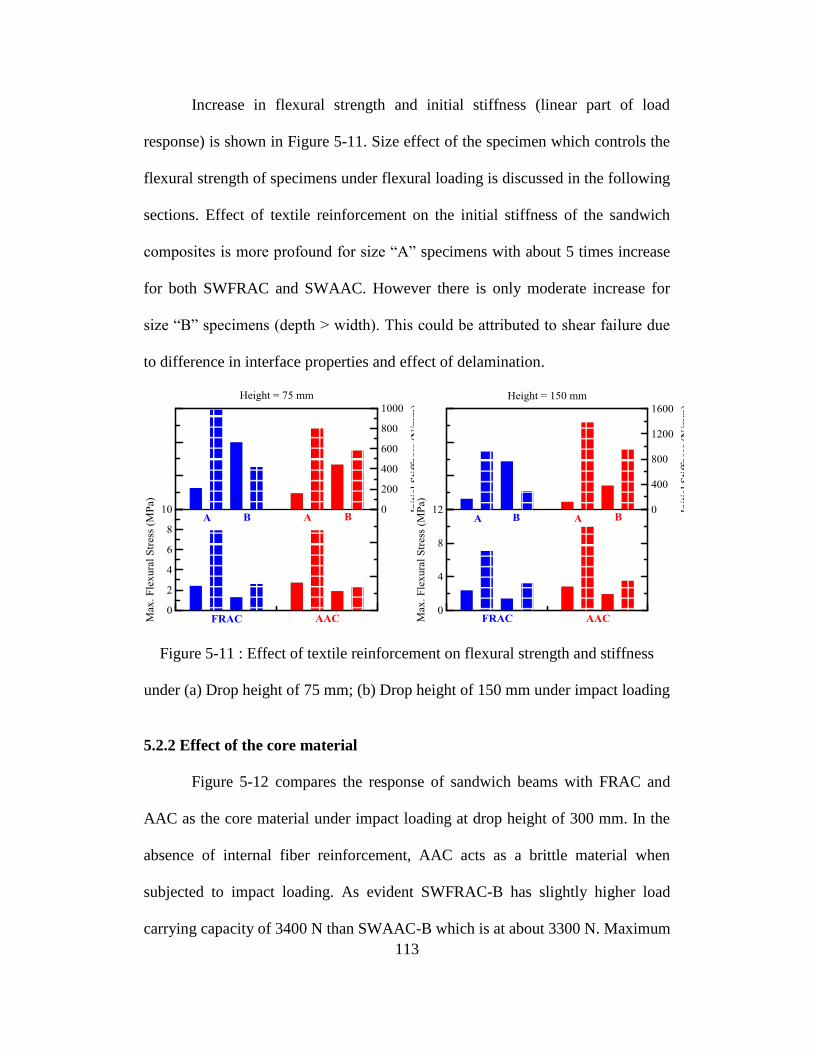
113
Increase in flexural strength and initial stiffness (linear part of load
response) is shown in Figure 5-11. Size effect of the specimen which controls the
flexural strength of specimens under flexural loading is discussed in the following
sections. Effect of textile reinforcement on the initial stiffness of the sandwich
composites is more profound for size “A” specimens with about 5 times increase
for both SWFRAC and SWAAC. However there is only moderate increase for
size “B” specimens (depth > width). This could be attributed to shear failure due
to difference in interface properties and effect of delamination.
Figure 5-11 : Effect of textile reinforcement on flexural strength and stiffness
under (a) Drop height of 75 mm; (b) Drop height of 150 mm under impact loading
5.2.2 Effect of the core material
Figure 5-12 compares the response of sandwich beams with FRAC and
AAC as the core material under impact loading at drop height of 300 mm. In the
absence of internal fiber reinforcement, AAC acts as a brittle material when
subjected to impact loading. As evident SWFRAC-B has slightly higher load
carrying capacity of 3400 N than SWAAC-B which is at about 3300 N. Maximum

114
flexural strength of SWFRAC-B at a drop height of 300 mm is 4 MPa, whereas
for SWAAC-B it is 3.7 MPa. Initial stiffness (about 1900 N/mm) and deformation
capacity (about 18 mm) is similar for both of these sandwich composites. Also as
clearly evident, energy absorption (toughness) of SWFRAC-B (25 J) is higher
than SWAAC-B (20 J) at the same input potential energy of 42 J.
Figure 5-12 : SWFRAC (blue) versus SWAAC(red(; (a) Impact force versus
deflection; (b) Flexural Strength versus deflection
a
b
c
SWFRAC-A SWAAC-A
Figure 5-13 : Crack propagation of SWFRAC-A and SWAAC-A under different
heights of the impactor; (a) 25 mm; (b) 75 mm; (c) 150 mm
115
Propagation of cracks under impact loading on sandwich beams can be
seen in Figure 5-13. Presence of polymeric fibers in FRAC core materials helps in
controlling the crack propagation through fiber bridging action, as previously
demonstrated. Innate brittleness of the AAC material dictates the distributed
cracking mechanism as seen in sandwich beams with AAC as the core material.
As expected damage caused due to sudden drop of the impactor is much less at
smaller drop heights of 25 mm. The crack width and crack intensity can be easily
distinguished at higher drop heights of 75 mm and 150 mm of the impact head. At
this point, it is also important to understand the effect of the drop height of the
hammer on the impact response of these composites.
5.2.3 Effect of drop height of the impactor
Figure 5-14 summarizes the responses of both types of sandwich beams at
four different drop heights. There is an insignificant difference in the maximum
load carrying capacity (about 1500 N) for size “A” sandwich beams at drop
heights of 25 mm (red), 75 mm (blue) and 150 mm (green). Larger cross-section
beams (size “B”) beams are expected to have more load carrying capacity hence
their performance was also evaluated at an additional drop height of 300 mm
(purple). As evident, effect of drop height is more pronounced for the size “B”
beams with a rectangular cross-section. For SWAAC-B beams, peak load
increases from 2250 N (75mm) to 2620 N (150 mm) and to 2920 N (300 mm).
Whereas for SWAAC-A which show slightly more impact resistance, load
increase from 2250 N to 2950 N and shows peak load of 3430 N at 300 mm drop.
Deformation capacity and energy absorption capacity of all sandwich beams also
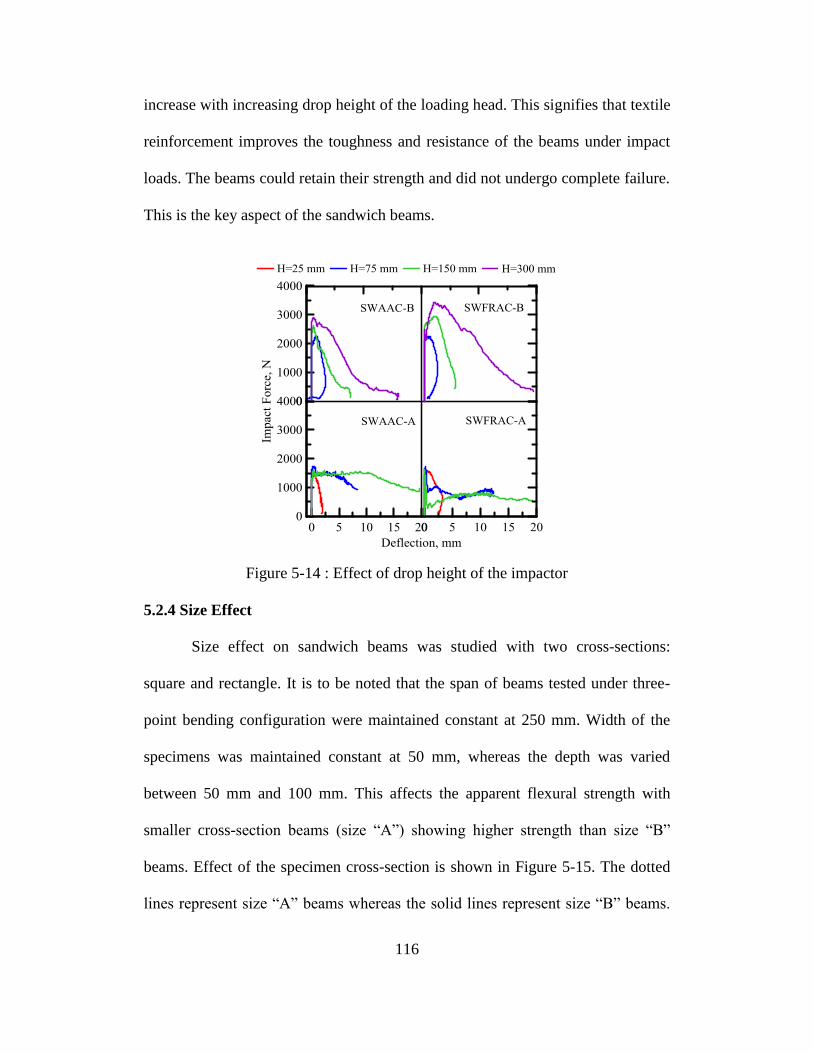
116
increase with increasing drop height of the loading head. This signifies that textile
reinforcement improves the toughness and resistance of the beams under impact
loads. The beams could retain their strength and did not undergo complete failure.
This is the key aspect of the sandwich beams.
Figure 5-14 : Effect of drop height of the impactor
5.2.4 Size Effect
Size effect on sandwich beams was studied with two cross-sections:
square and rectangle. It is to be noted that the span of beams tested under three-
point bending configuration were maintained constant at 250 mm. Width of the
specimens was maintained constant at 50 mm, whereas the depth was varied
between 50 mm and 100 mm. This affects the apparent flexural strength with
smaller cross-section beams (size “A”) showing higher strength than size “B”
beams. Effect of the specimen cross-section is shown in Figure 5-15. The dotted
lines represent size “A” beams whereas the solid lines represent size “B” beams.

117
The results were summarized for two different drop heights 75 mm and 150 mm
and shown. Maximum average flexural strength of SWFRAC-A beams was 7.9
MPa at drop height of 75 mm; whereas for SWFRAC-B it was only 3.2 MPa at a
drop height of 150 mm. Similarly for SWAAC-A beams, maximum average
strength was 9.9 MPa and 3.5 MPa for SWAAC-B at a drop height of 150 mm.
Figure 5-15 : Size effect on SWFRAC (blue) and SWAAC (red) beams
5.2.5 Energy Absorption
Energy response of the sandwich beams were compared to the tests results
of the core material at similar drop heights. Energy absorbed is measured via two
parameters – toughness (Uk) which is the area enclosed within the load-deflection
curve and a normalized parameter, β (Uk/Ui). Parameter, β is the ratio between the
energy absorbed by the specimen during an impact event (Uk) and the potential
energy of the impact (Ui). Potential (input) energy is controlled by the height and
weight of the dropping mass. Loss of energy due to friction is neglected, as
frictionless bearings and drop columns used as a part of impact test setup controls
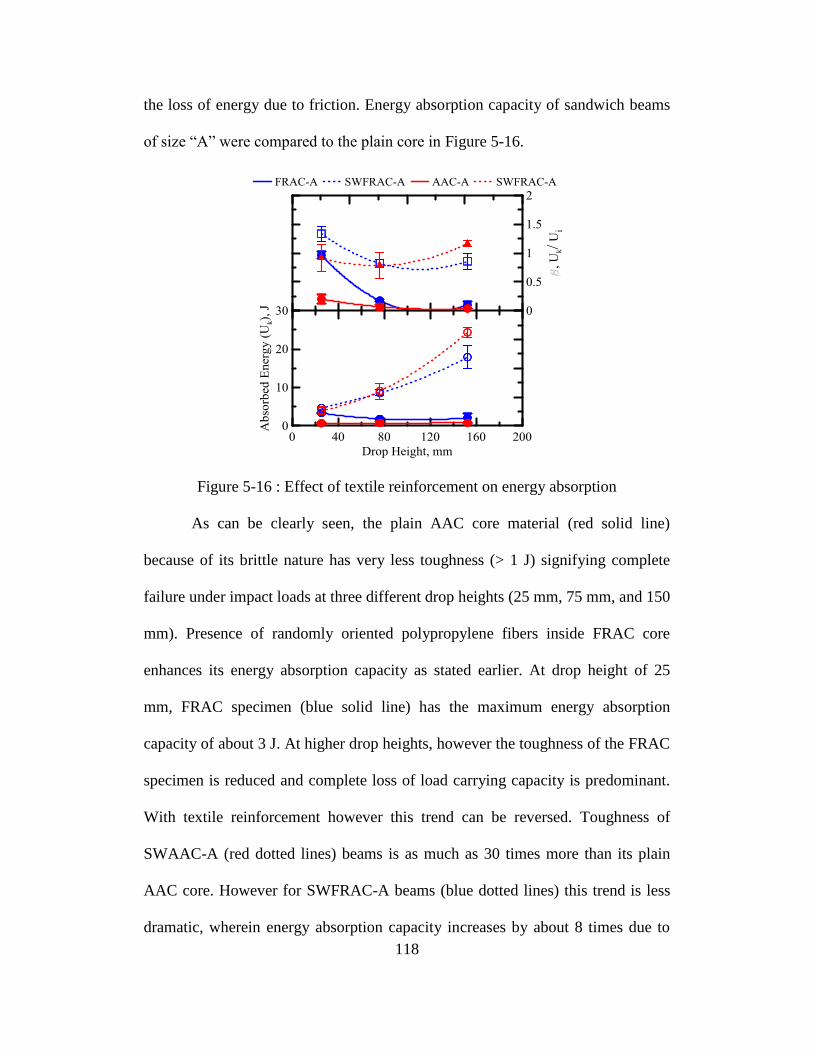
118
the loss of energy due to friction. Energy absorption capacity of sandwich beams
of size “A” were compared to the plain core in Figure 5-16.
Figure 5-16 : Effect of textile reinforcement on energy absorption
As can be clearly seen, the plain AAC core material (red solid line)
because of its brittle nature has very less toughness (> 1 J) signifying complete
failure under impact loads at three different drop heights (25 mm, 75 mm, and 150
mm). Presence of randomly oriented polypropylene fibers inside FRAC core
enhances its energy absorption capacity as stated earlier. At drop height of 25
mm, FRAC specimen (blue solid line) has the maximum energy absorption
capacity of about 3 J. At higher drop heights, however the toughness of the FRAC
specimen is reduced and complete loss of load carrying capacity is predominant.
With textile reinforcement however this trend can be reversed. Toughness of
SWAAC-A (red dotted lines) beams is as much as 30 times more than its plain
AAC core. However for SWFRAC-A beams (blue dotted lines) this trend is less
dramatic, wherein energy absorption capacity increases by about 8 times due to

119
the presence of textile layers. It is to be noted that maximum toughness of the
sandwich beams were observed at drop height of 150 mm, with SWAAC-A
having an average toughness value of 24 J; and SWFRAC-A has an average
toughness of 18 J.
5.3 Crack Propagation
Cracks pattern of sandwich beams with FRAC core under static flexure
loading can be seen in Figure 5-17. Bottom view of the specimen is shown in part
(a) of the figure wherein the flexural cracks at the bottom TRC layer can be
clearly seen. A side view of the sandwich is shown in part (b), wherein diagonal
tension cracks and shear cracks can be seen emanating from the region near the
bottom supports. The top textile layer of the composite is characterized by
compression failure under the loading head. Part (c) shows the magnified side
view image of the sandwich panels captured using a microscopic camera.
Diagonal tension cracks are clearly evident. Effects of fiber pullout in the core
and de-lamination of the top TRC layer can also be observed.
a
b c
Figure 5-17 : Crack propagation of SWFRAC beams under static load
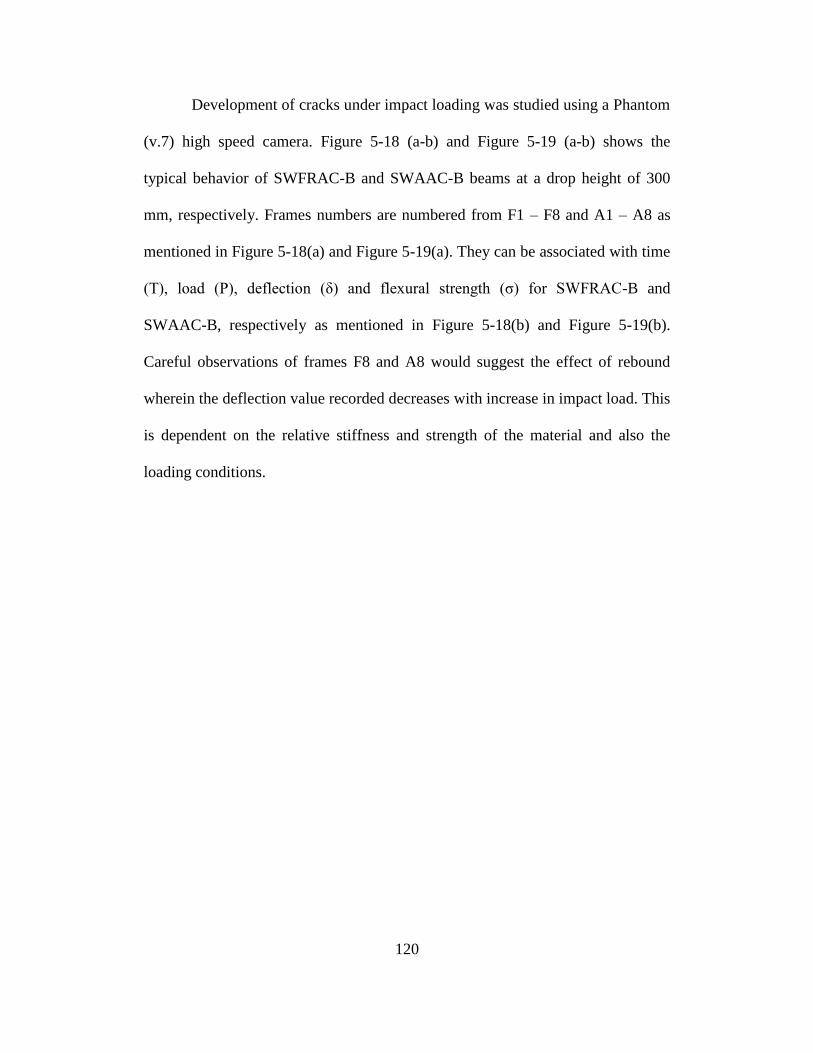
120
Development of cracks under impact loading was studied using a Phantom
(v.7) high speed camera. Figure 5-18 (a-b) and Figure 5-19 (a-b) shows the
typical behavior of SWFRAC-B and SWAAC-B beams at a drop height of 300
mm, respectively. Frames numbers are numbered from F1 – F8 and A1 – A8 as
mentioned in Figure 5-18(a) and Figure 5-19(a). They can be associated with time
(T), load (P), deflection (δ) and flexural strength (σ) for SWFRAC-B and
SWAAC-B, respectively as mentioned in Figure 5-18(b) and Figure 5-19(b).
Careful observations of frames F8 and A8 would suggest the effect of rebound
wherein the deflection value recorded decreases with increase in impact load. This
is dependent on the relative stiffness and strength of the material and also the
loading conditions.
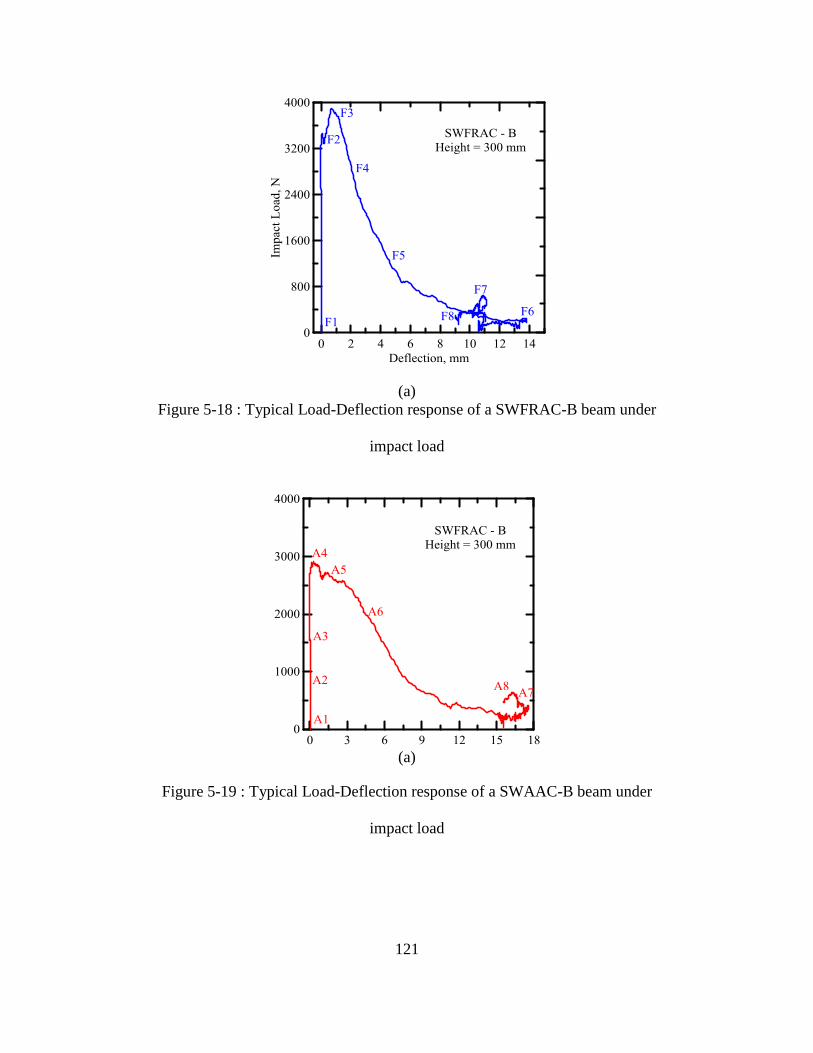
121
(a)
Figure 5-18 : Typical Load-Deflection response of a SWFRAC-B beam under
impact load
(a)
Figure 5-19 : Typical Load-Deflection response of a SWAAC-B beam under
impact load

122
F1 F2 F3 F4
T = 0 μsec P = 0 N T = 3480 μsec P = 3431 N T = 6590 μsec P = 3899 N T = 8700 μsec P = 2933 N
δ = - 0.04 mm σ = 0 MPa δ = 0.04 mm σ = 4.0 MPa δ = 0.71 mm σ = 4.55 MPa δ = 1.98 mm σ = 3.42 MPa
F5 F6 F7 F8
T = 11020 μsec P = 1295 N T = 18550
μsec
P = 203 N T = 59720
μsec
P = 640 N T = 70740
μsec
P = 187 N
δ = 4.43 mm σ = 1.51 MPa δ = 13.43 mm σ = 0.26 MPa δ = 10.86 mm σ = 0.75 MPa δ = 9.23 mm σ = 0.22 MPa
Figure 5-18 (b) : Crack propagation of SWFRAC-B beam under impact loading (Drop Height = 300 mm)

123
A1 A2 A3 A4
T = 0 μsec P = 0 N T = 1060 μsec P = 856 N T = 2160 μsec P = 1648 N T = 5260 μsec P = 2916 N
δ = 0.06 mm σ = 0 MPa δ = 0.03 mm σ = 0.94
MPa
δ = -0.003 mm σ = 1.81
MPa
δ = 0.71 mm σ = 4.55 MPa
A5 A6 A7 A8
T = 8560 μsec P = 2588 N T = 11260 μsec P = 1904 N T = 18110 μsec P = 360 N T = 61610 μsec P = 640 N
δ = 1.98 mm σ = 2.84
MPa
δ = 4.84 mm σ = 2.09
MPa
δ = 17.28 mm σ = 0.40
MPa
δ = 16.32 mm σ = 0.70 MPa
Figure 5-19 (b) : Crack propagation of SWAAC-B beam under impact loading (Drop Height = 300 mm)

124
Table 5-3 : Results of the impact tests conducted on the sandwich beams
Material
Drop
Height
Velocity-
Hammer
Velocity-
Specimen
Strain
Rate Impulse
Max
Impact
Force
Max
Flex.
Stress
Max
Defl.
Defl. at
Max
Force
Potential
Energy
Absorbed
Energy
Initial
Rigidity
mm mm/sec mm/sec sec-1
N-sec N MPa mm mm N-mm N-mm N/mm
SWFRAC-
A
25.4 706 13.8 0.05 28.8 1566 6.7 3.80 1.57 3479 4651 177
(9.3) (0.03) (2.7) (114) (0.6) (0.58) (0.73)
(885) (113)
76.2 1223 76 0.85 33.1 1900 7.9 11.20 0.34 10437 8570 985
(53) (0.59) (11.3) (186) (0.7) (4.45) (0.26)
(1557) (225)
152.4 1729 847 18.76 21.6 1694 7.1 19.42 0.04 20875 17901 919
(134) (2.97) (5.1) (178) (0.7) (0.07) (0.05)
(5955) (76)
SWAAC-
A
25.4 706 8 0.03 31.6 1645 6.9 3.08 1.24 3479 3979 349
(8) (0.03) (13.3) (180) (1.0) (1.46) (0.85)
(2186) (237)
76.2 1223 256 2.83 30.5 1859 7.9 13.88 0.39 10437 9046 799
(416) (4.60) (18.3) (369) (1.6) (5.91) (0.28)
(4112) (225)
152.4 1729 49 1.10 41.5 2233 9.9 15.74 2.46 20875 24338 1382
(24) (0.53) (6.2) (413) (2.0) (2.77) (1.58)
2498 410
SWFRAC-
B
76.2 1223 14 0.15 41.0 2340 2.6 4.18 1.32 10437 8010 419
(12) (0.13) (6.5) (262) (0.3) (1.56) (1.47)
(2458) (207)
152.4 1729 23 0.50 38.1 2902 3.2 5.50 1.79 20875 12293 294
(5) (0.10) (5.3) (69) (0.1) (0.65) (0.14)
(2289) (64)
304.8 2445 68 3.03 52.4 3442 3.9 17.53 1.53 41750 25113 1805
(80) (3.57) (17.8) (452) (0.7) (3.22) (0.71)
(10338) (112)
SWAAC-
B
76.2 1223 12 0.13 29.4 2288 2.3 3.12 1.06 10437 5794 581
(2) (0.02) (1.5) (175) (0.2) (0.43) (0.20)
(423) (450)
152.4 1729 34 0.75 39.2 3016 3.5 7.62 0.82 20875 10005 961
(33) (0.73) (26.0) (405) (0.5) (2.09) (0.55)
(2129) (698)
304.8 2445 66 2.92 57.8 3280 3.7 18.15 0.67 41750 19991 1975
(24) (1.05) (10.0) (352) (0.4) (1.39) (0.73)
(6997) (452)

125
Table 5-4 : Results of the static tests conducted on the sandwich beams
Material Absorbed
Energy Rigidity
PEL
Load
PEL
Defl.
Max
Load
Max
Stress
Defl. at
Max
Force
Max
Displ.
N-mm N/mm N mm N MPa mm mm
FRAC-A
840 1099 121 0.14 378 0.88 0.3 6.3
(390) (190) (6) (0.06) (73) (0.18) (0.1) (1.9)
SWFRAC-A
15229 1953 434 0.22 1680 3.54 2.2 13.3
(4894) (364) (103) (0.10) (147) (0.28) (1.0) (2.2)
Results obtained from the analysis of impact tests on sandwich beams with
FRAC and AAC as the core have been presented in Table 5-3. Average and
standard deviations (within brackets) have been reported in subsequent rows.
Similar to the previous chapter, only apparent (total) toughness and deformation
capacity has been reported. Test results from the static flexural tests conducted on
FRAC-A and SWFRAC-A are shown in Table 5-4.
5.4 Conclusion
Static flexural and high strain impact tests were conducted on an
innovative sandwich composite with aerated concrete as the core material and
textile reinforced cementitious layer as boundary reinforcement. It was found that
textile reinforcement improves the load carrying and energy absorption capacity
along with deformation capacity and stiffness. This contributes to vast
improvement in impact resistance under high strain dynamic loads. Effects of
material properties of the core material, size effect of specimen and drop height of

126
impactor were studied in detail. Considering the ease of manufacturing, this type
of a composite can be a solution to increase the structural strength of the
lightweight aerated concrete core. This type of composite could find its
application as structural members such as pre-fabricated building envelope
systems.
127
REFERENCES
1. Mobasher, B., “Mechanics of Fiber and Textile Reinforced Cement
Composites”, CRC press, 2011, p. 480, ISBN: 9781439806609.
2. Bentur, A., Mindess, S., “Fibre Reinforced Cementitious Composites”,
Taylor & Francis, Second Edition, 2007, ISBN13: 978-0-415-25048-1
3. Balaguru, N., Perumalsamy, Shah, P., Surendra, “Fiber-Reinforced Cement
Composites”, Mc Graw-Hill, Inc., 1992, p. 6, ISBN: 0-07-056400-0
4. Naaman AE, Reinhardt HW., “Setting the stage: toward performance based
classification of FRC composites”. In: Proc of 4th Int workshop on High
Performance Fiber Reinforced Cement Composites (HPFRCC-4), Ann
Arbor, USA, June 15-18, 2003, p. 1–4.
5. Peled A, Mobasher, B. “Pultruded fabric-cement composites”. ACI
Materials Journal 2005;102(1):15-23.
6. Mobasher B, Peled A, Pahilajani J. “Distributed cracking and stiffness
degradation in fabric-cement composites.” Materials and Structures 2006;
39(287):317–331.
7. Mobasher, B., and Shah, S. P., “Test Parameters for Evaluating Toughness
of Glass-Fiber Reinforced Concrete Panels,” ACI Materials Journal, Vol.
86, No. 5, Sept-Oct. 1989, pp.448-458.
8. Shah, S.P., Ludirdja, D., Daniel, J.I., and Mobasher, B., “Toughness –
Durability of Glass Fiber Reinforced Concrete Systems,” ACI Material
Journal, Vol. 85, No. 5, Sep. 1988, pp. 352-360.
9. Soroushian, P., Tlili, A., Yohena, M., and Tilsen, B.L., “Durability
Characteristics of Polymer-Modified Glass Fiber Reinforced Concrete,”
ACI Material Journal, Vol. 90, No. 1, Jan-Feb. 1993, pp. 40-49.
10. Litherland, K.L., Oakley, D.R., and Proctor, B.A., “The Use of Accelerated
Aging Procedures to Predict the Long Term Strength of GRC Composites,”
Cement and Concrete Research, Vol. 11, No. 3, May 1981, pp. 455-466.
11. Cockram, D.R., Litherland, K.L., Proctor, B.A., and Yale, B., “Assessing the
Durability of Glass Compositions,” Research and Development Laboratories
of Pikington Brothers PLC, Lancashire, Glastech. Ber. 1983, 56 (Int.
Glaskongr, 13th
, band 1), pp. 644-649.

128
12. Proctor, B.A., Oakley, D.R., and Litherland, K.L., “Developments in the
Assessment and Performance of GRC Over 10 Years,” Composites
(Guildford), Apr. 1982, pp. 173-180.
13. Proctor, B.A., “Past Development and Future Prospect for GRC Materials,”
Proceedings, International Congress on Glass Fibre Reinforced Cement
(Paris, Nov. 1981), The Glass Fibre Reinforced Cement Association,
Gerrards Cross, pp. 50-67.
14. Soranakom, C., and Mobasher, B., “Correlation of Tensile and Flexural
Responses of Strain Softening and Strain Hardening Cement Composites,”
Cement and Concrete Composites, (in press Jan, 2008).
15. Soranakom, C., and Mobasher, B., “Flexural Modeling of Strain Softening
and Strain Hardening Fiber Reinforced Concrete,” Proceeding of the Fifth
International RILEM Workshop, High Performance Fiber Reinforced
Cement Composites (HPFRCC5), Mainz, Germany, July 2007, pp. 155-164.
16. Naaman, A. E., and Reinhardt H. W., “Proposed Classification of HPFRC
Composites Based on Their Tensile Response”, Materials and Structures,
Vol. 39, June 2006, pp. 547–555.
17. Cohen, Z., Peled, A., Mobasher, B.,Janetzko,S.,Gries,T., “Hybrid Cement-
Based Composites: Dynamic and Static tensile behaviors”, BEFIB2012 –
Fiber reinforced concrete Joaquim Barros et al., UM, Guimarães.
18. Soranakom C, Mobasher B. Correlation of tensile and flexural response of
strain softening and strain hardening cement composites. CemConcr
Compos, 2008;30:465-477.
19. Mobasher, B., Barsby, C., “Flexural design of strain hardening cement
composites”, BEFIB2012 – Fiber reinforced concrete Joaquim Barros et al.,
UM, Guimarães.
20. Sueki, S., Soranakom, C., Peled, A., and Mobasher, B. (2007), “Pullout–slip
response of fabrics embedded in a cement paste matrix,” Journal of
Materials in Civil Engineering, 19, 9.
21. Soranakom C, Mobasher B. Closed-form moment-curvature expressions for
homogenized fiber reinforced concrete. ACI Material Journal 2007;
104(4):351-9
22. Soranakom C, Mobasher B. Closed form solutions for flexural response of
fiber reinforced concrete beams. Journal of Engineering Mechanics
2007;133(8):933-41.

129
23. Ulfkjaer, J.P., Krenk, S., Brincker, R.,“Analytical Model for Fictitious
Crack Propagation in Concrete Beams,” Journal of Engineering Mechanics,
Vol. 121, No.1, 1995, pp.7-15.
24. Olesen, JF., “Fictitious Crack Propagation in Fiber-Reinforced Concrete
Beams,” Journal of Engineering Mechanics, Vol. 127, No. 3, March 2001,
pp. 272-80.
25. Marikunte, S., and Aldea, C., and Shah, S.P., “Durability of Glass Fiber
Reinforced Cement Composites: Effect of Silica Fume and Metakaolin,”
Advanced Cement Based Materials, Vol. 5, No. 3-4, Apr-May 1997, pp.
100-108.
26. Litherland, K.L., Oakley, D.R. and Proctor, B.A., The use of accelerated
aging procedures to predict the long term strength of GRC composites,
Cement and Concrete Research, vol. 11, pp. 455-466, 1981.
27. Majumdar, A.J and Laws, V., Glass fibre reinforced cement, Oxford BSP
Professional Books, 1991, p. 197.
28. Aindow, A.J., Oakley, D.R. and Proctor, B.A., Comparison of the
weathering behavior of GRC with predictions made from accelerated aging
tests, Cement and Concrete Research, vol. 14, pp. 271-274, 1984.
29. Litherland, K.L. , Test methods for evaluating the long term behavior of
GFRC, Proceedings - Durability of Glass Fiber Reinforced Concrete
Symposium organized by PCI, ed. S. Diamond, November 12-15, 1985,
Chicago , ed. S. Diamond, 1986, pp. 210-221.
30. Proctor, B.A., Oakley, D.R. and Litherland, K.L., Developments in the
assessment and performance of GRC over 10 years, Composites, vol. 13,
1982, pp. 173-179.
31. Bentur, A. and Diamond, S., Fracture of glass fiber reinforced cement,
Cement and Concrete Research, vol. 14, pp. 31-34, 1984.
32. Bentur, A., Mechanisms of potential embrittlement and strength loss of glass
fiber reinforced cement composites, Proceedings - Durability of Glass Fiber
Reinforced Concrete Symposium organized by PCI, Concrete Symposium
organized by PCI, November 12-15, 1985, Chicago , ed. S. Diamond, 1986,
pp. 109-123.
33. Shah, S. P., Ludirdja, D., Daniel J. I., Mobasher, B.,"Toughness-Durability
of Glass Fiber Reinforced Concrete Systems", ACI Materials Journal, Sept-
Oct. 1988, pp. 352-360. Discussion, 85-M39, ACI Materials Journal, July-
Aug. 1989, p 425.

130
34. Mobasher, B., and Shah, S. P.,"Test Parameters in Toughness Evaluation of
Glass Fiber Reinforced Concrete Panels", ACI Materials Journal, Sept-Oct.
1989, pp. 448-458.
35. Kumar, A. and Roy, D.M., Microstructure of glass fiber/cement paste
interface in admixture blended Portland cement samples, Proceedings -
Durability of Glass Fiber Reinforced Concrete Symposium organized by
PCI, November 12-15, 1985, Chicago , ed. S. Diamond, 1986, pp. 147-156.
36. Leonard, S. and Bentur, A., Improvement of the durability of glass fiber
reinforced cement using blended cement matrix, Cem. and Conc Res., vol.
14, pp. 717-728, 1984.
37. Litherland, K.L. and Proctor, B.A., The effect of matrix formulation, fiber
content and fiber composition on the durability of glass fiber reinforced
cement, Proceedings - Durability of Glass Fiber Reinforced Concrete
Symposium organized by PCI, November 12-15, 1985, Chicago , ed. S.
Diamond, 1986, pp. 124-135.
38. Purnell, P., Short, N.R., Page, C.L., Majumdar, A.J., Walton, P.L.,
Accelerated ageing characteristics of glass-fiber reinforced cement made
with new cementitious matrices, Composites A, vol. 30, 1999, pp. 1073-80.
39. Zhu, W., Bartos, P.J.M., Assessment of interfacial microstructure and bond
properties in aged GRC using a novel micro indentation method, Cement
and Concrete Research, Vol. 27, No. 11, 1997, pp. 1701-1711.
40. Orlowsky, J., Raupach, M., Cuypers, H and Wastiels, J., Durability
modeling of glass fiber reinforcement in cementitious environment,
Materials and Structures vol. 38, March 2005, pp. 155-162.
41. Marikunte, S., Aldea, C. and Shah, S., Durability of glass fiber reinforced
cement composites: effect of silica fume and metakaolin, Journal of
Advanced Cement Based Composites, vol. 5, 1997, pp. 100-108.
42. Beddows, J. and Purnell, P., Durability of new matrix glass fiber reinforced
concrete, GRC 2003 Proceedings of 12th Congress of the GRCA, October
2003, Barcelona, Spain, eds. J.N. Clarke and R. Ferry, paper 16.
43. Purnell, P. and Beddows, J., Durability and simulated ageing of new matrix
glass fiber reinforced concrete, Cement and Concrete Composites, vol. 27,
issues 9-10, October-November 2005, pp. 875-884.
44. Bijen, J., A survey of mew developments in glass composition, coatings and
matrices to extend service life of GFRC, Proceedings - Durability of Glass

131
Fiber Reinforced Concrete Symposium organized by PCI, November 12-15,
1985, Chicago , ed. S. Diamond, 1986, pp. 251-269.
45. Bijen, J., Durability of some glass fiber reinforced cement composites, ACI
Materials Journal, July-August, 1983, pp. 304-311.
46. Ball, H., Durability of naturally aged, GFRC mixes containing Forton
Polymer and SEM analysis of the facture interface, GRC 2003 Proceedings
of 12th Congress of the GRCA, October 2003, Barcelona, Spain, eds. J.N.
Clarke and R. Ferry.
47. Qi, C., Tianyou, B., A review of the development of the GRC industry in
China, GRC 2003 Proceedings of 12th Congress of the GRCA, October
2003, Barcelona, Spain, eds. J.N. Clarke and R. Ferry, paper 37.
48. Ambroise, J. and Péra, J., Durability of glass-fiber cement composites:
comparison between normal, Portland and calcium sulphoaluminate
cements, Proceedings Composites in Construction 2005 - Third International
Conference, Lyon, July 11-13, 2005, pp. 1197-1204.
49. Litherland, K.L., Oakley, D.R. and Proctor, B.A., The use of accelerated
aging procedures to predict the long term strength of GRC composites,
Cement and Concrete Research, vol. 11, pp. 455-466, 1981.
50. Gartshore, G.C., Kempster, E. and Tallentire, A.G., A new high durability
cement for GRC products, The Glass fiber Reinforced Cement Association
6th Biennial Congress, 21-24 October 1991, Maastricht, Netherlands
Proceedings, pp. 3-12.
51. Cuypers, H., Wastiels, J., Orlowsky, Jana Raupach, M., Measurement of the
durability of glass fiber reinforced concrete and influence of matrix
alkalinity, Brittle Matrix Composites 7, Proceedings, A.M. Brandt, V.V. Li
and I.H. Marshall eds., Warsaw, October 13-15, 2003, pp. 163-172.
52. Cuypers, H., Van Itterbeeck, P., De Bolster, E., Wastiels, J., Durability of
cementitious composites, Composites in Construction 2005 - Third
International Conference, Proceedings, Lyon, France, July 11-13, 2005, pp.
1205-1212.
53. Cuypers, H., Gu, J., Croes, K, Dumortier, S., Wastiels, J., Evaluation of
fatigue and durability properties of E-glass fiber reinforced phosphate
cementitious composite, Brittle Matrix Composites 6, Proceedings, A.M.
Brandt, V.C. Li, I.H. Marshall eds., Warshaw, October 9-11, 2000, pp. 127-
136.

132
54. Cuypers, H., Wastiels, J., Van Itterbeeck, P., De Bolster, E., Orlowsky, J.
and Raupach, M., Durability of glass fiber reinforced composites
experimental methods and results, Composites Part A, vol. 37, 2006, pp.
207-215.
55. Brameshuber, W. and Brockmann, T., Calcium aluminate cement as binder
for textile reinforced concrete, International Conference on Calcium
Aluminate Cements (CAC), Edinburgh, Scotland, 16-19 July 2001, pp. 659-
666, 2001.
56. Brameshuber, W., Brockmann, Development and optimization of
cementitious matrices for textile reinforced concrete, GRC 2001,
Proceedings of the 12th International Congress of the International Glass
fiber Reinforced Concrete Association, Dublin, Ireland, 14-16 May 2001,
eds. N. Clarke and R. Ferry, pp. 237-249.
57 Litherland, K.L., Oakley, D.R., Proctor,B.A., "The use of accelerated ageing
procedures to predict the long term strength of GRC compostes": Cement
and Concrete Research, 1981, Vol. 11, pp. 455-466.
58. 523.2R, ACI., "Guide for Precast Cellular Concrete Floor, Roof and Wall
Units", American Concrete Institute. Farminton Hills. 1996.
59. "Modeling Unsaturated Moisture Transport in Autoclaved Aerated
Concrete: a Microstructural Approach". Trondheim, Norway : Building
Physics, 2002.
60. ASTM C-1693, "Standard Specification for Precast Autoclaved Aerated
Concrete (AAC) Wall Construction Units". ASTM International, PA. 2009.
61. Holt, E and Raivio, P.,"Use of gasification residues in aerated autoclaved
concrete": Cement and Concrete Research, 2005, Vols. 35, 796 - 802.
62. Narayanan, N and Ramamurthy, K., "Structure and properties of aerated
concrete: a review": Cement and Concrete Composites, 2000, Vols. 20, 321
- 329.
63. Bonakdar, A and Mobasher, B., "Multi-Parameter Study of External Sulfate
Attack in Blended Cement Materials": Journal of Construction and Building
Materials, 2010, Vols. V. 24, pp 61-70.
64. Radhi, Hassan., “Viability of autoclaved aerated concrete walls for the
residential sector in the United Arab Emirates”, Energy and Buildings, 2011,
Vols. 43, pp. 2086 – 2092.

133
65. Zollo, F. Ronald, and Hays, D. Carol., “Engineering Material Properties of a
Fiber Reinforced Cellular Concrete”: ACI Materials Journal. Title no. 95 -
M61.
66. Perez-Pena, M and Mobasher, B.,“Mechanical properties of fiber reinforced
lightweight concrete composites”: Cement and Concrete Research, 1994,
Vols. 24, pp. 1121 - 1132.
67. Gibson, L.J and Ashby, M.F.,“Cellular Solids, Structure and Properties”.
Cambridge : Cambridge University Press, 1997.
68. Silva, Flavio de Andrade, et al., et al., “Impact Behavior of Sisal Fiber
Cement Composites under Flexural Load”: ACI Materials Journal. Title no.
108 - M19.
69. Zhu, Deju, Gencoglu, Mustafa and Moabsher, Barzin.,"Low velocity
flexural impact behaviour of AR glas fabric reinforced cement composites":
Cement & Concrete Composites.
70. Glencoglu, Mustafa, Zhu, Deju and Mobasher, Barzin., "Static and Impact
Behaviour of Fabric Reinforced Cement Composites in Flexure".
71. Silva, F. A. "Toughness of Non-conventional Materials". Msc Thesis,
Department of Civil engineering. PUC-Rio : s.n., 2004.
72. Silva, F. A., Ghavami, K and d'Almeida, J.R.M.,"Toughness of
Cementitious Composites Reinforced by Randomly Sisal Pulps". Head
Island, SC : Eleventh International Conference on Composites Engineering
(ICCE-11), 2004.
73. Romano, G.Q, et al., et al.,"Impact Loading Behaviour of Steel Fiber
Reinforced Refractory Concrete exposed to High Temperatures". Tours,
France : Fifth International Conference on Concrete under Severe
Conditions: Evironment and Loading, 2007, Vols. V.2, pp. 54-59.
74. Bindiganavile, V and Banthia, N., "Polymer and steel fiber-reinforced
cementitious composites under impact loading. Part 1: bond - slip response":
ACI Materials Journal, Vols. 98(1), 17 - 24.
75. Bindiganavile, V and Banthia, N., "Polymer and steel fiber-reinforced
cementitious composites under impact loading. Part 2: flexural toughness":
ACI Materials Journal, Vols. 98 (1), 17 - 24.
76. Manolis, G.D, et al., et al.,"Dynamic properties of polypropylene fiber-
reinforced concrete slabs": Cement and Concrete Composites, 1997, Vols.
19, 341 - 349.

134
77. Lok, T.S and Zhao, P.J., "Impact response of steel fiber-reinforced concrete
using a split hopkinson pressure bar": Journal of Materials in Civil
Engineering, 2004, Vols. 16(1), 54 - 59.
78. Choi, I.H and Lim, C.H., "Low-velocity impact analysis of composite
laminates using linearized contact law": Composite Structures, Vols. 66, 125
- 132.
79. Wang, N.Z, Sidney, M and Keith, K., "Fiber reinforced concrete beams
under impact loading": Cement and Concrete Research, 1996, Vols. 26 (3),
363 - 376.
80. Li, Z, Mu, B and Chui, SNC.,"Static and dynamic behavior of extruded
sheets with short fibers": Journal of Materials in Civil Engineering, 2001,
Vols. 13 (4), 54 - 59.
81. Serrano-Perez, Juan C., Uday K. Vaidya, Nasim Uddin, “Low velocity
impact response of autoclaved aerated concrete / CFRP sandwich plates” :
Composite Structures, 2007, Vols. 80, 621-630.
82. Yankelevsky, David Z., Avnon, Itzhak, “Autoclaved aerated concrete
behavior under explosive action”: Construction and Building Materials,
1998, Vols. 12, 359-364.
83. Laukaitis, A, Keriene, J, Mikulskis, D, Sinica, M, Sezemanas, G,
“Influence of fibrous additives on properties of aerated autoclaved concrete
forming mixtures and strength characteristics of products”: Construction and
Building Materials, 2009, Vols. 23, 3034-3042
84. Wittmann, F,H, and Gheorghita, I., “Fracture toughness of autoclaved
aerated concrete”, Cement and Concrete Research, 1984, Vols. 14, 369-374.
85. Song, P, S, Hwang, S, Sheu, B, C, “Strength properties of nylon and
polypropylene fiber reinforced concretes”, Cement and Concrete Research,
2005, Vols. 35, 1546 – 1550.
86. Bonakdar, A, Mobasher, B and Babbit, F. ,"Physical and mechanical
characterization of fiber-reinforced Aerated Concrete (FRAC)", ACI Spring
Convention. Chicago, IL : American Concrete Institute, March 21 - 25,
2010.
87. Cheresh, M. C. and McMichael, S.,"Instrumented impact test data
interpretation”. In: Kessler, S. L. et. al., editors. Instrumented impact testing
of plastic and composite materials. Philadelphia. STP: ASTM, 1987. p.
963".

135
88. Cain, P.,J., "Digital filtering of impact data" Kessler Sl et al., editors.
Instrumented impact testing of plastic and Composite Materials.
Philadelphia. STP: ASTM, 1987. p. 963.
89. Land, P.L., "Strain rates for three and four point flexure tests": Journal of
Materials Science, 1979, Vols. 14, 2760 - 2761.
90. Belingardi, G and Vadori, R.,“Low Velocity Impact Tests of Laminate
Glass-fiber-epoxy Matrix Composite Material Plates”: International Journal
of Impact Engineering, 2002, Vols. 27, 213 - 229.
91. Mobasher, B, Pivacek, A and Haupt, G.J.,"Cement based cross-ply
laminates": ACI Materials Journal, 1997, Vols. 6, 144 - 152.
92. Lee, H.K., Liang, Z., “Computational modeling of the response and damage
behavior of fiber reinforced cellular concrete”: Computers & Structures,
2004, Vols. 82, 581 – 592.
93. Mobasher, Barzin.,"Mechanics of Fiber and Textile Reinforced Cement
Composites": CRC Press - Taylor & Francis Group, 2012.
94. Narayanan, N and Ramamurthy, K., "Structure and properties of aerated
concrete: a review": Cement and Concrete Composites, 2000, Vols. 20, 321 -
329.
95. Tekalur, S.A., et.al. “Shock loading response of sandwich panels with 3-D
woven E-glass composite skins and stitched foam core”, Composites and
Technology, 2009, Vols. 69, pp. 736 - 753