Embed Size (px)
Citation preview

MODIFICATION OF WASTE WATER
TREATMENT USING GEOTEXTILES
by
KISHORE KUMAR KOTHA, B.Tech.
A THESIS
IN
CIVIL ENGINEERING
Submitted to the Graduate Faculty
of Texas Tech University in Partial Fulfillment of the Requirements for
the Degree of
MASTER OF SCIENCE
IN
CIVIL ENGINEERING
Approved
C 3 5
T -
C ^
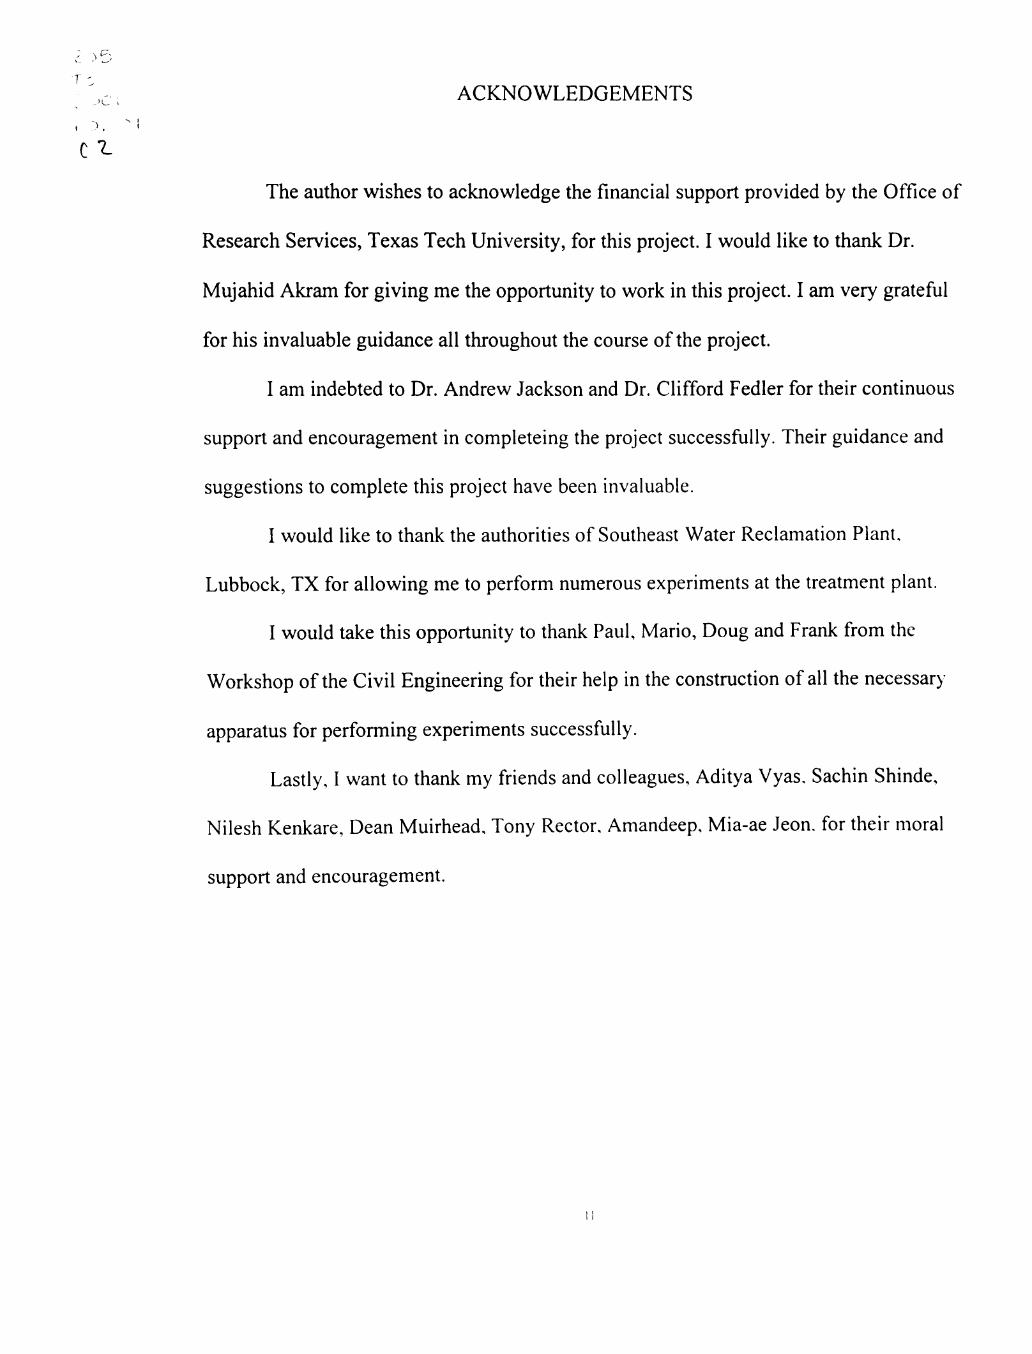
ACKNOWLEDGEMENTS
The author wishes to acknowledge the financial support provided by the Office of
Research Services, Texas Tech University, for this project. I would like to thank Dr.
Mujahid Akram for giving me the opportunity to work in this project. I am very grateful
for his invaluable guidance all throughout the course of the project.
I am indebted to Dr. Andrew Jackson and Dr. Clifford Fedler for their continuous
support and encouragement in completeing the project successfully. Their guidance and
suggestions to complete this project have been invaluable.
I would like to thank the authorities of Southeast Water Reclamation Plant,
Lubbock, TX for allowing me to perform numerous experiments at the treatment plant.
I would take this opportunity to thank Paul, Mario, Doug and Frank from the
Workshop of the Civil Engineering for their help in the constmction of all the necessary
apparatus for performing experiments successfully.
Lastly, 1 want to thank my friends and colleagues, Aditya Vyas. Sachin Shinde,
Nilesh Kenkare, Dean Muirhead, Tony Rector, Amandeep, Mia-ae Jeon. for their moral
support and encouragement.
TABLE OF CONTENTS
ABSTRACT iv
LIST OF TABLES v
LIST OF FIGURES vi
CHAPTER
1. INTRODUCTION 1
2. LITERATURE REVIEW 3
3. OBJECTIVES 18
4. MATERIALS AND METHODS 19
5. RESULTS AND DISCUSSIONS 29
6. CONCLUSIONS 54
7. RECOMMENDATIONS FOR FURTHER RESEARCH 56
REFERENCES 57
111

ABSTRACT
Removal of suspended solids (SS) is one of the unit operation involved in the
treatment of wastewater. Sedimentation process is widely used for the removal of SS
from wastewater. But this method also has some disadvantages such as sludge handling
and low removal efficiencies. In this investigation, nonwoven geotextiles with var\ ing
hydraulic and mechanical properties were used to treat municipal wastewater. Also, the
performances of different geotextiles in treating wastewater with varying influent SS
concentrations, were evaluated. Geotextile retains SS on its upstream face as wastewater
is passed through it. Once the geotextile is clogged, it was backwashed with tap water for
reuse. Our investigations revealed that the geotextiles were able to achieve very high
removal efficiencies in the range of 70-90%, irrespective of the influent SS
concentrations. But with a higher range of influent SS concentration (>200mg/L). the
geotextiles exhibited very short clogging time, around 5 to 10 min., which required
backwashing geotextiles every 10 min. This technique may prove to be suitable for
treating low strength and low flow wastewaters having SS concentrations in the range of
100to200mg/L.
iv

LIST OF TABLES
4.1 Properties of Nonwoven Geotextiles Used in this Research 24
4.2 Experiments Performed on Wastewater and Geotextiles 25
5.1 Properties of Nonwoven Geotextiles and SS Removal Efficiencies 31
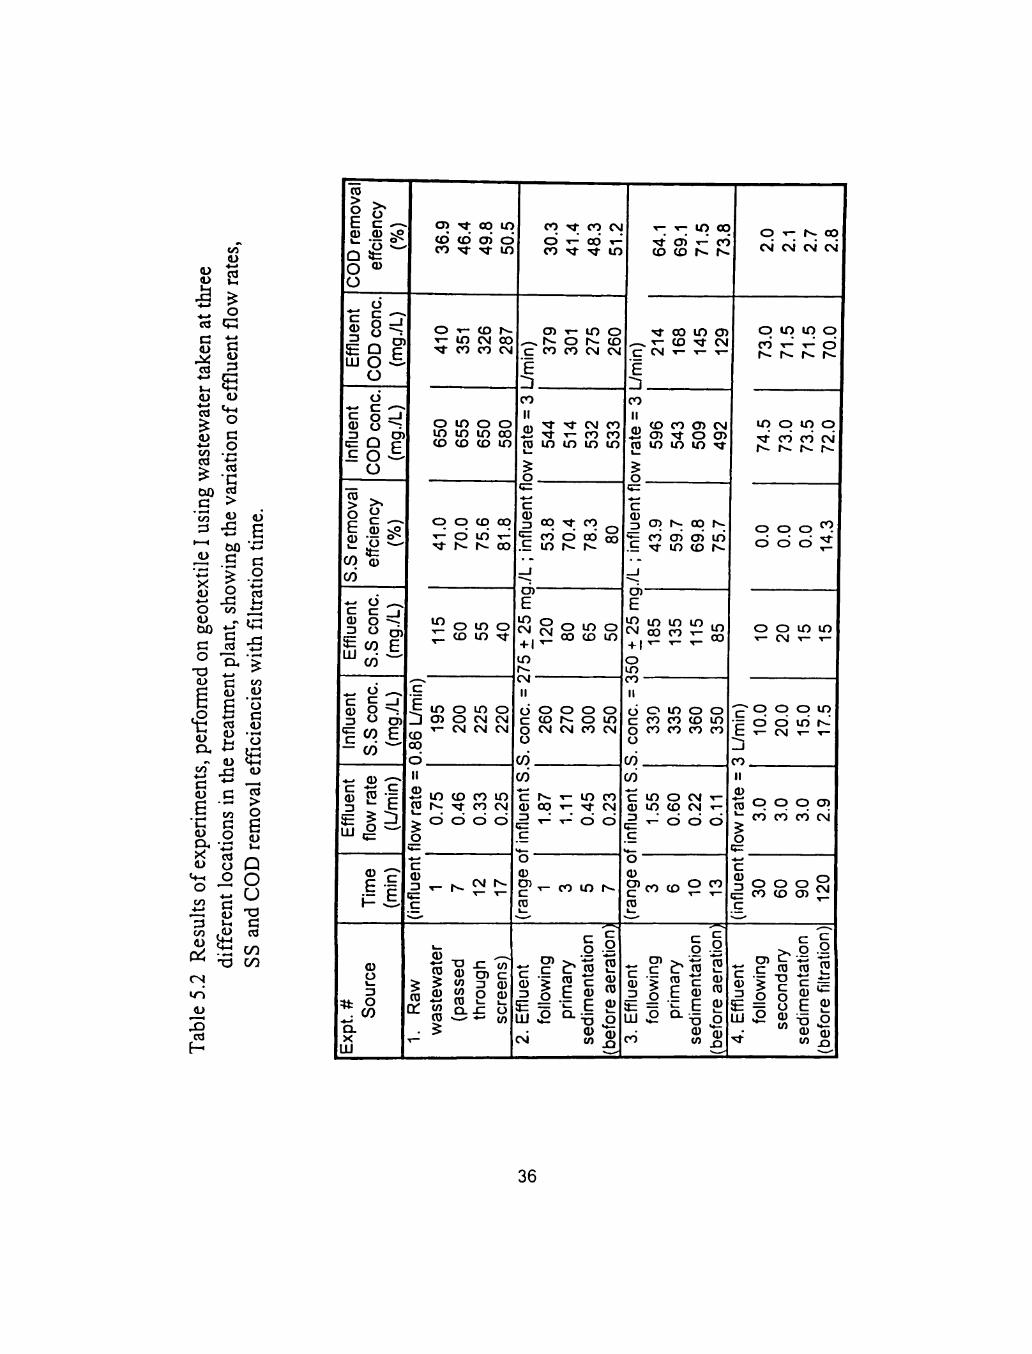
5.2 Results of Experiments Performed on Geotextile I: Effluent Flow Rates, SS, and COD Removal Efficiencies 36
5.3 Results of Experiments Performed on Geotextile A: Effluent Flow Rates, SS, and COD Removal Efficiencies 41
5.4 Results of Experiments Performed on Combination of Geotextiles (I+A):
Effluent Flow Rates, SS,and COD Removal Efficiencies 46
5.5 Results of Backwash Experiments on Geotextile 52
5.6 Concentrations in Backwash Water 52
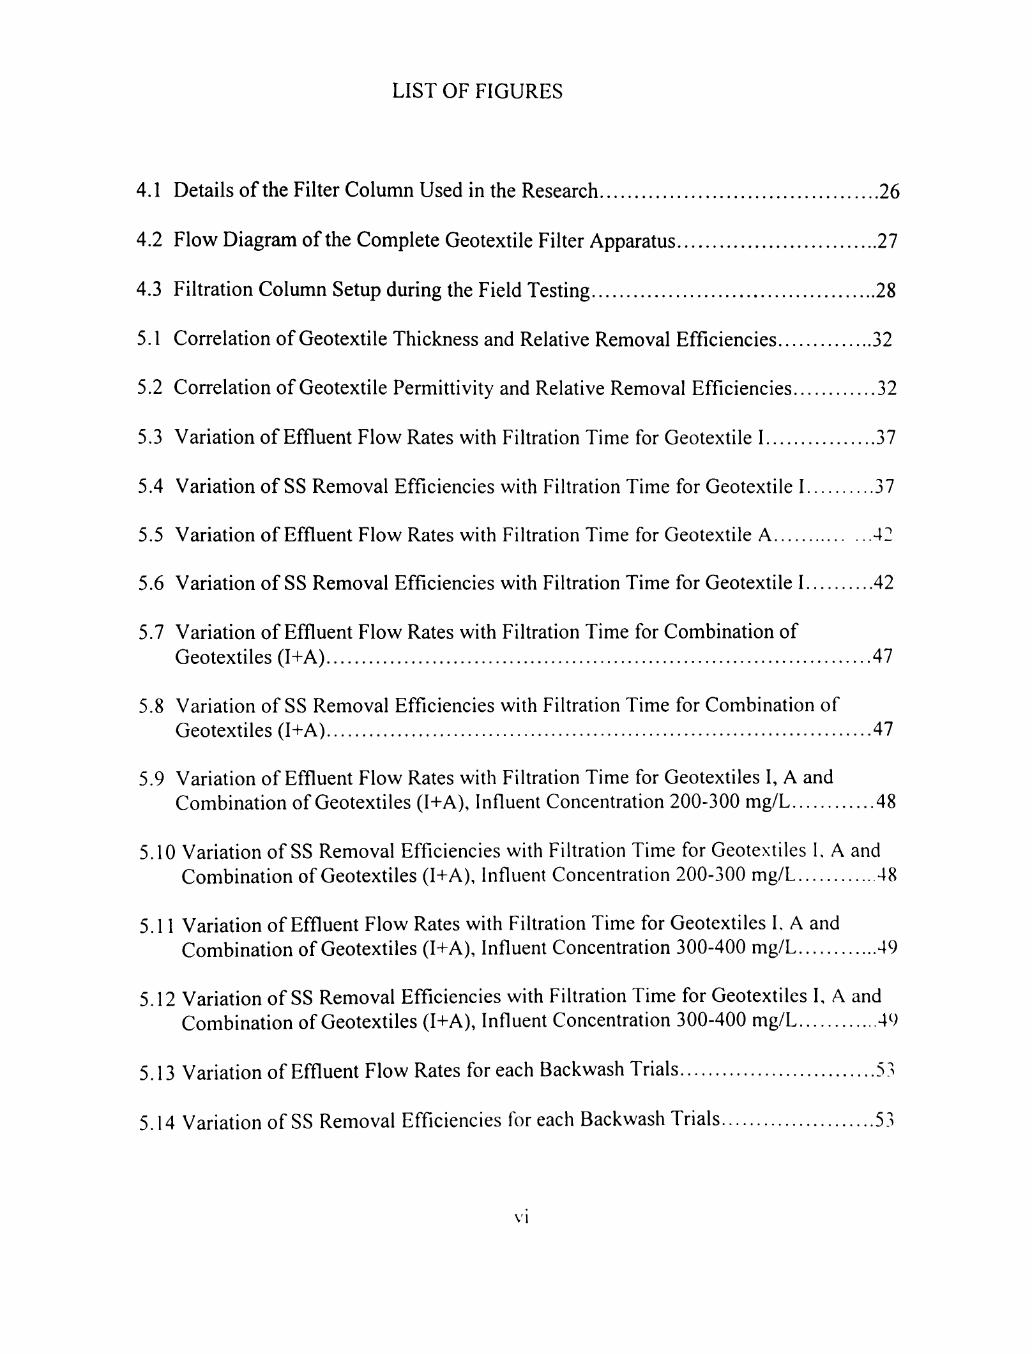
LIST OF FIGURES
4.1 Details of the Filter Column Used in the Research 26
4.2 Flow Diagram of the Complete Geotextile Filter Apparatus 27
4.3 Filtration Column Setup during the Field Testing 28
5.1 Correlation of Geotextile Thickness and Relative Removal Efficiencies 32
5.2 Correlation of Geotextile Permittivity and Relative Removal Efficiencies 32
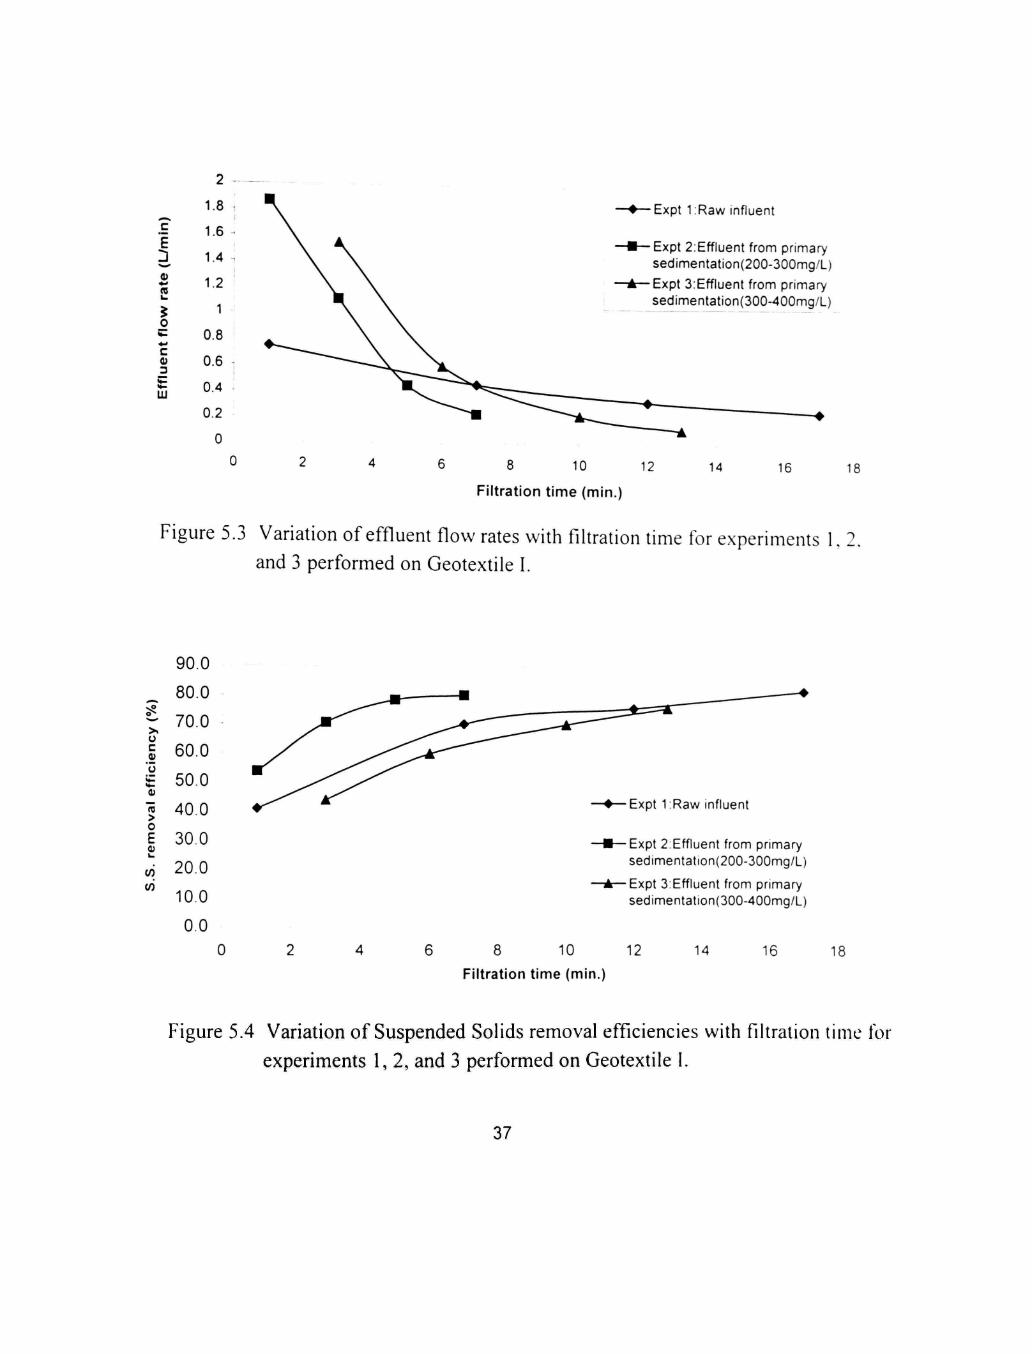
5.3 Variation of Effluent Flow Rates with Filtration Time for Geotextile 1 37
5.4 Variation of SS Removal Efficiencies with Filtration Time for Geotextile 1 37
5.5 Variation of Effluent Flow Rates with Filtration Time for Geotextile A 42
5.6 Variation of SS Removal Efficiencies with Filtration Time for Geotextile 1 42
5.7 Variation of Effluent Flow Rates with Filtration Time for Combination of Geotextiles (I+A) 47
5.8 Variation of SS Removal Efficiencies with Filtration Time for Combination of Geotextiles (I+A) 47
5.9 Variation of Effluent Flow Rates with Filtration Time for Geotextiles I, A and Combination of Geotextiles (1+A), Influent Concentration 200-300 mg/L 48
5.10 Variation of SS Removal Efficiencies with Filtration Time for Geotextiles 1, A and Combination of Geotextiles (I+A), Influent Concentration 200-300 mg/L 48
5.11 Variation of Effluent Flow Rates with Filtration Time for Geotextiles 1. A and Combination of Geotextiles (I+A), Influent Concentration 300-400 mg/L 49
5.12 Variation of SS Removal Efficiencies with Filtration Time for Geotextiles I, A and Combination of Geotextiles (I+A), Influent Concentration 300-400 mg/L 49
5.13 Variation of Effluent Flow Rates for each Backwash Trials 53
5.14 Variation of SS Removal Efficiencies for each Backwash Trials 53
VI

CHAPTER 1
INTRODUCTION
In the treatment of wastewater, suspended solids (SS) are one of the major
components, which must be removed. SS are those which are visible and in suspension in
wastewater. SS will include the larger floating particles and consist of sand, grit, clay,
fecal solids, paper, and pieces of wood, particles of food and garbage, and similar
materials. They may organic or inorganic in nature. Suspended solids are approximately
70% organic solids and 30%) inorganic solids, the latter composed mainly of cla\. sand,
and grit.
The wastewater must be treated for SS before being disposed of into surface water
sources. When untreated wastewater is disposed of into a surface water stream, high
concentrations of suspended solids can cause many problems for stream health and
aquatic life, and subsequently the water body may lose its ability to support a diversity of
aquatic life. SS absorb heat from sunlight, which increases water temperature and
subsequently decreases levels of dissolved oxygen (DO). Also, due to the high organic
character of the suspended solids in wastewater, they consume the DO present in tb.e
surface water when it is disposed directly without prior treatment. This results in
polluting the fresh surface water sources. The SS can also destroy fish habitat because
they settle to the bottom and eventually blanket the riverbed. Hence, an adequate
treatment of wastewater for suspended solids is necessary to ensure that their disposal
niav not affect the health of the surface waters.
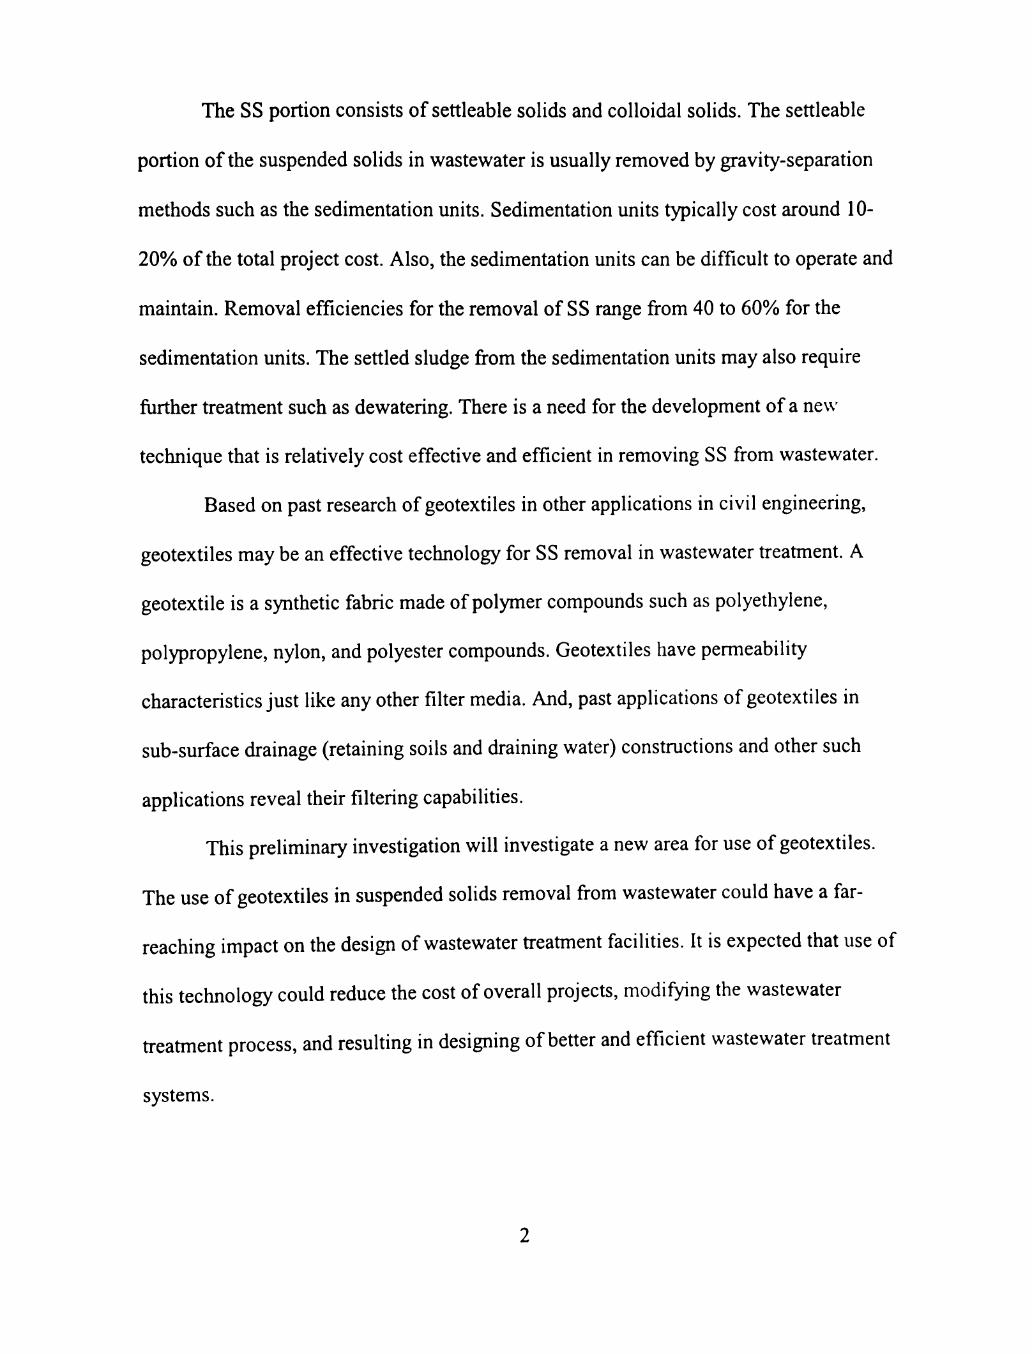
The SS portion consists of settleable solids and colloidal solids. The settleable
portion of the suspended solids in wastewater is usually removed by gravity-separation
methods such as the sedimentation units. Sedimentation units typically cost around 10-
20%) of the total project cost. Also, the sedimentation units can be difficult to operate and
maintain. Removal efficiencies for the removal of SS range fi-om 40 to 60% for the
sedimentation units. The settled sludge fi^om the sedimentation units may also require
further treatment such as dewatering. There is a need for the development of a new
technique that is relatively cost effective and efficient in removing SS from wastewater.
Based on past research of geotextiles in other applications in civil engineering,
geotextiles may be an effective technology for SS removal in wastewater treatment. A
geotextile is a synthetic fabric made of polymer compounds such as polyethylene,
polypropylene, nylon, and polyester compounds. Geotextiles have permeability
characteristics just like any other filter media. And, past applications of geotextiles in
sub-surface drainage (retaining soils and draining water) constmctions and other such
applications reveal their filtering capabilities.
This preliminary investigation will investigate a new area for use of geotextiles.
The use of geotextiles in suspended solids removal from wastewater could have a far-
reaching impact on the design of wastewater treatment facilities. It is expected that use of
this technology could reduce the cost of overall projects, modifying the wastewater
treatment process, and resulting in designing of better and efficient wastewater treatment
systems.

CHAPTER 2
LITERATURE REVIEW
2.1 Introduction
This research explores the use of geotextiles for removing SS in municipal
wastewater. To date, applications of geotextiles were limited to geotechnical engineering
and transportation engineering. The application of geotextiles in the field of wastewater
engineering is an entirely new method.
A geotextile is a synthetic fabric made of different polymer compounds. The
geotextile has a porous or a permeable character and capable of retaining SS when
wastewater is passed through it. The following review emphasizes the filtration principle,
geotextile material properties and physical properties of SS in wastewater.
2.2 Filtration and Filter Medium
Filtration is a unit operation to separate suspended particles from a liquid phase
by passing the liquid through a porous medium. When the liquid is forced through such a
porous medium, the suspended particles are retained on the medium's surface or within
the medium itself The liquid that passes through is referred to as the filtrate. A porous
medium is defined as a solid containing many holes and tortuous passages. A porous
medium is characterized by the manner in which openings are embedded, the extent of
their interconnection, and their location, size and shape. The fraction of the medium that

contains voids is defined as porosity. When a liquid passes through a porous medium, the
fraction of the medium that contributes to the flow is termed as effective-porosity.
There are two types of filtration: "cake " and "filter-medium" filtration. The cake-
filtration is also termed as surface filtration because solid particles generate a cake on the
surface of the filter medium. In filter-medium filtration, solid particles get entrapped
within the pore stmcture of the filter medium. The cake and filter medium influence each
other. During filtration, the volumetric rate through a filter medium is direcfly
proportional to the existing pressure gradient across the filter medium and inversely
proportional to the flow resistance imposed by the formation of filter cake and filter
medium. The pressure gradient is the driving force for the liquid to flow through the
medium. The driving force increases proportionally, irrespective of how the pressure
gradient is developed. But in most cases, the rate of filtration increases slower than the
rate at which the pressure gradient increases. Pores size and shape normally depends on
the manufacturing method used for the construction of the filter medium. Pore
characteristics also depend on the properties of fibers. The separation process occurring
within the pore passages influences the pore characteristics, as this decreases pore size,
and increases flow resistance across the filter medium (Cheremisinoff, 1998).
In practice, cake filtration is preferred over the filter-medium filtration. In cake
filtration, once the cake attains a certain thickness, the cake is removed from the filter
medium by using mechanical devices or by reversing the flow of filtrate. The structure oi'
the cake formed and its resistance to liquid flow depends on the properties of the solid
particles, the liquid phase suspension, and the conditions of filtration. Cake structure is

characterized by hydrodynamic factors such as cake porosity, mean particle size, particle
size distribution, and other such factors. The cake stmcture is also influenced by some
physicochemical factors such as the rate of coagulafion of solid particles; presence of
impurities clogging the pores, presence of solvate shells on the solid particles, etc. The
influence of physicochemical factors is a surface phenomenon and exists at the solid-
liquid boundary (Cheremisinoff, 1998).
The pressure gradient across the filtering medium and the temperature of the
suspensions are the two operating parameters that influence the filtration process. The
temperature of the suspension influences the viscosity of the liquid-phase, which affects
the ability of the liquid to flow through the pores of the cake and the filter medium. The
other factors that influence the process of filtration are particle inhomogeneity, which
affects the geometry of cake structure, and the ability of the particles to undergo
deformation when subjected to pressure and settling characteristics due to gravity. During
the process of filtration, small particles retained on the outer layers of the cake are
transported to the layers closer to the filter medium, or even into the pores. Due to this
shift in position, there is an increase in filtering resistance across the filter medium and
the cake that is formed. Pore clogging can occur when the particles undergo deformation
when subjected to high pressures. And this pore clogging can be corrected by the addition
of coagulating and peptizing agents. These agents are capable of altering the cake
properties, leading to a decrease in flow resistance and subsequent increase in the
filtration rate. In order to prevent the penetration of fine particles into the pores of a filter
medium, when processing low concentration suspensions, filter aids can be used. Filler

aids build up a porous, permeable, rigid lattice stmcture that retains solid particles on the
filter medium surface, while allowing the liquid to pass through (Cheremisinoff, N. P.,
1998).
The granular medium filtration is normally not preferred in the treatment of
wastewater because of two main following reasons:
a. The filters need to handle a high variability in the characteristics of the influent
suspended solids. For example, changes in the degree of flocculation of the
suspended solids in the secondary settling facilities will significantly affect the
particle sizes and their distribution in the effluent. This may affect the
performance of the filter.
b. The characteristics of the effluent SS will also vary with the organic loading on
the process as well as with the time of day, filters must be designed to function
under a wide range of operating conditions.
2.3 Geotextile
A geotextile is a synthetic fabric made of different polymer compounds. The four
most important groups of raw materials used in the manufacture of geotextiles are
polyamides, polyethylene terepthalate (polyester), polyethylene and polypropylene. All
these materials are polymer compounds or synthetic materials derived from the
processing of crude oil and natural gas. Yet, they each impart unique properties lo the
geotextile in terms of specific gravity, melting point, chemical resistance, and such other
properties. Geotextiles have many applications in the fields of geotechnical and

transportation engineering. Their applications include: constmction of pavements, erosion
and sediment control, subsurface drainage, reinforced soil stmctures, and waste
containment systems. Geotexfiles can fulfill the following functions when in contact with
water, soil and/or stone:
a. Separation: The geotextile, to a great extent, separates layers of different grain
sizes.
b. Filtration: The geotextile retains some particles and allows others to pass
through.
c. Reinforcing: The geotextile increases the stability of the soil body.
d. Drainage: The geotextile itself functions as a drain because it has a higher
water transporting capacity than the surrounding materials (Veldhuijzen.
1986).
2.3.1 Categories of Geotexfiles
There are two basic categories of geotextiles: woven and non-woven geotextile.
2.3.1.1 Woven geotexfiles
Woven geotextiles can generally be categorized as Slit Film or Filament. They are
made from mono-filaments, mulfi-filaments, or slit films.
a. Slit film wovens are manufactured by cutting sheets of impermeable film
into narrow strips and then weaving these strips together to form a textile.

These fabrics are normally used in sediment control and road stabilization
applications.
b. Mono-filament wovens are manufactured by weaving extruded filaments.
This process produces a geotexfile of consistent openings, which is used in
erosion control.
c. High strength multi-filament wovens are very specialized and are
primarily used in reinforcement applications.
2.3.1.2 Non-woven geotextiles
Non-woven geotextiles are manufactured from either staple fibres or continuous
filaments.
a. Continuous filament non-wovens are made by randomly distributing the
extruded semi-solid continuous strands onto a moving belt in layers, thus
forming a felt-like web. The web then passes through a needlepunching
loom or other bonding machine.
b. Staple non-wovens are made from short staple fibres that are typically 75-
150 mm in length. Most non-woven geotextiles available in North
America are produced from staple fibers. The staple fibers are carded and
evenly distributed onto a moving belt to form a web that is usually bonded
by a combination of needlepunching and heat bonding.
Non-woven geotextiles may differ by their primary bonding methods, fhe two
most common methods are needlepunching and heatbonding. Needlepunched geotextiles
8

are bonded by mechanically entangling the fibers by the use of barbed needles. These
geotexfiles are felt-like in appearance and will be very thick in heavier weights'. This
thickness enables needle-punched geotextiles to transmit fluid within their planes.
Needlepunched non-woven geotextiles have porosities greater than 90%). This high
porosity reduces the potential for clogging and makes these fabrics ideal for subsurface
drainage and erosion control applications. Heatbonded non-wovens use heat and pressure
to bond the fibres into a geotextile. Because these fabrics are bonded using heated rolls,
they are very thin and stiff. Heatbonding does increase the geotextile's tensile properties.
These geotextiles have been used in road stabilization applications (Veldhuijzen, 1986).
A nonwoven, needlepunched, staple fiber, propylene geotextile will ha\'e: a
uniform web with a randomly sized three-dimensional pore structure for more soil-like
performance: multidirectional strength and conformability to resist installation damage;
high strength lo weight ratio; and resistance to environmental degradation an creep to
facilitate extended design life. A woven, slit-film, polypropylene geotextile will have:
high bi-directional strength and stiffness; light weight to provide ease of installation; and
high resistance level to environmental degradation (Veldhuijzen, 1986).
2.3.2 Properties of Geotexfiles
Geotextiles can be distinguished based on mechanical properties (such as
thickness, unit weight, tensile strength, tear strength, and LV resistance) and h\draulic
properties (such as apparent opening size. permeability/permitti\ity. and fiow rate). But
only the hydraulic properties intluence the filtering performance of a geotextile.

a. Apparent Opening Size (AGS): AGS is defined as the number, or opening
size, of the U.S. standard sieve having openings closest in size to the largest
openings in a geotextile.
b. Permittivity: Permittivity is a measure of the flow in the normal direction
through a geotexfile. It can be expressed as L/mVsec (vertical flow), sec''
(permittivity) or cm/sec (coefficient of permeability, k).
c. Unit weight: Unit weight is referred to as the mass per unit area of a
geotextile. Thickness is the dimension perpendicular to the fabric under a
specific pressure and is expressed in length units. The use of geotextiles as
filter media requires the prior determination of specific filter criteria, a
permeability criterion and a retention criterion. The former uses the particle
size and latter uses the filtrafion opening size, as characteristic geotextile
parameters.
d. The filtration opening size: The filtration opening size corresponds to the size
of the largest particle capable of percolating through the geotextile. It can be
determined by experimental and theoretical approaches and the most
frequently used experimental method is the sieve analysis.
e. Porosity: Porosity is a measure of the size of voids existing between the solid
parts of a porous medium. In geotextiles, which is a fibrous material, the.se
voids or pores form a continuous medium of extremely complex geometry.
The possible trajectories of a spherical particle between the fibers of a
geotextile can easily be determined in a woven geotextile but not in the case
10

of a non-woven geotextile because of the non-uniformity and complex
arrangements of fibers in the non-wovens.
f Geotextile permeability: Geotextile permeability is normally expressed in
terms of volume flow rate through the geotextile i.e., volume of water
passing/unit area/unit time/unit water head. This volume permeabilit\
determines the number of pores per unit area in the geotextile. If two
geotextiles have the same indicative pore size, then the one with the higher
volume permeability will have the greater number of pores per imit area. For
good filtration, it is a requirement that for a given indicative pore size, the
optimal geotexfile should have as high permeability as possible. As the
number of pores per unit area is quite critical to the filtration performance of
the geotextile, it is essential to be able to determine the critical geotextile
permeability to ensure best filtration performance. Hence the geotextile
properties that determine its filter performance are its pore size and its water
permeability (Lawson, 1982).
2.3.3 Applications of Geotextiles
Atmatzidis et al. (1982) studied the evaluation of geotextiles as a liquid filter.
They conducted laboratory filtration tests on both woven and non-wo\ en geotextiles.
They used two clay products, namely Kaolinite and Grundite. and water o\' low and high
ionic strength, to prepare suspensions in water. Based on their investigations, thev found
that non-woven geotextiles gave the best overall performance, when compared to the
11

wovens. They developed an indexing technique based on measurements of head loss,
flow rate, and mass removal efficiency, which show a promise of at least effectively
screening or rating different geotextiles as liquid filters. They concluded that the results
obtained from the filtration test and the performances of the geotextile filter were a \er>
sensitive function of the geometric characteristic of the geotextile. These characteristics
include pore size, pore size distribution, porosity, weave pattern and individual fiber
geometry.
According to Kellner et al. (1982), the geotextile fabric's suscepfibility to retain
fine suspended particles is influenced by electrochemical forces between the chemical
nature of the polymer (of which the fabric fiber is made) and the mineralogical
composition of the suspended particles.
Wittmann (1982) conducted filtering studies with both geotextiles and granular
media. They wrote that the woven geotextiles showed a real sieve-filtering and all the
other media i.e., non-woven geotextiles and the granular medium are influenced in their
particle-retaining by the filter thickness.
Lawson, (1982) indicated that geotextiles in filtrafion applications act as a catalyst
for the formation of the filter cake. After this formation of the filter cake, the geotextiles
serve only as a separation medium. According to the author, the opening size of the
geotextile is the critical parameter, in order to initiate the formation of a stable and
effective filter cake.
12

72.3.4 Factors Affecting Permeability
Velhuijzen (1986) reported that the permeability of a geotextile depends on the
following factors:
a. Geotexfile Structure: The permeability of a geotextile is to a large extent
determined by the pore size and the number of pores per unit area. It is related
to the manufacturing techniques, yam composition (for example,
monofilament or multifilament), and the synthetic material itself (for example,
polypropylene or polyethylene).
b. Hydraulic loads: This load represents the amount of flow to be discharged
through the geotextile.
c. Blocking: It is a process in which the suspended particles can penetrate
partially into the pores. Due to this, some of the pores are partly or completely
closed, reducing the permeability. The effect of blocking is most noticeable
with uniform suspended particles when the maximum openings in the
geotextile are the same order of magnitude of the particle size in the
wastewater. Blocking is independent of time.
d. Clogging: It is a process in which fine suspended particles settle in the pores
of the geotextile or on the upstream face of the geotextile. The clogging
phenomenon is essentially occurring within a geotextile structure. The coarse
suspended particles retained by the geotextile structure prevent smaller
particles from being entrained by the flowing wastewater. The smaller
particles are in turn retaining fines further on. Clogging is a time dependent
13

phenomenon. According to Mlynarek et al. (1990), the clogging level of a
geotextile depends on the number of clogging sites (resulting from the textile
non-homogeneity), the quantity of fine suspended particles carried into the
fabric, and the filtration velocity within the fabric voids.
e. Wastewater temperature: When the temperature of the wastewater decreases,
the viscosity of the wastewater increases. This leads to reduction of the
volume flow rate through the geotextiles, which results in high overburden
pressure on the geotextiles. Hence, the temperature of the wastewater is
indirectly affecting the permeability of the geotextiles. The extent of influence
of wastewater temperature on the geotextiles permeability depends on the
extent of the variation of the wastewater temperature.
f. Composition of wastewater: The composifion of wastewater can affect the
permeability of a geotexfile, e.g., the presence of some flocculafing
compounds in wastewater can be settled or trapped within the pores of a
geotextile media, resulting in the reduction of the overall permeability of the
geotextile. Another example is the iron particles that forms rust on exposure to
oxygen, can settle in the geotexfile media.
2.4 Suspended Solids in Wastewater
SS are the solid particles that are in suspension in wastewater. They are the solids
that can be removed from the wastewater by ph\ sical or mechanical means, such as
filtration. SS will include the larger floating particles and consist of sand, grit, clay, fecal
14
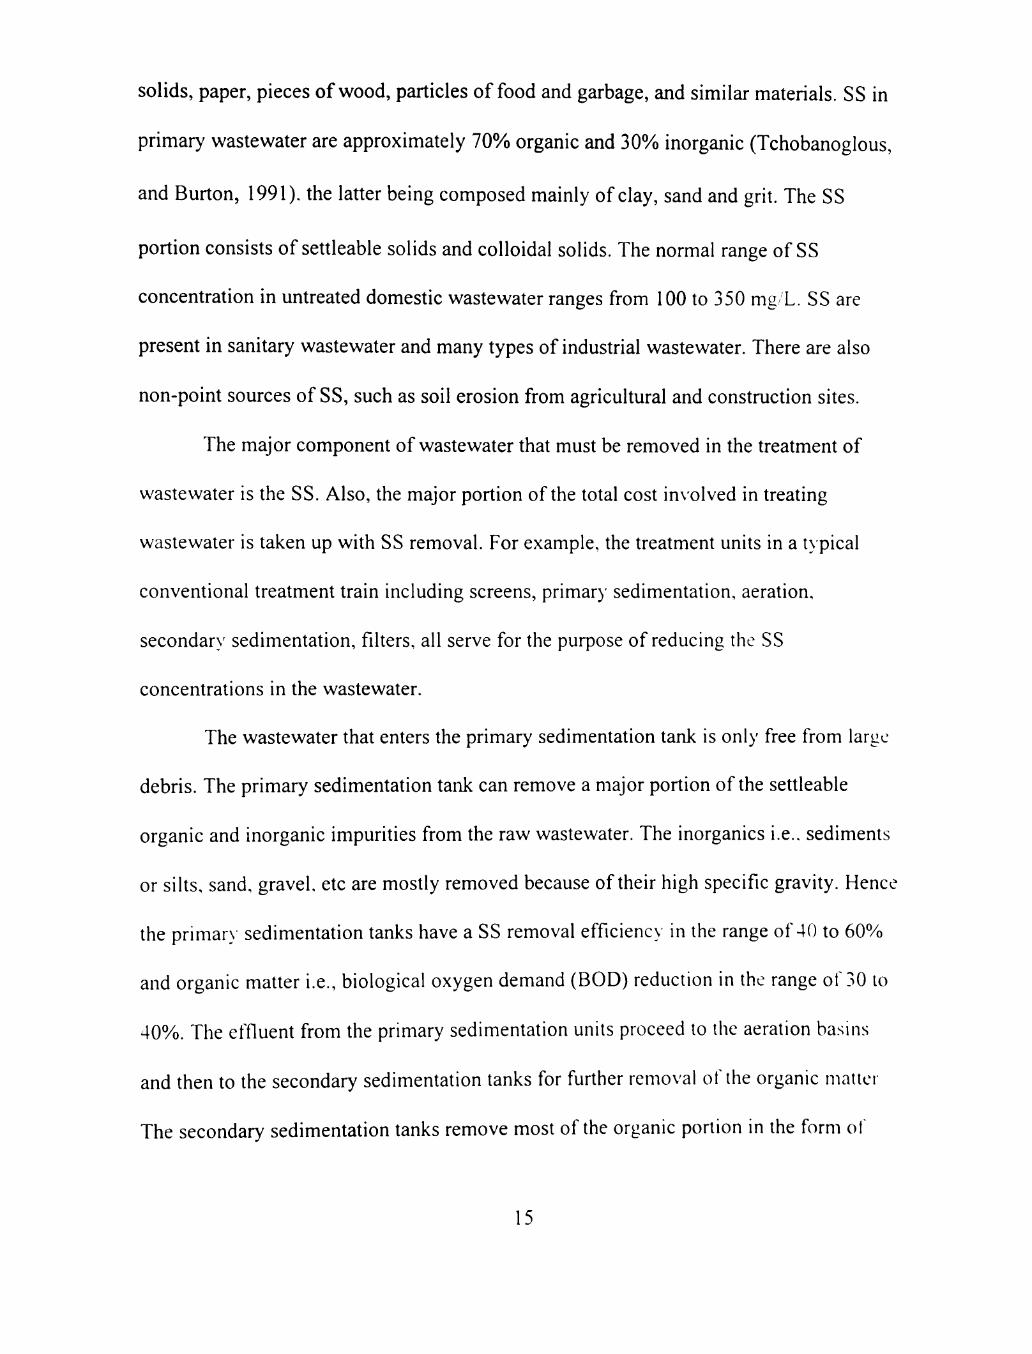
solids, paper, pieces of wood, particles of food and garbage, and similar materials. SS in
primary wastewater are approximately 70%o organic and 30% inorganic (Tchobanoglous,
and Burton, 1991). the latter being composed mainly of clay, sand and grit. The SS
portion consists of settleable solids and colloidal solids. The normal range of SS
concentration in untreated domestic wastewater ranges from 100 to 350 mg/L. SS are
present in sanitary wastewater and many types of industrial wastewater. There are also
non-point sources of SS, such as soil erosion from agricultural and constmction sites.
The major component of wastewater that must be removed in the treatment of
wastewater is the SS. Also, the major portion of the total cost involved in treafing
wastewater is taken up with SS removal. For example, the treatment units in a typical
conventional treatment train including screens, primar)' sedimentation, aeration,
secondary sedimentation, filters, all serve for the purpose of reducing the SS
concentrations in the wastewater.
The wastewater that enters the primary sedimentation tank is only free from large
debris. The primary sedimentation tank can remove a major portion of the settleable
organic and inorganic impurities from the raw wastewater. The inorganics i.e., sediments
or silts, sand, gravel, etc are mostly removed because of their high specific gravity. Hence
the primar\ sedimentation tanks have a SS removal efficiency in the range of 40 to 60%
and organic matter i.e., biological oxygen demand (BOD) reduction in the range of 30 to
40%. The effluent from the primary sedimentation units proceed to the aeration basins
and then to the secondary sedimentation tanks for further removal of the organic matter
The secondary sedimentation tanks remove most of the organic portion in the form of
15

biological floes, which are produced in the aeration basin. Hence the concentrations and
the characterisfics of SS differ at different stages of treatment in a treatment train.
Usually, in a conventional wastewater treatment train, the wastewater is treated
for SS in the following order: screens, primary sedimentation, aeration, secondary
sedimentation and filters. In the effluent, the SS are reduced by more than 95%.
2.5 Problems with a Sedimentation Unit
In a conventional sedimentation treatment train, two sedimentation units are
present for treating the wastewater. These two sedimentation units are the primary
sedimentation and the secondary sedimentation, both serve the same purpose, i.e.,
removal of solids in wastewater. Sedimentation tanks typically cost around 10-20% of the
total cost of the wastewater treatment project. An improperly operated sedimentation
tanks may result in unsatisfactory conditions such as the production of bad odors, the
breeding of flies, the formation of sludge that is difficult to treat, the overloading of
secondary treatment units and the production of poor effluent. If the settled sludge is not
removed frequently, it may exhibit anaerobic conditions thus intensifying odor problems.
Removal or collection of settled sludge from a sedimentation tank is a complex procedure
that involves the use of mechanical scrapers. The percentage of solids in the sludge
collected from the sedimentafion units normally ranges from 0.5 to 6%. Hence, in order
to reduce the sludge handling costs, dewatering of the settled sludge, obtained from the
sedimentation tanks, is often necessary (Tchobanoglous and Burton, 1991). Based on all
these problems with the sedimentation units, there is a need for the development of a new
16
method, which is compatible, easy in operation and maintenance, and can reduce SS
significantly in wastewater.
Because a geotextiles has permeability characteristics like sand or a gravel beds,
they may be used as a filter media. Past applications of geotexfiles in drainage and
retention areas, show that geotextiles have the capability of retaining solid particles from
a fluid, when fluid is passed through them. The geotextiles have the advantage of being
manufactured with the desired mechanical and hydraulic properties. Using geotextiles.
with specified hydraulic properties, removal of SS from wastewater may be feasible. This
research mainly deals with the removal of SS from municipal wastewater using geotextile
as a filtration medium.
17

CHAPTER 3
OBJECTIVES
The objective of this research is to determine the effectiveness of geotextiles in
removing SS from wastewater. This objective is further subdivided into the following
sub-objectives:
1. To determine the level of SS removal with the of geotexfiles,
2. To determine the loading rate of wastewater on geotextiles, and
3. To determine the regeneration potential of geotextiles and the resulting change in
process efficiency.
18

CHAPTER 4
MATERIALS AND METHODS
4.1 Overview
Nine nonwoven geotextiles were tested for their ability to reduce SS from
municipal wastewater. A constant flow filter column apparatus was constructed to
perform filtration experiments on the geotextiles. Experiments were performed on these
geotextiles using wastewater from a local wastewater treatment plant. Their filtration
capacity was tested with wastewater containing different concentrations and
characteristics of SS by either diluting wastewater samples or using samples from
different locations in the treatment plant. In addition, effects of combinations of
geotextiles were also investigated on SS removal efficiency. Filtration efficiencies in the
removal of SS were measured for the geotextiles.
4.2 Materials
4.2.1 Geotexfiles
The hydraulic and mechanical properties of nonwoven geotextile used in this
research are presented in Table 4.1. The geotexfiles were provided by Amoco Fabrics
Co., Nicolon Mirafi Group and TNS Advanced Technologies. Geotextiles A through 1,
with varying properties were used in the preliminary investigation. Further investigations
were conducted to determine capability of two geotextiles, i.e., Geotextiles A and I.
19

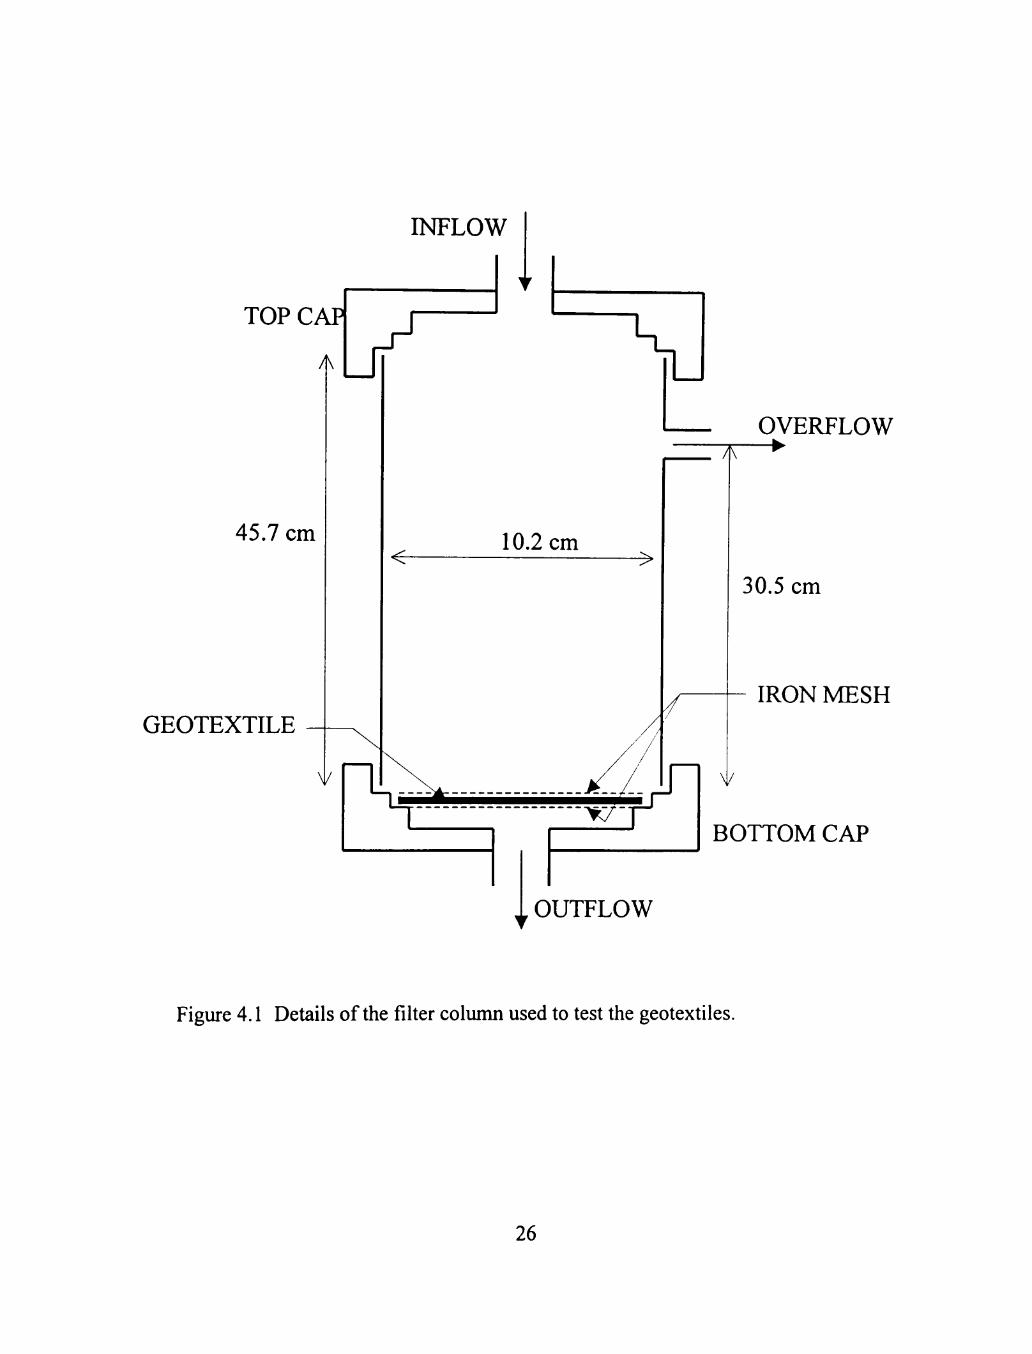
4.2.2 Apparatus
A cylindrical constant-head filter column was constmcted of plexi-glass
material. A schemafic diagram of the filter column is shown in Figure 4.1. The overflow
port was used to maintain a constant head of wastewater over geotextile. This filter
column has a provision for securing a geotextile at the bottom. The geotextile rests on an
iron mesh. Another iron mesh rests directly on top of the geotextile in order to prevent
blow-up of the geotexfile during backwash. The filter column has a top cap and a bottom
cap with inflow and outflow openings of 2.54 cm diameter. The filter column has
detachable top and bottom caps for the purpose of removing and changing of geotextiles.
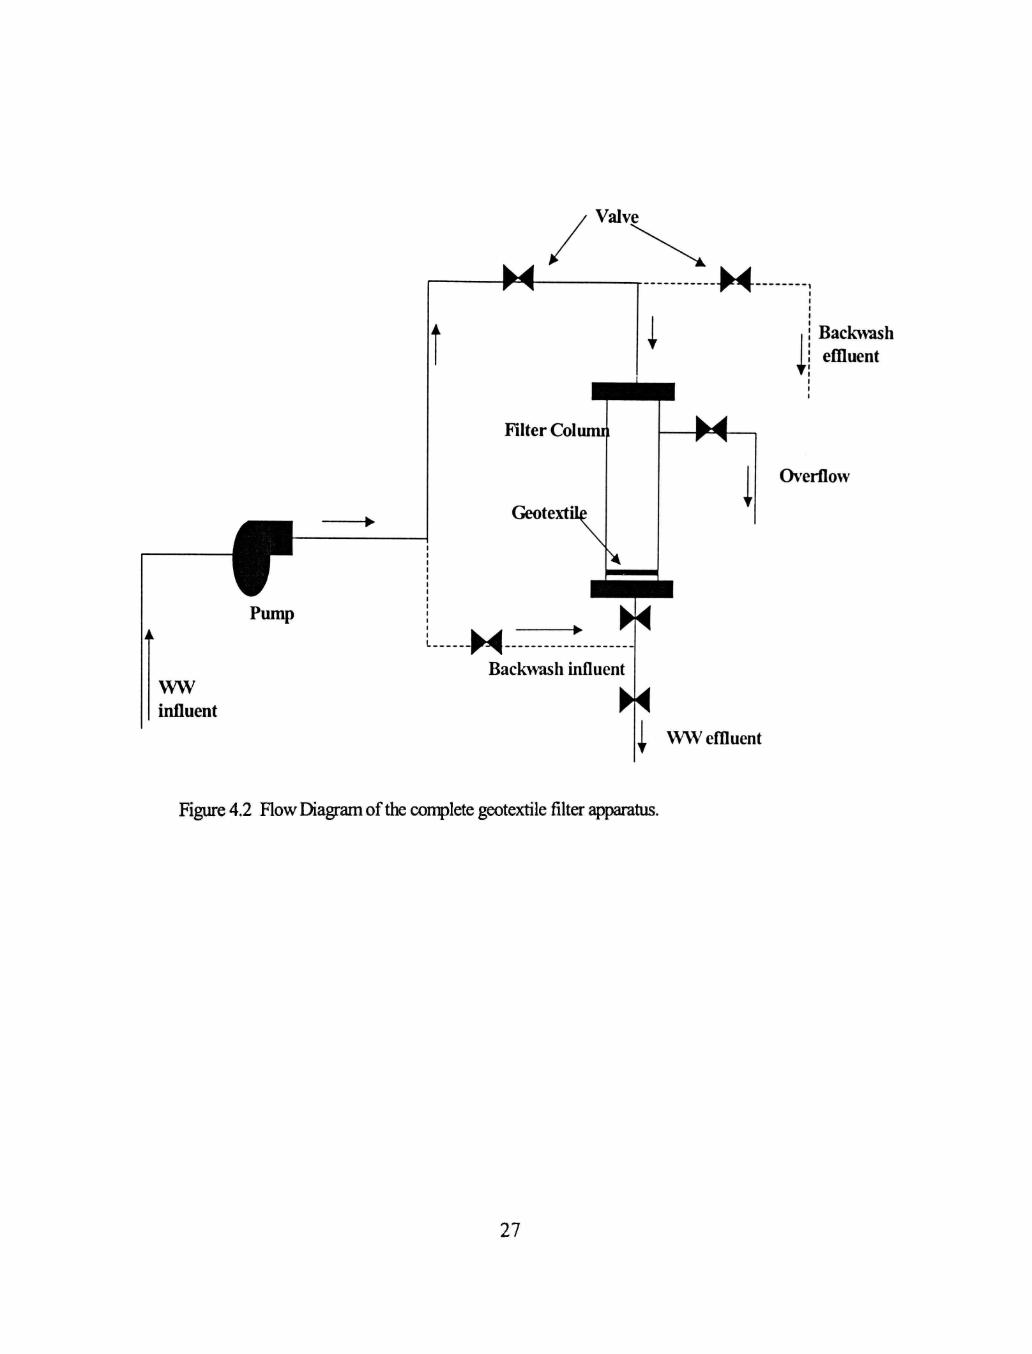
A centrifugal pump was used to pump wastewater into the filter column. The
same pump was used for backwashing the geotextile with tap water. For this purpose, a
network of PVC pipes was constructed to serve both the above purposes. A sketch of the
complete network of the PVC pipes and the flow diagram is shown in Figure 4.2.
Regulating valves were installed at required locations in the pipe network. Regulating
valves help in maintaining a constant influent flow rate into the filter column. Additional
valves were installed in the pipe network for collecting influent and effluent samples at
different time intervals during the course of an experiment. The apparatus was
constructed to serve the following purposes.
a. Allowing the passage of wastewater through the geotextile in a downward
direction.
b. Backwashing the geotextile in the upward direction.
c. Influent flow rates can be altered using the pump and the valves.
20
d. Geotextiles can be replaced in the filter column easily and whenever required.
4.2.3 Wastewater
The wastewater used in this study was collected from the Southeast Water
Reclamation Plant of the City of Lubbock, TX. The wastewater was either collected and
brought back to Texas Tech University for testing, or the tesfing was performed at the
treatment plant. Samples were collected from the following locations for testing.
a. Raw influent - that has passed only through the screens,
b. Effluent following the primary sedimentation - before entering the aeration
basin, and
c. Effluent following the secondary sedimentation - before entering the filtration
units.
In addition, some experiments were conducted on diluted wastewater to examine
geotextile filtration behavior with SS concentrations less than those found at the
treatment plant.
4.3 Methods
The wastewater was pumped from a tank into the filter column, where the
geotextile was placed, at a rate of 3 L/min (0.31 m of wastewater/m' of geotextile surface
area/min). A constant head of 30.5 cm (see Figure 4.1) of wastewater was maintained
above the geotextile, throughout the experiment. Overflow was allowed to flow back to
the tank or wasted. The flow diagram and the skeleton of the apparatus are shown in
21

Figure 4.2. During the course of every experiment, the influent flow rate was maintained
constant at approximately 3 L/min. When the effluent flow rate has decreased
significantly, by around 90%), the geotextile is assumed to be clogged. Most of the
experiments were terminated at this stage. But in some experiments, the clogged
geotextile was backwashed using tap water. The purpose of backwashing is to reuse the
same geotextile in order to study the reuse and regenerating potenfial of the geotextiles.
During backwashing, the tap water is pumped, with a high pressure, in the upward
direction from the bottom of the geotextile. This backwashing of the geotextile results in
removing out most of the solids trapped on or inside the geotexfile. Also, the volume of
backwash water used is around 15L, with which a near 100% regenerating capability of
the geotextile was achieved. Approximately, 15L of water was used during each
backwash cycle.
During the course of every experiment, the influent and effluent wastewater
samples were collected at various intervals of time for monitoring their characteristics in
the laboratory. Influent samples were collected at different intervals of time, just before
the inflow port. The effluent samples were collected from the outflow port. The effluent
flow rates were measured using a graduated cylinder and a stopwatch.
Preliminary investigations involved performing experiments on different
geotextiles, Geotexfiles A through I (Table 4.1). Additional investigations were
conducted on Geotextiles A and I. Experiments were also performed with combinations
of two of the same or two different geotextiles placed in series. In combinations, a
geotextile with a larger opening size was placed directly on top of a relatively smaller
22

opening sized geotextile. Table 4.2 presents the combination of geotextiles and
wastewater types used in the investigation.
4.4 Analyfical Work
The following parameters were monitored at various intervals of time, during the
course of every experiment: (1) influent and effluent SS concentrations, (2) influent and
effluent COD (Chemical Oxygen Demand) concentrations, and (3) effluent flow rates.
The samples were analyzed for SS and COD concentrations in the environmental
laboratory at Texas Tech University by following the ASTM - Dl 888-78 or the Standard
Methods for wastewater analysis, SM-2540D.
23

Table 4.1 Properties of Nonwoven Geotextiles Used in this Research.
Geotextile
A
B
C
D
E
F
G
H
I
STYLE
(as per Co.)
HON
160N
llOON
4510
1120N
4512
4514
1160N
4516
Unit
Weight
(g/sq-m)
129
217
NA
339
387
406
474
542
542
Thickness
(mils)
55
75
100
109
120
122
122
150
160
Apparent
opening size
(mm)
0.212
0.212
0.15
0.15
0.15
0.15
0.15
0.15
0.15
Permittivity
(1/sec)
2.0
1.5
NA
1.2
0.9
0.9
0.8
0.7
0.7
Flow rate
(gal/min/sq-ft)
150
120
NA
85
65
65
60
50
50
24

Table 4.2 Experiments Performed on Wastewater and Geotextiles.
Geotextiles
Tested
I
A
I + A
Raw
Wastewater
after the
screens
*
*
Wastewater
Following the
Primary
sedimentation
*
*
*
Wastewater
following the
Secondary
sedimentation
*
*
Backwash
Experiments
performed
*
Experiments Performed
2S
INFLOW
TOP CAP
A
45.7 cm
GEOTEXTILE
V
[/ \}
10.2 cm < >
OVERFLOW
30.5 cm
IRON MESH
V
BOTTOM CAP
, , OUTFLOW
Figure 4.1 Details of the filter column used to test the geotextiles.
26
Valve
Pump
WW influent
!
M i
Filter Column
Geotext
-M Backwash influent
1
M
II Backwash eflluent
Overflow
WW effluent
Figure 4.2 Flow Diagram of the conplete geotextile filter apparatus.
27

Figure 4.3 Filtration Column setup during Field Testing.
28

CHAPTER 5
RESULTS AND DISCUSSIONS
5.1 Preliminary investigafion
Preliminary invesfigations involved performing experiments on nine geotextiles.
Geotextiles A through I, for understanding the filtration performance of these geotextiles
with respect to the removal of SS in wastewater. These investigafions resulted in
determining the efficiencies of the selected geotextiles. Results of these initial tests are
shown in Table 5.1. Approximately, 19 L of raw influent wastewater, with an average SS
concentrafion of 210 mg/L, was used for all geotexfiles by a batch process. Geotextile A
had a SS removal efficiency of 23%) and COD removal efficiency of 3%. The geotextile I
had a SS removal efficiency of 48%) and COD removal efficiency of 31%. The
intermediate geotextiles, Geotextile B through H had SS removal efficiencies in the range
from 27%) to 47% (Table 5.1). Table 5.1 shows some of the key properties of all the
geotextiles tested with their corresponding SS and COD removal efficiencies. The
removal efficiencies shown in the Table 5.1 represent the mass removal efficiencies.
From Figures 5.1 and 5.2, it can be concluded that the performance of the geotextiles and
their properties are correlated. The SS or COD removal efficiencies have increased with:
a. An increase in unit weight and thickness of the geotextiles (Figure 5.1).
b. A decrease in apparent opening size and permittivity of the geotextiles (Figure
5.2).
29
In Figure 5.1, the sudden change in the SS removal efficiency for Geotextiles E,
F, and G is attributed to different weights (Table 5.1). In Figure 5.2, the change in the SS
removal efficiency of geotextiles (Geotextile E and F and Geotexfiles H and I) are
slightly different because the Geotextiles E and F had nearly the same permittivity but
different unit weights (Table 5.1), which might have affected their removal efficiencies
and the same reason applies for Geotextiles H and I. It is evident from these results that
Geotextile A, with a thickness of 55 mils, is the most inefficient and Geotexfile I, with a
thickness of 160 mils, is the most efficient. Hence further experiments were conducted on
these two particular geotextiles i.e., style A and style I, because they represent the
extremes with respect to removal efficiencies. Results from preliminary investigations
did not reveal much information about a geotextile's performance in removing suspended
solids (SS) at various intervals of time during the course of the experiment. Addifional
experiments were performed on two geotextiles, Geotextiles A and I, using wastewater
from different locations in the treatment plant.
30

Table 5.1 Properties of geotextiles, used in the preliminary investigations, and their partial SS removal efficiencies when experiments were conducted with 19L of raw influent wastewater by batch process
STYLE
A B C D E F G H 1
Unit Weight (g/sq-m)
129 217 N/A 339 387 406 474 542 542
Thickness (mils)
1mil=1/1000in 55 75 100 109 120 122 122 150 160
Apparent opening size
(mm) 0.212 0.212 0.15 0.15 0.15 0.15 0.15 0.15 0.15
Permittivity
(1/sec) 2.0 1.5 1.3 1.2 0.9 0.9 0.8 0.7 0.7
Flow rate
(gal/min/sq-ft) 150 120 NA 85 65 65 60 50 50
S.S. removal efficiency
(%)
23 27 32 32 34 37 41 47 48
31

50 -(%)
^ 40 -c at o
E 30 -re ^ 2 0 -E at u CO 1 0 -CO
0 -
• A
1 1 1
• B
C •
I
• D
G • • F
• E
1
H •
1
• i
20 40 60 80 100 120
Thinkness (mils.) 140 160 180
Figure 5.1 Correlation between thickness of the geotexfile and their relative partial removal efficiencies.
DU -
55 50 ->• o « 40 -o E * 30 -re > o E 20 -at k.
W . „ CO 1 0 -
0 -
1 $ H
1
G • F
• E
r
D • •
C B •
I
• A
1
0.0 0.5 1.0 1.5 Permittivity (1/sec)
2.0 2.5
Figure 5.2 Correlation between permittivity of the geotextiles and their relative partial removal efficiencies.
32

5.2 Geotextile I
For Geotextile I, experiments were performed using three different sources of
wastewater which are raw influent, effluent following primary sedimentation (with two
different ranges of suspended solids concentration 275 + 25 mg/L and 350 + 25 mg L)
and effluent following secondary sedimentation. Results from these tests are presented in
Table 5.2. The effluent flow rate, and the influent and effluent SS and COD
concentrations at various intervals of filtrafion fime during the course of every
experiment are shown in Table 5.2. Backwash was not performed for these experiments.
Experiments were terminated when the effluent flow rate has decreased by approximate!)
90%. Table 5.2 shows that the SS removal efficiency of 81.8% was achieved with raw
wastewater and in the range of 75 to 80% with the effluent from primary sedimentation.
This geotextile also achieved a COD removal efficiency of 73.8% with effluent from
primary sedimentation and 50.5% with the raw wastewater. It is evident from Table 5.2
that SS and COD removal efficiencies varied with the source (in terms of location in the
treatment plant) of wastewater may be due to a number of reasons such as the time at
which a particular experiment was terminated or due to changes in the characteristics of
the solids such as particle size or particle specific gravity. Geotextile I had a clogging
time of around 17 min for the raw wastewater trial, having SS concentration of 200 + 25
mg/L. Based on the results in Table 5.2, the Geotextile I had a higher clogging time of 17
min with raw wastewater (having SS concentration of 200 + 25 mg/L), when compared
with the use of effluent from primary sedimentation having a higher range of SS
concentrations. The Geotextile I had two different clogging times when the same source.
33

i.e., effluent from primary sedimentafion, was used. This is due to the change in their SS
concentrations. The geotexfile I had an approximate clogging time of around 7 min with
the effluent from primary sedimentafion with SS concentration of 275 + 25 mg/L and
around 13 min when the effluent from primary sedimentation had a SS concentration of
350 + 25 mg/L. These two experiments were performed at different times on different
days, hence the change in the characteristics of the SS, i.e., the variation in the size
distribution of the SS in these two sources.
The variation of effluent flow rates with respect to filtration time is represented in
Figure 5.3. This curve resembles a negative exponential curve. Figure 5.4 also shows a
curvilinear variation of SS removal efficiencies with filtration time and it resembles a
logarithmic curve. This decrease in effluent flow rates (Figure 5.3) and increase in SS
removal efficiencies (Figure 5.4) with the filtration time, is due to the formation of a thin
layer of solids above the geotextiles medium. This layer is called a filter-cake, because it
also has filtering characteristics. This cake acts as another filter medium above the
geotextile filter, and is responsible for retaining most of the fine SS in wastewater. With
filtration time, the thickness of the filter-cake increases, which results in decreasing
effluent flow rate and increasing SS removal efficiency with time. It should be noticed
that all the experiments were not performed at the same time in the treatment plant. So,
physical, chemical and biological characteristics in the wastewater may differ from
experiment to experiment. Also, the particle size analysis of influent and effluent
suspended solids was not performed. Hence at this stage, an in-depth explanation of the
shape of the curves (Figures 5.3 and 5.4) cannot be presented. A low SS removal
34

efficiency of only 14.3 % was achieved with this geotextile after 2 hours when the
effluent from the secondary sedimentafion tank, with S.S. concentration in the range of
10-20mg/L, was used. This may be related with very low influent SS concentrations, and
also due to the colloidal nature of solids.
35
<L> »_
g c
to ^
to C3
O
(a
00 ra G > CO 5:^ «
^ S B 7^ ^'^ i i C G •g '? -2
<L) 2 t ^ O CO * i
G J3 - S
4> C to
G C <l>
5 6 '" tS -t* G ^ h> ^
> O
B u
to
G ^ <U G
C G o) o < " > • . . - I
^ S Q ^ ^ O
G ' ^ 3 «-" G
^ -a 00 C N
»r! <L>
cd H
CO
o > E ^ ^ • - O ^ Q !t= O <" O
I 8 = r = / -» C E Q G UJ O •£
O o
* - C ' - ^ C o —' 3 - ^ O )
£ O 3 O
0> Tl; 00 i q <d CD a> o CO TT T t i n
O -r - CO r^ • - i n CM CO T f CO CO e g
CO T T CO C\J O T-^ CO X-* CO T t Tj- i n
^ -r - i n 0 0
T f CJ> T-' CO CO CO i» - r^
o T- t^ ao CNi cvi csi CNJ
C3) •«- i n o . - ^ 1 ^ O h - CD C CO CO CNi CM
o in o o i n i n i n 0 0 CO CO CD i n
CO
o
C/3
E CD
<u o = -
^ CO E
U <-> CJ) ^ CO E - CO ""
CD o CO o q
•"- CD i r i x-^ - ^ r^ r^ 0 0
If? o in o ^ CO i n ^ t
E ^3 CO II 0 , " ^ TJ- CM CO
S TJ- 1 - CO CO
CO in in in in
o
•M- 0 0 i n cj^ .-.^ T - CO T t CM C CM T - T - , -
E
0 0 T t CO ^
_ • • • o ^ CO O 00 oo C l o f^ (^ "^
O ) -
i n r->
CM S o in o j / . ^ 0 0 CD i n
E
CD 0 0
in o in o C31 O CM CM •«- CM CM CM
5 2 I UJ O > - '
O
at O . CO
Q. X
UJ
0) • - • CO
o
i n CO CO i n r^ Tj- CO CM
CD O CD CD
T - r^ CNJ " ^
• i ^ . C (/)
$ $ W D 0) | g IS 2 2
CT3 • - • »n U)
i n
CM
II
o o o o o c CD r«- o in O CM CM CO CM o
CD CO CJ> CM C7) Tj- O O ) i n i n i n Tj-
CO
II
To
o
"c 0) 3 CJ) h-. 0 0 t ^
* ^ CO CT> cri i r i . E TT i n CO h *
CD i n in o CO ^ " T-^ o
O )
E CM 5S Ji "^ in CM 0 0 CO •«- =4 + 1 T - -r- <r- " J
O i n
h-
i n T j -1 ^
h -
o CO r
r*
i n CO f^
h«-
o CM h-
CD CD O
CD CD CD
CO
o o in in T - CM T - 1 -
co CO
a> 00 3 . ^
i n CO
T t CM
CD CD
o CD
c CO
T - CO i n r^
§ 1 S i 12 c «> 3 I E 0) TO
cvi 2J*S
CO
II
6 o in C CO CO O CO CO
o CO
CO
o o CD i n CO CO
c in o 0) i n CD Z3 .^•
CM T -CM T -
O O O
O
CD O )
c (0
CO CD O ^
c en c
c o
UJ a CO
^ (0
>., ^ " = c F Q) I.E
g "fo 0) (0
°--6 o
c E ::] CO II
(D
CD
$ O
•4-^ C <D 3 c: C
CD p p in CD CD i n 1 ^ T - CM T - T -
p p p p CO CO CO CM
o o o CM CO <D <J> \Z
c <D D
E 111
c ^ ^ l C 03 CO
o § ^
c g "TO
0)
36
£ E
2 $ o
C 0) _3 !» • > ^ UJ
2 ^
1.8 i
1.6 -
1.4 i
1.2!
1 ^
0.8
0.6 T
0.4 -
0.2
0
0
Expt 1:Raw influent
•—Expt 2;Effluent from primary sedimentation(200-300mg/L)
A—Expt 3:Effluent from primary sedimentation(300-400mg/L)
6 8 10 12
Filtration time (min.)
14 16 18
Figure 5.3 Variation of effluent flow rates with filtration time for experiments K 2. and 3 performed on Geotextile 1.
g
enc5
e
ffic
i
re
.S.
rem
o
to
90.0
80.0
70.0
60.0
50.0
40.0
30.0
20,0
10.0
0.0 0
-•—Expt 2:Effluent from primary sedimentation(200-300mg/L)
-A—Expt 3:Effluent from primary sedimentation(300-400mg/L)
8 10 12
Filtration time (min.)
14 16 18
Figure 5.4 Variation of Suspended Solids removal efficiencies with filtration time for experiments 1, 2, and 3 performed on Geotextile 1.
37

5.3 Geotexfile A
With geotexfiles A, only the effluent following primary sedimentation (with three
different ranges of suspended solids concentration 150 + 25 mg/L, 240 + 25 mg/L and
310 + 25 mg/L), was used. In the first phase (Case 1), approximately. 95 L of effluent
wastewater (from primary sedimentafion), having SS concentration in the range of 300 to
400mg/L, was brought to the Texas Tech University from the treatment plant, and diluted
with fresh tap water, in a 1:3 ratio, in order to get a SS concentrations of 150 + 25 mg/L.
The second and the third phase experiments were conducted at the treatment plant. These
results can be found in Table 5.3. Effluent flow rate, influent and effluent SS and COD
concentrations at various intervals of filtration time during the course of every
experiment are also presented in Table 5.3. Backwash was not performed for these
experiments. The experiments were terminated when the effluent flow rate was decreased
by around 90%. Table 5.3 shows that Geotextile A was able to achieve a high SS removal
efficiency of 79.3% with the wastewater having SS concentration of 150 + 25 mg/L and a
high COD removal efficiency of 46.8% with wastewater having SS concentration of 240
+ 25 mg/L. Geotexfile A had varying SS and COD removal efficiencies (Table 5.3),
when wastewater with different ranges of SS concentrations was used. This may be
mainly due to changes in physical, chemical or biological characteristics of SS in
wastewater, taken from different locations in the treatment plant. This geotextile clogged
in just around 7 min. when effluent from primary sedimentation, with S.S. concentration
of 240 + 25 mg/L, was used and it had a high clogging time of around 45 min. with the
diluted wastewater (SS concentration of 150 + 25 mg/L). Based on the above results, the
;8

geotextiles A, had a shorter clogging time with influent wastewater, having SS
concentrafion of 240 + 25 mg/L, when compared with the influent wastewater having SS
concentrafion of 150 + 25 mg/L.
The Geotextile A had three different clogging times when the effluent from
primary sedimentafion, was used. This is due to the change in their SS concentrations.
The Geotexfile I had a very short clogging time of around 7 min. with the effluent from
primary sedimentation with SS concentrafion of 240 + 25 mg/L and relafively high
clogging time of more than 37 min. when the effluent from primary sedimentafion with
SS concentration of 310 + 25 mg/L was used. These two experiments were done at
different times on different days, hence the change in the characteristics of the suspended
solids in the same source. In the latter case, even though the source has high SS
concentrafions (310 + 25 mg/L), the clogging time is high comparatively, which may be
attributed to change in SS particle size distribution in the wastewater.
Figure 5.5 shows a curvilinear variation of effluent flow rates. These curves
resemble negafive-exponential curves. Figure 5.6 also shows a curvilinear variation of SS
removal efficiencies with respect to filtration time and these curves resemble logarithmic
curves. There is a decrease in effluent flow rates (refer Figure 5.5) and increase in SS
removal efficiencies (refer Figure 5.6) with the filtrafion fime. This is due to the
formafion of a filter-cake above the geotextile medium, as explained in the previous
section. This filter-cake in turn acts as an additional filter, resulting in retaining more
solids with respect to time. Also, the curves in both Figures 5.5 and 5.6 have different
39

start and end points due to the changes in time instances at which the first and the last
effluent flow rates were measured.
40

m
4-> l - l
ca cd
CO
o > E ^ ^ £.«5S Q : ^ ^ o ^ o ^ ^ ^ 9> 8 -3 " O) e Q E UJ O -=-o
o • - C ..-V
E o _l <D O -"^ 3 " en !^ Q E
O ^^ CO .^ > i^ o <J b <u ^
CO Q) CO *-. CJ
fflu
en
S co
n
mg/
L)
Lu ; « • ' ~ ' CO ^^ cJ • • - • Z l , ^ ^
S 8 d 3 O C3) ' S CO E C " . — ' — CO *- o <r-c t:; c - ? l £ ^ ^ UJ o —
Tim
e (m
in)
cod ( / ) CJ)
t. #
flue
nc.
Q. C O X — O
UJ
<D O O c: c c o o o Q Q Q o o o z z z <D <D d )
c c c O O O
O O Q 4 - « .<-> « . <
o o o Z Z Z
0) O 0) c c c o o o Q O Q • - • * - • • - •
o o o Z 2 Z
p CO CO r^ iri cj> CO CD 1 ^
o i n o o> i n CO
t n o i n TU- CD "«^ T— T - T—
o i n CD CO CM p b cJ c>
i n o i n T - CO - ^
^ i — - ^
CD <D — . O C3) in T ^ ^ o 2 +1 w > o "O 6 in 0)
^ 3
T - CO h^ CO
CO i n CO CD CM CO - ^ Tj-
r>- o o o CM i n T - o^ • ^ CO CO CM
i n i n •«- i n i n T f i n Tf in in m in
p O CO - ^ 00 CM b rv! T - i n r - r -
m o LO o
;;r ^ r §
in o in in T - i n i n CD CM CM CM CM
T - CD T t T -p CO p CO CM T-' b b
•r- CO i n r^
ro CM
E •"' T 3 CM <D > - ^
CM E
h-. p rr p CO C7> CD <XJ T - T - CM CM
T T CO i n i n CO O CO - ^ CO T T CO CO
CM CO i n i n CM o i n CO Tt i n r t - ^
.^ -^ -^ p K / cjj CO co' • ^ T- CM CM
o o in in CD i n - ^ r r CM CM CM CM
o o o in 00 ^ CM CO CM CO CO CO
i n CD CO CO OO N- T T t -CM T-^ T - ' 1 - ^
„ 00 N- r^ " T - CM CO
C CM 5 +1 JZ o
xz «—-CO
41

3.00
-•—Expt 1:Effiuent from primary sedimentation(100-200mg/L)
-•—Expt 2:Effluent from primary sedimentation(200-300mg/L)
-A—Expt 3:Effluent from primary sedimentation(300-400mg/L)
10 20 30 Filtration time (min)
40 50
Figure 5.5 Variafion of effluent flow rates with filtration time for experiments 1, 2, and 3 performed on Geotextile A.
140.0 i
(%)
ncy
eff
icie
"5
S.
rem
ov
</>
120.0 J
100.0
80.0
60.0
40.0 '
20.0 :
0.0 -
0
-•—Expt 1:EffIuent from primary sedimentation(100-200mg/L)
••—Expt 2:Effluent from primary sedimentation(200-300mg/L)
-^—Expt 3:Effluent from primary sedimentation(300-400mg/L)
10 20 30
Filtration time (min)
40 50
Figure 5.6 Variation of Suspended Solids removal efficiencies with filtration time for experiments 1, 2, and 3 performed on Geotextile A.
42

5.4 Combination of Geotextiles (I+A)
Experiments were performed with Geotextiles I and A, placed in series (the
inefficient one i.e., Geotexfile A resfing directly above the Geotextile I, the efficient one)
to determine if combination of geotextiles can produce much higher SS and COD
removal efficiencies and higher clogging time when compared with the use of single
geotextile. Experiments were performed using two different sources of wastewater,
effluent from primary sedimentation (with two different SS concentrations 275 + 25
mg/L and 325 + 50 mg/L) and effluent from secondary sedimentation. Results are show n
in Table 5.4. Table 5.4 shows the effluent flow rate, influent and effluent SS and COD
concentrations at various intervals of filtration fime during the course of every
experiment. Backwash was not performed for these experiments. The experiments were
terminated when the effluent flow rate has decreased by around 90%. A SS removal
efficiency of 83.7% and a COD removal efficiency of 78.0% were achieved with the
effluent from primary sedimentation.
Figure 5.7 shows the variation of effluent flow rates. Figure 5.8 shows the
variation of SS removal efficiencies with respect to filtration time. This combination oi
two different geotextiles (I+A) had a clogging time of around 7 min. when effluent with
SS concentration of 275 + 25 mg/L, was used, and a clogging fime of around 9 min.
when the effluent, with SS concentration in the range from 325 + 50 mg/L, was used.
This implies that in the latter case, a higher clogging time was achieved by this
combination of geotextiles when the same source had a relafively high range of SS. Ihis
may be attributed to the variation in the size distribution of SS, in both the cases. Another
43

reason for this may be due to the fact that the experiments were performed at different
times the day. The decrease in effluent flow rate and increase in SS removal efflciencies
(refer Figures 5.7 and 5.8) with filtration time is due to the formation of filter-cake abo\e
geotextiles' surface, as explained earlier. With the effluent from secondarv
sedimentation, SS removal efficiency of only 12.5% was achieved, after 2 hours, with
this combinafion of geotexfiles. This may be due to very low range of SS concentrations,
in the range of 10 to 20 mg/L, and may also be due to a high fraction of colloidal solids.
Figures 5.9 and 5.10 show the variafions of effluent flow rates and SS removal
efficiencies, respectively, with respect to filtration fime for the geotextiles I. A and their
combination (I+A), when the effluent from primary sedimentation with SS concentrations
in the range of 200-300mg/L, was used. Figure 5.9 shows the variation of effluent How
rates for Geotexfiles I, A and combination of geotextiles (l+A), have similar shapes.
Figure 5.10 shows the curves, for SS removal efficiencies for Geotextiles I, A and L .\,
having different initial efficiency values but all the curves finally merge nearly at the
same point indicating nearly the same final SS removal efficiencies.
Figures 5.11 and 5.12 show the variations of effluent flow rates and SS removal
efficiencies, respectively, with respect to filtration time for the Geotextiles I, A and their
combination (1+A), when the effluent from primary sedimentation with SS concentrations
in the range of 300-400mg/L, was used. In both the Figures 5.11 and 5.12. the curves for
Geotexfiles I and I+A have similar shapes when compared with that of Geotextile A 1 he
SS removal efficiency curve for the Geotextile A differs greath from the other two
curves because of its low SS removal efficiencies especially when the influent
44

wastewater had very high SS concentrations in the range of 300 to 400 mg/L. when
compared with the use of influent wastewater having relatively lower SS concentrations,
around 200 to 300 mg/L (Figure 5.10).
It is apparent from the results of the experiments performed on Geotextiles I, A.
and I+A that geotexfiles were capable of achieving high suspended solids removal
efficiencies in the range from 70 to 90 % and C.O.D. removal efficiencies in the range
from 50 to 70 %. It can be concluded that the geotextiles were able to achieve ver\ high
SS removal efficiencies, irrespective of concentration in the influent. In contrast, results
show that, when the concentrations of influent SS were very high, in the range of 300 to
400 mg/L, removal efficiencies were higher but with a very low clogging time, less than
10 minutes. These results also show that the geotextiles were able to achieve satisfactor\
removal efficiencies and also have a higher clogging time (more than 15 min.), when the
SS were in the range of 100 to 200 mg/L.
45

bD *^ a • • ^ z r --4 00 C •»-»
==« •> s -a ^ Jc
< § ^ C/5 —— CO
•^^ 4.J 'r\
U ed fa
C4-< 4-> __|
o
o rrt r {
^
com
a o T 3
rme
e, a. CO
men
t
n
fexp
e
o
=3
(1>
c< ^ »r> u
^ 1 1 <
^ cd
H
4 - >
c •-^
CO C! O
• * - >
oca
^^ 4-> C3 Q>
ffer
T:3
o B
from
u;
er t
ake
4—> rrt
^ 4 - > CO cd
^
cd > O a (L> U l
Q O U
s CO GO
CO
cd Ul
^ O
entf
l
p
ofef
fl
a o Cd
c3 >
CO
o > E c 0) (U
JJ
Q ^ o <" O
• CJ
S 8 Z3 "
*= 9 UJ o o CJ
c o CD U 13 .v ^ Q «= O
O — > >*
rem
o "c
ienc
/ r t * = CO (D CO
. * - o
Juen
co
n
it= CO UJ ,^
CO
jen
t co
ne.
'^ CO — CO
jen
t ra
te
*^-^
(1/
C35
h
(1/
D) F
^ o ^ x . ^
_J
F
_J (3) UJ)
min
)
^ ^ ^ LU ^ U J f^
ime
f -
sntS
S
=tt: =)
Exp
t. Infi
'—'
(min
) (m
g/L)
()
1 co
n
CO CO CO
^ • " S n
_ l
O) CO
E s i n "' CM
1 + i n
CM r^
II w>
ci r-O O
CO CO CO CO 4-. i n c 0) _a c
H—
o i n 0) c^ en '^ c to
b o E o ^ c o
CO II
u 1^ $ -r-*
o <f=
c
c -—
fflue
nt
llow
ing
UJ ^
r^ CO "^
CO CM C)
o> h~ i n
7.9
CO
o m
o CO CM
o .r-^
CO
mar
y
' i _
Q.
CO
ai -^
i n a> CM
i n 00 i n
5.9
r^
i n en
o r-. CM
o
CD
i n
enta
tion
F
sedi
Oi CM i n
CO 1 ^ CM
CD 00 i n
3.7
CO
o
i n ""J-CM
CM O
r^
aera
tion)
(D
be
for
i n CO CO
^/^^•^ _ j
d) (D E l o
T— o i n
1 + i n CM r>. CO CM II ^
d o o
CO ^r
CO CD * - CO c (D
_D
C
o i n tD 1 ^ O) ' " c to
.5= i n E " ^ C M
CO II
B u CO ^ CM o <*= c D ^
5= C '—
4 - O )
c .g D ^ -^ O *= ¥,
UJ ^
CM
C3 C7> CO
CO i n ^r-
O) o i n
2.7
CO
i n CM
'
i n CO c>
i n CM , -
CO
mar
y
t _
(J.
CO CO r*.
CO CO X—
o> CJ> • ^
4.3
r-
i n m
o r-C)
CO
o
CO
enta
tion
F
sedi
o 00 r>-
o CM ^^
CO ""d-i n
7.9
r-
i n
o • * c>
o CO o
Oi
aera
tion]
<u
Ibefo
i C_
F ri CO
II
rate
^ o «i=
c
flue
c "—'
uent
!t= UJ
CO
r-CM
i n <-> r-
i n rsi r^
0.0
5.
0
'~
o i n
p CO
o CO
owin
g
m O
oo CM
i n m CO
i n o r^
0.0
2.5
• ~
i n CM
o CO
o CO
onda
ry
o 0)
CJ> o
CM CO
in o h - i n CO CO
in o (J) h~ CO CO
CO 1 ^
Tj- CD T— ^—
o i n i r i CM ' ~ T -
i n o r- in X~ T—
o CO
CO CM
g§
lent
atio
n fil
trat
ion)
iz P
sedi
(b
efo
46

2.5
I '' .2 1.5 -I n L.
i n Q
i 0.5
- •— Expt 1:EffIuent from primary sedimentation(200-300mg/L;
- •— Expt 2:Effluent from primary sedimentation(300-400mg/L
—r
4 10
Filtration time (min)
Figure 5.7 Variation of effluent flow rates with filtration time for experiments
1, and 2 performed on geotexfiles I + A.
90
i 80 -^ 70 -
I 60-i 50 -
n 40 -
1 30
2 20
'" 10 -I 01
0
-•— Expt 1:Effluent from primary sedimentation(200-300mg/l)
- •— Expt 2:Effluent from primary sedimentation(300-400mg/l )
0 4 6
Filtration time (min) 10
Figure 5.8 Variafion of Suspended Solids removal efficiencies with filtration time for experiments 1 and 2 performed on geotextiles I + A.
47

c E
0)
n u o
>»-4-> C
o
UJ
1 -
0.9 ^
0.8 J 0.7 1
0.6 H
0.5 -:
0.4 0.3 0.2 0.1
0 0 3 4 5
Filtration time (min).
Style I
Style A
Style I+A
8
Figure 5.9 Variation of effluent flow rates for geotextiles I, A and 1 +A when wastewater with influent S.S. cone, is in the range of 200 to 300mg/L.
^
0)
> o E u u
U)
90
80
70 o .2 60 u it 50
40
30
20
10
0 3 4 5
Filtration time (min).
4 -Sty le I
• - S t y l e A
^ -S t y l e I+A
8
Figure 5.10 Variation of SS removal efficiencies with filtrafion time for geotextile I, A and 1 +A when wastewater with influent SS cone, is in the range of200to300mg/L.
48

1.4
Style I
Style A
Style I+A
0 10 20
Filtration time (min).
30 40
Figure 5.11 Variation of effluent flow rates for geotexfiles L A and I +A when wastewater with influent S.S. cone, is in the range of 300 to 400mg/L.
90 •-Style
• -Sty le A
^-Style I+A
0
0 10 15 20 25 Filtration time (min).
30 35 40
Figure 5.12 Variation of SS removal efficiencies with filtrafion time for geotextile I, A and I +A when wastewater with influent S.S. cone, is in the range of300to400mg/L.
49
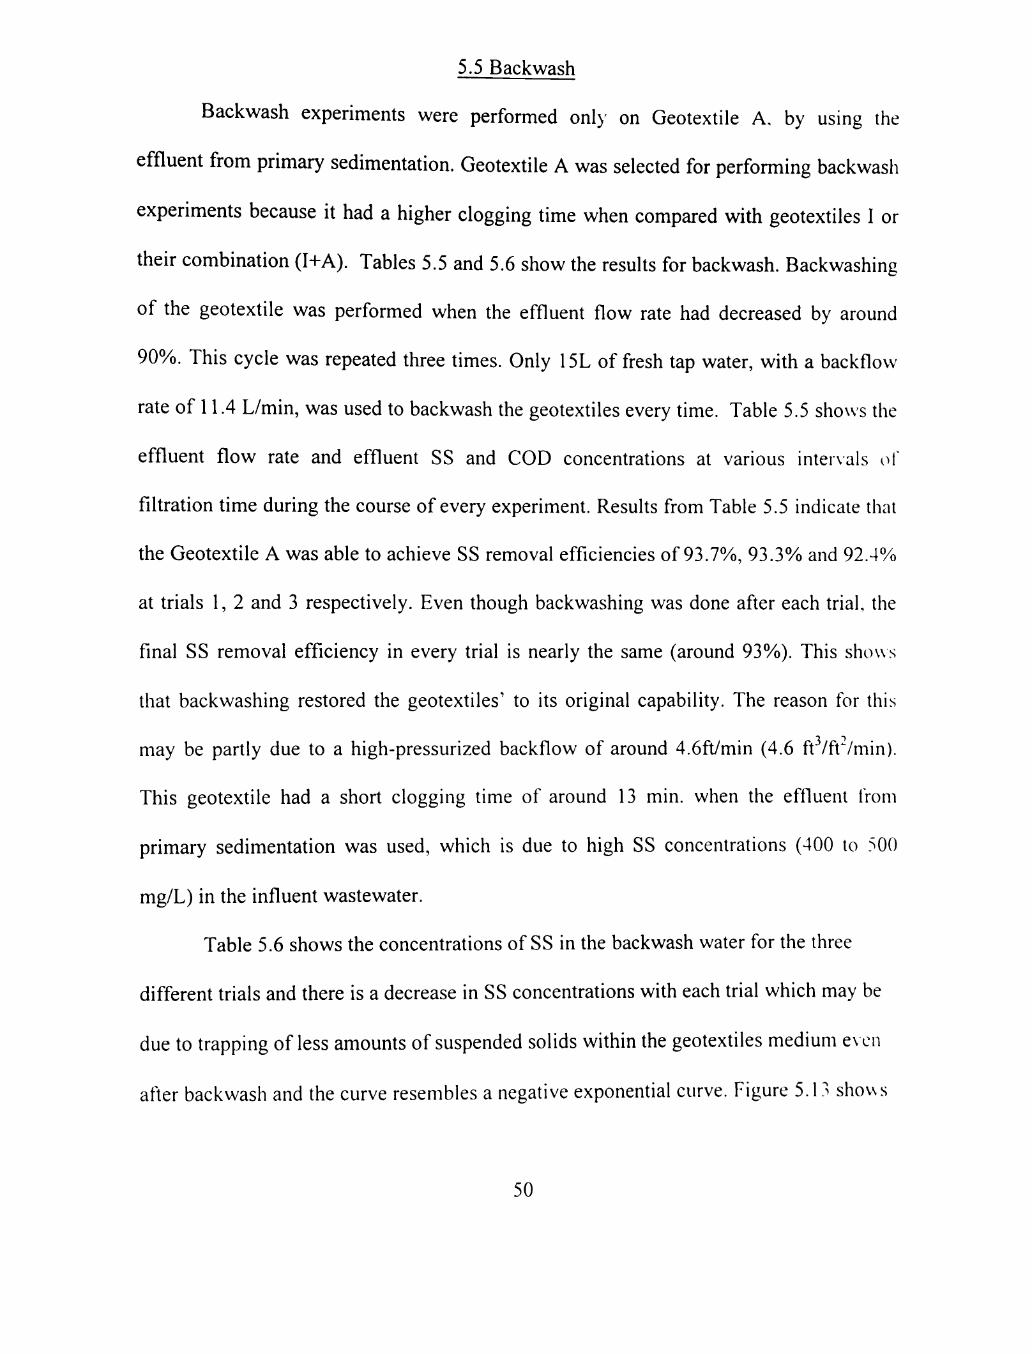
5.5 Backwash
Backwash experiments were performed only on Geotextile A. by using the
effluent from primary sedimentation. Geotextile A was selected for performing backwash
experiments because it had a higher clogging time when compared with geotextiles I or
their combination (I+A). Tables 5.5 and 5.6 show the results for backwash. Backwashing
of the geotextile was performed when the effluent flow rate had decreased by around
90%. This cycle was repeated three times. Only 15L of fresh tap water, with a backflow
rate of 11.4 L/min, was used to backwash the geotextiles every time. Table 5.5 shows the
effluent flow rate and effluent SS and COD concentrations at various inter\als o(
filtrafion time during the course of every experiment. Results from Table 5.5 indicate that
the Geotextile A was able to achieve SS removal efficiencies of 93.7%, 93.3% and 92.4%
at trials 1, 2 and 3 respectively. Even though backwashing was done after each trial the
final SS removal efficiency in every trial is nearly the same (around 93%). This shows
that backwashing restored the geotextiles' to its original capability. The reason for this
may be partly due to a high-pressurized backflow of around 4.6ft/min (4.6 ft /ft^/min).
This geotextile had a short clogging time of around 13 min. when the effluent from
primary sedimentafion was used, which is due to high SS concentrations (400 to 500
mg/L) in the influent wastewater.
Table 5.6 shows the concentrations of SS in the backwash water for the three
different trials and there is a decrease in SS concentrations with each trial which may be
due to trapping of less amounts of suspended solids within the geotextiles medium e\cn
after backwash and the curve resembles a negative exponential curve. Figure 5.13 shows
50

variation of effluent flow rates for the three experimental trials. Figure 5.14 shows
variation of SS removal efficiencies with time, for the three trials of experiments. The
decrease in effluent flow rate and increase in SS removal efficiencies with filtration time
(refer Figures 5.13 and 5.14) due to the formafion of a thin layer of solids (or filter-cake)
on the surface of the geotextiles. It is evident from the Figure 5.14 that all three efficiency
curves were nearly merged. This shows that the nearly 100% regeneration capability of
the geotextile was achieved. By backwashing there is no significant loss of performance
of geotextiles in reducing the suspended solids concentration.
51
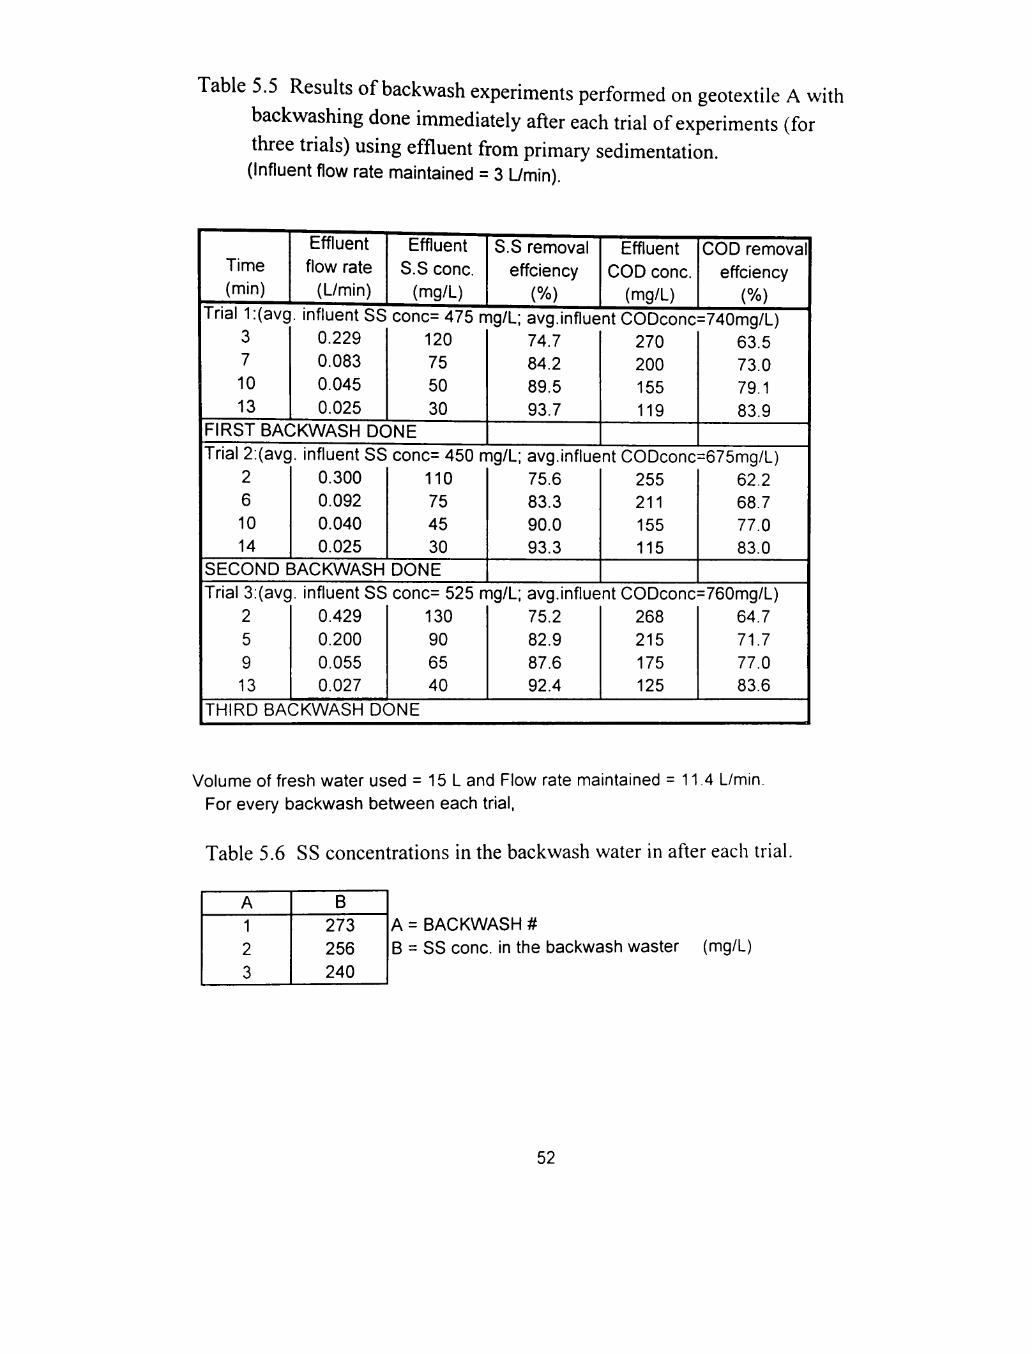
Table 5.5 Results of backwash experiments performed on geotextile A with backwashing done immediately after each trial of experiments (for three trials) using effluent from primary sedimentation. (Influent flow rate maintained = 3 L/min).
Time (min)
Trial 1:(avg 3 7 10 13
Effluent flow rate
(L/min)
. influent SS 0.229 0.083 0.045 0.025
Effluent S.S cone.
(mg/L)
S.S removal effciency
(%)
Effluent COD cone.
(mg/L)
COD removal effciency
(%)
conc= 475 mg/L; avg.influent CODconc=740mg/L) 120 74.7 270 63.5 75 84.2 200 73.0 50 89.5 155 79.1 30 93.7 119 83.9
FIRST BACKWASH DONE Trial 2:(avg
2 6 10 14
. influent SS 0.300 0.092 0.040 0.025
conc= 450 mg/L; avg.influent CODconc 110 75.6 255 75 83.3 211 45 90.0 155 30 93.3 115
SECOND BACKWASH DONE Trial 3:(avc
2 5 9 13
. influent SS 0.429 0.200 0.055 0.027
conc= 525 mg/L; avg.influent CODconc 130 75.2 268 90 82.9 215 65 87.6 175 40 92.4 125
=675mg/L) 62.2 68.7 77.0 83.0
=760mg/L) 64.7 71.7 77.0 83.6
THIRD BACKWASH DONE
Volume of fresh water used = 15 L and Flow rate maintained = 11.4 L/min. For every backwash between each trial,
Table 5.6 SS concentrations in the backwash water in after each trial.
A 1 2 3
B 273 256 240
A = BACKWASH # B = SS cone, in the backwash waster (mg/L)
52

c E
re
o
c 0)
t LU
0.5
0.45
0.4
0.35
0.3
0.25 -
0.2 -
0.15
0.1 ^
0.05 -
0
• - T r i a l 1
• - T r i a l 2
A—Trial 3
6 8 10
Filtration time (min)
12 14 16
Figure 5.13 Variation of effluent flow rates with filtration time during each trial
of experiments.
s? >. () c 0)
ffc
o n > 0 E 0 u
ids
0 (A •D
C u a V) 3 V)
100
9h 90 85 80 75 70 65
60 55 50
0
-•—Trial 1
-•—Trial 2
-A—Trial 3
6 8 10 Filtration time (min)
12 14 16
Figure 5.14 Variation of SS removal efficiencies with respect to filtration time
during each trial of experiments.
53
CHAPTER 6
CONCLUSIONS
Nine nonwoven geotexfiles were tested for SS and COD removal efficiencies for
municipal wastewater. The following conclusions are presented based on the results of
this research.
These investigations revealed that the geotextiles were capable of achieving
suspended solids removal efficiencies in the range from 70 to 90 % and C.O.D. remo\ al
efficiencies in the range from 50 to 70 %. It is evident from the results that the geotextiles
were able to achieve high SS removal efficiencies, irrespective of its range of SS
concentrations in the influent. Based on the results, when the concentrations of influent
SS were very high, in the range of 200 to 500 mg/L. higher removal efficiencies were
achieved but with less clogging time, less than 10 minutes. Considering the applicability
of this technique as a part of wastewater treatment operation, backwashing e\er> 10
minutes may not be feasible.
Results also show that the when the SS were in the range of 100 to 200 mg^L.
geotextiles were able to achie\ e satisfactory removal efficiencies and also have a higher
clogging time. So, this technique may be suitable only for treating low flow wastes and
low strength wastes (SS in the range from 100 to 200 nig/L).
Finally, there is a correlation between the properties of getucxtiles and remtwal
efficiencies. Also, by backwashing, the geotextile can be regenerated to its origmal
filtering capability.
54

Based on the conclusions, the following recommendations are presented:
a. This technique is suitable for treating low flow wastes and low strength wastes,
having suspended solids concentrafion in the range of 100 to 200 mg/L.
b. This technique can be used for treating waste generated from less populated
towns. Also, particular industries can embrace this technique in treating their
wastes, before they dispose off into surface waters.
c. This method can also be used to treat effluents from natural systems, e.g., aerobic
stabilization ponds, which are rich in SS concentrations due to algae growth.
55

CHAPTER 7
RECOMMENDATIONS FOR FURTHER RESEARCH
For further research, the following recommendations can be made:
1. Particle size distribution analysis in the influent and effluent samples should be
analyzed and related with characteristics of geotexfiles, e.g., AOS (apparent
opening size).
2. BOD (Biological Oxygen Demand) analysis on the influent and effluent samples.
3. Determining the optimum amount of backwash water needed to regenerate a
clogged geotextile to its near 100% capability.
4. Use of filtration aids to enhance the clogging time of geotextiles.
56
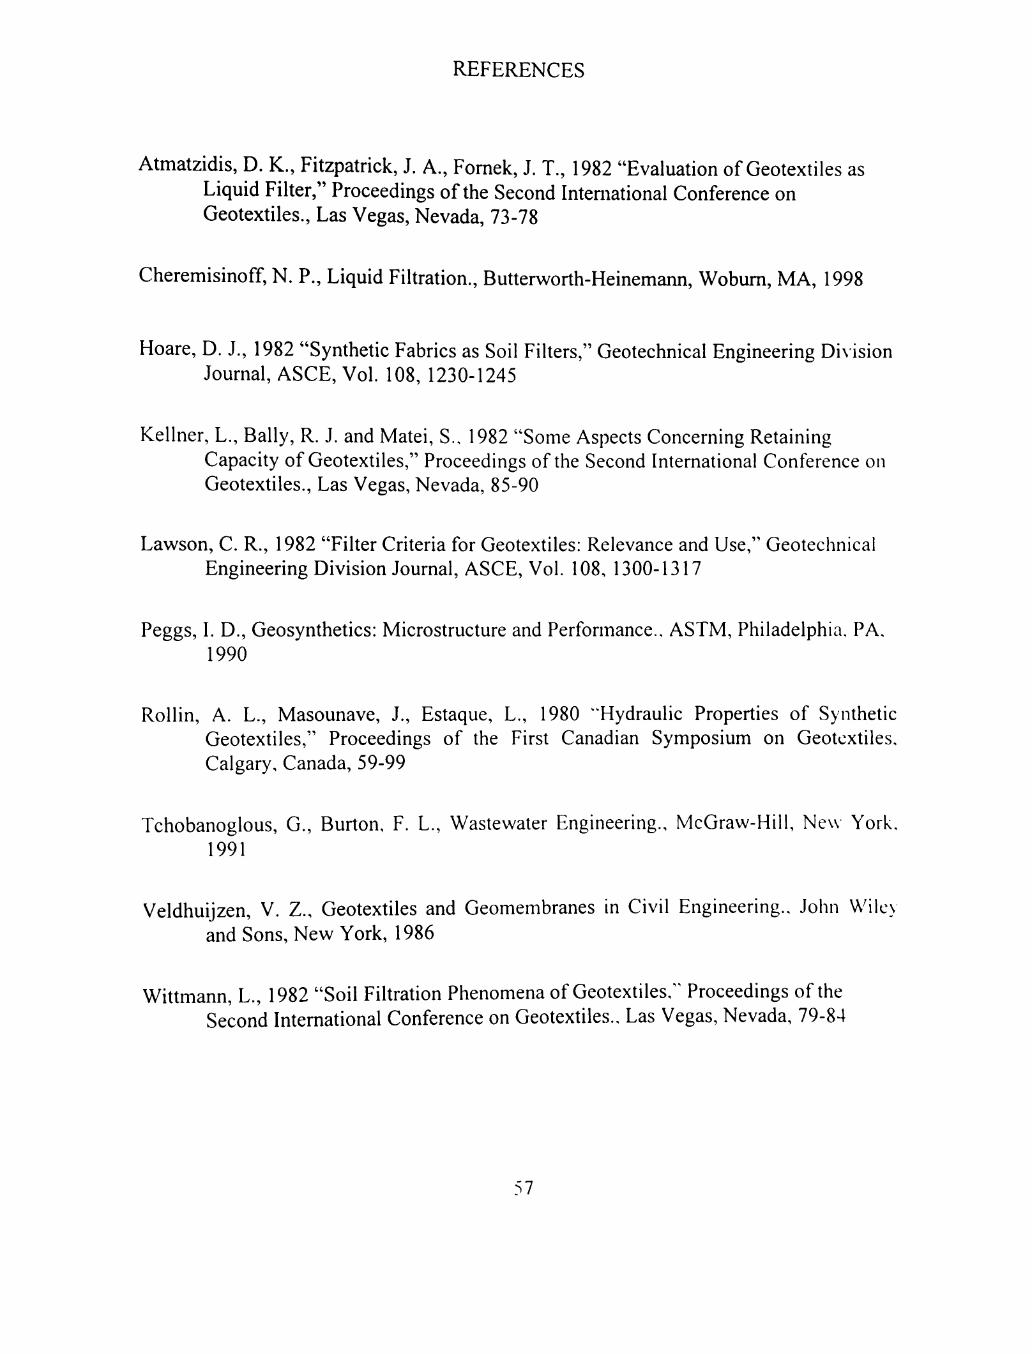
REFERENCES
Atmatzidis, D. K., Fitzpatrick, J. A., Fomek, J. T., 1982 "Evaluafion of Geotextiles as Liquid Filter," Proceedings of the Second Intemational Conference on Geotexfiles., Las Vegas, Nevada, 73-78
Cheremisinoff, N. P., Liquid Filtration., Butterworth-Heinemann, Wobum, MA, 1998
Hoare, D. J., 1982 "Synthefic Fabrics as Soil Filters," Geotechnical Engineering Di\ision Journal, ASCE, Vol. 108, 1230-1245
Kellner, L., Bally, R. J. and Matei, S.. 1982 "Some Aspects Concerning Retaining Capacity of Geotextiles," Proceedings of the Second International Conference on Geotexfiles., Las Vegas, Nevada, 85-90
Lawson, C. R., 1982 "Filter Criteria for Geotextiles: Relevance and Use," Geotechnical Engineering Division Journal, ASCE, Vol. 108, 1300-1317
Peggs, I. D., Geosynthetics: Microstructure and Performance., ASTM, Philadelphia. PA, 1990
Rollin, A. L., Masounave, J., Estaque, L., 1980 "Hydraulic Properties of Synthetic Geotextiles," Proceedings of the First Canadian Symposium on Geotextiles, Calgary, Canada, 59-99
Tchobanoglous, G., Burton, F. L., Wastewater Engineering., McGraw-Hill, New York, 1991
Veldhuijzen, V. Z., Geotexfiles and Geomembranes in Civil Engineering., John Wile\ and Sons, New York, 1986
Wittmann, L., 1982 "Soil Filtration Phenomena of Geotextiles,^' Proceedings of the Second Internafional Conference on Geotextiles., Las Vegas, Nevada, 79-84
57
PERMISSION TO COPY
In presenting this thesis in partial fulfillment of the requirements for a master's
degree at Texas Tech University or Texas Tech University Health Sciences Center, I
agree that the Library and my major department shall make it freely available for
research purposes. Permission to copy this thesis for scholarly purposes may be
granted by the Director of the Library or my major professor. It is understood that
any copying or publication of this thesis for financial gain shall not be allowed
without my further written permission and that any user may be liable for copyright
infringement.
Agree (Permission is granted.)
Disagree (Permission is not granted.)
Student Signature Date