Embed Size (px)
Citation preview

© Oliver Wyman | NYC-MXD15901-001
MODERNIZING THE RAIL INDUSTRY
Jason Kuehn
May 24, 2017

11© Oliver Wyman
My great grandfather said that had he asked his customers what they really needed, they would have said a faster horse.
– William Ford Jr, Executive Chairman Ford Motor Company

The Changing Competitive Environment

33© Oliver Wyman
The near-term environment is favorable to rail as:
Supply chain orientation• Rail has strong retail client relationships• Opportunity for more differentiation beyond simply
distance Photos top to bottom: Wikimedia Commons, Getty Images, Amazon.com media photo
Infrastructure condition• Maintenance deficits• Urban congestion in key markets
Labor market dynamics• Increasing regulations• Continued retention & attraction issues
44© Oliver Wyman
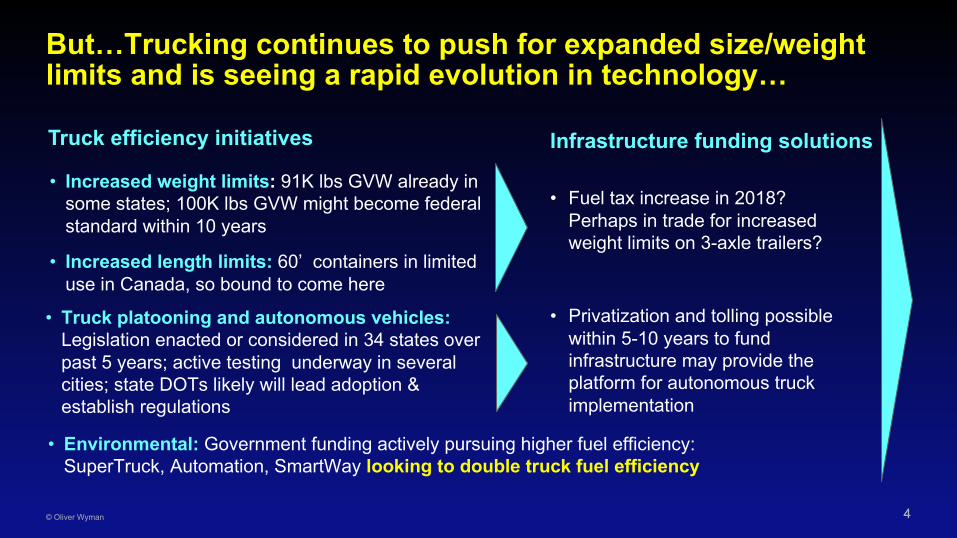
But…Trucking continues to push for expanded size/weight limits and is seeing a rapid evolution in technology…
• Increased weight limits: 91K lbs GVW already in some states; 100K lbs GVW might become federal standard within 10 years
• Increased length limits: 60’ containers in limited use in Canada, so bound to come here
Truck efficiency initiatives
• Fuel tax increase in 2018? Perhaps in trade for increased weight limits on 3-axle trailers?
Infrastructure funding solutions
• Environmental: Government funding actively pursuing higher fuel efficiency: SuperTruck, Automation, SmartWay looking to double truck fuel efficiency
• Truck platooning and autonomous vehicles: Legislation enacted or considered in 34 states over past 5 years; active testing underway in several cities; state DOTs likely will lead adoption & establish regulations
• Privatization and tolling possible within 5-10 years to fund infrastructure may provide the platform for autonomous truck implementation

55© Oliver Wyman
…No similar governmental levers promoting rail efficiency:
• Rail safety: – PTC deadlines approaching but operations
far from stable. Huge cost to railroads– Safety Management System (SMS)
approach more like airlines coming
Recent & Projected Rail Changes
• Commercial regulation: – Rate challenges are difficult, no-win for
regulators; expect continued pushing for reciprocal switching to open up competition rather than overt rate regulation
• Rail mergers: – As logistics gets smarter, national network
may be needed for cost/ market reach. – Reciprocal switching regs could open the
door
• Crew size: – FRA two-person crew size regulation has
been withdrawn.
• Environmental: – Tier 4 was a set back for rail– No further regs as yet for locomotives, but
California is looking at a Tier 5 and talking about zero emissions (e.g., electrics)

66© Oliver Wyman
Railroads must reduce assets and employment levels to compete with driverless trucks
Class I Rail Marginal Operations CostsTrucking Marginal Operations Costs
Train crew costs can’t go to zero due to en route work events. Railroads will have to look at fuel cost, asset utilization & labor productivity in mechanical & engineering functions for additional cost reductions.
Source: ATRI 2015 Report, STB 2015 R-1s, Oliver Wyman analysis
7%
Equipment lease or purchase
Repair &maintenance Tires
Tolls
Insurance & permits
Driver wages & benefits
34%
Fuel 35%
Fuel 19%
Salaries, wages & benefits Casualties &
insurance
Materials, tools, supplies, purchased services, & other
Repair &maintenance
Equipment lease or purchase
Other
Train Crews 22%
Railroad Evolution Requirements

88© Oliver Wyman
Seven ways to improve the railroad industry’s competitive position
Fuel Costs
Maintenance Costs
Asset Utilization
Organization
DisintermediationCapacity Utilization
Automation

99© Oliver Wyman
Solutions: Technological advances in the railroad industry
• Driverless trains
• Yard robots to bleed and inspect cars
• Drones for track inspection
• Automated train dispatching
• Predictive failure analysis for equipment repairs
• Change in fuels– Natural gas– Electricity
• Fuel efficiency– Capture regenerative
braking energy– Battery technology to
level power demand
• Lighter weight equipment
• Longer lived materials
• Better engineering
• Better predictive failure analysis
• Elimination of wayside signalling
• Fewer grade crossings
Automation Maintenance CostsFuel Costs

1010© Oliver Wyman
In 2015, Class I railroads produced: 169% of the revenue ton-miles produced in 1990
Source: AAR, “Analysis of Class I Railroads”, and Oliver Wyman analysis.
40
60
80
100
120
140
160
180
200
1990 1995 2000 2005 2010 2015
Indexed US Railroad Productivity, 1990-20151990 = 100
Railroads must reignite their stalled productivity improvement momentum
…while using:
130% of the freight train-miles141% of the locomotives
80% of the GTMs per horsepower78% of the route miles
85% of the GTMs per horsepower hour

1111© Oliver Wyman
Solutions: Tighter management practices and tools
• Reservation systems
• Dynamic pricing to fill out trains
• Higher train density on the network
Asset Utilization Capacity Utilization• Reduce dwell times
– Less origin / destination dwell time
– Better interchange management
• Shorter, more frequent trains– Fewer intermediate handlings– Shorter dwell between trains
• Better equipment reliability
1212© Oliver Wyman
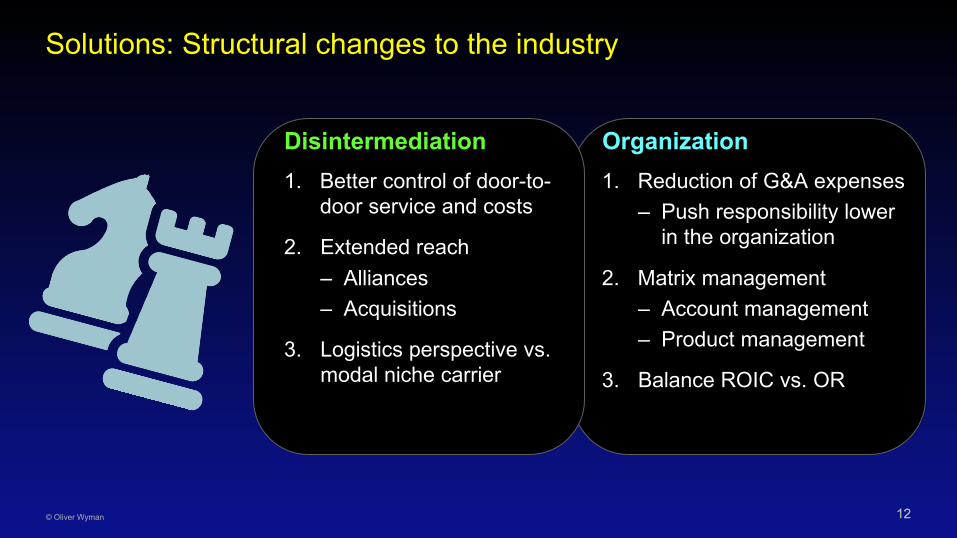
Solutions: Structural changes to the industry
1. Better control of door-to-door service and costs
2. Extended reach– Alliances– Acquisitions
3. Logistics perspective vs. modal niche carrier
1. Reduction of G&A expenses– Push responsibility lower
in the organization
2. Matrix management– Account management– Product management
3. Balance ROIC vs. OR
Disintermediation Organization

Case Study

1414© Oliver Wyman
Reengineered target markets: Germany’s railways are growing due to strong market innovation
• Germany is a large mature market where rail freight is rapidly evolving: 230 competing freight railways
• Growth is driven by new market offers & operational models that are service intensive & asset efficient
• Growth has occurred using less locomotives and rolling stock
-2%
7%
-4% -2% 0% 2% 4% 6% 8%
USA .
Germany .
Sources: AAR Analysis of Class I Railroads, Railway Association of Canada Rail Trends, German Railway Market Analysis, UIC database, Oliver Wyman analysis
Traffic Growth in a DecadeChange in revenue ton-km, 2015 versus 2006

1515© Oliver Wyman
Auto carload rail example: Service and marketThe service offer is port to Stockholm for next morning delivery at 6 am for 15-20 carloads of autos
Destination Stockholm Pittsburgh
Market size 1.5M 2.6M
Distance from port 383 miles 360 miles
Average train speed 45 mph 35-40mph
Time moving in train 8.5 hours 10 hours
A Comparison to the US

1616© Oliver Wyman
Auto carload rail example: Destination ramp
Source: Google Earth
• Over 40,000 units per year
• 3 tracks and approx 2.5 ac
• Spot to pick up – 5 hours
• Located on commuter line with 15 minute headways
Highly dependable rail service combined with client reservations requires a very small auto ramp

1717© Oliver Wyman
Auto carload rail example: The service planThe auto block moves on regular carload trains with a full cycle every two days
Photo source: D. Lehlbach
Service Plan• Load in block as per reservation
• Local to main yard midday
• 2 carload trains with block swap in hump yard
• Local train set out loads at 6 am
• Local train pick up empties at 11 am
• 2 carload trains back to origin yard in the evening

1818© Oliver Wyman
Auto carload rail example: SummarySupply chain transparency facilitates small volumes with high service levels and less than half of the normal rolling stock
Summary• <400 mile haul• 48-hour car cycle• 40,000 units on 2.5 acres• Small tightly controlled car fleet• Next morning delivery• Capacity reserved daily in advance• Very tightly managed supply chain
Photo source: D. Lehlbach