Embed Size (px)
Citation preview
Modeling the SARS epidemic in Hong Kong
Dr. Liu Hongjie, Prof. Wong Tze Wai Department of Community & Family Medicine
The Chinese University of Hong Kong
Dr. James DerrickDepartment of Anaesthesia & Intensive Care
Prince of Wales Hospital
May 13, 2003

Modeling the SARS epidemic in Hong Kong
• We aim to construct a model of the SARS epidemic in community (i.e., we have excluded the outbreaks among health care workers or the “common source” outbreak in Amoy Garden.
• The model only applies to a person-to-person mode of transmission of SARS.

Objectives of the Media Release:
1. Explain the natural course of an epidemic – the relationship between the population that is infectious (including patients and infected individuals who will become patients), susceptible population and immune (recovered) population;
2. Show how the natural progression of an epidemic is affected by the effectiveness and timeliness of public health measures, by introducing our mathematical model;
3. Using the assumptions and limitations of our model, discuss the current situation in terms of the trend of the epidemic and the likelihood of its resurgence;

Dynamics of disease and of infectiousness at the individual level
Times (days)
Clinical onset
Incubation period
Time ofinfection
Resolution
Relapse
Symptomatic periodSusceptible
• immune• carrier• dead• recovered
Dynamics of disease
Onset ofinfectiousness
Latent period
End ofinfectiousness
infectious periodSusceptible
Dynamics of infectiousness

Dynamics of infectiousness at the population level
Susceptible St
InfectiousIt
Recovered / immuneRt
SIR

Basic Reproductive Number (R0)
• The average number of individuals directly infected by an infectious case during his/her entire infectious period
• In a population
if R0 > 1 : epidemic
if R0 = 1 : endemic stage
if R0 < 1 : sucessful control of infection
• If population is completely susceptible
measles : R0 = 15-20
smallpox : R0 = 3 – 5
SARS: ???

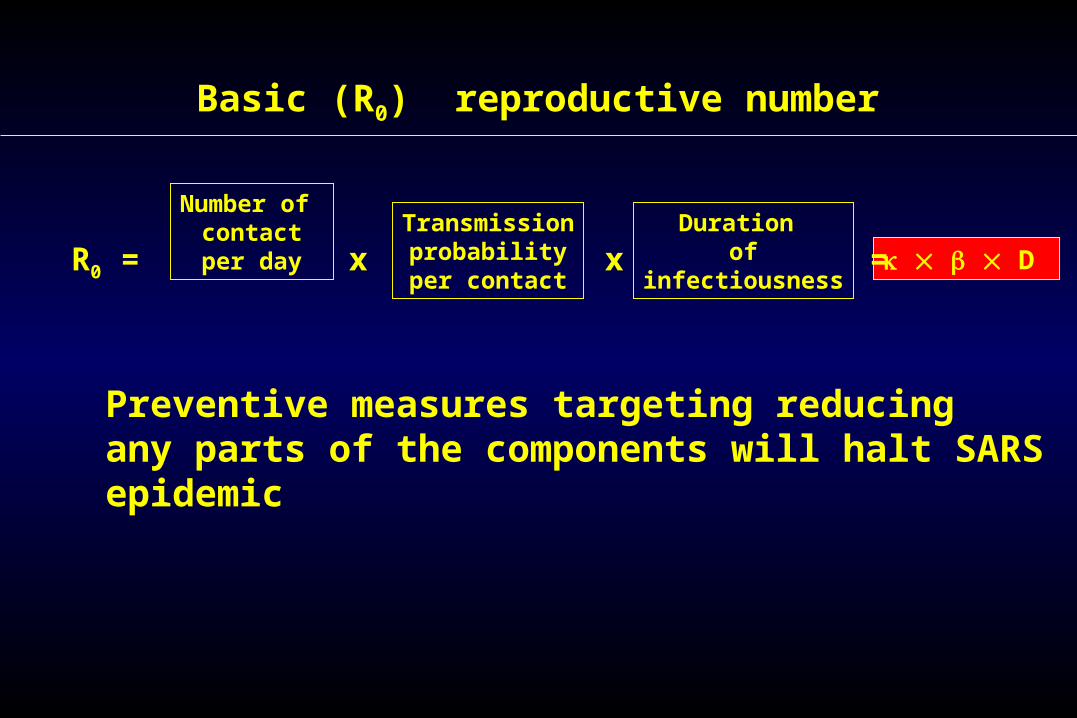
Basic (R0) reproductive number
R0 =
Number of contactper day
Transmissionprobabilityper contact
Duration of
infectiousnessx x D =
• Average number of contacts made by an infective individual during the infectious period: D e.g. 2 persons per day X 5 days = 10 persons
• Number of new infections produced by one infective during his infectious period:
No. of contacts during D ( D ) X transmission probability per contact ( )
e.g. 10 persons X 0.2 = 2 infected cases
Basic (R0) reproductive number
R0 =
Number of contactper day
Transmissionprobabilityper contact
Duration of
infectiousnessx x D =
Preventive measures targeting reducing any parts of the components will halt SARS epidemic
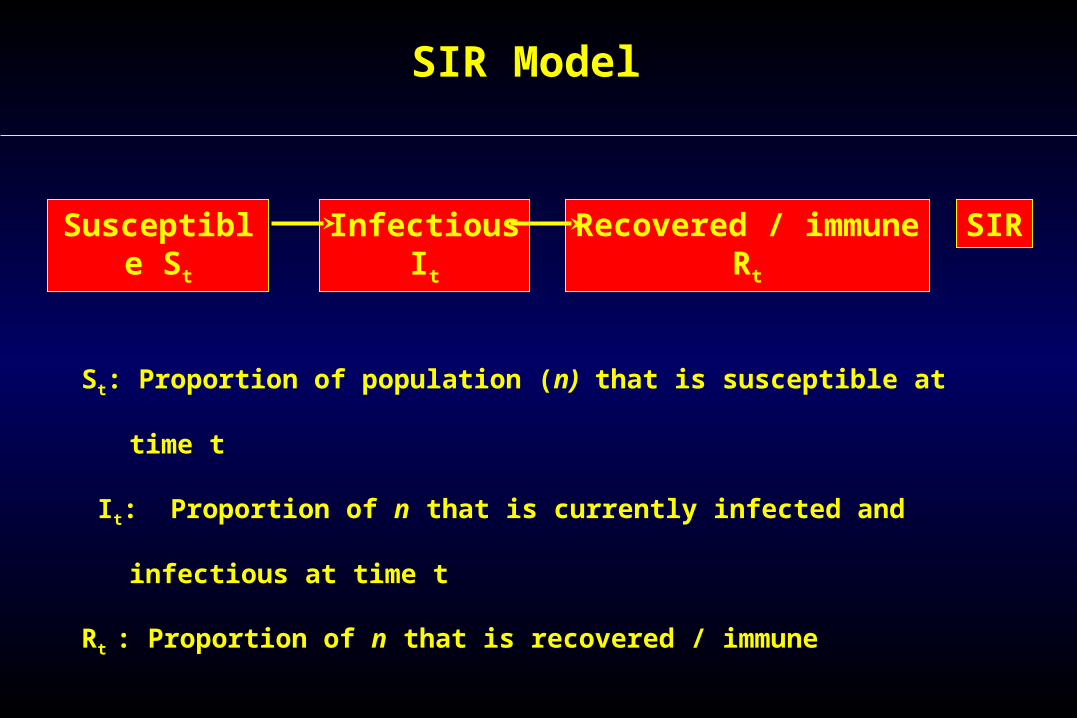
SIR Model
Susceptible St
InfectiousIt
Recovered / immuneRt
SIR
St: Proportion of population (n) that is susceptible at time t
It: Proportion of n that is currently infected and infectious at time t
Rt : Proportion of n that is recovered / immune
SIR mode is used to predict the three proportions at different scenarios.

Estimate of the 3 proportions changing over time t
Susceptible St
InfectiousIt
Recovered / immuneRt
SIR
Time derivatives of 3 proportion
dX/dt, where X could be S, I or R
At any time t during the epidemic, the 3 equations will be:
dS/dt = - S I
dI/dt = SI – I/D
dR/dt = I/D

A close look at dS/dt = - S I
Susceptible St Infectious It Recovered / immune Rt SIR
In population, there are 6 different types of possible contacts
Susceptible meets susceptible (S - S, no transmission)
Susceptible meets infectious (S - I, transmission)
Susceptible meets resistant (immune) (S - R, no transmission)
Infectious meets infectious (I - I, no transmission)
Infectious meets resistant (I - R, no transmission)
Resistant meets resistant (R - R, no transmission)

Assumptions of this model
1. the average household size is 3 (census data in 2001);2. the interval between onset of disease and admission
to hospitals is 5 days (based on the paper by Peiris et al. Coronavirus as a possible cause of SARS. Lancet online, 8 April, 2003);
3. Once SARS patients are hospitalized, they are not able to disseminate the infection back to the community;
4. Patients are infectious one day before the onset of their illness till hospitalized.

Guideline for estimate R0
In Hong Kong, the mean life expectancy is about 80 years.
The average age at the SARS infection is about 40, thus
R0 80 / 40 2
The value of R0 is used to estimate the parameters in modeling the
natural history of the SARS epidemic in Hong Kong.
(Ref. Anderson and May. Infectious Diseases of Humans: Dynamics and Control, 1991)
R0 Mean life expectancy / Average age at infection

Estimate of parameters----- Natural history
• Duration of infectivity (day): 6 days 1 day before onset of symptoms 5 day-delay in seeking treatment (Peiris’s paper)
: No. of contacted person: 14 Household (HH): 2 (Average household size is 3 according HK censes in 2001) Social contacts (SC): 12 No. of contacted persons / day: 14/6 = 2.33
: Risk of transmission per contact HH: 0.25 SC: 0.1 Weighted average : 0.149995
• Two infectious cases enter the susceptible population
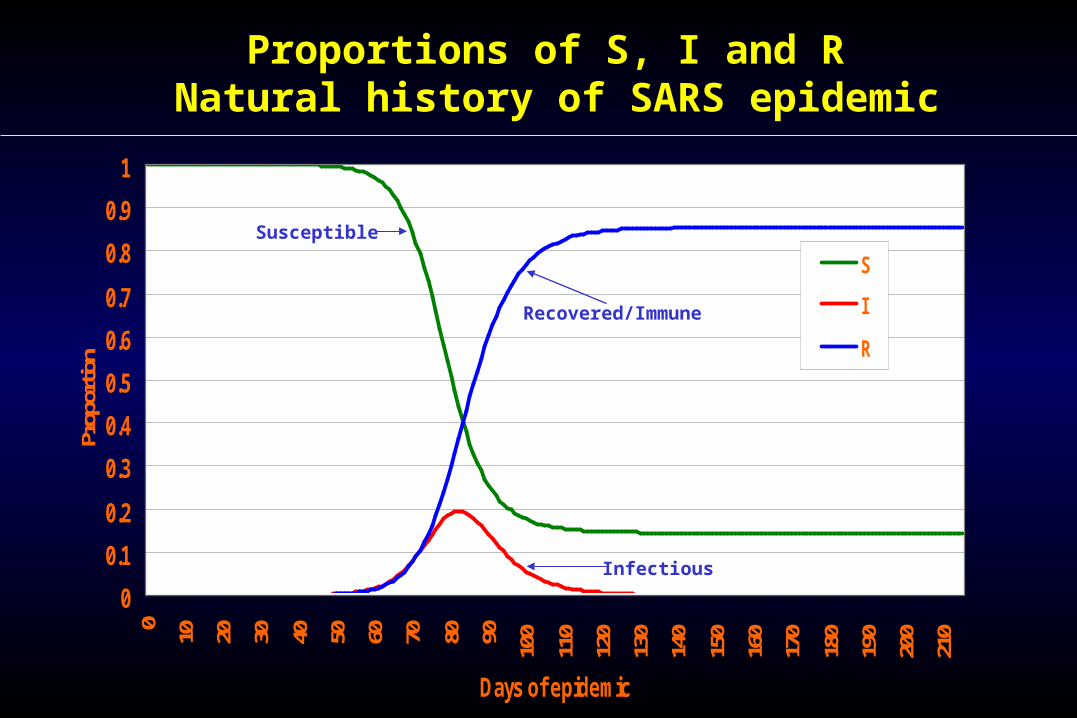
Proportions of S, I and R Natural history of SARS epidemic
0
0.1
0.2
0.3
0.4
0.5
0.6
0.7
0.8
0.9
10 10 20 30 40 50 60 70 80 90 10
0
110
120
130
140
150
160
170
180
190
200
210
Days of epidemic
Prop
ortio
n
S
I
R
Susceptible
Recovered/Immune
Infectious

Proportions of infectious population (Control started on different dates)
0
0.02
0.04
0.06
0.08
0.1
0.12
0.14
0.16
0.18
0.2
0 12 24 36 48 60 72 84 96 108
120
132
144
156
168
180
192
204
216
228
240
252
264
276
288
300
312
324
336
348
Days of epidemic
Prop
ortio
n
Ro= 1.44
Ro= 2.01
Natural
Day 10
Day 40
Day 30
Day 20

Proportions of infectious population at different Ro
0
0.02
0.04
0.06
0.08
0.1
0.12
0.14
0.16
0.18
0.2
0 12 24 36 48 60 72 84 96 108
120
132
144
156
168
180
192
204
216
228
240
252
264
276
288
300
312
324
336
348
Days of epidemic
Prop
ortio
n
Ro = 2.01
Ro =
1.44Ro =
1.39
Ro = 1.3 Ro =
1.17
Control started on day 10

0
20
40
60
80
100
120
140
160
180
0 5 10 15 20 25 30 35 40 45 50 55 60 65 70 75 80 85 90 95 100
105
110
115
120
125
130
135
140
Days of epidemic
Infe
ctio
us c
ases
Predicted number of SARS infectious cases
Control Stage 1 starting from on day 20: D = 5, Ro=
1.44
Control Stage 2 starting from on day 30: D = 3, Ro= 0.84

Proportions of S, I and R on log scale (Control at two stages)
0.00000001
0.0000001
0.000001
0.00001
0.0001
0.001
0.01
0.1
1
Days of epidemic
Prop
ortio
n on
log
scal
e
S
I
R
Susceptible
Recovered/Immune
Infectious

Computer Assisted SARS Modeling

Main Messages to bring across
1. If the epidemic is allowed “to run its natural course”, in other words, to die down by itself, up to several million people will fall victim to SARS. Sufficient herd immunity that will protect the community from further epidemics will only be achieved at the expense of this magnitude of community infection;
2. An epidemic will die down only when the basic reproductive number, Ro (number of people infected by a patient) is less than one. This can be achieved only in two ways:- when herd immunity is high enough (natural course of events), or when effective public health measures limit the spread of the epidemic;

Main Messages to bring across:
3. At present, with all the public health measures in place, it appears our public health measures are capable to reduce the number (Ro) to <1;
4. To effectively control the epidemic, efforts must be sustained keep Ro to <1. Otherwise, the epidemic can start again at any time, because the proportion of immune individuals in our population (herd immunity) is far too low to offer any “natural protection”.