Embed Size (px)
Citation preview

Mobile business intelligence and analytics
First Quarter 2012
By David Stodder
TDWI besT pracTIces reporT
tdwi.org
TDWI rese a rch
Extending Insight to a Mobile Workforce

Research Sponsors
Research Sponsors
Birst
Information Builders
MicroStrategy
SAP
Tableau Software

tdwi.org 1
© 2012 by TDWI (The Data Warehousing InstituteTM), a division of 1105 Media, Inc. All rights reserved. Reproductions in whole or in part are prohibited except by written permission. E-mail requests or feedback to [email protected]. Product and company names mentioned herein may be trademarks and/or registered trademarks of their respective companies.
first QUArtEr 2012TDWI besT pracTIces reporT
By David Stodder
Table of ContentsResearch Methodology and Demographics . . . . . . . . . . . . . . . . . . . . . . . . . . . . . . . . . 3
Executive Summary . . . . . . . . . . . . . . . . . . . . . . . . . . . . . . . . . . . . . . . . . . . . . . . . . 4
Introduction to Mobile BI and Analytics . . . . . . . . . . . . . . . . . . . . . . . . . . . . . . . . . . . 5
IT Management’s View: An “Interesting” Marriage . . . . . . . . . . . . . . . . . . . . . . . . . . . . 7
Mobile BI as Part of Overall BI Strategies . . . . . . . . . . . . . . . . . . . . . . . . . . . . . . . . . . 8
USER STORY Democratizing Data Access and Delivering Actionable Information . . . . . . . . . 9
Defining Mobile BI: Shaped by Operating Environment Constraints . . . . . . . . . . . . . . . . . . 10
Benefits and Implementation Drivers . . . . . . . . . . . . . . . . . . . . . . . . . . . . . . . . . . . . . 12
USER STORY Mobile BI and Analytics for Improving College Admissions Management . . . . . . 13
Priorities and Challenges . . . . . . . . . . . . . . . . . . . . . . . . . . . . . . . . . . . . . . . . . . . . . 14
Making the Right Deployment Decisions . . . . . . . . . . . . . . . . . . . . . . . . . . . . . . . . . . . . . 14
USER STORY Improving Procurement and Spend Management with Mobile BI . . . . . . . . . . . 18
Matching Functionality to Requirements . . . . . . . . . . . . . . . . . . . . . . . . . . . . . . . . . . . . . 20
Data Management Issues in Deployment . . . . . . . . . . . . . . . . . . . . . . . . . . . . . . . . . .24
USER STORY Real-Time Information Access via Mobile Devices Can Improve Public Safety . . . . 27
Vendor Products . . . . . . . . . . . . . . . . . . . . . . . . . . . . . . . . . . . . . . . . . . . . . . . . . . .28
Recommendations . . . . . . . . . . . . . . . . . . . . . . . . . . . . . . . . . . . . . . . . . . . . . . . . .30
Mobile business intelligence and analyticsExtending Insight to a Mobile Workforce

2 TDWI rese arch
MOBIlE B I A nD A n A lY T ICS
about the authorDAVID StoDDER is director of TDWI Research for business intelligence. He focuses on providing research-based insight and best practices for organizations implementing BI, analytics, performance management, data discovery, data visualization, and related technologies and methods. He is the author of TDWI Checklist Reports on data discovery and information management and has chaired recent TDWI conferences focused on BI agility and big data analytics. Stodder has provided thought leadership on business intelligence, information management, and IT management for over two decades. Previously, he headed up his own independent firm and served as vice president and research director with Ventana Research. He was the founding chief editor of Intelligent Enterprise and served as editorial director for nine years.
about tdWiTDWI, a division of 1105 Media, is the premier provider of in-depth, high-quality education and research in the business intelligence and data warehousing industry. TDWI is dedicated to educating business and information technology professionals about best practices, strategies, techniques, and tools required to successfully design, build, maintain, and enhance business intelligence and data warehousing solutions. TDWI also fosters the advancement of business intelligence and data warehousing research and contributes to knowledge transfer and the professional development of its members. TDWI offers a worldwide membership program, five major educational conferences, topical educational seminars, role-based training, onsite courses, certification, solution-provider partnerships, an awards program for best practices, live Webinars, resourceful publications, an in-depth research program, and a comprehensive Web site: tdwi.org.
about the tdWi best Practices reports seriesThis series is designed to educate technical and business professionals about new business intelligence technologies, concepts, or approaches that address a significant problem or issue. Research for the reports is conducted via interviews with industry experts and leading-edge user companies and is supplemented by surveys of business intelligence professionals.
To support the program, TDWI seeks vendors that collectively wish to evangelize a new approach to solving business intelligence problems or an emerging technology discipline. By banding together, sponsors can validate a new market niche and educate organizations about alternative solutions to critical business intelligence issues. Please contact TDWI Research Director for Business Intelligence David Stodder ([email protected]) to suggest a topic that meets these requirements.
acknowledgmentsTDWI would like to thank many people who contributed to this report. First, we appreciate the many users who responded to our survey, especially those who responded to our requests for phone interviews. Second, our report sponsors, who diligently reviewed outlines, survey questions, and report drafts. Finally, we would like to recognize TDWI’s production team: Jennifer Agee, Candice Christensen, Bill Grimmer, and Denelle Hanlon.
sponsorsBirst, Information Builders, MicroStrategy, SAP, and Tableau Software sponsored the research for this report.
tdwi.org 3
Position*
Corporate IT professional 50%
Business executives, sponsors/users 32%
Independent consultants 19%
Industry**
Consulting/professional services 23%
Software/Internet services 15%
Financial services 11%
Retail/wholesale/distribution 6%
Healthcare 6%
Insurance 5%
Manufacturing (noncomputer) 5%
Education 5%
Government (federal) 3%
Pharmaceuticals 3%
Media/entertainment/publishing 3%
Telecommunications 3%
other(“Other” consists of multiple industries, each
represented by 2% or less of respondents.)
13%
Geography**
United States 53%
Europe 18%
Canada 7%
Central/South America 5%
South Asia 5%
Asia/Pacific Islands 4%
Africa 4%
Australia/new Zealand 4%
Middle East 1%
Number of Employees*
Over 100,000 9%
10,000 to 100,000 21%
1,000 to 10,000 29%
100 to 1,000 21%
Fewer than 100 21%
*Based on 541 survey respondents. **Based on 530 survey respondents.
Research Methodology and Demographics
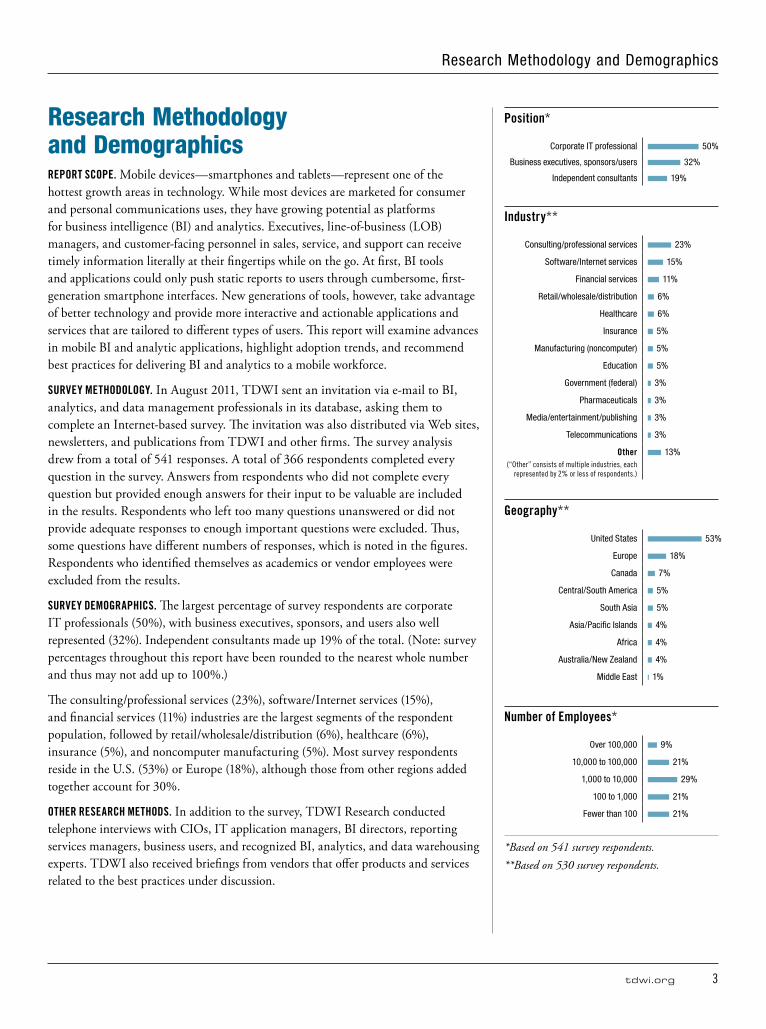
Research Methodology and DemographicsREPoRt SCoPE. Mobile devices—smartphones and tablets—represent one of the hottest growth areas in technology. While most devices are marketed for consumer and personal communications uses, they have growing potential as platforms for business intelligence (BI) and analytics. Executives, line-of-business (LOB) managers, and customer-facing personnel in sales, service, and support can receive timely information literally at their fingertips while on the go. At first, BI tools and applications could only push static reports to users through cumbersome, first-generation smartphone interfaces. New generations of tools, however, take advantage of better technology and provide more interactive and actionable applications and services that are tailored to different types of users. This report will examine advances in mobile BI and analytic applications, highlight adoption trends, and recommend best practices for delivering BI and analytics to a mobile workforce.
SuRVEy MEthoDoloGy. In August 2011, TDWI sent an invitation via e-mail to BI, analytics, and data management professionals in its database, asking them to complete an Internet-based survey. The invitation was also distributed via Web sites, newsletters, and publications from TDWI and other firms. The survey analysis drew from a total of 541 responses. A total of 366 respondents completed every question in the survey. Answers from respondents who did not complete every question but provided enough answers for their input to be valuable are included in the results. Respondents who left too many questions unanswered or did not provide adequate responses to enough important questions were excluded. Thus, some questions have different numbers of responses, which is noted in the figures. Respondents who identified themselves as academics or vendor employees were excluded from the results.
SuRVEy DEMoGRAPhICS. The largest percentage of survey respondents are corporate IT professionals (50%), with business executives, sponsors, and users also well represented (32%). Independent consultants made up 19% of the total. (Note: survey percentages throughout this report have been rounded to the nearest whole number and thus may not add up to 100%.)
The consulting/professional services (23%), software/Internet services (15%), and financial services (11%) industries are the largest segments of the respondent population, followed by retail/wholesale/distribution (6%), healthcare (6%), insurance (5%), and noncomputer manufacturing (5%). Most survey respondents reside in the U.S. (53%) or Europe (18%), although those from other regions added together account for 30%.
othER RESEARCh MEthoDS. In addition to the survey, TDWI Research conducted telephone interviews with CIOs, IT application managers, BI directors, reporting services managers, business users, and recognized BI, analytics, and data warehousing experts. TDWI also received briefings from vendors that offer products and services related to the best practices under discussion.

4 TDWI rese arch
MOBIlE B I A nD A n A lY T ICS
Executive SummaryLook up Apple iPads or other tablet computers on any consumer electronics Web site and you will see that the marketing is all about consumer desires: video calling, gaming, watching movies in high definition, or browsing the Web. Left unsaid is what these mobile devices, as well as smartphones, could do for the experience of consuming, sharing, and interacting with business data. Excitement is growing among business users about how they could use mobile devices to transform the role of information in customer interactions, performance management, planning and forecasting, and their daily operational decisions while on the go.
BI tools and applications are critical if mobile devices are to live up to their potential in the workplace. However, the pairing is not an easy one. Mobile devices are cool, glitzy, and fun. Consumers select and buy devices of choice; they can download applications as they please from app stores or access them through Web browsers. They get to shape how they use devices in a personalized fashion. Historically, BI systems have been the opposite. Rather than aim for fun and personal choice, BI systems have focused on providing users with repeatable analysis and high-quality, consistent data and reports. Recent tool releases have given users more self-service opportunities and data visualization choices; however, IT’s performance, cost, security, and other constraints allow personalization to go only so far—certainly not as far as with consumer uses of the devices.
The prospect of rolling out enterprise-class BI and analytics on mobile consumer devices gets IT managers excited—but not necessarily in a good way. Data security is a major concern, as is adherence to regulations that threaten punishment if personally identifiable information (PII) and other sensitive data are exposed. Data security with mobile BI may not be as scary as business and IT managers initially fear, but security concerns are still among the chief barriers to deploying BI and analytics on mobile devices. Meeting expectations for performance and availability could prove to be tougher challenges, particularly as interest in real-time data rises.
IT executives, managers, and BI directors do get excited about any technology that can increase opportunities to deliver the right data to the right users at the right time: the credo of BI. Because they make it less relevant where and when users can interact with data and receive alerts about changes and trends that impact their responsibilities, mobile devices can bring organizations closer to the realization of “right data, right users, right time” objectives that are behind most BI deployments.
What’s critical, however, is to enable BI and analytics to thrive by making best use of what is “insanely great” about mobile devices (to borrow late Apple cofounder and CEO Steve Jobs’s famous expression). Many of the touch, content-interaction, and collaboration features that make tablets and smartphones so appealing for consumer use could also revolutionize the experience of BI, particularly for nontechnical users.
This report examines the impact of mobile computing on the development, management, and implementation of applications and services for BI and analytics. The report will interpret the results of an extensive survey about organizations’ current experiences and plans for future deployment of mobile BI and analytics for users ranging from executives to frontline sales, service, and support personnel. It will also explore the types of functionality most important to users on the go, and the challenges that IT data management must address to support mobile users’ functionality requirements. The report will recommend best practices for organizations that are planning to deploy BI and analytics applications and Web browser–based services on mobile devices.
Business users are excited about how mobile devices could transform
daily decision making.
Data security is a major concern, as is adherence
to regulations affecting access to sensitive data.
this report examines what native and
browser-based BI and analytics
functionality is most important to mobile users.

tdwi.org 5
Introduction
Introduction to Mobile BI and AnalyticsMobility is certainly the most visible—if not the most important—computer technology development in the first part of this century. Efforts to create smartphones and tablets go back farther, but the modern era got rolling in 2003 when Research In Motion (RIM) introduced its first BlackBerry smartphone, which enabled users to send and receive e-mail and text messages and use the Web to find and access data. Before the BlackBerry smartphone, systems could push data to mobile phones but the devices generally could not support anything beyond simple data alerts and rudimentary displays. BI products running on BlackBerry smartphones and competing devices launched a new era of mobile BI; mobile BI and analytics applications have benefited ever since from continuous technology progress for increased Internet bandwidth, larger device memory, more robust device computing power, and larger and sharper screens for reading data.
Mobile mania rose dramatically when Apple produced its first iPhone in 2007, creating a huge sensation that had people lining up in droves overnight to purchase them before supplies ran out. Apple caused nearly the same reaction when it introduced the iPad in 2010, reportedly selling three million units in the first 80 days of availability. The rival Android operating system (from the Open Handset Alliance led by Google) and Android-based devices have followed, enjoying their own rush of interest, with recent market surveys showing Android now the leading OS for smartphones. However, tablets, dominated by the iPad, are rapidly becoming the preferred platform for applications that can benefit the most from larger screens—including BI and analytics.
Just as important as the devices themselves has been the creation of application marketplaces where users can, without IT’s help, find and download applications to run natively on smartphones and tablets (however, sophisticated applications such as BI frequently require server components as well, which can increase costs as well as management responsibilities). Apple publishes a software developer’s kit (SDK) for building applications that run natively on iOS platforms. The Apple iOS App Store currently offers over a half-million Apple-approved applications. The marketplace for applications developed with the Android SDK, which run natively on Android-based devices, is also growing, although not yet nearly to the level of iOS-based applications.
In our research, we found that respondents use Apple iOS devices the most for supporting BI and analytics implementations, with about two-thirds of respondents indicating that their organizations use them (Figure 1). Android and RIM BlackBerry operating environments are virtually tied for second place for smartphones, which is somewhat startling given the much longer history that organizations have with BlackBerry smartphones. Figure 1 shows the most prevalent operating systems in use in our participants’ mobile devices.
BI and analytics are benefiting from a steady stream of technology advances in networks, memory, and computing power for mobile devices.
tDWI Research finds that Apple ioS devices are the top choice for mobile BI and analytics applications.

6 TDWI rese arch
MOBIlE B I A nD A n A lY T ICS
For smartphones or tablets that users are implementing for BI and analytics, which mobile device operating environments are in use? (Please select all that apply.)
Apple ioS for iPad 67%
Apple ioS for iPhone 65%
Android-based smartphones 53%
RIM BlackBerry smartphone oS 53%
Android-based tablets 29%
Microsoft Windows Phone oS 20%
RIM BlackBerry tablet oS 9%
Symbian oS phones 8%
All others 8%
Figure 1. Based on 1,250 responses from 397 respondents; a little over 3 responses per respondent, on average.
WEB BRoWSER–BASED ACCESS. The alternative to running device-specific, native applications is to provide access to BI and analytics applications through a Web browser. Nonnative, device-independent applications can be developed using products such as Adobe Flash or maturing industry standards such as HTML5 to supply BI features and functions that can work on multiple platforms. (Note that in November 2011, Adobe announced that it will discontinue investment in Flash for mobile browsing and focus on its Adobe AIR runtime environment and HTML5.) The choice between native and nonnative Web-based applications is a hot topic; however, organizations will most likely have some of each type, or even “hybrid” applications that blend the two approaches. The debate is far more pressing for software vendors and developers than for most users, although IT developers need to sort out the choices as well. Due to its popularity, most major BI and analytics vendors today are developing native applications first for the Apple iPad, but many offer both native and nonnative options or take hybrid approaches. (This topic will be discussed in more detail later.)
CREAtING thE FAStESt PAth to DAtA. Whichever approach is taken, the primary goal for many organizations is simple: they want the fastest route to delivering access to self-service information, visualization, and analysis on the hottest user platforms of the day. Applications must meet usability expectations set by e-mail, messaging, and collaboration systems as well as consumer applications and entertainment that are already present on devices.
Most market forecasts anticipate robust growth in the use of mobile platforms, as well as BI’s role in that growth. Almost two-thirds (61%) of participants in our survey said that in the next 12 months, they expect users to spend more time on their mobile devices implementing or accessing BI and analytics applications, with 24% stating that users will spend about the same amount of time as they do now. About 70% regard mobile BI and analytics as important to their overall strategy for the growth of their organizations’ BI and analytic applications and services, with 28% indicating that it is “very important.” In some organizations, the combination of easier deployment plus strong interest in mobility has BI deployment on mobile devices outpacing deployment on standard desktops and workstations.
In some firms, ease of deployment on mobile is
accelerating BI adoption at a faster pace than on PCs
and workstations.
Most organizations will have both native and Web
browser–based mobile BI applications.

tdwi.org 7
Introduction
it Management’s View: an “interesting” MarriageIT executives might be tempted to use the ancient Chinese proverb, “May you live in interesting times,” to characterize the impact of mobility on BI and data management. Mobile’s popularity brings some major challenges for established BI and data management practices. Mobile users want devices tailored to their personal needs and preferences; also, at times they may be on the go, disconnected from networks, and outside security perimeters, but they still want access to data. IT needs to establish dependable service levels for performance and availability, guard data security and privacy, and deliver high-quality data. (Data management issues will be discussed in more depth later in this report.)
Thus, putting mobility and BI together indeed creates an “interesting” marriage from an IT point of view. One of the biggest IT challenges is user diversity. In deploying BI applications, many organizations already struggle with supporting a wide range of users. Some users know exactly what reports, data feeds, and analytics they want; power users know how to drill down into the data and even write their own queries if necessary. Nontechnical users lack the skills or proclivity to interact with data much at all and are probably best served by canned reports and heavily guided analytics. Layering BI user diversity on top of the diversity in user experience and expectations with mobile devices can create complexity in rolling out systems and providing training.
“Finding the right balance in terms of development and training is difficult,” said one BI manager at a large financial services firm. “At one end of the spectrum are people who do not want anything to do with mobile devices, while at the other end are people who want to move their entire lives onto mobile. There’s no sweet spot; training is either over people’s heads or too simple.” His organization tried to segment user training by age, but found that the older group was reluctant to use mobile devices—and this group included some influential executives. “When you have 50% of the workforce not wanting to use mobile devices, and some of them are executives, it can be hard to justify the investment.”
Interestingly, while personal choice of devices is a major part of the appeal of mobility, IT still retains a great deal of control. The TDWI research survey found that in the largest percentage of organizations (42%), IT selects and deploys all mobile devices to users. In 27% of the organizations surveyed, users can select and request mobile devices but IT must approve their business use, while in 24%, most users select and purchase their own devices without IT guidance.
The level of IT control reported in the survey could reflect the legacy dominance of BlackBerry smartphones for mobile BI. BlackBerry Enterprise Servers, which support connectivity to messaging, collaboration, and other centralized systems, have an established presence on corporate networks and enjoy the stamp of IT approval. However, RIM has had some rocky times lately with its complicated PlayBook tablet launch, its emphasis on the fading Flash technology for mobile, and Google’s recent decision to end support for its Gmail app for BlackBerry. RIM still has a strong presence, but with the market growth of Apple iOS devices and Android smartphones, we are likely to see changes in IT procurement choices in the near future.
Deploying BI to a diverse user base is a challenge; it gets even tougher when you layer it on top of a diverse set of mobile users.
Personal choice in mobile device selection is popular for consumers, but It plays a big role in device selection for business users.
8 TDWI rese arch
MOBIlE B I A nD A n A lY T ICS
Excitement tempered with caution is the prevailing attitude toward mobile BI in many IT organizations. “We try to get away from the cool factor of mobility and develop plans to deliver BI and analytics where they are really necessary,” said an IT applications manager at a large telecommunications services provider. “When business users see mobile BI demos, they get very excited and ask for everything. But we come back and ask them concrete questions about what type of data they absolutely need on devices, particularly when they are outside the workplace. We are questioning them about what functionality they really need to make decisions using mobile devices offsite and let them know that it’s not magic; there’s work to do.”
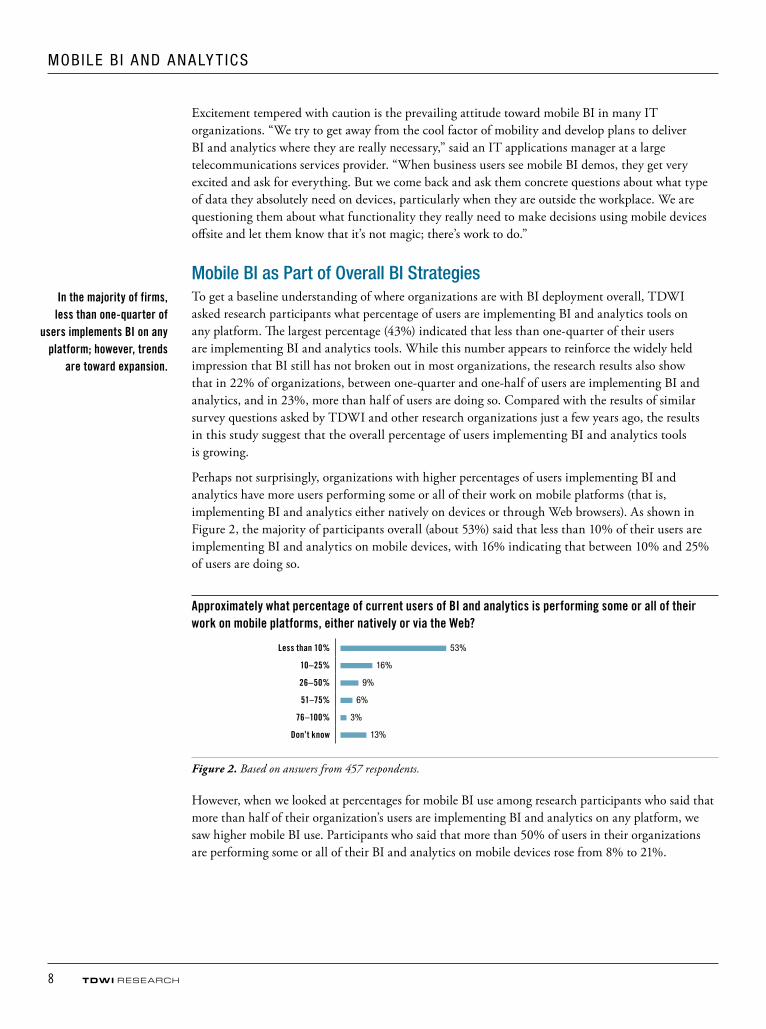
Mobile bi as Part of overall bi strategiesTo get a baseline understanding of where organizations are with BI deployment overall, TDWI asked research participants what percentage of users are implementing BI and analytics tools on any platform. The largest percentage (43%) indicated that less than one-quarter of their users are implementing BI and analytics tools. While this number appears to reinforce the widely held impression that BI still has not broken out in most organizations, the research results also show that in 22% of organizations, between one-quarter and one-half of users are implementing BI and analytics, and in 23%, more than half of users are doing so. Compared with the results of similar survey questions asked by TDWI and other research organizations just a few years ago, the results in this study suggest that the overall percentage of users implementing BI and analytics tools is growing.
Perhaps not surprisingly, organizations with higher percentages of users implementing BI and analytics have more users performing some or all of their work on mobile platforms (that is, implementing BI and analytics either natively on devices or through Web browsers). As shown in Figure 2, the majority of participants overall (about 53%) said that less than 10% of their users are implementing BI and analytics on mobile devices, with 16% indicating that between 10% and 25% of users are doing so.
Approximately what percentage of current users of BI and analytics is performing some or all of their work on mobile platforms, either natively or via the Web?
less than 10% 53%
10–25% 16%
26–50% 9%
51–75% 6%
76–100% 3%
Don’t know 13%
Figure 2. Based on answers from 457 respondents.
However, when we looked at percentages for mobile BI use among research participants who said that more than half of their organization’s users are implementing BI and analytics on any platform, we saw higher mobile BI use. Participants who said that more than 50% of users in their organizations are performing some or all of their BI and analytics on mobile devices rose from 8% to 21%.
In the majority of firms, less than one-quarter of
users implements BI on any platform; however, trends
are toward expansion.

tdwi.org 9
Introduction
The research data shows as well that organizations with more than half of their users doing some or all of their work on mobile platforms also have the highest percentage of users implementing BI and analytics tools overall, on any platform. The bottom line is that expansion in the number of mobile BI and analytics users seems to go hand in hand with an overall expansion in the implementation of BI and analytics tools. These results support the hypothesis that, compared to “green-field” implementations where users have never implemented BI, mobile BI and analytics are most successful in organizations where tool use is already widespread and where mobile deployment is part of a bigger strategy for “democratizing” the data and expanding BI and analytics to a wider population of users.
uSER StoRy DEMoCRAtIzING DAtA ACCESS AND DElIVERING ACtIoNABlE INFoRMAtIoNSonic Automotive, one of the largest retailers in the U.S. automotive industry, sees mobile BI as the “vehicle” (no pun intended) for reaching one of its most important goals. “We want to democratize the data,” said Heath Byrd, VP and CIO. “We want to get the right data to the people who need it, when they need it, and how they need it.” Sonic is using MicroStrategy Mobile to make this goal happen.
Before Sonic could effectively implement mobile reporting, the company needed to get its data house in order. Sonic’s aggressive early growth created a difficult data integration and consolidation problem. “Historically, departments and dealerships had owned their own data, and other associates had to go through a lot of red tape to get the information they needed to operate their business,” said Richard Hanks, director of enterprise BI, who led the enterprise data warehouse (EDW) development. “The EDW has given Sonic the data resource it needs to support enterprise BI and reporting initiatives. First and foremost, the data has to be accurate. The mobile device is just the means of access.”
As the EDW was being built, Sonic started testing mobile BI and reporting applications. They eventually settled on MicroStrategy due to the vendor’s ability to enable both mobile and PC-based reporting. Although it can be a challenge deploying what are essentially consumer devices in the enterprise setting, Byrd said that Sonic “is actually moving faster with the mobile rollout than with the PC-based reporting.”
Previously, reporting for Sonic associates meant dealing with huge binders full of paper-based reports, which executives and managers had to carry with them on the road as they visited stores and did operational and financial reviews. “Now, we are replacing the binders with automated reporting on iPads,” said Byrd. “From a convenience standpoint alone, that’s huge. People are getting more timely information, and we are saving money.”
Mobile BI, the development of the EDW, and data standardization are enabling Sonic to increase visibility into performance. This is critical to one of the company’s objectives, which is to create “predictable, repeatable, and sustainable experiences” at all of Sonic’s locations. However, for the BI system to deliver more than just passive information, Sonic is using presentation styles such as checklists and other graphical representations to make the data more understandable and more actionable. “The graphs and charts are cool, but people will only interact with them if they have ‘call-to-action data’—data and information that helps them make real decisions on how to run their business,” said Hanks. “You provide that kind of information via the user’s mobile device, and you are enabling the business.”
Research suggests that mobile BI and analytics adoption is strongest where there is already a large base of BI and analytics users.

10 TDWI rese arch
MOBIlE B I A nD A n A lY T ICS
defining Mobile bi: shaped by operating environment constraintsOther than the new form factor for wireless mobile devices, is mobile BI any different from BI on desktops and workstations? Broadly, the focus continues to be on providing users with data access, presentation, and analysis. But with the form factor change, therein lies the difference.
Deployments can differ considerably. Mobile BI applications range from systems that only allow access to static data extracts and reports through secure browsers, to systems that can provide much deeper interaction with data that may be updated frequently (including several times a day) through a browser or native application. For example, such operational BI applications can deliver to store managers the current sales results for their store, as well as other stores in the region, so that they can adjust their decisions about floor displays and inventory to match current demand—all while walking around one store or traveling between stores.
Many mobile BI implementations simply treat the devices as new clients in existing architectures. Just as with desktop clients, the systems typically deliver data, analytics, visualizations, and metrics through dashboards. The data is managed in existing sources, and data access from mobile devices is limited to existing data warehouses or data marts. Organizations that are rolling out mobile BI and analytics as part of larger enterprise strategies often prefer this approach because it allows them to use their existing data management, integration, metadata, and governance infrastructure. With centrally managed deployments, they can extend data quality and security procedures, as well as regulatory adherence, to the mobile realm.
Privacy concerns over the potential exposure of customers’ PII are often limiting factors in mobile deployments, and these concerns typically make central management imperative. The last thing organizations want is a “Wild West” where there is little accounting of the data on devices and lax oversight regarding who is accessing and sharing the data. With centralized data management supporting mobile clients, organizations can more effectively secure PII and other sensitive data.
Constraints that can make mobile BI experiences different from standard desktop or workstation deployments include the following:
• Smaller viewing space. New tablet devices alleviate some of the traditional limitations on screen size in mobile devices, but nonetheless, the screens are obviously small compared to laptops or desktop monitors. This limitation requires organizations to think differently about what they display to ensure that users can readily grasp the information’s significance, without having to do much zooming or resizing.
• Limits on data interaction. BI tools are taking advantage of technology advances on tablets, such as larger memory, as they become available, but most devices—particularly smartphones—currently limit the amount of slicing, dicing, and drilling down that users can perform on data that is cached or stored locally. If network performance allows, browser-based or hybrid applications can offer more expanded data interaction. However, organizations may be able to alleviate some of the need for drill-down by providing prebuilt views and reports that anticipate mobile users’ needs.
Rolling out mobile BI and analytics as part
of an enterprise strategy allows organizations to
extend existing management and governance.

tdwi.org 11
Introduction
• Inconsistent query performance. Query performance is a work in progress due to variable bandwidth and transmission strength, as well as any additional security or other hops that may be required to send queries to servers and return results. Organizations must evaluate user requirements and infrastructure costs to determine the degree of benefit they may gain from technology upgrades that are necessary to support performance and availability.
• Security and authentication. This topic will be discussed in more detail later, but security is a paramount concern. Organizations will need to evaluate how different levels of security, authentication, and access controls fit together to protect the data.
IT managers and developers have to keep in mind that BI is not necessarily the user’s primary application on the device. According to our research, BI ranks fourth among applications that users are currently implementing on mobile devices, or are accessing through browsers (see Figure 3). E-mail and collaboration systems are the most prevalent (72%), followed by spreadsheets (51%), messaging and alerting systems (47%), and then BI (43%). Nearly one-quarter of participants (23%) plan to implement BI within one year. Mobile devices are also increasingly used for participation in both internal (30%) and external (32%) social media networks. BI’s availability on devices could make “social BI” more commonplace, with users sharing reports, analytics, and data views in corporate wikis and internal social networks such as Chatter.
Which of the following application systems are users currently implementing, or are planning to implement, natively on mobile devices or remotely via the Web?
E-mail and collaboration systems 72% 7% 3% 6% 12%
Spreadsheets 51% 8% 3% 16% 22%
Messaging and alerting systems 47% 12% 7% 12% 22%
Business intelligence 43% 23% 13% 13% 8%
Corporate portals and dashboards 38% 24% 14% 11% 13%
Data warehouses or data mart 37% 13% 11% 23% 16%
Project management and scheduling systems 32% 11% 8% 20% 29%
other departmental applications (e.g., hR, inventory) 32% 7% 8% 25% 28%
External social networks (e.g., twitter) 32% 10% 4% 28% 26%
Analytic applications 31% 21% 12% 21% 15%
Internal social networks (e.g., Chatter) 30% 13% 5% 25% 27%
Figure 3. Based on answers from 465 respondents, each of whom had to provide at least one answer per category.
BI is being implemented on devices that are already used for collaboration and social networking, potentially increasing options for data sharing.
Currently doing Within one year Within two years No plans Don’t know

12 TDWI rese arch
MOBIlE B I A nD A n A lY T ICS
Benefits and Implementation DriversThe limitations on BI and analytics for mobile platforms should not overshadow the potential benefits opened up by the new form factor. The ultimate role of mobile BI may not be to simply replicate what’s been done on desktops and workstations or to merely act as clients in existing architectures. Mobile devices facilitate information on the go and the application of information insights to dynamic situations with colleagues, business partners, and customers. Strategies and expectations should be different.
BI and analytics applications are arriving on devices that already have a role in users’ lives, primarily for communication and collaboration. Organizations can use the mobility, geolocation, and interface features that are unique to these devices to their advantage. The devices can deliver information in the context of ongoing collaboration with colleagues, partners, and customers, enabling users to illustrate points with data and use information more effectively for shared decisions. As forms, documents, and other content move off paper and become digital, users will want to implement BI reports and data access functions to develop integrated views of all information. These views can bring together information that is important for reducing delays and streamlining business processes.
Our research identified some key business benefits that organizations seek to achieve from implementing BI and analytics on mobile devices (see Figure 4). Let’s look at the top three benefits in more detail.
What are the business benefits that your organization seeks to achieve from implementing BI and analytics on mobile devices? (Please select all that apply.)
Improved customer sales, service, and support 65%
More efficiency and coordination in operations and business processes 60%
Faster deployment of BI and analytics applications and services 50%
Customer self-service benefits (e.g., decreased contact center costs) 45%
Financial performance accountability and transparency 36%
Increased business use of messaging and internal/external social networks 27%
Improved supplier or partner performance in supply and value chains 23%
Regulatory compliance and governance 13%
Figure 4. Based on 1,306 responses from 406 respondents; a little over 3 responses per respondent, on average.
IMPRoVE CuStoMER SAlES, SERVICE, AND SuPPoRt. Nearly two-thirds of participants (65%) said that they are aiming for this business benefit, and in very large organizations with over 100,000 employees, the percentage rises to 70%. Mobile BI and analytics applications can give sales, service, and support personnel on the road an information resource that most of them have never had before. Typically, reports offering data and analysis of both a single customer’s issues and trends across customer segments, or having to do with their experiences with particular products, are not available—and if they are, the information is buried in paper-based reports rather than at users’ fingertips.
With information rapidly becoming a key competitive asset in customer relationships, applications that enable personnel to have more effective interactions with customers are essential. Good data visualizations on tablets look impressive. The devices can allow personnel to immediately access customer data, rather than having to go back to the office. Sales personnel can “run the numbers” for customers, potentially using their actual data to show them how products and services could enable them to save or make money. TDWI research results show that organizations are also looking for
Mobile BI and analytics can give road warrior
sales, service, and support personnel an information
resource that they have never had before.
Mobile BI can deliver information in the
context of ongoing collaboration, enabling
better shared decisions.

tdwi.org 13
Benefits and Implementation Drivers
mobile BI and analytics to help them provide better customer self-service (45%). If personnel are able to guide customers to solve issues on their own, possibly through using BI embedded in applications that customers implement either on the Web or on mobile devices, organizations can reduce the pressure on contact centers and thereby lower costs.
uSER StoRy MoBIlE BI AND ANAlytICS FoR IMPRoVING CollEGE ADMISSIoNS MANAGEMENtAttracting the most desirable students can be a complex, competitive, and time-consuming adventure for counselors, recruiters, and college admissions directors. There are many different types of prospective students and the interactions with each one creates disparate data. It would be highly useful for the admissions personnel on campus, as well as far-flung recruiters and counselors, to have a consolidated view of relevant data for reporting and analysis.
Mobile BI has proven to be a good fit for gaining intelligence from all the data in “the admissions funnel,” according Duey Heffelfinger, associate director of admissions operations at Creighton University in Omaha, Nebraska. The University’s admissions director wanted to monitor the progress of applications from the initial stages of prospective student inquiries and applications through admissions, deposit payments, and ultimately to enrollment. Initial efforts were limited by infrequent reports that did not allow users to view the underlying data, Heffelfinger said, so the department installed Tableau Server.
Heffelfinger used his data background to work with Tableau and build out the department’s analytics considerably, to where it now includes about 480 variables, many cross tabulations, and 120 different types of analytics, including some that enable Creighton to compare its admissions performance against competitors, Heffelfinger said. During the time that the department was building up its analytics, the University had launched a trial implementation of Apple iPads and chose to make undergraduate admissions a major part of the initiative. The possibility of implementing the analytics as mobile applications “was pretty exciting to us,” Heffelfinger said.
With mobile BI, a counselor or recruiter at a high school or college fair anywhere is able to review the analytics, monitor progress, and even tell a student applicant where they stand. “About half of our counselors and recruiters have iPads now and all of them have downloaded the Tableau mobile application,” Heffelfinger said. “They just log in and go” to gain access to the Server-based analytics over 3G connections. Heffelfinger calls the project “still in its infancy,” and anticipates that counselors and recruiters will want to mix analytics into presentations that include pictures, videos, and other types of information to more effectively communicate what Creighton University offers.
INCREASE EFFICIENCy AND CooRDINAtIoN IN oPERAtIoNS AND BuSINESS PRoCESSES. Employees are more productive and efficient if they do not have to spend most of their time looking for information. Poor information flow between employees at different points in business processes and operations causes delays and can raise costs due to inefficiency in supply and demand chains. More than half (60%) of research participants said that their organizations would like to see mobile BI and analytics make a difference in operations and business processes (see Figure 4).
Managers and employees responsible for processes in manufacturing, supply chains, and product development are not always at their desks. Mobile BI can help organizations extend the reach of operational BI systems, which are tailored to help organizations deliver timely, if not real-time, information and performance metrics to personnel involved in business operations and processes. Smartphones in particular are critical for delivering real-time alerts about problems in operations and processes, with real-time analytics enabling employees to determine the right solution faster. Having BI and analytics on the same platform as mobile access to collaborative systems can make it easier to share information and communicate with others how changes made in one part of a cross-functional process may affect other parts of the process.
organizations would like to see mobile BI and analytics used to improve operations and business processes.
Mobile BI has proven to be a good fit for gaining intelligence from the “admissions funnel” at Creighton university.

14 TDWI rese arch
MOBIlE B I A nD A n A lY T ICS
DEPloy BI AND ANAlytICS APPlICAtIoNS AND SERVICES MoRE RAPIDly. As shown earlier in Figure 4, half of our research participants look for mobile BI and analytics to help them deliver enterprise BI and analytics applications faster. Certainly, the ease with which users can download applications from marketplaces or access them through browsers is a factor; also, if the applications are less complex than full enterprise BI systems on desktops or workstations, they can be brought into production more quickly.
Another factor, however, has to do with BI’s overall evolution toward self-service data access and analysis, which is advantageous for mobile deployments. Modern BI tools and applications are making it easier for nontechnical users to determine what data sources they need, how to visualize the data, and what sorts of reports and dashboards are appropriate for their responsibilities. With older, traditional BI, IT is in charge of all development and users have to wait out the backlog.
Our research found that 67% of participants (see Figure 5) expect mobile BI deployment to give them easier, self-service access to data sources—a benefit that is critical to information access and management. Although mobile applications may offer more limited options, the general trend toward greater self-service will allow users to personalize their BI experience (as they can do with other types of applications on their devices) and also eliminate features that are not important. With more control over the features and functions they can select, users will be less likely to demand that IT redo applications—which slows deployment—because their requirements have not been met.
What are the information access and management benefits that your organization seeks to achieve from implementing BI and analytics on mobile devices? (Please select all that apply.)
Give executives faster and easier access to information 83%
Easier, self-service access to data sources 67%
Right-time data for users’ roles in processes or operations 54%
More frequently updated information for all users 51%
Improved data visualization and graphical presentation of data 51%
unified information access to structured and unstructured information 35%
Secure access to carefully governed information 32%
Figure 5. Based on 1,527 responses from 406 respondents; about 4 responses per respondent, on average.
Finally, mobile BI can play a role in the testing of application components. Organizations using agile processes could turn incremental releases into downloadable applications, which users could then deploy, test, and use to provide feedback to developers.
Priorities and Challenges
Making the right deployment decisionsThrough our research, we discovered a great deal about what organizations are currently doing with mobile BI and analytics and what they plan to do in coming years. We found that the largest percentage (42%) of participants said their organizations regard implementation on mobile devices as “somewhat important,” with 28% declaring it “very important.” We saw this assessment reflected in much of our research about current and planned deployment. Interest is strong, but organizations are hesitant due to concerns about technology maturity, whether organizations are prepared from
Easier, self-service access to data sources is a benefit that
users would like to receive from BI on mobile devices.

tdwi.org 15
Priorities and Challenges
an information management and security perspective, and whether the potential benefits are strong enough to overcome barriers in making the business case.
We asked participants how many mobile BI and analytics users they expect their organizations will support, inside and outside their walls, within the next two years. Overall, the responses were spread fairly evenly; the largest percentage (19%) said fewer than 50 users, but the percentages for the other groupings were not far behind, including 100 to 500 users (15%), 500 to 1,000 users (14%), and 1,000 to 10,000 users (15%). However, the size of the organization does seem to matter. When the results are filtered to include only participants from organizations with 100,000 employees or more, the percentages rise; 40% of organizations in this group anticipate deployments of over 1,000 users, about double the percentage in this range for participants overall.
GIVING ExECutIVES FAStER AND EASIER ACCESS to INFoRMAtIoN IS A toP PRIoRIty. As shown in Figure 5, more than four out of five participants (83%) see satisfying executives’ requirements as a benefit that their organizations seek to achieve from mobile BI and analytics. It’s no surprise that the satisfaction of these executives tops the list. First, executives are in a commanding position and expect their requirements to be a priority. Second, executives are often on the road and would benefit from mobile access to reports, key performance indicators (KPIs), and data. Third, many executives understand the advantages of using information effectively to manage their business and have long been among the first users of BI and performance-management tools and applications. Our research shows that senior business executives, including CEOs, CFOs, and COOs, form the largest group currently implementing BI and analytics on mobile devices (see Figure 6).
Which of the following types of users in your organization are currently implementing, or will in the future, BI or analytics applications on mobile devices, including smartphones and tablets?
Senior executives (e.g., CEo, CFo, Coo) 29% 26% 18% 10% 17%
It/applications managers and developers 23% 26% 13% 18% 20%
line-of-business (loB) executives and managers 21% 30% 18% 12% 19%
Business analysts and data analysts 17% 27% 14% 20% 22%
Analytical or statistical modelers/analysts 13% 18% 14% 27% 28%
Front-office sales, service, or support (including call or contact center) 11% 20% 14% 24% 31%
Marketing managers and analysts 9% 25% 14% 22% 30%
External partners and/or customers 9% 13% 11% 31% 36%
operational managers and users (e.g., inventory, supply chain, distribution, procurement) 7% 17% 16% 26% 34%
Product or services development 7% 15% 12% 31% 35%
Finance/accounting managers and analysts 7% 19% 15% 25% 34%
other departmental management (e.g., hR) 4% 15% 15% 32% 34%
Figure 6. Based on answers from 407 respondents, each of whom had to provide at least one answer per category.
Executives are currently the dominant users of mobile BI and analytics; satisfying their requirements is a priority.
Currently implementing Within one year Within two years No plans Don’t know

16 TDWI rese arch
MOBIlE B I A nD A n A lY T ICS
However, if organizations make it a priority to satisfy executives’ needs, how will this steer the direction of deployment for mobile BI and analytics? Executives—both at the corporate level and at departmental and divisional levels—frequently are interested in tracking specific KPIs. Many want to use performance-management metrics and KPIs to align strategic priorities with actions and decisions throughout the organization. This will certainly put a high priority on using mobile devices to support performance management and scorecards for methodologies such as Six Sigma, Balanced Scorecard, and others. Our research findings support this hypothesis and show that organizations would most like to see KPIs and other metrics in mobile BI applications.
oRGANIzAtIoNS ShoulD PREPARE FoR A RISE IN FRoNt-oFFICE SAlES, SERVICE, AND SuPPoRt uSERS. Currently, personnel in front-office sales, service, and support functions are not nearly the most prevalent users of mobile BI and analytics applications; only 11% of research participants overall said that these users are currently implementing them (see Figure 6). Even in organizations where over half of users are implementing BI and analytics on mobile devices, the percentage of front-office sales, service, and support users is just 15%.
However, as noted earlier in Figure 4, improvements in customer-facing operations are the top business benefit that organizations seek to achieve with mobile deployments. Development of BI and analytics applications that are tailored to these types of users and their requirements should be a priority—but keep in mind that most are nontechnical and may have very little experience in interacting with data. Mobile applications and browser-based services should make it easy for these personnel to understand the significance of data alerts and reports to their areas of responsibility for particular products, regions, or customers.
Customer sales, service, and support personnel may be on call, engaged with customers, or on the road; BI and analytics systems could inform them of the history and current issues with particular customers as well as trends in service calls that may impact particular customer engagements. Performance metrics on mobile devices can keep these personnel apprised of strategic goals and objectives and improve communication with managers about achieving them.
MoBIlE IMPlEMENtAtIoNS MuSt PRoVIDE EASIER, SElF-SERVICE ACCESS to DAtA SouRCES. Along with tailoring BI and analytics applications to nontechnical users, organizations need to embrace the trend toward increased self-service capabilities. About two-thirds of research participants (67%) indicated the importance of this issue (see Figure 5). “Self-service” can cover one or many capabilities, including giving users the ability to determine the following:
• The data sources to access
• How to represent the data in reports, charts, and other graphics
• The queries or analytics to run
• How frequently to update the data or send out alerts
• Additional look and feel issues that are specific to the mobile device
Self-service features should take advantage of the interaction capabilities of particular smartphone and tablet platforms, such as the iPad.
Improving customer-facing operations is the top business
benefit that organizations seek to achieve with mobile
BI and analytics.
Executive interest in performance management
will put a high priority on having metrics and KPIs
on mobile devices.

tdwi.org 17
Priorities and Challenges
To underline this point, we asked participants which changes would most impact their BI and analytics environments if their organizations expanded mobile functionality. The change indicated by the second-highest percentage of participants (51%) was that users will require greater self-service functionality (Figure 7).
What changes to the BI and analytics environment do you anticipate will occur if users in your organization expand their use of mobile devices? (Please select all that apply.)
More users will require access to data warehouses 53%
users will require greater self-service functionality 51%
More users will need BI and analytics tool training 49%
Mobile users will need more frequently updated data 46%
have to upgrade data infrastructure for scalablity and availability 41%
Will need to increase use of BI and data services in the cloud 26%
Don’t know 12%
Figure 7. Based on 994 responses from 358 respondents; about 3 responses per respondent, on average.
BuSINESS SPoNSoRS NEED to uNDERStAND thE hARD REtuRN oN INVEStMENt (RoI) PotENtIAl. With budgets tight, all technology purchasing and deployment is under a microscope. The deployment of mobile BI and analytics applications can incur costs that may not be apparent because of the ease with which users can download applications from marketplaces or connect to them through browsers. Mobile server components are often required, and applications can increase the load on mobile data management systems, network infrastructure, data warehouses, and so on. Thus, despite the excitement about mobility, business sponsors will want to understand, in the most concrete fashion, how investment in mobile BI and analytics deployment will contribute to the business. In fact, the largest percentage of research participants (44%) cited this difficulty in identifying a hard ROI as the biggest barrier for providing mobile BI and analytics (Figure 8).
Which of the following barriers do you encounter in establishing a business case for providing BI and analytics tools on mobile devices or via the Web? (Please select all that apply.)
Difficult to quantify and identify hard return 44%
lack of resources, experience, or training 44%
Data security and/or authentication concerns 41%
No budget 35%
Business case not strong enough 33%
hard to integrate with existing tools or applications 28%
Insufficient executive support or budget 22%
Concerns about user adoption 19%
Inadequate data management to support mobile users 17%
Concerns about ease of use 16%
Not satisfied with software/service options 12%
Data quality unsuitable for use 11%
No barriers 5%
Figure 8. Based on 1,355 responses from 415 respondents; about 3 responses per respondent, on average.
With budgets under scrutiny, business sponsors need to see the RoI of deploying BI and analytics on mobile devices.

18 TDWI rese arch
MOBIlE B I A nD A n A lY T ICS
Executive interest and leadership is important to overcoming concerns about ROI; 22% of those surveyed said that “insufficient executive support” was a barrier to deployment. Fortunately, our research also shows that executives are currently the predominant users; they will know from firsthand experience the value (or lack thereof) of deploying mobile BI and analytics. These findings underline the importance of meeting executives’ requirements so that their experiences are successful and valuable.
In every industry, there are potentially compelling case examples that can help proponents of mobile BI describe to business backers the value being realized by others. In healthcare, for example, procurement processes can be made more efficient through the use of mobile BI, as the user story below illustrates. Mobile device use is also growing for clinical and patient care, although true BI and analytics deployment for clinical and patient care is still mostly in the future. BI and analytics for managing costs and procurement, as well as for discovering issues that affect reimbursement, are more common. In manufacturing, organizations are seeing value in implementing mobile BI and analytics to improve decision making in processes where employees are on the move—in assembly lines, for example—and not at their desks.
ROI has always been difficult to quantify with BI, analytics, and data warehousing systems because much of the value is realized downstream, in financial planning, customer interaction, and other business processes. The best cases for ROI are made where organizations can demonstrate how mobile BI can foster better information access, presentation, and analysis and thereby reduce inefficiency and costs, improve speed to market, and raise the value of customer relationships.
uSER StoRy IMPRoVING PRoCuREMENt AND SPEND MANAGEMENt WIth MoBIlE BIHealthcare organizations are in the midst of multiple transitions as they confront new and expanding laws and regulations, changing reimbursement policies, and a challenging economy. Although much of the push for mobile device adoption in healthcare is coming from the clinical side, organizations are also using mobile devices for managing supply chains and spending. Novation, one of the industry’s leading supply contracting companies, provides its alliance members with contract, price, and spend-management services. Mobile BI is figuring prominently in the rollout of new price-benchmarking and cost-management applications developed by Novation in conjunction with VHA Inc. and UHC, two national healthcare networks totaling more than 30,000 members.
According to Guillermo Ramas, VP of strategy and product development for information and data services at Novation, mobile devices—and particularly the Apple iPad and iPhone—offer the ideal platform for physicians and procurement line personnel who move about hospitals and are never tethered to one place. Using an iPad or iPhone, they can access Novation’s applications to monitor price variations within the market and review same- or lower-priced products that offer the same quality of care. “A materials manager could focus on a specific stent at the fiftieth percentile, and see what the price would be if the price were renegotiated with the supplier and moved to the twentieth percentile,” said Ramas. Implementing MicroStrategy Mobile, the applications provide data visualization tuned to the touch and gesture features of iPads and iPhones.
Along with security, Ramas said that data synchronization and ensuring that users benefit from an intuitive interface are the main challenges in deploying the applications on mobile devices. Novation is focused on developing write-back capabilities: “Once we enable this, the user will no longer be just the consumer of information but will play an active part,” said Ramas, anticipating the impact of rapidly maturing data capture technologies on mobile devices.
Mobile devices improve cost and procurement
negotiations in healthcare, where BI and analytics are
increasingly in use.

tdwi.org 19
Priorities and Challenges
oRGANIzAtIoNS NEED to AlIGN RESouRCES, ExPERIENCE, AND tRAINING FoR MoBIlE DEPloyMENtS. TDWI’s research uncovered concern if organizations are adequately prepared for mobile BI and analytics deployment by having the right resources, experience, and training available (see Figure 8 earlier). About 44% said this inadequate preparation was a barrier in establishing a business case, ahead of data security and authentication concerns (41%), which are often described by industry analysts as the biggest barrier. Most mobile deployments will expand the user base for BI and analytics, particularly out to nontechnical, operational personnel. Thus, it is not surprising that, as we saw previously in Figure 7, about half (49%) of research participants said that in their organizations, mobile deployments will drive higher demand for training on BI and analytics tools.
Experienced BI and analytics users will need to act as mentors, guiding inexperienced users as they work with data visualizations and learn how to interact with the data through the mobile devices. BI competency centers and centers of excellence, which bring business and IT users together to oversee implementation and guide technology strategy, can play a critical role in fostering mentorship and guidance for new users.
ExtENDING ExIStING BI AND ANAlytICS to MoBIlE PlAtFoRMS IS PREFERRED But Not REquIRED. The introduction of new platforms and form factors always generates new technologies that are expressly suited to take advantage of the platforms’ unique capabilities. Mobile devices have had this effect on the BI and analytics market as startup vendors and open source developers introduce tools, applications, and software-as-a-service (SaaS) offerings that are designed for use with mobile deployments. At the same time, however, organizations have major investments in existing BI, analytics, and data warehousing systems; they have management, security, and cost reasons to prefer extending existing systems onto mobile platforms.
However, the desire to extend existing systems does not appear to close the door on new technologies that could help organizations realize goals more effectively. In our research (Figure 9), 40% of participants said that their organizations would prefer to extend existing tools and applications but are open to new ones where appropriate, while about 18% said it was their priority to extend only existing tools and applications (for organizations with over 100,000 employees, this percentage rises to 26%). A healthy portion (21%) said that their priority is to deploy tools and applications that fully leverage mobile platforms, whether they are new or existing products. Only about 3% said that their users drive tools and applications selection and can choose whatever they want. This result echoes the finding noted earlier that despite the “personal” nature of mobile devices, IT still plays a major role in determining and provisioning the devices—and the BI applications for them.
Does your organization plan to extend its existing BI and analytics applications to function on mobile devices or deploy new tools and services? (Please check the answer that best applies.)
We prefer to extend existing tools and applications but are open to new ones where appropriate 40%
our priority is to deploy tools and applications that fully leverage mobile platforms, whether new or existing 21%
our priority is to extend existing tools and applications only 18%
users drive selection of tools and applications and can choose whatever they want 3%
Don’t know 19%
Figure 9. Based on answers from 406 respondents, each of whom could choose just one answer.
While most organizations want to extend current BI and analytics to mobile devices, they are open to new applications.
Mobile BI deployment will require more user training; BI competency centers can help provide mentoring and guidance.

20 TDWI rese arch
MOBIlE B I A nD A n A lY T ICS
ClouD AND SAAS oPtIoNS CoulD FIGuRE PRoMINENtly IN thE FutuRE. To handle potential increases in the number of users and data access and analysis demands, it would make sense that organizations would evaluate whether to enlarge the role of secure, on-demand, SaaS BI applications and systems deployed in the cloud. Some large organizations are considering using data services or loading entire data marts or data warehouses on cloud platforms to support projects that anticipate hundreds or thousands of mobile BI users. Cloud and SaaS options can help organizations respond dynamically to spikes in user demand. By avoiding configuration and maintenance steps, they can also help keep costs under control.
Our research found that just 12% are currently using BI in the cloud to serve mobile users, but the number rises to 28% planning to do so in the next one to two years. About two in five (37%) of the organizations surveyed currently have no plans to deploy BI tools in the cloud to support users’ information needs on mobile devices. We saw somewhat similar results regarding plans to deploy SaaS BI and analytics or other Web-based data services to support mobile; 14% are currently using these services and 35% plan to within one or two years, while 31% said that their organizations have no plans for SaaS deployment to support mobile.
MoBIlE DEPloyMENt WIll INCREASE PERFoRMANCE AND AVAIlABIlIty DEMANDS. As shown earlier in Figure 7,our research found that increased user demand for access to data warehouses (53%) is the most commonly expected result from mobile BI and analytics deployments. About 41% expect that their organizations will have to upgrade the data infrastructure to respond to pressure for greater scalability and availability. In addition, after executives, many mobile deployments will be targeted for frontline, operational users. It is likely that these users will require more frequently updated data—not necessarily all the data, but certain elements that are time sensitive. Operational BI deployments to support daily decisions have already spiked demand for intraday, if not real-time, data updates. Mobile BI requirements for alerts, exception updates, and real-time status reports about significant trends and events could accelerate the need for infrastructure to support lower latency and higher availability.
Matching Functionality to requirementsThe features and functions that are most important depend, of course, on users and their roles in the organization. Technology is also evolving quickly; some capabilities that were not even on the menu a year or two ago are now considered expected features. In this section, we will examine which mobile BI and analytics features and functionality are most important to users. We will also consider issues in the great debate about whether to go with native, browser-based, or hybrid applications and services and how this choice impacts functionality.
oRGANIzAtIoNS ARE ChooSING NAtIVE APPlICAtIoNS But WoulD PREFER “WRItE oNCE, DEPloy ANyWhERE” StANDARDS. One of the biggest debates in the development of applications of any sort for mobile devices is whether to use custom code for each platform or use a Web architecture in which applications are accessed through a browser. Opting for device-specific custom code opens up the full functionality of the device and the operating system. BI applications on smartphones and tablets can take advantage of native navigation controls, touch-screen and gesture capabilities, unique graphics and screen resolution, connectivity, security, and features for mixing different types of content and data that may not be available for applications accessed over the Web.
Expansion of mobile BI and analytics to frontline,
operational users will require timely data and
higher availability.
Device-specific custom code can open up the
full functionality of the mobile device and its
operating system.

tdwi.org 21
Priorities and Challenges
Native applications are proving to be the most popular because they give users everything that the device has to offer. Market trends are also making the issue simpler for developers because competitors to the Apple iOS and Android operating environments, at least for tablets, are fading away. Although the BlackBerry still has a huge installed user base for smartphones, RIM’s execution on tablets has not been good, prompting organizations we interviewed to reevaluate their commitment to BlackBerry for BI and analytics given the turn toward tablets for these types of applications.
We asked research participants which mobile device operating environments are in use for implementing BI and analytics, and we found that Apple iOS for the iPad is the leader, followed closely by Apple iOS for the iPhone (see Figure 1 earlier). For smartphones, Android and BlackBerry are neck and neck behind Apple iOS for iPhone. The results are similar but even more pronounced when filtered to see answers only from organizations where more than 50% of users are performing some or all of their work on mobile devices.
Thus, the debate over native versus Web architecture has become somewhat moot because the choices are narrowing. However, the downside for developers—and perhaps ultimately for IT management—is that if custom code is used, then expertise needs to be built up to develop, maintain, and enhance applications running on each device. The devices also vary in how they handle security, which is a critical issue whenever data is involved. Most organizations interviewed for this report indicated that they would prefer to see stronger industry-neutral standards, such as HTML5, that give developers the richness of custom platforms but allow them to create applications that can run on multiple devices. However, they are not confident in the maturity of HTML5 to employ it for all BI and analytics applications. “In practice, you have to keep two sets of code,” said one BI developer.
In our research survey, participants were fairly evenly divided in their choice of implementing native applications, applications through Web architecture, and a newer hybrid approach that combines aspects of the two, which some BI vendors are offering. Hybrid applications use standards such as HTML5 and run primarily as embedded browser components. As with native applications, users can download them from a marketplace and store them on the device; then, the application launches as a browser component and can implement HTML5 as well as other cross-platform standards. If more organizations choose to make “write once, deploy anywhere” a high priority, hybrid approaches will likely evolve as the main alternative to fully native applications rather than purely Web-based applications.
ACCESS to BI AND ANAlytICS FuNCtIoNS WhIlE DISCoNNECtED FRoM NEtWoRKS IS IMPoRtANt. With hot spots, implementation of 3G and 4G wireless standards, LAN/WAN connectivity, and more, mobile device users are connected most of the time. However, mobile devices are often used during travel and could be needed in locations where connectivity options are not functioning (or not functioning well). Executives, frontline operational users, and other current and potential users of BI and analytics applications will need to access reports and interact with data while disconnected.
As shown in Figure 10, our research found that the majority (56%) of organizations regard being able to function in disconnected mode as important, with 21% of those indicating that it is very important. As the memory space expands on mobile devices (and in tablets in particular), running in disconnected mode could become less of a problem for data interaction—albeit more of a challenge for security, perhaps. Several BI products now enable users to implement dashboards with most core BI functions while in disconnected mode.
organizations want the freedom to write once and deploy anywhere but lack confidence in industry standards.
Research finds that users see the importance of accessing BI and analytics while in disconnected mode.

22 TDWI rese arch
MOBIlE B I A nD A n A lY T ICS
how important is it for your organization to enable BI for mobile users in disconnected mode, without going back to the server?
Very important 21%
Somewhat important 35%
Somewhat unimportant 14%
Not important 12%
Don’t know 18%
Figure 10. Based on answers from 396 respondents, each of whom could choose just one answer.
DAShBoARDS ARE thE MoSt PREVAlENt tyPE oF BI FuNCtIoNAlIty oN MoBIlE DEVICES. Dashboards are no less popular on mobile devices than they are on desktops; 83% of organizations view them as essential to BI application functionality (Figure 11). Dashboards consolidate reports, alerts, analysis, and data visualization into a single interface or file, to which organizations can attach role-based security protocols and authentication. Dashboards have become increasingly interactive and flashy on desktops, and many organizations hope to bring those qualities to mobile devices, particularly tablets. Dashboards are important to performance management, serving as the stage for KPIs, scorecards, and communication about progress toward strategic objectives.
What types of mobile application functionality is your organization currently delivering or planning to deliver to users? (Please select all that apply.)
Dashboards 83%
Data visualization 69%
Alerts and activity monitoring 54%
Advanced analytics, including in-memory 32%
Mobile BI integrated with transaction-enabled BI 29%
Spreadsheet functionality 29%
Embedded BI and analytics functionality in other applications 27%
Planning, modeling, and forecasting 22%
Native mobile device touch-screen and interactive functionality 21%
Security protocol enforcement 13%
Write-back changes into BI systems 12%
other 9%
Figure 11. Based on 1,458 responses from 370 respondents; about 4 responses per respondent, on average.
Dashboards can increase speed to insight by delivering information in a way that makes it actionable: an essential quality for most users of mobile devices. However, in many organizations there are now hundreds, if not thousands, of dashboards, which can defeat the initial purpose behind their development—that is, of making the dashboard a single, complete, and relevant portal to information.
Dashboard availability is very important to most mobile BI and
analytics users.

tdwi.org 23
Priorities and Challenges
Our research uncovered frustration with the ability to access dashboards from mobile devices. When asked about the availability of dashboards from mobile devices, the largest percentage of participants (37%) said that they are not available or accessible from mobile devices. About 15% said that dashboards on mobile devices are different from those on their other platforms, which we found in interviews was a fairly typical problem. These differences force organizations to develop and support even more dashboards. About the same percentage (15%) said that dashboards are available and accessible on all platforms.
PERFoRMANCE-MANAGEMENt MEtRICS ARE thE MoSt IMPoRtANt BI AND ANAlytICS FEAtuRES. “Performance management” is about improving the alignment of decisions and actions with the organization’s strategic goals. Performance management helps organizations move away from voluminous reports and data dumps that force employees to hunt for what’s important. Rather, with performance management, organizations can move toward providing a more focused presentation of information. Metrics are vital for monitoring and measuring progress toward goals. KPIs enable organizations to analyze data to interpret whether they are successful in reducing customer churn, improving on-time delivery, and other business performance goals.
Mobile devices are natural vehicles for performance management because they allow employees to consult metrics and KPIs wherever they are. Figure 12 shows how participants ranked the importance of ten BI and analytics features for mobile devices. The largest segment of participants (46%) said metrics and KPIs were “most important,” with 23% indicating that they were “important.” Browsing, filtering, and searching for dashboards and reports are critical activities in monitoring and measuring performance; 38% said these activities were very important to have for BI and analytics on mobile devices.
how important is it to you and those in your functional area to have the following BI and analytics features either natively on mobile devices or via Web applications? (Rank each item in importance from 5, most important, to 1, least important)
Metrics and key performance indicators (KPIs) 3 .97
Browse, filter, and search for dashboards and reports 3 .82
Data drill-down and drill-up 3 .67
Ad hoc querying and reporting 3 .3
Data access to live data sources 3 .25
olAP functionality (e.g., cube navigation, rollups) 3 .18
Sharing and commenting on reports and dashboards 3 .17
Real-time or on-demand analytics 3 .11
Report authoring, filtering, and distribution 3 .01
“What if” analysis 2 .9
0 1 2 3 4 5
Figure 12. Items ranked based on highest average response. Results based on 3,500 responses from 372 respondents; just over 9 responses per respondent, on average.
Along with dashboards, performance metrics and KPIs are key features that organizations want to see on mobile devices.

24 TDWI rese arch
MOBIlE B I A nD A n A lY T ICS
MAtuRIty WIth ANAlytICS WIll ElEVAtE thE IMPoRtANCE oF WRItE-BACK FuNCtIoNAlIty oN MoBIlE DEVICES. With most mobile BI and analytics systems, users are consumers; they can only read data coming from sources such as data warehouses and cannot write back changes or update data. Write-back and update capabilities do not even exist for many nonmobile BI systems, although some BI tool vendors are now incorporating them into their feature sets. Users who need to perform what-if scenarios for planning and forecasting could benefit from the ability to “write back,” or change the data to see the impact of their analysis. Thus, from mobile devices, write-back capabilities would let users update a column of data and share the changes with other users who are engaged in planning and forecasting processes. This capability could save steps and reduce data confusion.
TDWI research shows that only about 12% of organizations currently have the ability to write back changes to BI systems from mobile devices (see Figure 11). A little over one-fifth (22%) of research participants said that their mobile BI and analytics systems enable users to do planning, modeling, and forecasting. Demand for this advanced functionality could grow as executives and LOB managers incorporate tablet use into their work routines and seek to do more of their planning, modeling, and forecasting with the devices.
Data Management Issues in Deployment Mobile BI and analytics applications raise a number of important data management concerns. Organizations need to evaluate their readiness to meet data security, availability, performance scalability, real-time data, and other challenges that are likely to increase in intensity as mobile deployments grow. Organizations also face new data synchronization challenges in making sure that mobile users see the same data that’s presented on premises to desktop users BI and analytics applications. Although the focus of this report is on the use and deployment of mobile BI and analytics tools, applications, and services, this next section will explore some chief areas of concern about mobility for data management.
DAtA SECuRIty IS A CoMPlEx PRoBlEM FoR MoBIlE BI AND ANAlytICS DEPloyMENtS. Data security and authentication concerns are among the top barriers encountered in making the business or IT case for providing BI and analytics on mobile devices, either natively or through Web browsers. Jitters about potential violations of regulatory provisions are a major inhibitor to mobile deployment. Organizations have such intense concern about the legal dangers of sending any data whatsoever outside their protective walls that mobile BI and analytics projects sometimes never get beyond the simple pushing of reports and alerts, with more intensive and interactive features stuck in the testing phase. In our research interviews, data security was always among the first cautionary notes raised about mobile BI and analytics.
In part, the difficulty stems from having so many moving parts, each of which claims a piece of the security mechanics. The devices themselves are the first consideration; tablets and smartphones generally have their own embedded or operating system–level security features. Organizations can use tools to set timers to lock out access, wipe out the data, or make resident application data inaccessible in other ways if the devices are lost or stolen.
The second consideration is data flowing to and from the devices. Data transmission is usually protected by Secure Sockets Layer (SSL) protocols, encryption, and virtual private networks (VPNs). Lightweight Directory Access Protocol (LDAP) directories provide central access control and authenticate user connections to systems, while network security tools implement policies, monitor
Security for mobile BI and analytics depends
on several layers, from the device itself to
underlying database security functions.
Executives working with forecasts and scenarios
could benefit from mobile BI with write-back capabilities.

tdwi.org 25
Data Management Issues in Deployment
use, and alert administrators to unauthorized access and misbehavior. Mobile device management systems play a role in overseeing the enforcement of device and system security measures across multiple devices.
The third consideration is protecting the data itself. The starting point in many organizations is to protect data where it resides—that is, to make full use of database management security to protect against unauthorized access, extraction, or replication, whether involving desktop systems or mobile client devices. To address specific regulatory or privacy policies, organizations can develop data governance rules that implement protection policies for Health Insurance Portability and Accountability Act (HIPAA), PII, or financial data. Systems can then alert administrators to any attempts to access data that contains sensitive elements.
With so many levels and methods of protecting the data, coordinating the policies and technology implementations could be the most difficult part. Most organizations agree that the biggest danger is in allowing users to store data or make local, persistent copies on devices because the devices could be lost or stolen. Organizations that we interviewed generally prevent or strongly caution users against keeping potentially sensitive data on their devices, although as memory capabilities increase, there could be tension between users and IT on this issue. BI centers of excellence, competency centers, governance boards, or other oversight bodies that organizations have created to resolve user/IT issues and guide implementation can play a key role in raising awareness of security concerns and ensuring that policies are followed.
MoBIlE uSERS NEED ACCESS to MoSt DAtA SouRCES thAt DESKtoP uSERS REquIRE. Our research finds that the dominant data sources accessed by mobile users are not a surprise; the majority of participants (70%) indicated that the main sources are enterprise data warehouses, operational data stores (ODSs), and reports (Figure 13). About 42% said that departmental data marts are accessed by mobile users. At very large organizations (those over 100,000 employees), EDWs and ODSs are even more clearly the main data sources accessed (80%), compared to reports (54%) and departmental data marts (29%). Figure 13 shows the data sources that are currently available, or will be in the near future, for mobile users.
In your organization, which of the following data sources are or will be the most widely accessed by users implementing BI and analytics on mobile devices? (Please select all that apply.)
Enterprise data warehouse or operational data store 70%
Reports 70%
Spreadsheets 44%
online analytical processing (olAP) systems 43%
Departmental data marts 42%
BI or analytics deployed in the cloud 28%
ERP, CRM, or other applications 28%
In-memory databases or analytics 28%
Documents, forms, or unstructured content 25%
transaction processing systems and databases 17%
External data or content services 13%
hadoop files 5%
Figure 13. Items ranked based on highest average response. Results based on 1,557 responses from 375 respondents; about 4 responses per respondent, on average.
Coordinating multiple security policy and technology layers could be the most difficult part of protecting data used on mobile devices.

26 TDWI rese arch
MOBIlE B I A nD A n A lY T ICS
The good news for IT is that data warehouse managers will probably not have to develop new, specialized data stores to serve mobile users. Data security and regulatory policies may in fact increase the degree to which mobile users are channeled toward centralized data warehouses over departmental sources. The more challenging aspect for data management is that these mobile users are less predictable and more dynamic than desktop users, who generally offer well-known workloads and query patterns (or are easier to measure and monitor, at least). IT and data warehouse managers will have to evaluate whether their current tools and procedures are adequate for monitoring and forecasting the impact of mobile use on data warehouse performance.
MoBIlE uSERS DRIVE INCREASED DEMAND FoR REAl-tIME DAtA AND ANAlytICS. Whether users are on mobile devices or not, most organizations believe strongly in the business value of faster information delivery and analysis. In operations, many organizations are providing data updates at ever greater frequencies so that managers can more quickly spot supply chain problems, identify manufacturing errors, analyze pricing differences, respond to customer issues, and improve the speed of business processes. Mobile deployments that are part of operational BI expansion will heighten the demand for frequent data updates.
As data latency decreases, the next threshold is to provide access to near- or actual real-time data feeds, reports, alerts, and analysis. Many users want real time, when “right time” is the more appropriate goal. To manage real-time data expectations, some BI directors we interviewed are putting in place measures to let users know the accuracy and timeliness of the data they are receiving. In other words, if users want a real-time data feed first thing in the morning, they can get it, but it may not be as well scrubbed and consistently accurate as the data reports they will receive later in the day. The directors provide notification so that users know what they are getting. In particular, BI directors are applying these practices for executives using mobile devices, who frequently have high expectations for receiving real-time data.
Mobile BI and analytics will put more stress on the data management capabilities for delivering right-time—if not actual real-time—data insights. Fortunately, mobile BI and analytics applications stand to benefit from trends in data management technology that enable faster query performance and more frequent data updates toward real-time goals. Detailing these enhancements is outside the scope of this report, but they include next-generation, operational data integration; in-memory analytics and reporting; multicore systems, grid computing, and parallel processing; and new storage options. These advances will also help organizations increase availability, which is critical to delivering real-time or right-time data and analytics to users who are on the move—possibly around the globe—and may need data at any hour.
More than half (54%) of the organizations surveyed identified right-time data for users’ roles in processes or operations as a key benefit they seek to achieve from mobile BI and analytics (see Figure 5 earlier). Organizations should evaluate the preparedness of their data management technologies and methods to handle more requests for real-time and right-time data and analytics. They also should employ time stamps or other notification methods to let mobile users know the quality and timeliness of the data they are receiving.
Mobile users may want real-time data, but
organizations have to manage expectations and steer toward “right time.”
Mobile users are less predictable and more dynamic than desktop
users, who generally offer well-known workloads.

tdwi.org 27
Data Management Issues in Deployment
uSER StoRy REAl-tIME INFoRMAtIoN ACCESS VIA MoBIlE DEVICES CAN IMPRoVE PuBlIC SAFEtyWhen public safety hangs in the balance, police and fire department personnel don’t always have time to go to their desks and run reports. Getting data updates and alerts while in the field can play a vital role in responding quickly with the right resources and personnel. The City of Richardson, Texas, is using mobile BI on smartphones to keep police and fire chiefs, captains, and lieutenants updated on all active 911 calls and which units are responding to them. These key personnel are able to get a complete view of the situation by receiving not just data updates but also a real-time, narrative log of communication between dispatchers and field units and the geographical information about their locations.
Intent on keeping things simple and avoiding a prolonged development cycle, City of Richardson Deputy CIO Eric Matthews said that his group focused on how data could be provided to users quickly and in a simple format. “We have a mix of platforms and so we did not want to go down the road of building and buying native applications,” he said. Over the previous five years, the City had successfully deployed Information Builders’ WebFOCUS for enterprise reporting, so it made sense to extend this investment by providing browser-based access via mobile devices.
RIM BlackBerry smartphones were the first target because they were the most prevalent devices among users; in addition, the City’s BlackBerry Enterprise Servers were already linked into the secure intranet. Users of Apple iOS–based devices connect to the City’s VPN, log in, and then click on icons to access the same reports as BlackBerry users, although without all the iPad touch functionality because they are Web-based reports. The WebFOCUS implementation’s drill-down features enable users to click on links associated with particular incidents or vehicles and gain access to further reports that are formatted to fit into the small screens of the smartphones or the larger ones provided by tablets. The flexibility of the browser-based approach paid off recently when the City swapped out its older underlying public safety system for a new one. “Changing all the reports took about 10 minutes,” Matthews said.
The City has implemented a similar system to keep top-echelon police officers informed about jail inmates. Many governments suffer from having incomplete and out-of-date information about inmates, which causes confusion and errors. Users can pull up how many people are in jail and the identities of those in jail. They can drill down to find out where inmates were booked, the charges, the bail bond status, and so forth. “City governments are constrained by resources,” said Matthews. “Any time we can do more with less in making information available on mobile devices, we are into that.”
Web browser–based flexibility paid off when it proved easy to change reports after the City swapped out an older underlying system.

28 TDWI rese arch
MOBIlE B I A nD A n A lY T ICS
Vendor ProductsThe firms that sponsored this report are among the leaders and innovators in providing tools, applications, and services for mobile BI and analytics. To get a sense of where the industry as a whole is headed, here is a brief look at the portfolios of these vendors.1
Birst, based in San Francisco, “burst” onto the BI scene as an exclusively SaaS offering and has since added a virtual appliance that can run completely on premises on a virtual machine from VMware or another provider. Birst offers analysis, reporting, and data integration functionality. Birst 5 provides a secure mobile BI application natively for the Apple iPad; the company regards smartphones as more suited for alerts and limited data interaction. Birst chose to develop a mobile version that was made specifically for the interface dimensions and the touch, gesture, scrolling, and other features of the iPad platform. By touching chart elements or table cells, users can drill down into detailed data. Customers can load data into cloud-based, firewall-protected data warehouses and data marts to provide users with data-as-a-service. Any dashboard built with Birst tools can be viewed on an iPad, and the dashboards can be viewed in disconnected mode. Birst also offers an SDK for developers interested in embedding BI, analytics, or dashboards into their mobile applications.
Information Builders, founded in 1975 and based in New York City, was one of the first vendors to develop tools for mobile devices. IBI offers WebFOCUS Mobile, a suite of tools and functions that enable the full range of BI activities, including the ability to update data from mobile devices. WebFOCUS Active Technologies is device independent, providing access to dashboards and reports through a Web browser. This enables organizations to write once and deploy anywhere on most leading smartphones and tablets. However, this does not limit functionality or prevent systems developed with WebFOCUS from taking advantage of native device features. All common analytic and reporting functions are supported, with dashboards and reports delivered as self-contained Adobe Flash files or embedded in PDFs. WebFOCUS Mobile Portal enables organizations to make BI content sharable through mobile browsers, e-mail attachments, or “Mobile Faves,” IBI’s native application for Apple iOS platforms.
In the fall of 2011, Tysons Corner, Virginia–based MicroStrategy released its Mobile product for Android platforms, including a native application available in the Android marketplace. MicroStrategy Mobile continues to be available on Apple iOS, RIM BlackBerry, and other platforms, as well as through mobile browsers as a device-independent solution. A trailblazer in the mobile BI market, MicroStrategy was the most prominent of early vendors to embrace BlackBerry smartphones with applications that could connect to existing MicroStrategy systems on home-based platforms. The company has focused on dashboards; it is taking its knowledge of how its customers have worked with desktop dashboards and applying it to the new mobile form factor. MicroStrategy enables users to consolidate grids, graphs, and multiple reports into single, larger, better-performing dashboards on mobile devices. To make information actionable, the company is breaking down the walls between BI, transactional, and multimedia systems. From the MicroStrategy Mobile interface, for example, users can plug into enterprise resource planning (ERP) systems and submit transactions or embed data charts in multimedia presentations.
Birst
Information Builders
MicroStrategy
1 The vendors and products mentioned here are representative, and the list is not intended to be comprehensive.

tdwi.org 29
Vendor Products
Weinheim, Germany’s SAP offers SAP BusinessObjects Mobile. A key focus is enabling users to move easily between desktops and their mobile devices. The Mobile product is available as a downloadable iPad application and works with most other mobile devices as well. Using the product’s Catalog Browser, users can browse and search for reports just as they would from their desktops. They can receive alerts when there are new or updated reports and create lists to make it easier to access data later or to share reports with colleagues. The Mobile BI product supports the full range of BI activities, including drill-up and drill-down, charting, development of performance-management metrics and KPIs, and analytic routines. Taking advantage of the communications capabilities of mobile devices, SAP BusinessObjects Mobile enables users to place calls or send text messages while they are viewing reports. SAP BusinessObjects Explorer aims at the broader market, giving nontechnical users keyword search, navigation, and visualization tools to find answers to business questions that may be found in either internal or external data sources.
Tableau, based in Seattle, is known for rich data visualization and interaction capabilities. The company focuses its mobile efforts on tablet implementation—currently on the iPad, but Android tablet support is likely in the future. Web browser versions are available as well. Tableau Server is the centerpiece; users implement clients on tablets or use browsers, such as Mobile Safari, to access all of their views and visualizations set up on the Server. Users can browse and search for content and use filters to sort content by projects, all of which is then accessible from the mobile device. The new 7.0 releases of Tableau Mobile, Desktop, and Server products expand visual interaction. Users can work with the touch capabilities of iPads, such as hovering fingers over areas to get more information and to drill down into data. Finger taps can bring up filters; users can scroll through lists or layer the information on maps, and then use iPad pinch-and-zoom capabilities to get a better look. Integration of BI with geographical information and maps is a particularly exciting feature of Tableau on mobile.
tableau Software
SAP

30 TDWI rese arch
MOBIlE B I A nD A n A lY T ICS
RecommendationsDElIVER FAStER AND EASIER ACCESS to INFoRMAtIoN FoR ExECutIVES. Executives are currently the primary users of mobile BI and analytics tools and applications. Their success with using devices for BI and analytics could determine whether or not organizations invest in expanding mobile systems to more users. Address their requirements first and effectively.
DElIVER PERFoRMANCE MEtRICS AND KPIS oN MoBIlE DEVICES. Performance management, from the top corporate echelons on down, is a major focus in many organizations. Mobile BI and analytics implementations will be more successful if they allow users to easily access metrics and KPIs. Users should be able to monitor them and drill down into the data behind the metrics to analyze performance and determine the root cause of shortfalls.
DEVEloP A StRAtEGy to DEPloy MoBIlE BI AND ANAlytICS FoR CuStoMER SAlES, SERVICE, AND SuPPoRt PERSoNNEl. Our research shows that this coming wave of mobile BI and analytics implementations is already arriving at leading organizations. The potential is great for upgrading the value of customer-facing operations and processes by using mobile devices to improve the use of data in customer interactions on the road at customer appointments, trade shows, and other locations.
AVoID lEttING MoBIlE DEVICE uSE lEAD to DAShBoARD CoNFuSIoN. If mobile devices have their own dashboards, how will they be synchronized with desktop-based dashboards? Organizations should monitor dashboard proliferation, especially on mobile devices, and try to consolidate or at least coordinate them for better performance and to reduce confusion. Organizations should also make current dashboards more available to mobile device users, which our research found to be a concern.
ExtEND ExIStING BI SyStEMS WhERE PoSSIBlE But BE oPEN to NEW tEChNoloGIES. Mobile devices represent a platform change, which creates an opening for new and innovative technologies. However, established BI vendors are not sitting still with regard to mobile devices. Evaluate what your existing BI vendors can deliver for mobile implementations but don’t be afraid to test new technologies as well.
Go NAtIVE, But MoNItoR thE PRoGRESS oF htMl5 AND othER StANDARDS. At least for tablets, Apple iOS and Android are rapidly becoming the Coke and Pepsi of mobile operating systems. It may make sense right now to develop or download applications that run natively on these systems or that are “hybrids” on the Web, but that can take full advantage of each device’s features and functionality. However, continuously monitor progress toward browser-based applications that use industry standards such as HTML5 and can be used cross platform, so that you can develop BI and analytics applications once and deploy them to multiple types of devices.
CooRDINAtE DAtA SECuRIty AND AuthENtICAtIoN ACRoSS All lAyERS—AND lEt MANAGEMENt KNoW thAt All BASES ARE CoVERED. BI directors and data managers should meet with their counterparts in security and network administration to make sure that data moving to and from mobile devices is protected. They should discover where there are overlaps or gaps in protection. Good, well-documented security arrangements will help overcome business-level concerns about the security of data on mobile devices. Make mobile data security part of the governance policies overseen by business/IT centers of excellence, competency centers, or data governance committees.
EVAluAtE DAtA WAREhouSE RESouRCES FoR hANDlING MoRE uSERS, DyNAMIC WoRKloADS, AND hIGhER AVAIlABIlIty. Very large organizations in particular are making plans to deploy mobile devices to thousands of users. Because they will be carrying the devices with them potentially around the globe and in all time zones, mobile users are likely to challenge the workload and data access patterns that went into the design of on-premises BI and data warehousing. Determine where data technology and management upgrades may be necessary.
organizations should monitor dashboard
proliferation on mobile devices and try to
consolidate or at least coordinate them.

tdwi.org 31
Recommendations
StEP uP PlANS FoR REAl-tIME DAtA AND ANAlytICS to SERVE oPERAtIoNS. Mobile BI and analytics deployments will accelerate existing plans for the rollout of operational BI systems. The deployments are also likely to accelerate demand for frequently updated data and more timely analytics, in both cases approaching real time. Help users realistically assess their real-time (or “right-time”) data and analysis needs, and inform users about the data’s quality and timeliness so that there is no confusion and users’ expectations are met.
PlAN to IMPlEMENt uPDAtE AND WRItE-BACK FuNCtIoNAlIty FoR PlANNING AND FoRECAStING. Executives and LOB managers will embrace mobile implementations if they can do more sophisticated analysis and what-if scenarios from their devices while on the road or away from the office. Write-back functionality in BI tools is valuable; organizations should evaluate whether to provide this functionality on mobile devices, as well as data update functionality for other purposes.
DoN’t IGNoRE REquEStS to RuN MoBIlE BI AND ANAlytICS IN DISCoNNECtED MoDE. With fairly ubiquitous opportunities for connectivity in most developed geographies, our research found that some IT managers have trouble understanding why users would ever need to be disconnected. However, there are circumstances where it may be unavoidable. Consider users’ requirements, determine if their reasons are valid, and, if so, evaluate technology to make disconnected mode available to those users.
ExtEND thE lAtESt SElF-SERVICE BI AND ANAlytICS CAPABIlItIES to MoBIlE DEVICES. “Self-service” BI is a major trend. BI vendors are rapidly delivering new features and functions that are tailored to nontechnical users so that they can personalize their dashboards, reporting, data visualization, and more. Mobile BI and analytics deployments to frontline, operational users will heighten demand for greater ease of use and self-service capabilities. Bring as many of these capabilities to mobile devices as possible.
Write-back functionality can enable users to do more sophisticated analysis and what-if scenarios from mobile devices.


Research Sponsors
MicroStrategywww.microstrategy.comFounded in 1989, MicroStrategy is a leading provider of enterprise software platforms for BI, mobile intelligence, and social intelligence applications . MicroStrategy’s BI platform enables organizations worldwide to analyze vast amounts of data stored across their enterprises to make better business decisions . Companies choose MicroStrategy BI for its ease of use, sophisticated analytics, and superior data and user scalability . MicroStrategy’s mobile intelligence platform helps companies and organizations build, deploy, and maintain mobile apps across a range of solutions by embedding intelligence, transactions, and multimedia into apps . MicroStrategy’s social intelligence applications help enterprises harness the power of social networks for marketing and e-commerce . The company also offers a suite of free “friendly” consumer apps that use MicroStrategy’s enterprise technologies and its proprietary cloud platform .
tableau Softwarewww.tableausoftware.comTableau Software, a privately held company in Seattle, Washington, builds software that delivers fast analytics and rapid-fire business intelligence to everyday businesspeople . Our mission is simple: help people see and understand data . Tableau’s award-winning products integrate data exploration and visualization to make analytics fast, easy, and fun . They include Tableau Desktop, Tableau Server, Tableau Digital, and the free Tableau Public .
When it comes to retrieving and analyzing large volumes of data, we understand the needs of businesspeople—nontechnical and technical alike . As a result, Tableau has already attracted over 65,000 licensed users in companies ranging from one-person businesses to the world’s largest organizations .
Information Builderswww.informationbuilders.comSoftware and services from Information Builders bring smarter decision making, better data, and streamlined processes to millions of users at thousands of businesses and government agencies worldwide . WebFOCUS, our BI platform, delivers massively scalable analytics capabilities, complex reporting, and information applications to an organization’s employees, customers, constituents, partners, and suppliers . Our iWay Software integration platform provides data quality, information integration, and process integration (including B2B) that tame even the most complex environments . Information Builders has been headquartered in new York City for almost four decades and has dozens of offices worldwide . learn more at www .informationbuilders .com .
MOBILE INTELLIGENCE
SAPwww.sap.comAs market leader in enterprise application software, SAP (nYSE: SAP) helps companies of all sizes and industries run better . From back office to boardroom, warehouse to storefront, desktop to mobile device—SAP empowers people and organizations to work together more efficiently and use business insight more effectively to stay ahead of the competition . SAP applications and services enable more than 109,000 customers to operate profitably, adapt continuously, and grow sustainably .
Birstwww.birst.comBirst™ is the leader in agile business analytics . It offers a single place to manage all of a business’s analytics and agility needs to answer questions that span departments, data sources, and deployments—across both public or private clouds . Birst provides users with the fastest way to answer their most-pressing business questions—and then all the ones they didn’t know to ask . At one-third the cost, time, and staff of traditional big BI, Birst brings the benefits of analytics and facts-based decision making to a much broader audience .
TDWI rese a rch
TDWI Research provides research and advice for business intelligence and data warehousing professionals worldwide. TDWI Research focuses exclusively on BI/DW issues and teams up with industry thought leaders and practitioners to deliver both broad and deep understanding of the business and technical challenges surrounding the deployment and use of business intelligence and data warehousing solutions. TDWI Research offers in-depth research reports, commentary, inquiry services, and topical conferences as well as strategic planning services to user and vendor organizations.
1201 Monster Road SW
Suite 250
Renton, WA 98057-2996
t 425.277.9126
F 425.687.2842
tdwi.org