Embed Size (px)
DESCRIPTION
Mills 4Q15 Result - xls
Citation preview
Mills Results
Index
Main Indicators
Revenue
COGS G&A
EBITDA
Capex per Business Unit
Financial Indicators per Business Unit
Income Statement
Balance Sheet
Cash flow
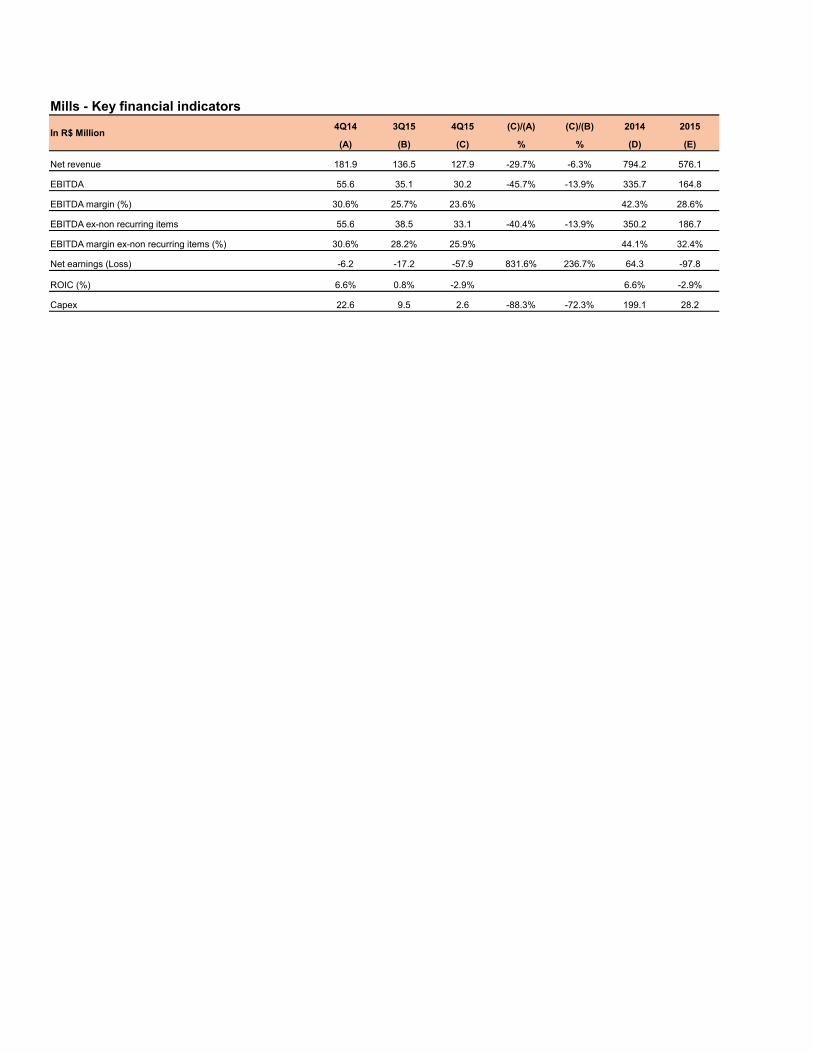
Mills - Key financial indicators
In R$ Million4Q14 3Q15 4Q15 (C)/(A) (C)/(B) 2014 2015
(A) (B) (C) % % (D) (E)
Net revenue 181.9 136.5 127.9 -29.7% -6.3% 794.2 576.1
EBITDA 55.6 35.1 30.2 -45.7% -13.9% 335.7 164.8
EBITDA margin (%) 30.6% 25.7% 23.6% 42.3% 28.6%
EBITDA ex-non recurring items 55.6 38.5 33.1 -40.4% -13.9% 350.2 186.7
EBITDA margin ex-non recurring items (%) 30.6% 28.2% 25.9% 44.1% 32.4%
Net earnings (Loss) -6.2 -17.2 -57.9 831.6% 236.7% 64.3 -97.8
ROIC (%) 6.6% 0.8% -2.9% 6.6% -2.9%
Capex 22.6 9.5 2.6 -88.3% -72.3% 199.1 28.2
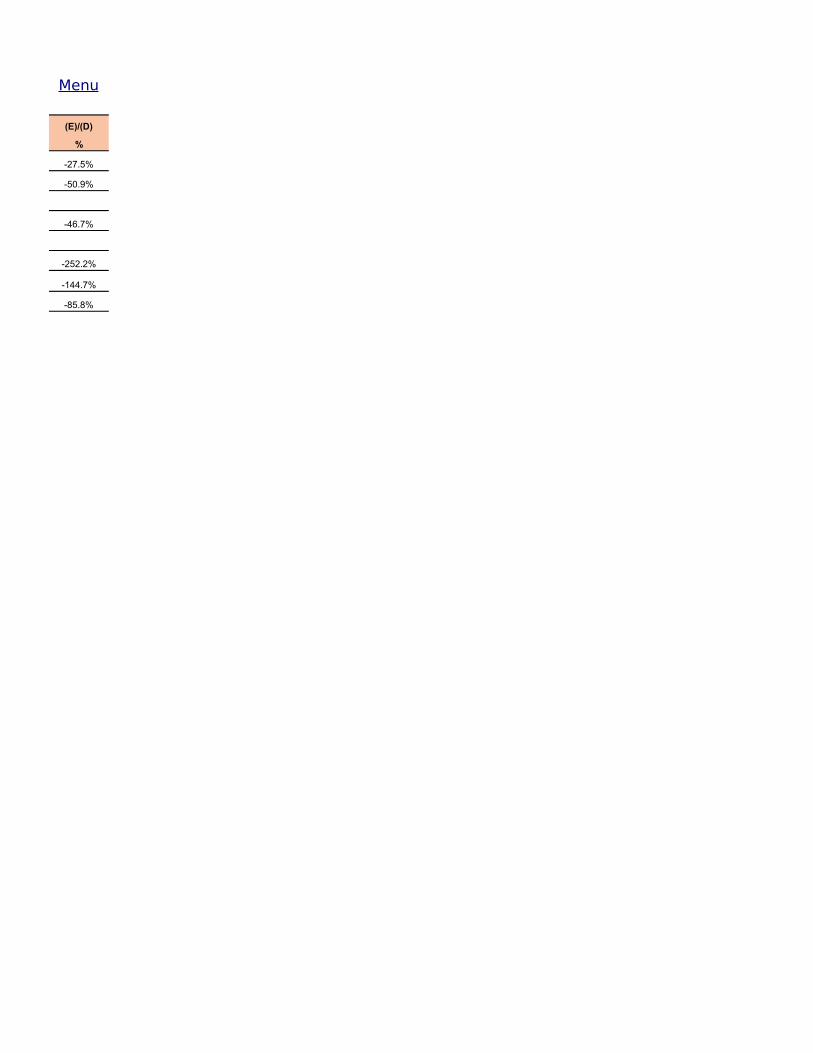
(E)/(D)
%
-27.5%
-50.9%
-46.7%
-252.2%
-144.7%
-85.8%
Menu
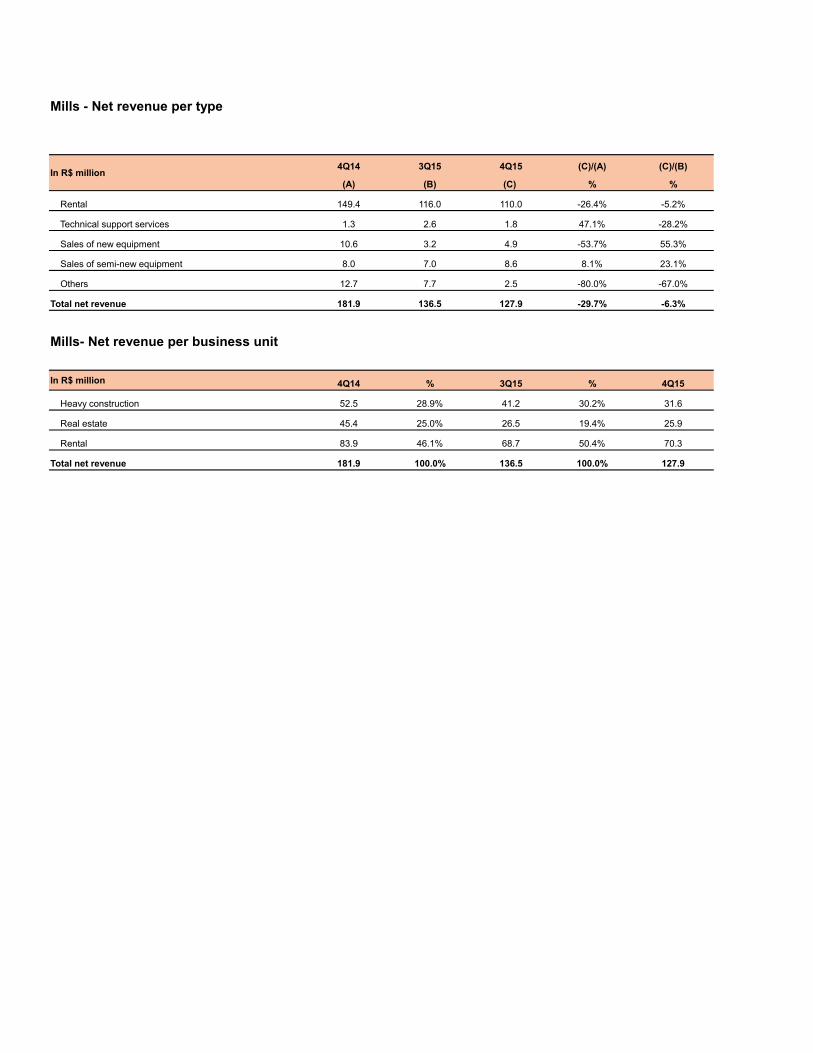
Mills - Net revenue per type
In R$ million4Q14 3Q15 4Q15 (C)/(A) (C)/(B)
(A) (B) (C) % %
Rental 149.4 116.0 110.0 -26.4% -5.2%
Technical support services 1.3 2.6 1.8 47.1% -28.2%
Sales of new equipment 10.6 3.2 4.9 -53.7% 55.3%
Sales of semi-new equipment 8.0 7.0 8.6 8.1% 23.1%
Others 12.7 7.7 2.5 -80.0% -67.0%
Total net revenue 181.9 136.5 127.9 -29.7% -6.3%
Mills- Net revenue per business unit
In R$ million 4Q14 % 3Q15 % 4Q15
Heavy construction 52.5 28.9% 41.2 30.2% 31.6
Real estate 45.4 25.0% 26.5 19.4% 25.9
Rental 83.9 46.1% 68.7 50.4% 70.3
Total net revenue 181.9 100.0% 136.5 100.0% 127.9

2014 2015 (E)/(D)
(D) (E) %
663.3 484.4 -27.0%
8.1 7.9 -2.2%
45.7 24.8 -45.6%
34.8 29.1 -16.5%
42.3 29.9 -29.3%
794.2 576.1 -27.5%
% 2014 % 2015 %
24.7% 211.0 26.6% 165.7 28.8%
20.3% 212.4 26.7% 117.2 20.3%
55.0% 370.8 46.7% 293.2 50.9%
100.0% 794.2 100.0% 576.1 100.0%
Menu
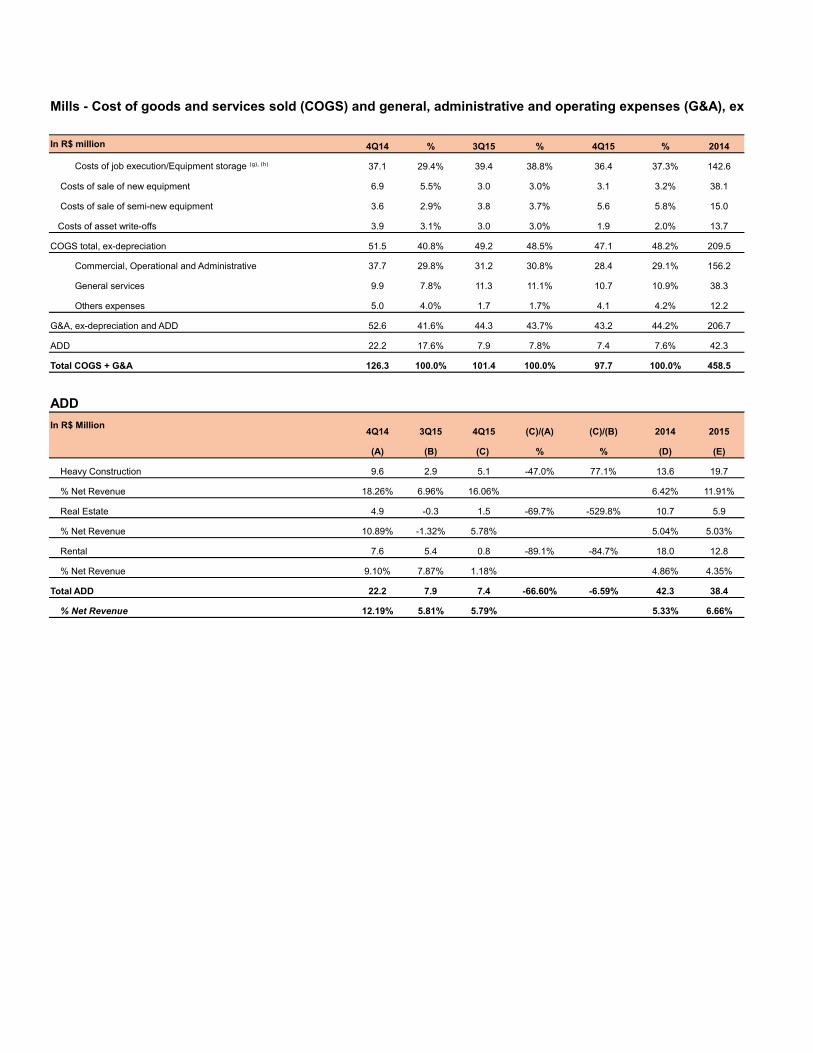
Mills - Cost of goods and services sold (COGS) and general, administrative and operating expenses (G&A), ex-depreciation
In R$ million 4Q14 % 3Q15 % 4Q15 % 2014
37.1 29.4% 39.4 38.8% 36.4 37.3% 142.6
Costs of sale of new equipment 6.9 5.5% 3.0 3.0% 3.1 3.2% 38.1
Costs of sale of semi-new equipment 3.6 2.9% 3.8 3.7% 5.6 5.8% 15.0
Costs of asset write-offs 3.9 3.1% 3.0 3.0% 1.9 2.0% 13.7
COGS total, ex-depreciation 51.5 40.8% 49.2 48.5% 47.1 48.2% 209.5
Commercial, Operational and Administrative 37.7 29.8% 31.2 30.8% 28.4 29.1% 156.2
General services 9.9 7.8% 11.3 11.1% 10.7 10.9% 38.3
Others expenses 5.0 4.0% 1.7 1.7% 4.1 4.2% 12.2
G&A, ex-depreciation and ADD 52.6 41.6% 44.3 43.7% 43.2 44.2% 206.7
ADD 22.2 17.6% 7.9 7.8% 7.4 7.6% 42.3
Total COGS + G&A 126.3 100.0% 101.4 100.0% 97.7 100.0% 458.5
ADD
In R$ Million4Q14 3Q15 4Q15 (C)/(A) (C)/(B) 2014 2015
(A) (B) (C) % % (D) (E)
Heavy Construction 9.6 2.9 5.1 -47.0% 77.1% 13.6 19.7
% Net Revenue 18.26% 6.96% 16.06% 6.42% 11.91%
Real Estate 4.9 -0.3 1.5 -69.7% -529.8% 10.7 5.9
% Net Revenue 10.89% -1.32% 5.78% 5.04% 5.03%
Rental 7.6 5.4 0.8 -89.1% -84.7% 18.0 12.8
% Net Revenue 9.10% 7.87% 1.18% 4.86% 4.35%
Total ADD 22.2 7.9 7.4 -66.60% -6.59% 42.3 38.4
% Net Revenue 12.19% 5.81% 5.79% 5.33% 6.66%
Costs of job execution/Equipment storage (g), (h)
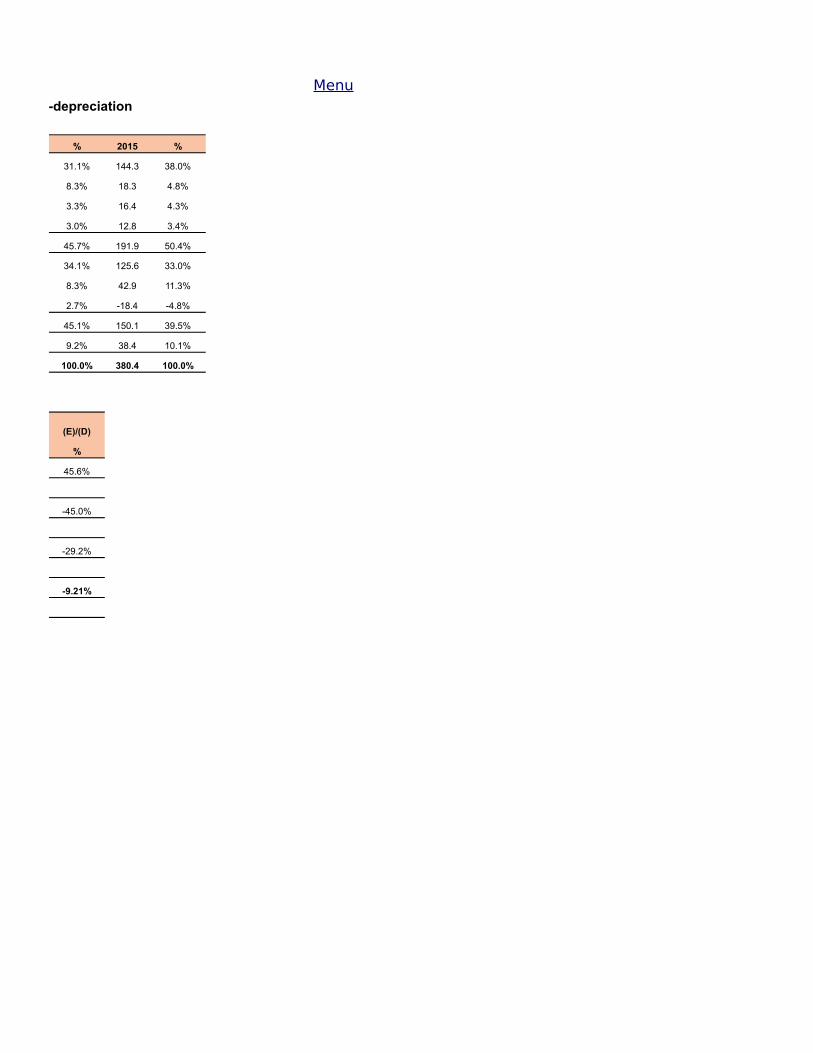
Mills - Cost of goods and services sold (COGS) and general, administrative and operating expenses (G&A), ex-depreciation
% 2015 %
31.1% 144.3 38.0%
8.3% 18.3 4.8%
3.3% 16.4 4.3%
3.0% 12.8 3.4%
45.7% 191.9 50.4%
34.1% 125.6 33.0%
8.3% 42.9 11.3%
2.7% -18.4 -4.8%
45.1% 150.1 39.5%
9.2% 38.4 10.1%
100.0% 380.4 100.0%
(E)/(D)
%
45.6%
-45.0%
-29.2%
-9.21%
Menu
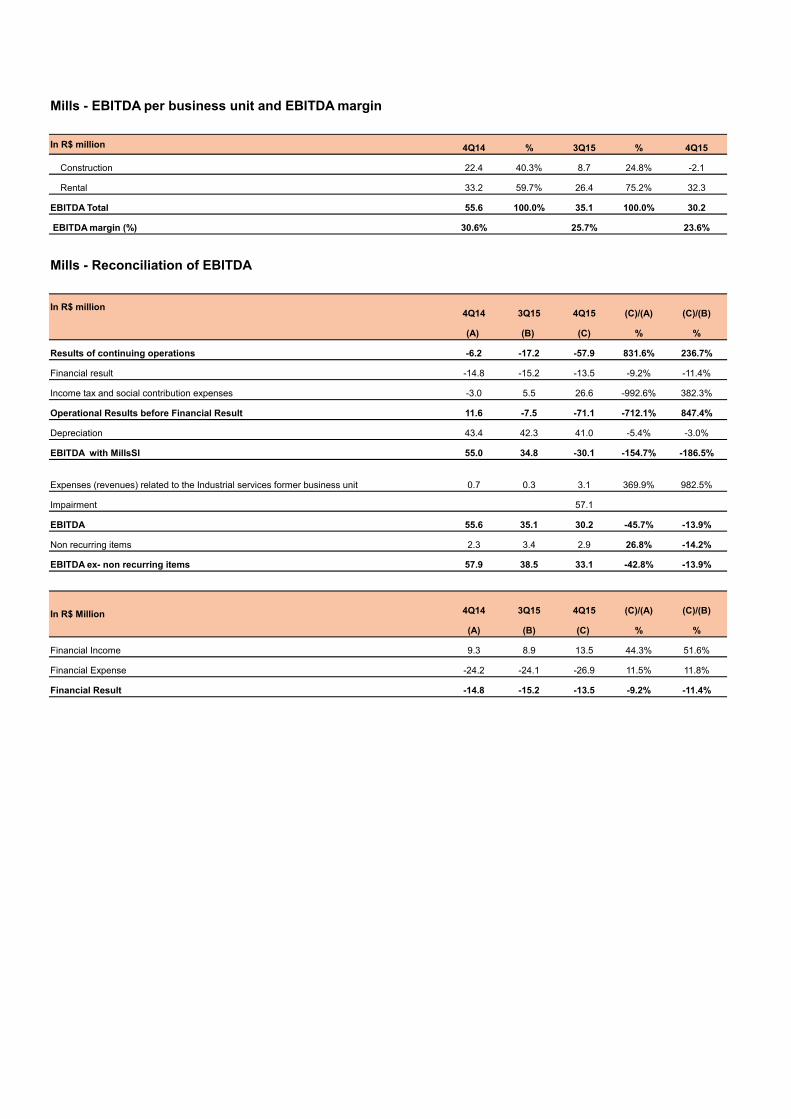
Mills - EBITDA per business unit and EBITDA margin
In R$ million 4Q14 % 3Q15 % 4Q15
Construction 22.4 40.3% 8.7 24.8% -2.1
Rental 33.2 59.7% 26.4 75.2% 32.3
EBITDA Total 55.6 100.0% 35.1 100.0% 30.2
EBITDA margin (%) 30.6% 25.7% 23.6%
Mills - Reconciliation of EBITDA
In R$ million4Q14 3Q15 4Q15 (C)/(A) (C)/(B)
(A) (B) (C) % %
Results of continuing operations -6.2 -17.2 -57.9 831.6% 236.7%
Financial result -14.8 -15.2 -13.5 -9.2% -11.4%
Income tax and social contribution expenses -3.0 5.5 26.6 -992.6% 382.3%
Operational Results before Financial Result 11.6 -7.5 -71.1 -712.1% 847.4%
Depreciation 43.4 42.3 41.0 -5.4% -3.0%
EBITDA with MillsSI 55.0 34.8 -30.1 -154.7% -186.5%
Expenses (revenues) related to the Industrial services former business unit 0.7 0.3 3.1 369.9% 982.5%
Impairment 57.1
EBITDA 55.6 35.1 30.2 -45.7% -13.9%
Non recurring items 2.3 3.4 2.9 26.8% -14.2%
EBITDA ex- non recurring items 57.9 38.5 33.1 -42.8% -13.9%
In R$ Million 4Q14 3Q15 4Q15 (C)/(A) (C)/(B)
(A) (B) (C) % %
Financial Income 9.3 8.9 13.5 44.3% 51.6%
Financial Expense -24.2 -24.1 -26.9 11.5% 11.8%
Financial Result -14.8 -15.2 -13.5 -9.2% -11.4%
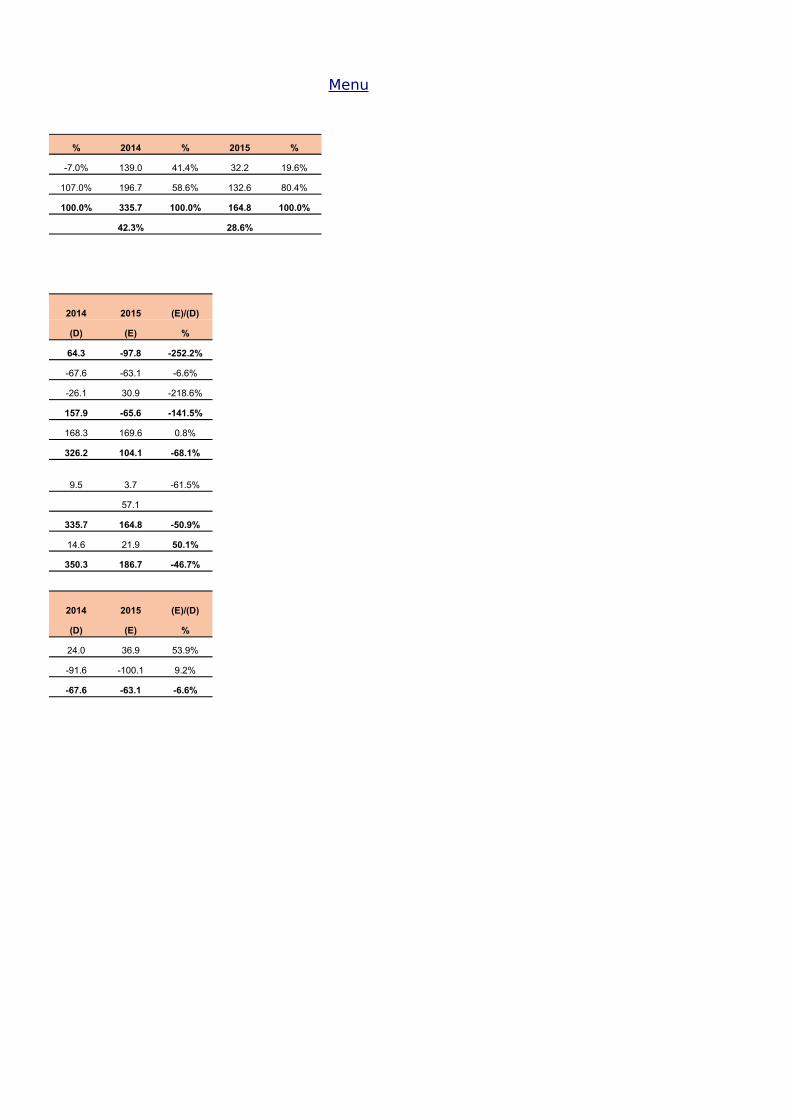
% 2014 % 2015 %
-7.0% 139.0 41.4% 32.2 19.6%
107.0% 196.7 58.6% 132.6 80.4%
100.0% 335.7 100.0% 164.8 100.0%
42.3% 28.6%
2014 2015 (E)/(D)
(D) (E) %
64.3 -97.8 -252.2%
-67.6 -63.1 -6.6%
-26.1 30.9 -218.6%
157.9 -65.6 -141.5%
168.3 169.6 0.8%
326.2 104.1 -68.1%
9.5 3.7 -61.5%
57.1
335.7 164.8 -50.9%
14.6 21.9 50.1%
350.3 186.7 -46.7%
2014 2015 (E)/(D)
(D) (E) %
24.0 36.9 53.9%
-91.6 -100.1 9.2%
-67.6 -63.1 -6.6%
Menu
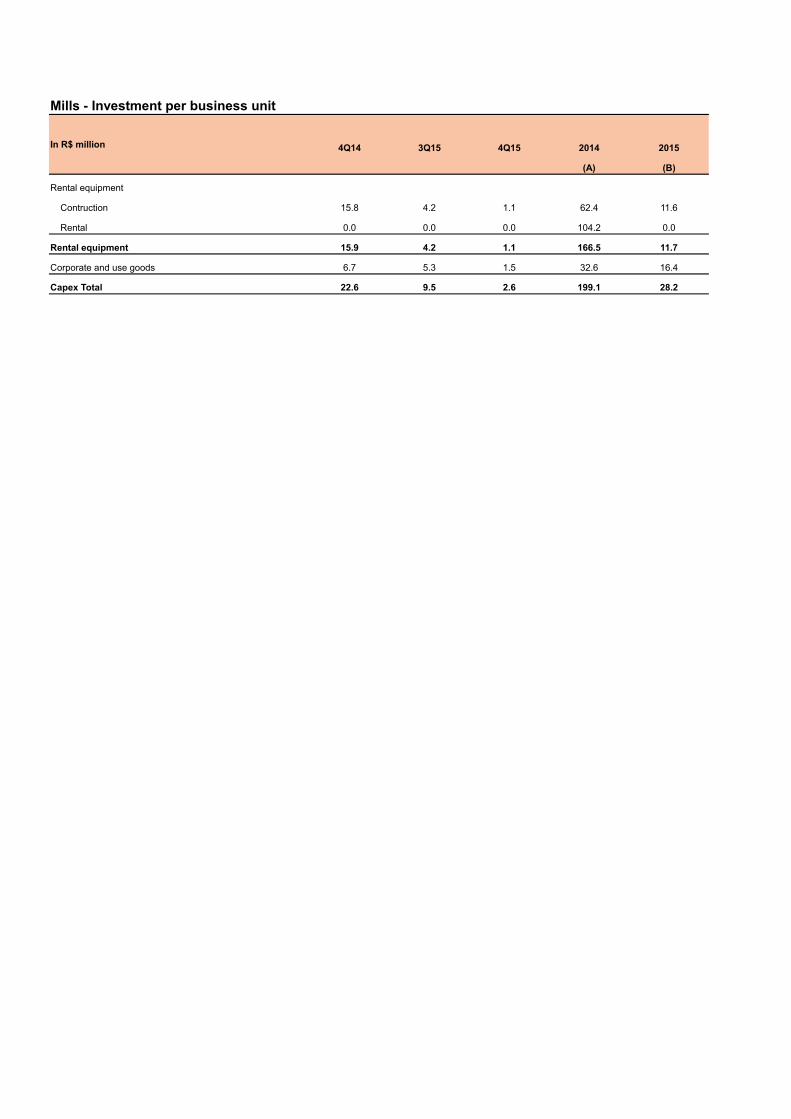
Mills - Investment per business unit
In R$ million 4Q14 3Q15 4Q15 2014 2015
(A) (B)
Rental equipment
Contruction 15.8 4.2 1.1 62.4 11.6
Rental 0.0 0.0 0.0 104.2 0.0
Rental equipment 15.9 4.2 1.1 166.5 11.7
Corporate and use goods 6.7 5.3 1.5 32.6 16.4
Capex Total 22.6 9.5 2.6 199.1 28.2
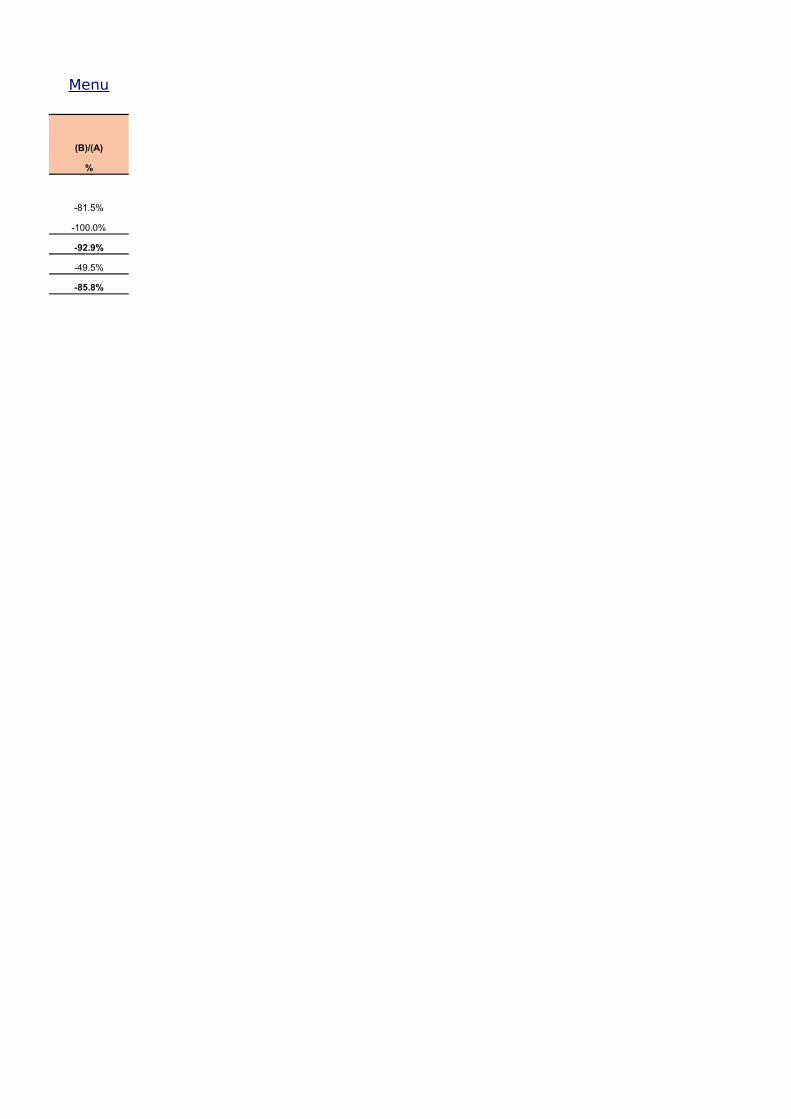
(B)/(A)
%
-81.5%
-100.0%
-92.9%
-49.5%
-85.8%
Menu
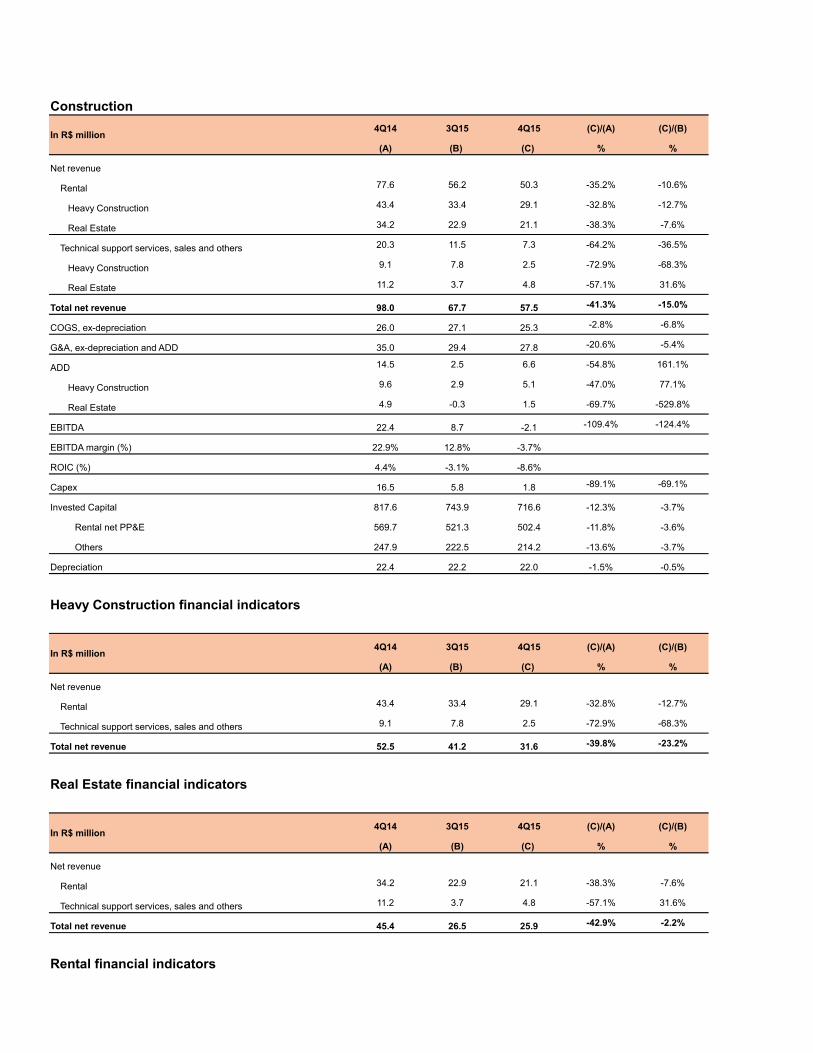
Construction
In R$ million4Q14 3Q15 4Q15 (C)/(A) (C)/(B)
(A) (B) (C) % %
Net revenue
Rental 77.6 56.2 50.3 -35.2% -10.6%
Heavy Construction 43.4 33.4 29.1 -32.8% -12.7%
Real Estate 34.2 22.9 21.1 -38.3% -7.6%
Technical support services, sales and others 20.3 11.5 7.3 -64.2% -36.5%
Heavy Construction 9.1 7.8 2.5 -72.9% -68.3%
Real Estate 11.2 3.7 4.8 -57.1% 31.6%
Total net revenue 98.0 67.7 57.5 -41.3% -15.0%
COGS, ex-depreciation 26.0 27.1 25.3 -2.8% -6.8%
G&A, ex-depreciation and ADD 35.0 29.4 27.8 -20.6% -5.4%
ADD 14.5 2.5 6.6 -54.8% 161.1%
Heavy Construction 9.6 2.9 5.1 -47.0% 77.1%
Real Estate 4.9 -0.3 1.5 -69.7% -529.8%
EBITDA 22.4 8.7 -2.1 -109.4% -124.4%
EBITDA margin (%) 22.9% 12.8% -3.7%
ROIC (%) 4.4% -3.1% -8.6%
Capex 16.5 5.8 1.8 -89.1% -69.1%
Invested Capital 817.6 743.9 716.6 -12.3% -3.7%
Rental net PP&E 569.7 521.3 502.4 -11.8% -3.6%
Others 247.9 222.5 214.2 -13.6% -3.7%
Depreciation 22.4 22.2 22.0 -1.5% -0.5%
Heavy Construction financial indicators
In R$ million4Q14 3Q15 4Q15 (C)/(A) (C)/(B)
(A) (B) (C) % %
Net revenue
Rental 43.4 33.4 29.1 -32.8% -12.7%
Technical support services, sales and others 9.1 7.8 2.5 -72.9% -68.3%
Total net revenue 52.5 41.2 31.6 -39.8% -23.2%
Real Estate financial indicators
In R$ million4Q14 3Q15 4Q15 (C)/(A) (C)/(B)
(A) (B) (C) % %
Net revenue
Rental 34.2 22.9 21.1 -38.3% -7.6%
Technical support services, sales and others 11.2 3.7 4.8 -57.1% 31.6%
Total net revenue 45.4 26.5 25.9 -42.9% -2.2%
Rental financial indicators
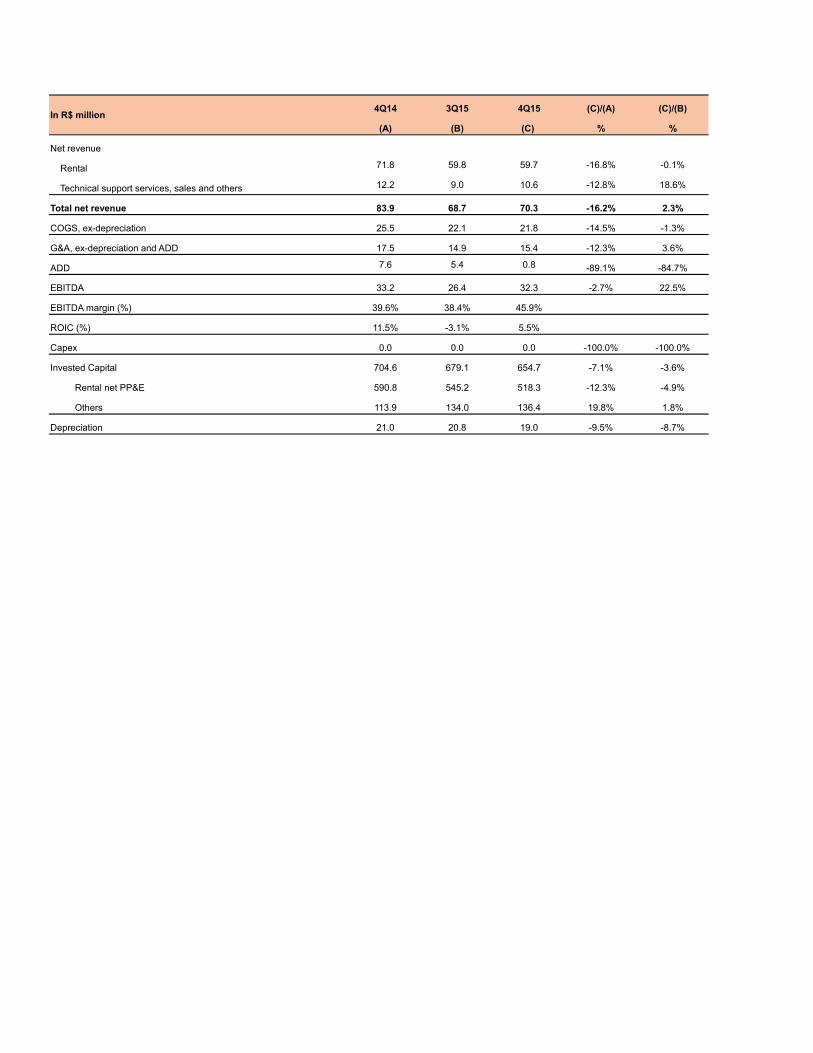
In R$ million4Q14 3Q15 4Q15 (C)/(A) (C)/(B)
(A) (B) (C) % %
Net revenue
Rental 71.8 59.8 59.7 -16.8% -0.1%
Technical support services, sales and others 12.2 9.0 10.6 -12.8% 18.6%
Total net revenue 83.9 68.7 70.3 -16.2% 2.3%
COGS, ex-depreciation 25.5 22.1 21.8 -14.5% -1.3%
G&A, ex-depreciation and ADD 17.5 14.9 15.4 -12.3% 3.6%
ADD 7.6 5.4 0.8 -89.1% -84.7%
EBITDA 33.2 26.4 32.3 -2.7% 22.5%
EBITDA margin (%) 39.6% 38.4% 45.9%
ROIC (%) 11.5% -3.1% 5.5%
Capex 0.0 0.0 0.0 -100.0% -100.0%
Invested Capital 704.6 679.1 654.7 -7.1% -3.6%
Rental net PP&E 590.8 545.2 518.3 -12.3% -4.9%
Others 113.9 134.0 136.4 19.8% 1.8%
Depreciation 21.0 20.8 19.0 -9.5% -8.7%

2014 2015 (E)/(D)
(D) (E) %
339.3 230.3 -32.1%
177.4 134.6 -24.1%
161.8 95.6 -40.9%
84.1 52.7 -37.3%
33.6 31.1 -7.4%
50.5 21.6 -57.2%
423.4 283.0 -33.2%
117.8 106.8 -9.3%
142.2 149.2 4.9%
24.3 25.6 5.6%
13.6 19.7 45.6%
10.7 5.9 -45.0%
139.0 1.3 -99.0%
32.8% 0.5%
4.4% -8.6%
69.0 14.0 -79.7%
817.6 716.6 -12.3%
569.7 502.4 -11.8%
247.9 214.2 -13.6%
87.3 88.9 1.8%
2014 2015 (E)/(D)
(D) (E) %
177.4 134.6 -24.1%
33.6 31.1 -7.4%
211.0 165.7 -21.5%
2014 2015 (E)/(D)
(D) (E) %
161.8 95.6 -40.9%
50.5 21.6 -57.2%
212.4 117.2 -44.8%
Menu

2014 2015 (E)/(D)
(D) (E) %
324.0 254.1 -21.6%
46.8 39.1 -16.6%
370.8 293.2 -20.9%
91.7 85.0 -7.2%
64.4 62.8 -2.6%
18.0 12.8 -29.2%
196.7 132.6 -32.6%
53.0% 45.2%
11.5% 5.5%
104.2 0.0 -100.0%
704.6 654.7 -7.1%
590.8 518.3 -12.3%
113.9 136.4 19.8%
80.9 80.7 -0.2%
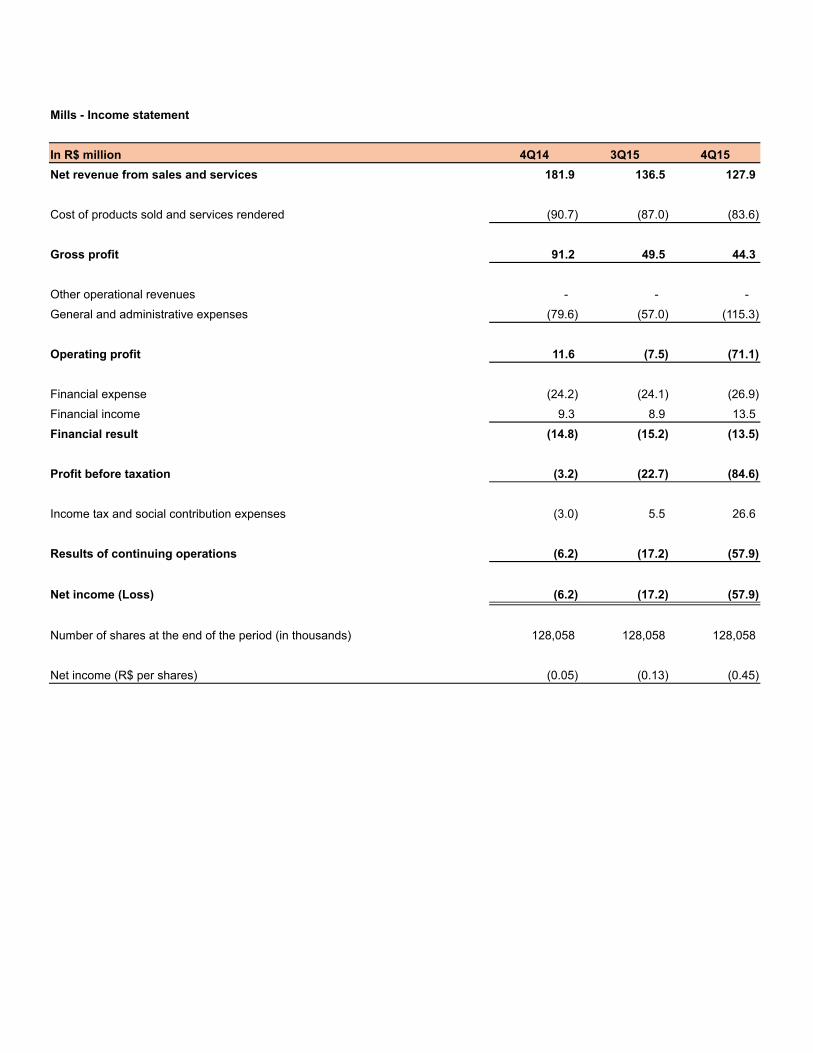
Mills - Income statement
In R$ million 4Q14 3Q15 4Q15
Net revenue from sales and services 181.9 136.5 127.9
Cost of products sold and services rendered (90.7) (87.0) (83.6)
Gross profit 91.2 49.5 44.3
Other operational revenues - - -
General and administrative expenses (79.6) (57.0) (115.3)
Operating profit 11.6 (7.5) (71.1)
Financial expense (24.2) (24.1) (26.9)
Financial income 9.3 8.9 13.5
Financial result (14.8) (15.2) (13.5)
Profit before taxation (3.2) (22.7) (84.6)
Income tax and social contribution expenses (3.0) 5.5 26.6
Results of continuing operations (6.2) (17.2) (57.9)
Net income (Loss) (6.2) (17.2) (57.9)
Number of shares at the end of the period (in thousands) 128,058 128,058 128,058
Net income (R$ per shares) (0.05) (0.13) (0.45)
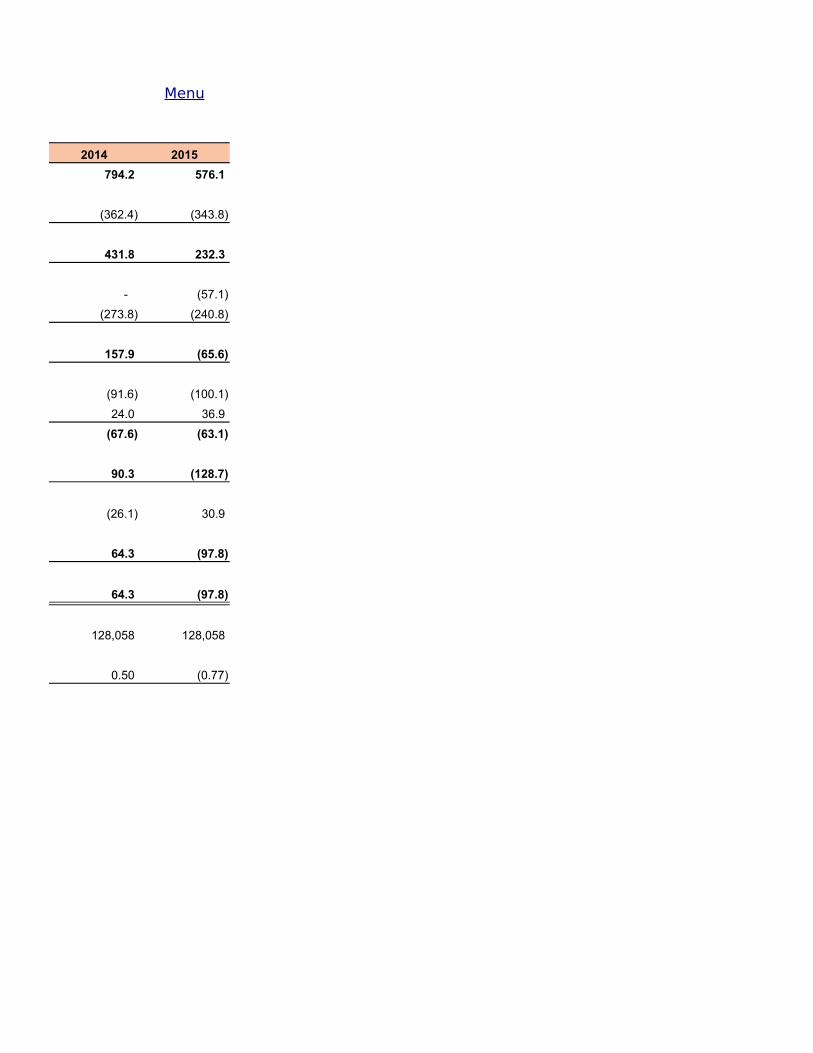
2014 2015
794.2 576.1
(362.4) (343.8)
431.8 232.3
- (57.1)
(273.8) (240.8)
157.9 (65.6)
(91.6) (100.1)
24.0 36.9
(67.6) (63.1)
90.3 (128.7)
(26.1) 30.9
64.3 (97.8)
64.3 (97.8)
128,058 128,058
0.50 (0.77)
Menu
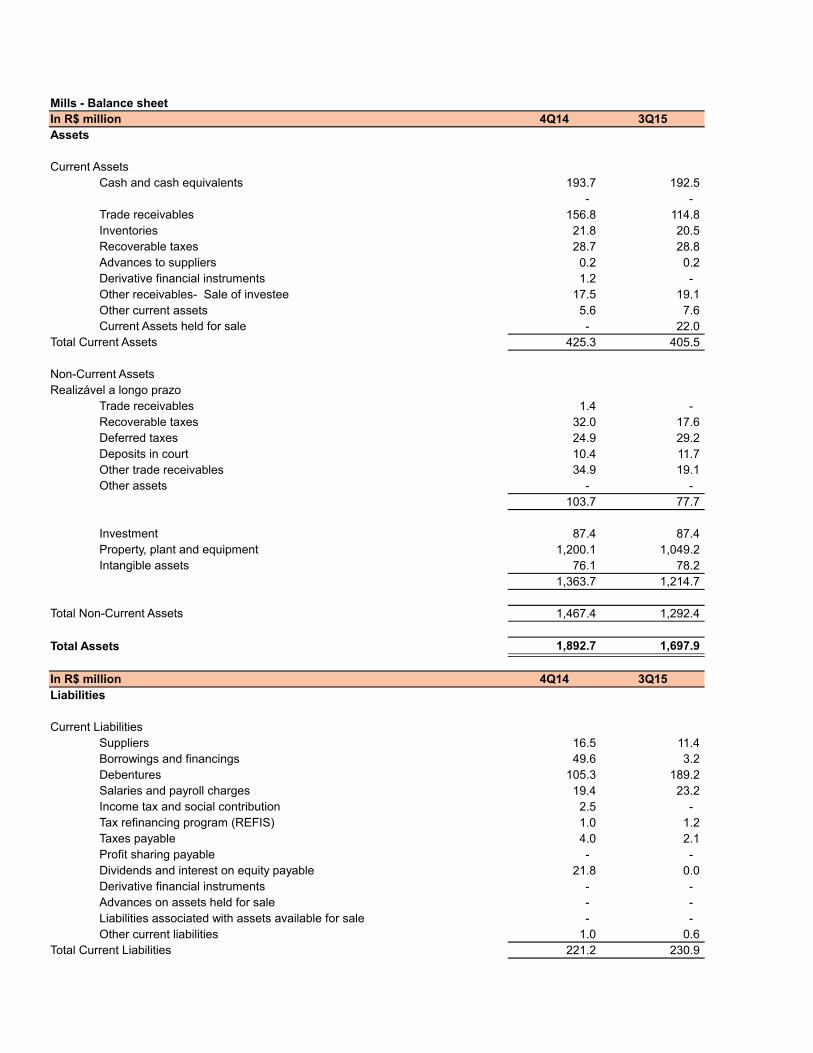
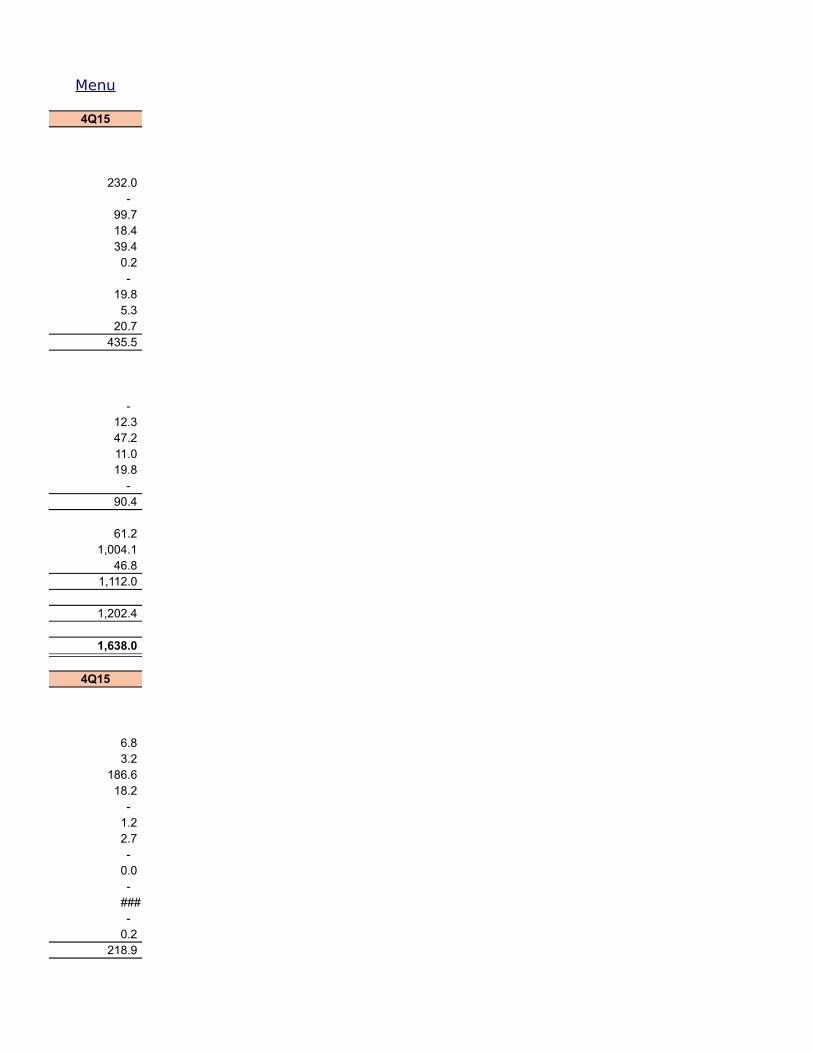
Mills - Balance sheetIn R$ million 4Q14 3Q15Assets
Current AssetsCash and cash equivalents 193.7 192.5
- - Trade receivables 156.8 114.8 Inventories 21.8 20.5 Recoverable taxes 28.7 28.8 Advances to suppliers 0.2 0.2 Derivative financial instruments 1.2 - Other receivables- Sale of investee 17.5 19.1 Other current assets 5.6 7.6 Current Assets held for sale - 22.0
Total Current Assets 425.3 405.5
Non-Current AssetsRealizável a longo prazo
Trade receivables 1.4 - Recoverable taxes 32.0 17.6 Deferred taxes 24.9 29.2 Deposits in court 10.4 11.7 Other trade receivables 34.9 19.1 Other assets - -
103.7 77.7
Investment 87.4 87.4 Property, plant and equipment 1,200.1 1,049.2 Intangible assets 76.1 78.2
1,363.7 1,214.7
Total Non-Current Assets 1,467.4 1,292.4
Total Assets 1,892.7 1,697.9
In R$ million 4Q14 3Q15Liabilities
Current LiabilitiesSuppliers 16.5 11.4 Borrowings and financings 49.6 3.2 Debentures 105.3 189.2 Salaries and payroll charges 19.4 23.2 Income tax and social contribution 2.5 - Tax refinancing program (REFIS) 1.0 1.2 Taxes payable 4.0 2.1 Profit sharing payable - - Dividends and interest on equity payable 21.8 0.0 Derivative financial instruments - - Advances on assets held for sale - - Liabilities associated with assets available for sale - - Other current liabilities 1.0 0.6
Total Current Liabilities 221.2 230.9
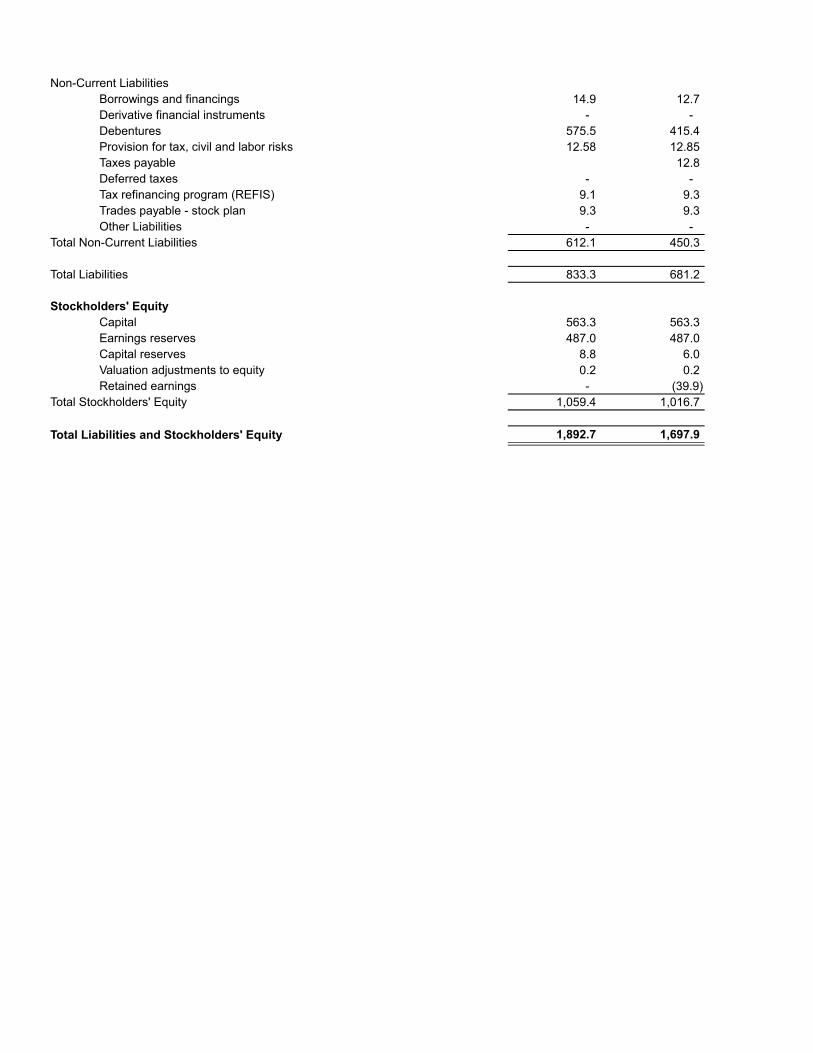
Non-Current LiabilitiesBorrowings and financings 14.9 12.7 Derivative financial instruments - - Debentures 575.5 415.4 Provision for tax, civil and labor risks 12.58 12.85 Taxes payable 12.8 Deferred taxes - - Tax refinancing program (REFIS) 9.1 9.3 Trades payable - stock plan 9.3 9.3 Other Liabilities - -
Total Non-Current Liabilities 612.1 450.3
Total Liabilities 833.3 681.2
Stockholders' EquityCapital 563.3 563.3 Earnings reserves 487.0 487.0 Capital reserves 8.8 6.0 Valuation adjustments to equity 0.2 0.2 Retained earnings - (39.9)
Total Stockholders' Equity 1,059.4 1,016.7
Total Liabilities and Stockholders' Equity 1,892.7 1,697.9
4Q15
232.0 - 99.7 18.4 39.4 0.2 - 19.8 5.3 20.7 435.5
- 12.3 47.2 11.0 19.8 - 90.4
61.2 1,004.1 46.8 1,112.0
1,202.4
1,638.0
4Q15
6.8 3.2 186.6 18.2 - 1.2 2.7 - 0.0 -
### - 0.2 218.9
Menu
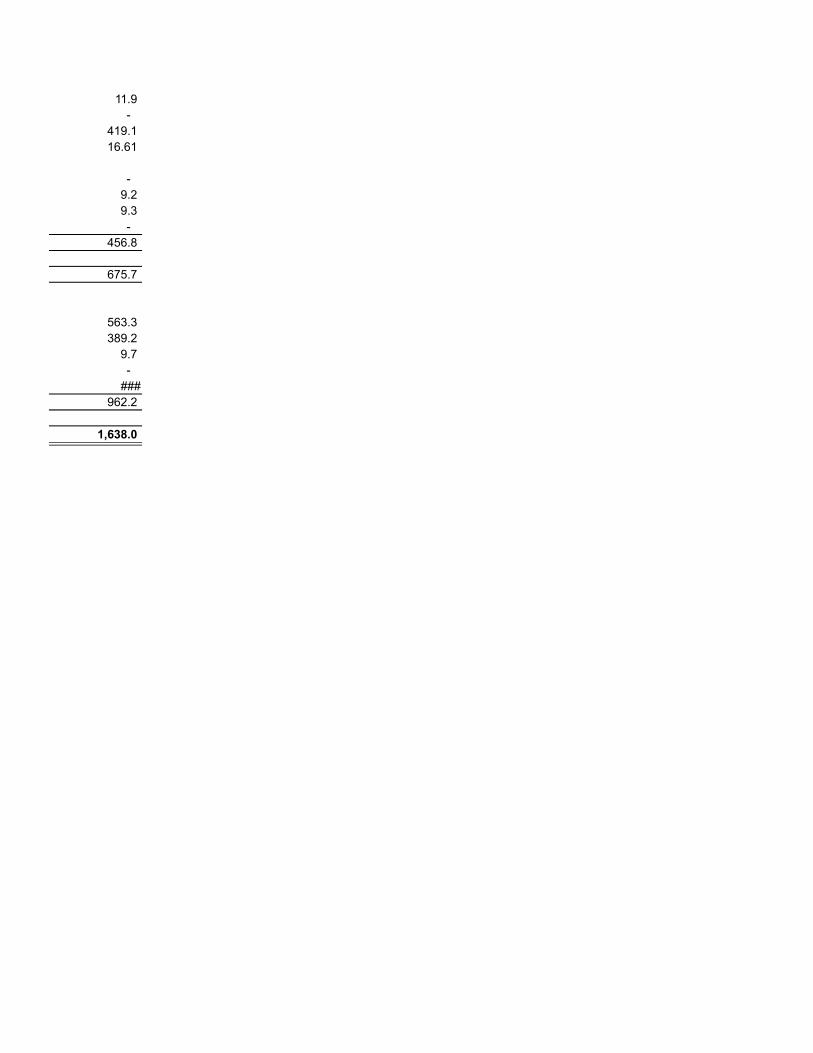
11.9 - 419.1 16.61
- 9.2 9.3 - 456.8
675.7
563.3 389.2 9.7 -
### 962.2
1,638.0
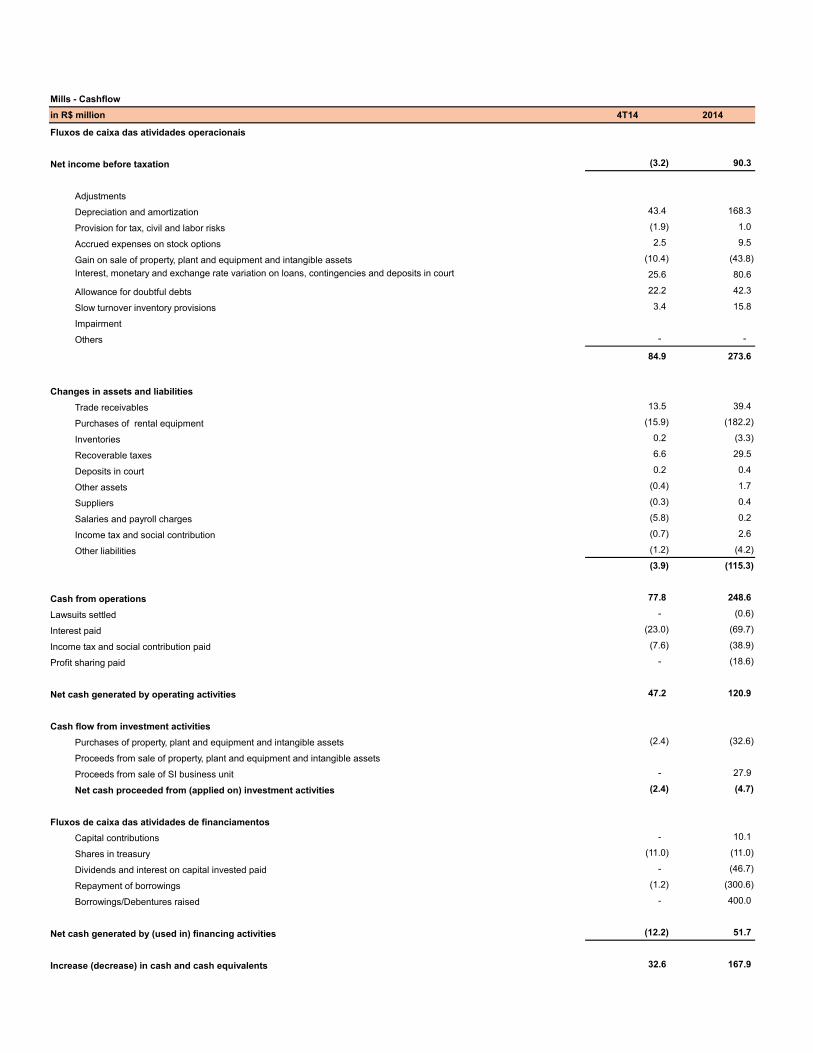
Mills - Cashflow
in R$ million 4T14 2014
Fluxos de caixa das atividades operacionais
Net income before taxation (3.2) 90.3
Adjustments
Depreciation and amortization 43.4 168.3
Provision for tax, civil and labor risks (1.9) 1.0
Accrued expenses on stock options 2.5 9.5
Gain on sale of property, plant and equipment and intangible assets (10.4) (43.8)
Interest, monetary and exchange rate variation on loans, contingencies and deposits in court 25.6 80.6
Allowance for doubtful debts 22.2 42.3
Slow turnover inventory provisions 3.4 15.8
Impairment
Others - -
84.9 273.6
Changes in assets and liabilities
Trade receivables 13.5 39.4
Purchases of rental equipment (15.9) (182.2)
Inventories 0.2 (3.3)
Recoverable taxes 6.6 29.5
Deposits in court 0.2 0.4
Other assets (0.4) 1.7
Suppliers (0.3) 0.4
Salaries and payroll charges (5.8) 0.2
Income tax and social contribution (0.7) 2.6
Other liabilities (1.2) (4.2)
(3.9) (115.3)
Cash from operations 77.8 248.6
Lawsuits settled - (0.6)
Interest paid (23.0) (69.7)
Income tax and social contribution paid (7.6) (38.9)
Profit sharing paid - (18.6)
Net cash generated by operating activities 47.2 120.9
Cash flow from investment activities
Purchases of property, plant and equipment and intangible assets (2.4) (32.6)
Proceeds from sale of property, plant and equipment and intangible assets
Proceeds from sale of SI business unit - 27.9
Net cash proceeded from (applied on) investment activities (2.4) (4.7)
Fluxos de caixa das atividades de financiamentos
Capital contributions - 10.1
Shares in treasury (11.0) (11.0)
Dividends and interest on capital invested paid - (46.7)
Repayment of borrowings (1.2) (300.6)
Borrowings/Debentures raised - 400.0
Net cash generated by (used in) financing activities (12.2) 51.7
Increase (decrease) in cash and cash equivalents 32.6 167.9
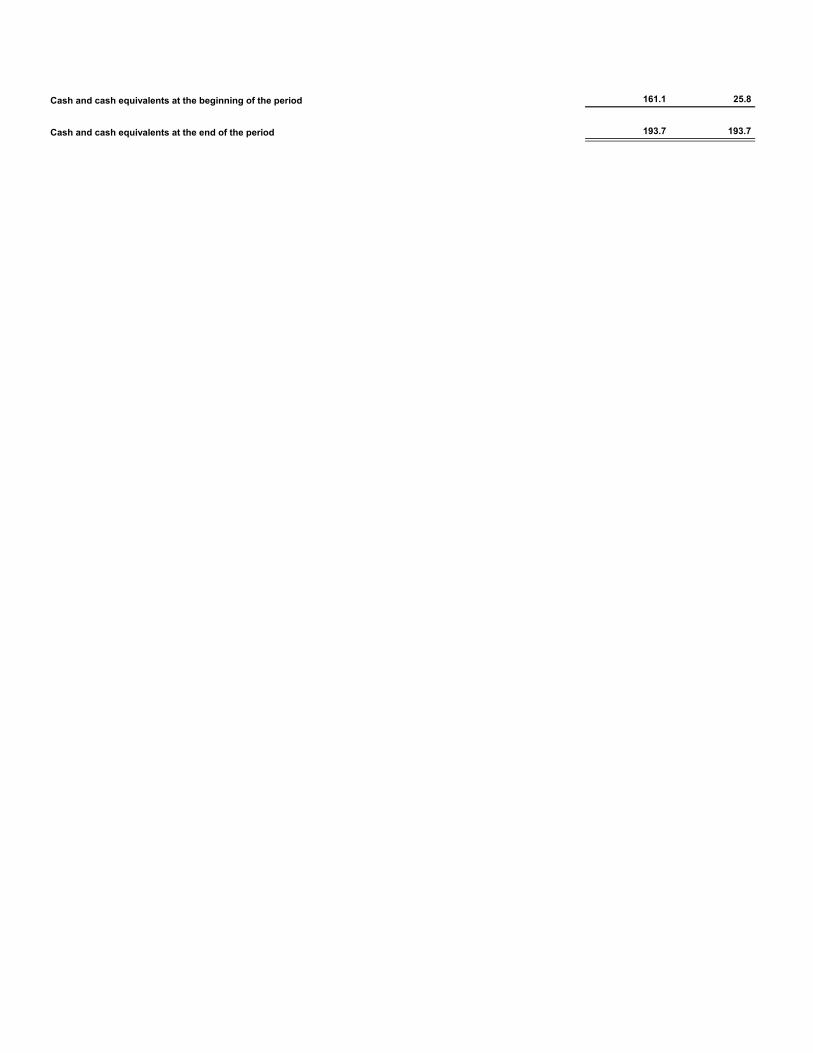
Cash and cash equivalents at the beginning of the period 161.1 25.8
Cash and cash equivalents at the end of the period 193.7 193.7
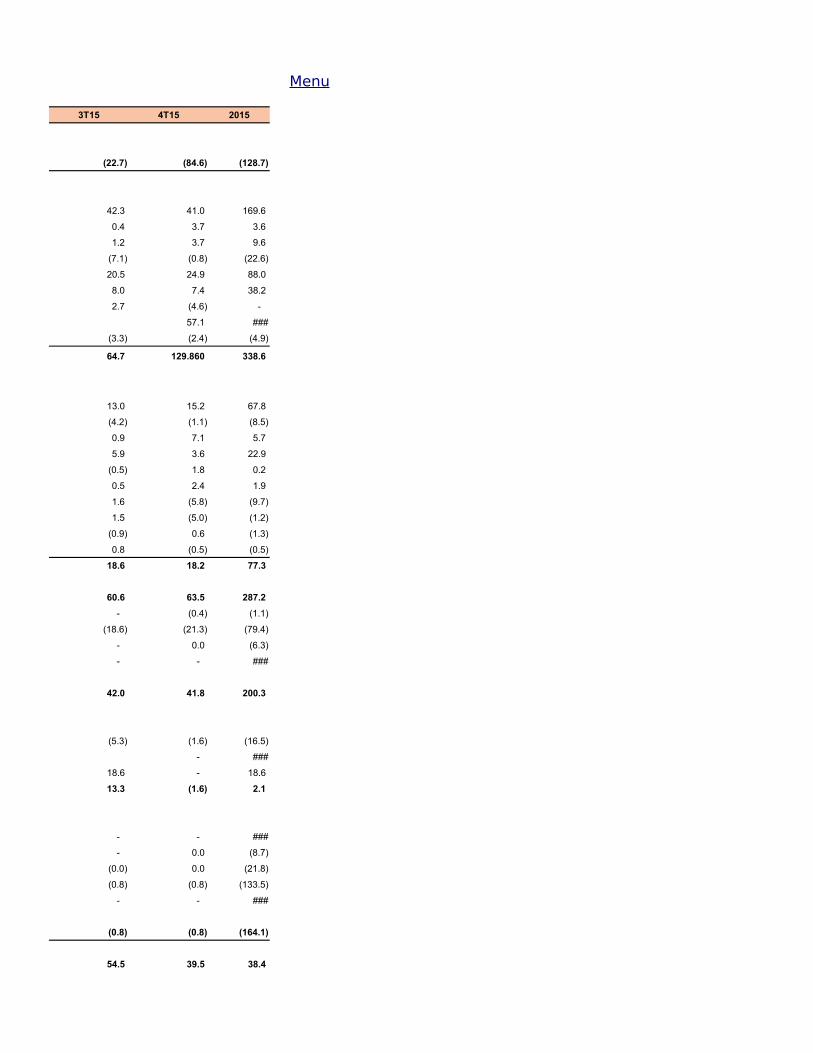
3T15 4T15 2015
(22.7) (84.6) (128.7)
42.3 41.0 169.6
0.4 3.7 3.6
1.2 3.7 9.6
(7.1) (0.8) (22.6)
20.5 24.9 88.0
8.0 7.4 38.2
2.7 (4.6) -
57.1 ###
(3.3) (2.4) (4.9)
64.7 129.860 338.6
13.0 15.2 67.8
(4.2) (1.1) (8.5)
0.9 7.1 5.7
5.9 3.6 22.9
(0.5) 1.8 0.2
0.5 2.4 1.9
1.6 (5.8) (9.7)
1.5 (5.0) (1.2)
(0.9) 0.6 (1.3)
0.8 (0.5) (0.5)
18.6 18.2 77.3
60.6 63.5 287.2
- (0.4) (1.1)
(18.6) (21.3) (79.4)
- 0.0 (6.3)
- - ###
42.0 41.8 200.3
(5.3) (1.6) (16.5)
- ###
18.6 - 18.6
13.3 (1.6) 2.1
- - ###
- 0.0 (8.7)
(0.0) 0.0 (21.8)
(0.8) (0.8) (133.5)
- - ###
(0.8) (0.8) (164.1)
54.5 39.5 38.4
Menu
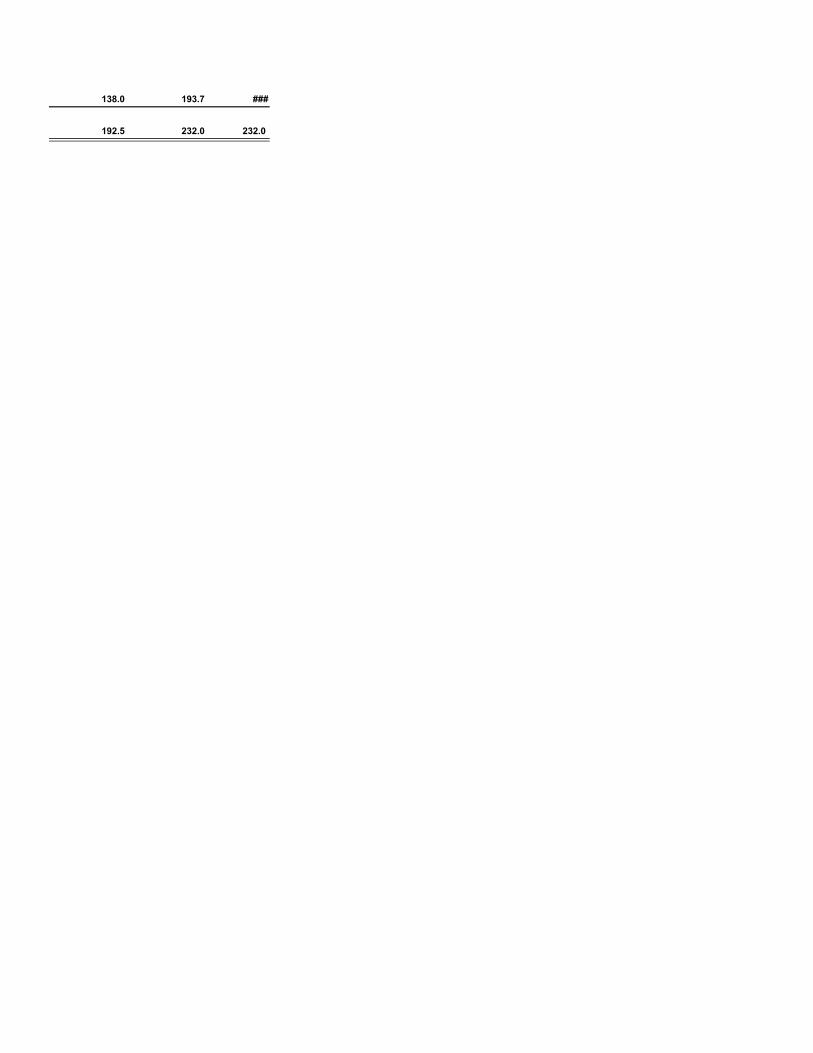
138.0 193.7 ###
192.5 232.0 232.0