Embed Size (px)
DESCRIPTION
en inglés
Citation preview

MicroeconomicsFirst Edition
Chapter 5Individual and Market Demand
Copyright © 2013 by Worth Publishers
Austan Goolsbee, Steven Levitt, Chad Syverson

Figure 5.1 A Consumer’s Response to an Increase in Income When Both Goods Are NormalGoolsbee, Levitt, Syverson: Microeconomics, First EditionCopyright © 2013 by Worth Publishers

Figure 5.2 A Consumer’s Response to an Increase in Income When One Good Is InferiorGoolsbee, Levitt, Syverson: Microeconomics, First EditionCopyright © 2013 by Worth Publishers

Figure 5.3 The Income Expansion PathGoolsbee, Levitt, Syverson: Microeconomics, First EditionCopyright © 2013 by Worth Publishers

Figure 5.4 An Engel Curve Shows How Consumption Varies with IncomeGoolsbee, Levitt, Syverson: Microeconomics, First EditionCopyright © 2013 by Worth Publishers

Figure 5.5 Average New House Size and Household Income in the United States, 1975–2009Goolsbee, Levitt, Syverson: Microeconomics, First EditionCopyright © 2013 by Worth Publishers
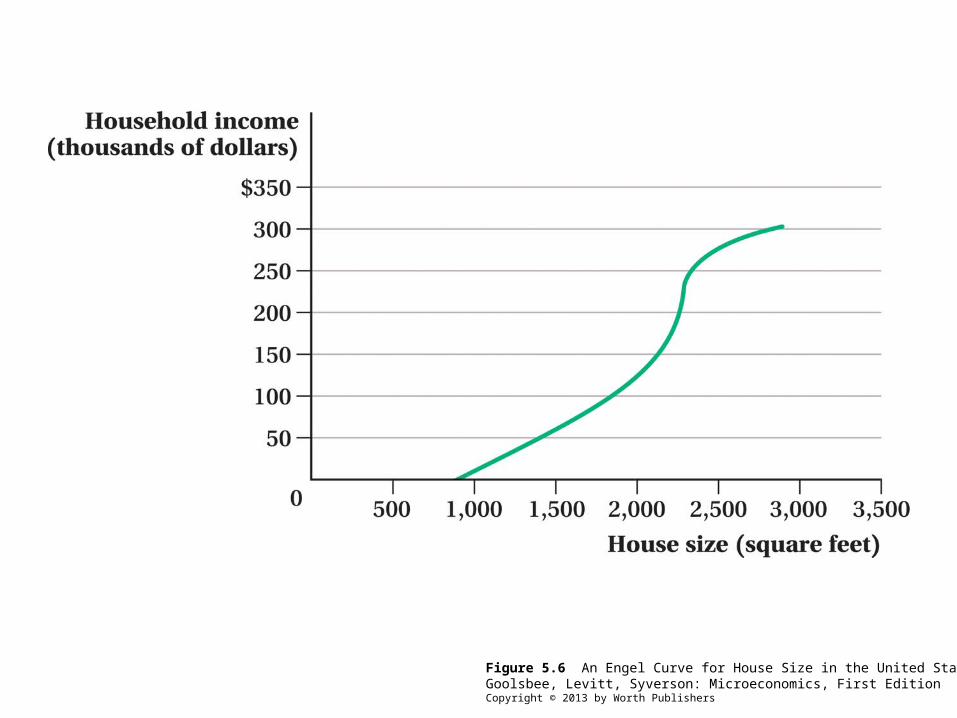
Figure 5.6 An Engel Curve for House Size in the United StatesGoolsbee, Levitt, Syverson: Microeconomics, First EditionCopyright © 2013 by Worth Publishers

Figure 5.7 Building an Individual’s Demand CurveGoolsbee, Levitt, Syverson: Microeconomics, First EditionCopyright © 2013 by Worth Publishers

Figure 5.8 Preference Changes and Shifts in the Demand CurveGoolsbee, Levitt, Syverson: Microeconomics, First EditionCopyright © 2013 by Worth Publishers

Figure 5.9 The Effects of a Fall in the Price of Restaurant MealsGoolsbee, Levitt, Syverson: Microeconomics, First EditionCopyright © 2013 by Worth Publishers

Figure 5.10 Substitution and Income Effects for Two Normal GoodsGoolsbee, Levitt, Syverson: Microeconomics, First EditionCopyright © 2013 by Worth Publishers

Figure 5.10 (a) Substitution and Income Effects for Two Normal GoodsGoolsbee, Levitt, Syverson: Microeconomics, First EditionCopyright © 2013 by Worth Publishers

Figure 5.10 (b) Substitution and Income Effects for Two Normal GoodsGoolsbee, Levitt, Syverson: Microeconomics, First EditionCopyright © 2013 by Worth Publishers

Figure 5.10 (c) Substitution and Income Effects for Two Normal GoodsGoolsbee, Levitt, Syverson: Microeconomics, First EditionCopyright © 2013 by Worth Publishers

Figure 5.11 The Shape of Indifference Curves Determines the Size of the Substitution EffectGoolsbee, Levitt, Syverson: Microeconomics, First EditionCopyright © 2013 by Worth Publishers

Figure 5.12 Backward-Bending Labor SupplyGoolsbee, Levitt, Syverson: Microeconomics, First EditionCopyright © 2013 by Worth Publishers
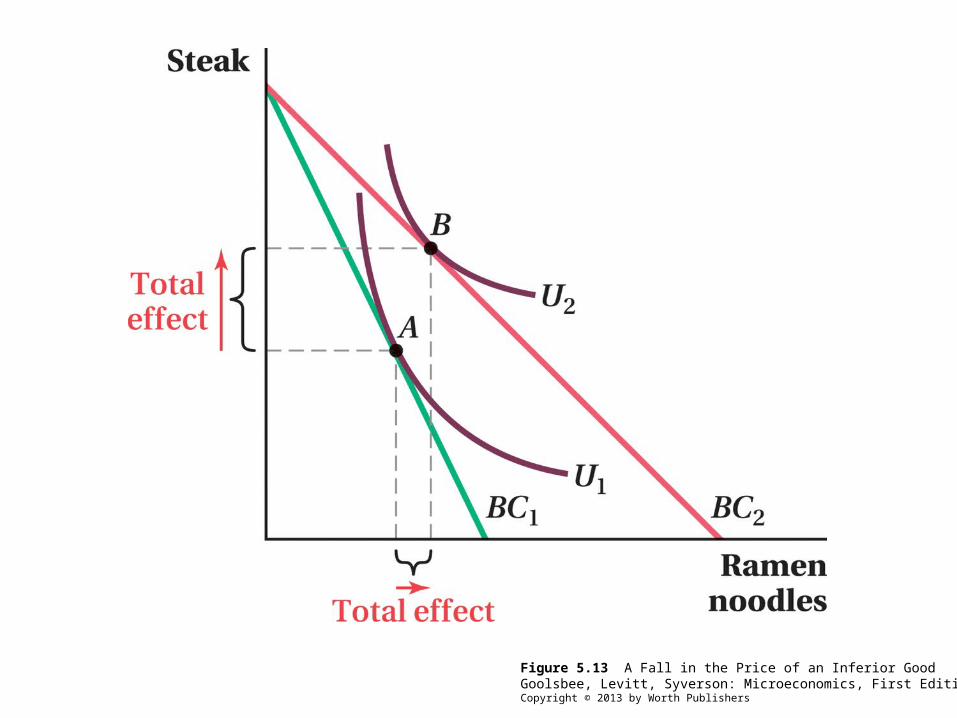
Figure 5.13 A Fall in the Price of an Inferior GoodGoolsbee, Levitt, Syverson: Microeconomics, First EditionCopyright © 2013 by Worth Publishers
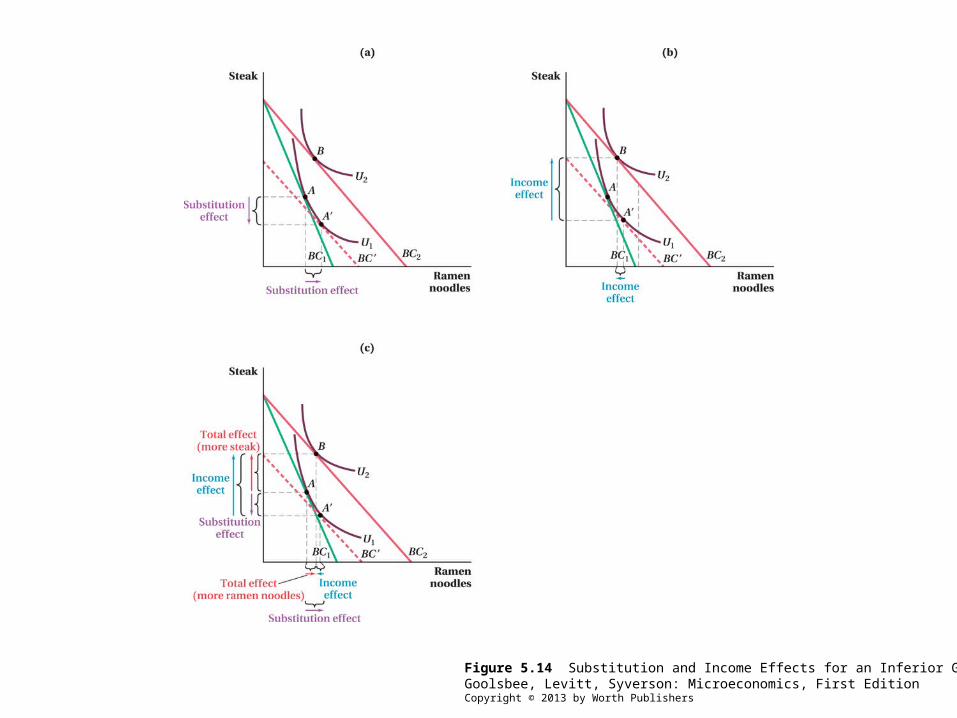
Figure 5.14 Substitution and Income Effects for an Inferior GoodGoolsbee, Levitt, Syverson: Microeconomics, First EditionCopyright © 2013 by Worth Publishers

Figure 5.14 (a) Substitution and Income Effects for an Inferior GoodGoolsbee, Levitt, Syverson: Microeconomics, First EditionCopyright © 2013 by Worth Publishers
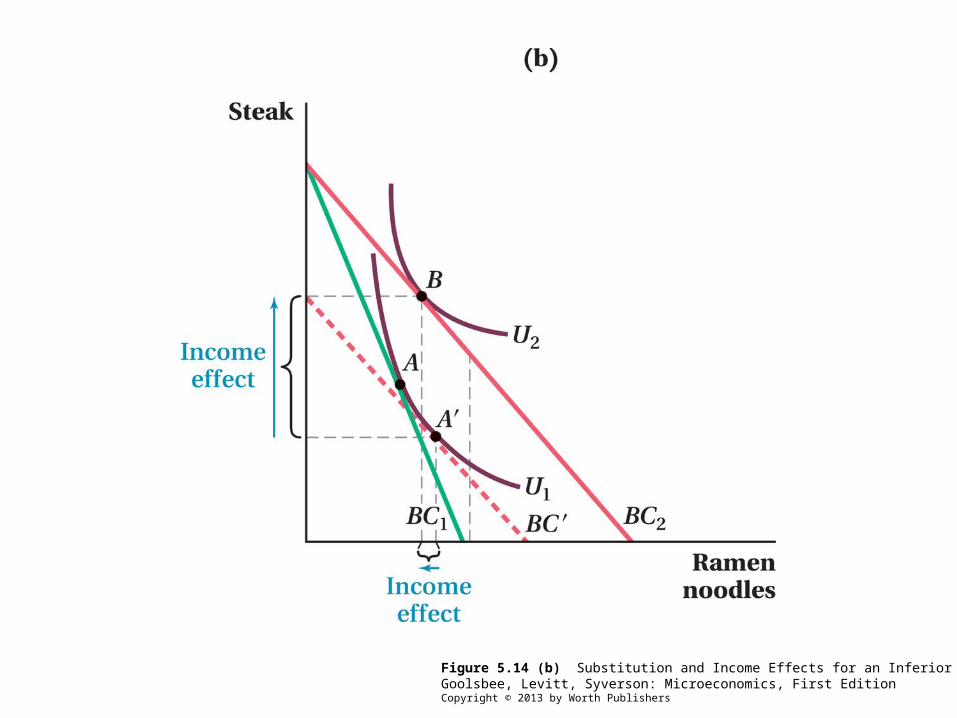
Figure 5.14 (b) Substitution and Income Effects for an Inferior GoodGoolsbee, Levitt, Syverson: Microeconomics, First EditionCopyright © 2013 by Worth Publishers
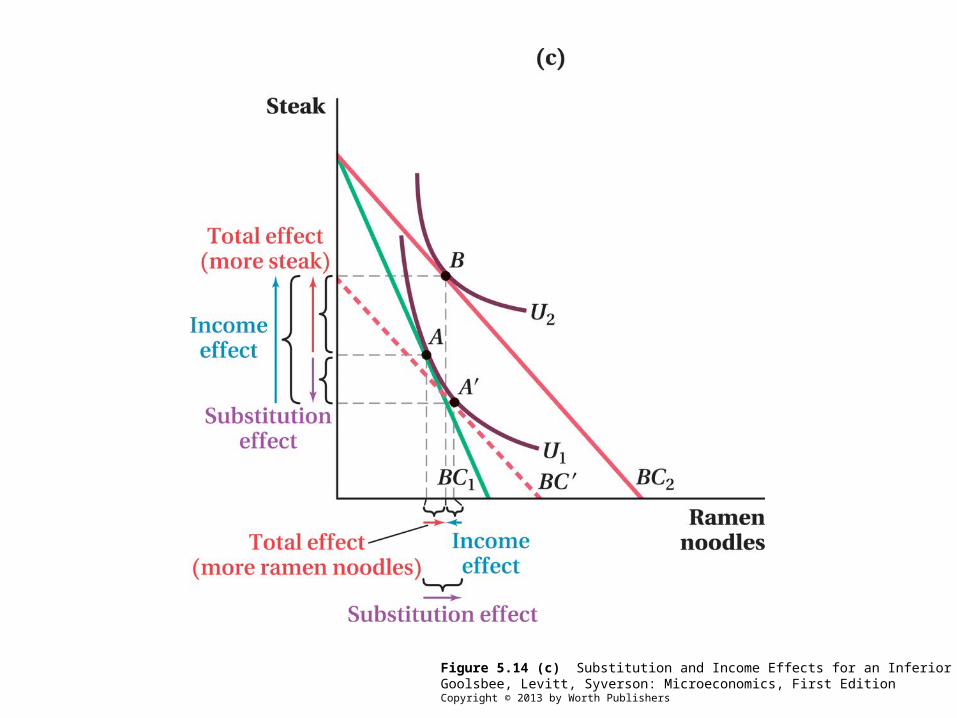
Figure 5.14 (c) Substitution and Income Effects for an Inferior GoodGoolsbee, Levitt, Syverson: Microeconomics, First EditionCopyright © 2013 by Worth Publishers

Figure 5.15 A Change in the Price of a Giffen GoodGoolsbee, Levitt, Syverson: Microeconomics, First EditionCopyright © 2013 by Worth Publishers
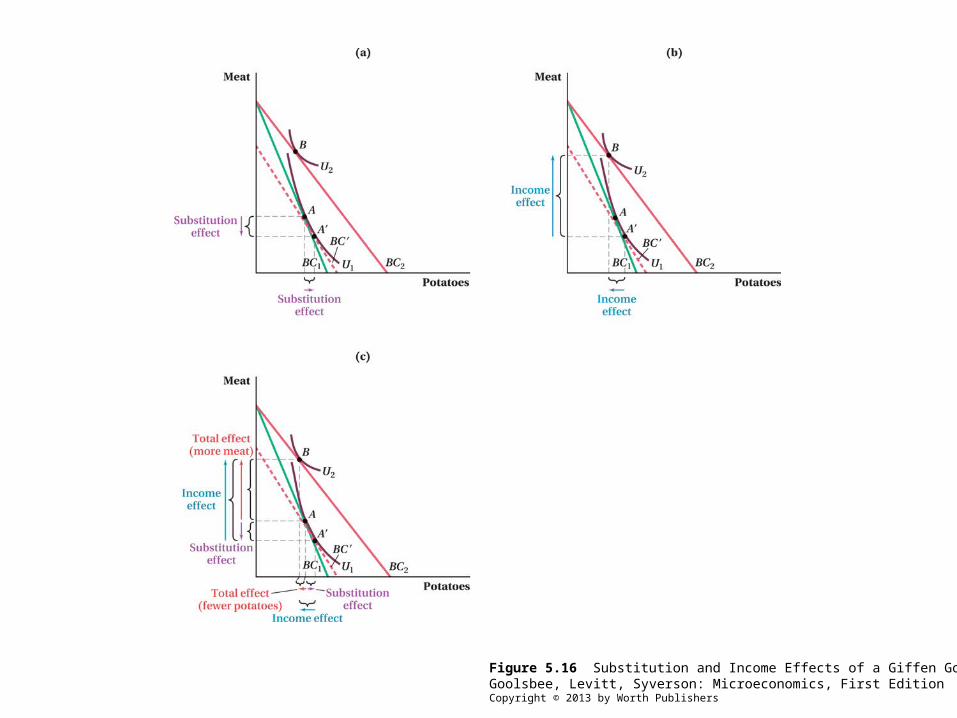
Figure 5.16 Substitution and Income Effects of a Giffen GoodGoolsbee, Levitt, Syverson: Microeconomics, First EditionCopyright © 2013 by Worth Publishers

Figure 5.16 (a) Substitution and Income Effects of a Giffen GoodGoolsbee, Levitt, Syverson: Microeconomics, First EditionCopyright © 2013 by Worth Publishers
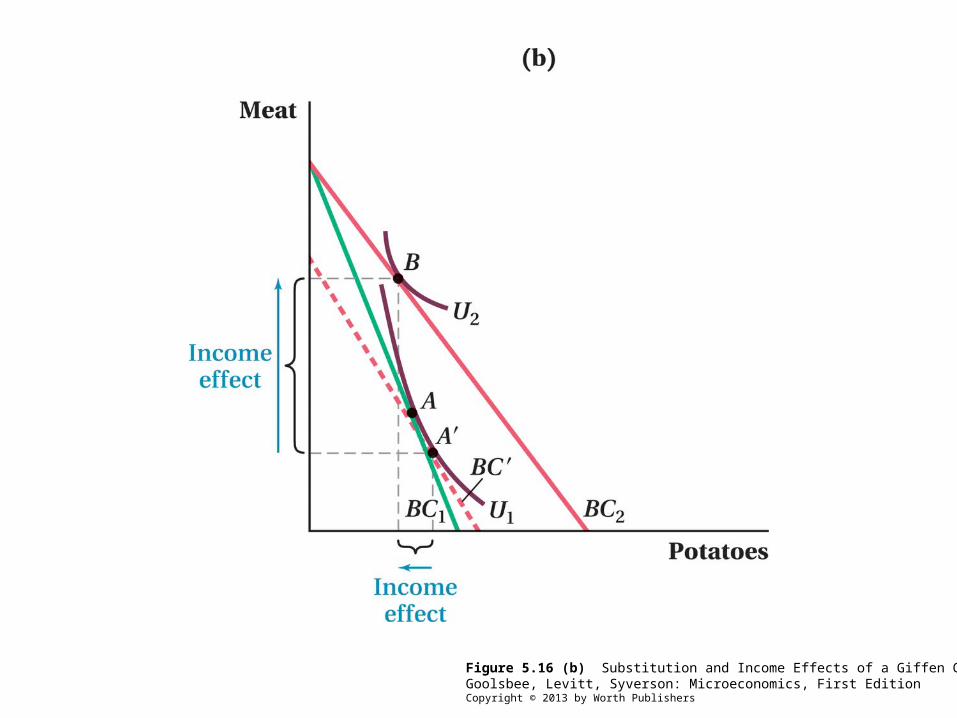
Figure 5.16 (b) Substitution and Income Effects of a Giffen GoodGoolsbee, Levitt, Syverson: Microeconomics, First EditionCopyright © 2013 by Worth Publishers

Figure 5.16 (c) Substitution and Income Effects of a Giffen GoodGoolsbee, Levitt, Syverson: Microeconomics, First EditionCopyright © 2013 by Worth Publishers

Figure 5.17 When the Price of a Substitute Rises, Demand RisesGoolsbee, Levitt, Syverson: Microeconomics, First EditionCopyright © 2013 by Worth Publishers

Figure 5.18 When the Price of a Complement Rises, Demand FallsGoolsbee, Levitt, Syverson: Microeconomics, First EditionCopyright © 2013 by Worth Publishers
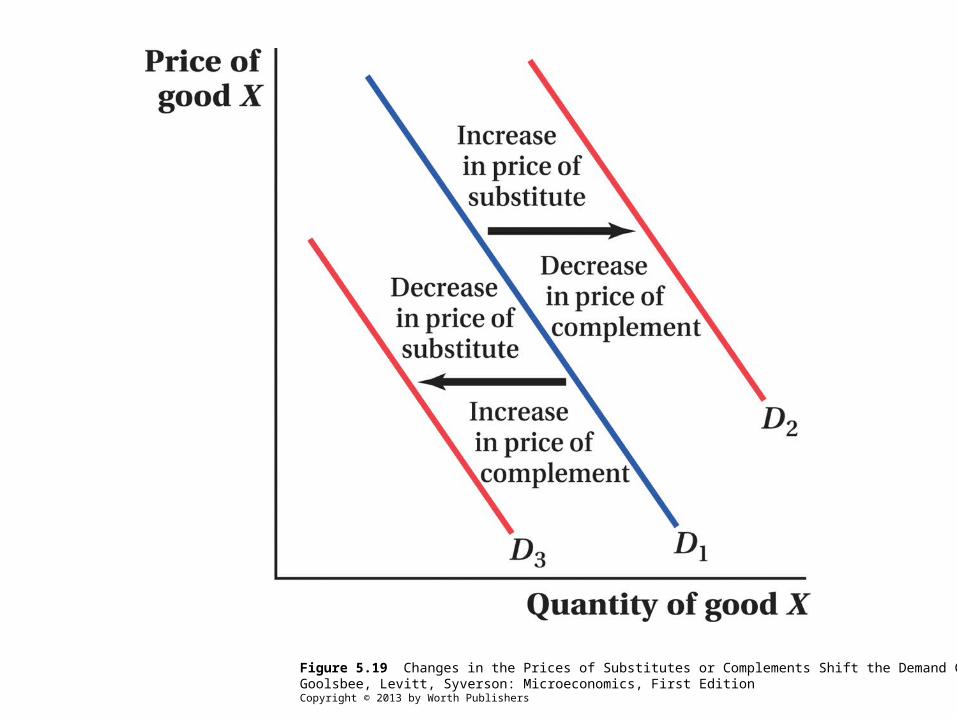
Figure 5.19 Changes in the Prices of Substitutes or Complements Shift the Demand CurveGoolsbee, Levitt, Syverson: Microeconomics, First EditionCopyright © 2013 by Worth Publishers

Figure 5.20 U.S. Total Box Office and Tickets Sold per Capita, 1980–2010Goolsbee, Levitt, Syverson: Microeconomics, First EditionCopyright © 2013 by Worth Publishers

Figure 5.21 The Market Demand CurveGoolsbee, Levitt, Syverson: Microeconomics, First EditionCopyright © 2013 by Worth Publishers