Embed Size (px)
Citation preview

Biogeosciences, 6, 209–223, 2009www.biogeosciences.net/6/209/2009/© Author(s) 2009. This work is distributed underthe Creative Commons Attribution 3.0 License.
Biogeosciences
Methane dynamics in different boreal lake types
S. Juutinen1,*, M. Rantakari 2, P. Kortelainen2, J. T. Huttunen3,†, T. Larmola1,** , J. Alm4, J. Silvola1, andP. J. Martikainen3
1Department of Biology, University of Joensuu, Finland2Finnish Environment Institute, Helsinki, Finland3Department of Environmental Sciences, University of Kuopio, Finland4Finnish Forest Research Institute, Joensuu Research Unit, Finland* now at: Mount Holyoke College, Environmental Studies Program, USA** now at: Department of Forest Ecology, University of Helsinki, Finland†Passed away during the course of the project
Received: 30 July 2008 – Published in Biogeosciences Discuss.: 1 September 2008Revised: 6 January 2009 – Accepted: 23 January 2009 – Published: 16 February 2009
Abstract. This study explores the variability in concen-trations of dissolved CH4 and annual flux estimates in thepelagic zone in a statistically defined sample of 207 lakesin Finland. The lakes were situated in the boreal zone, inan area where the mean annual air temperature ranges from−2.8 to 5.9◦C. We examined how lake CH4 dynamics re-lated to regional lake types assessed according to the EU wa-ter framework directive. Ten lake types were defined on thebasis of water chemistry, color, and size. Lakes were sam-pled for dissolved CH4 concentrations four times per year,at four different depths at the deepest point of each lake.We found that CH4 concentrations and fluxes to the atmo-sphere tended to be high in nutrient rich calcareous lakes,and that the shallow lakes had the greatest surface water con-centrations. Methane concentration in the hypolimnion wasrelated to oxygen and nutrient concentrations, and to lakedepth or lake area. The surface water CH4 concentrationwas related to the depth or area of lake. Methane concen-tration close to the bottom can be viewed as proxy of lakestatus in terms of frequency of anoxia and nutrient levels.The mean pelagic CH4 release from randomly selected lakeswas 49 mmol m−2 a−1. The sum CH4 flux (storage and dif-fusion) correlated with lake depth, area and nutrient content,and CH4 release was greatest from the shallow nutrient richand humic lakes. Our results support earlier lake studiesregarding the regulating factors and also the magnitude ofglobal emission estimate. These results propose that in bo-
Correspondence to:S. Juutinen([email protected])
real region small lakes have higher CH4 fluxes per unit areathan larger lakes, and that the small lakes have a dispropor-tionate significance regarding to the CH4 release.
1 Introduction
With accumulating information, lakes have grown in signifi-cance as regional and global sources of atmospheric methane(CH4). Most recent annual lake CH4 emission estimates are8–48 Tg, i.e. 6–16% of the global natural CH4 emissions(Bastviken et al., 2004), and 24.2±10.5 Tg (Walter et al.,2007). Saarnio et al. (2008) estimated that large lakes alonecontribute to 24% of all wetland CH4 emissions in Europe.The current study contributes to the fact that small lakes mayhave proportionally high significance in element fluxes inthe landscapes (see Cole et al., 2007). The smallest lakesare shown to have high sedimentation rates and large CO2and CH4 emissions per unit area in samples of arctic, bo-real and temperate lakes (Michmerhuizen et al., 1996; Ko-rtelainen et al., 2000; Bastviken et al., 2004; Kortelainen etal., 2004 and 2006; Walter et al., 2007). Particularly smalllakes in the areas of thawing permafrost form significant spotsources of atmospheric CH4 (Hamilton et al., 1994; Walter etal., 2007). The new estimates of number and area of globallakes emphasized the high number of small lakes in the bo-real and arctic regions (Downing et al., 2006). These smallwater bodies are susceptible to ongoing changes in climateand land use, which may notably alter the lake environmentand their CH4 fluxes. For example, increasing or decreasinglake areas as a consequence of shifts in water balance have
Published by Copernicus Publications on behalf of the European Geosciences Union.

210 S. Juutinen et al.: Methane dynamics in different boreal lake types
20º
69º
31º
60º
Arctic Circle
Sweden
Norway
Russia
Baltic Sea 0 100 km
Fig. 1. Geographical distribution of the statistic sample of 177 lakesfrom Finnish Lake Survey data base (open symbols), and the addi-tional sample of 30 lakes with the highest total phosphorous con-centration (filled triangles).
been documented recently for northern lakes (e.g. Smith etal., 2005; Smol et al., 2007). In order to better understandthe drivers behind the variability in the observed emissions,to reduce uncertainty in global estimates, and to estimatethe anthropogenic influence on lake-derived CH4 emissions,comparison of CH4 dynamics and net emissions in differenttypes of lakes is required.
The production of CH4 in freshwater lake sediments isa microbial process, mainly regulated by the presence ofanoxia, temperature, and the amount and quality of substrates(Rudd and Hamilton, 1978; Strayer and Tiedje, 1978; Kellyand Chynoweth, 1981; Liikanen et al., 2003). Methane con-centration in the water column, in turn, is affected by manybiological and physical processes. A large proportion of CH4produced in the sediment can be consumed at the sedimentsurface or in the water column by methanotrophs, a processthat contributes to oxygen deficiency (e.g. Rudd and Hamil-ton, 1978; Bastviken et al., 2002; Liikanen et al., 2002;Kankaala et al., 2006). The retention of CH4 in the water
column, the rate of gas transport and liberation of CH4 fromthe surface are determined by several factors: stratificationand seasonal overturns of the water mass driven by temper-ature, wind forced mixing, diffusion along the concentrationgradient, boundary layer dynamics, bubble formation andplant mediated transport (Dacey and Klug, 1979; Chantonet al., 1989; MacIntyre et al., 1995; Michmerhuizen et al.,1996; Bastviken et al., 2004; Bastviken et al., 2008). Gen-erally, high micro- and macrophyte production rate, smallwater volume, and high organic carbon content all promotethe formation of anoxic hypolimnion and are related to in-creased concentrations and fluxes of CH4 (Michmerhuizen etal., 1996; Riera et al., 1999; Huttunen et al., 2003; Bastvikenet al., 2004; Kankaala et al., 2007).
Lake typology might provide a tool to deal with the phys-ical and biological features of lake ecosystems, and to find areasonable basis, for example, for estimation of CH4 fluxes.The European Union water framework directive (Directive2000/60/EC) requires the Member States to typify lakes inorder to recognize and improve the ecological status of lakes.The aim is to meet the natural status of the each lake type.Regional typologies are based on morphometry and wa-ter chemistry. Besides the European Union, an ecosystem-specific framework for nutrient criteria was recently pre-sented in the North-America by Sorrano et al. (2008). Thiskind of approach could link the studies of the greenhouse gasmethane to overall environmental monitoring of lakes.
We report the variability in dissolved CH4 concentrationsand storage change and diffusive CH4 fluxes as derived fromthe concentrations in a statistically defined sample of 207 bo-real lakes in Finland. The data are distributed according toregional lake typology (Vuori et al., 2006) based on simplewater quality and morphometric measurements. We exam-ine 1) a lake type as an indicator of the CH4 concentrationsand fluxes, 2) quantitative relationships among CH4 concen-trations and fluxes and water chemistry, morphological, andclimatic variables, and 3) the relationship between the occur-rence of anoxia, nutrient content and CH4 concentration. Thesame water samples have been analyzed for CO2 and thoseresults were presented in Kortelainen et al. (2006).
2 Materials and methods
2.1 Study lakes and lake typology
Dissolved methane concentrations were examined from 207Finnish lakes (Fig. 1). Data consisted of a random sam-ple, including 177 lakes, and 30 additional lakes with thehighest total phosphorus content from the Finnish Lake Sur-vey database (see Mannio et al., 2000; Rantakari and Korte-lainen, 2005 and Kortelainen et al., 2006 for details). The30 lakes were included in order to balance the distribution ofoligotrophic and eutrophic lakes in our CH4 study. In all, theFinnish Lake Survey database contains 874 lakes larger than
Biogeosciences, 6, 209–223, 2009 www.biogeosciences.net/6/209/2009/
S. Juutinen et al.: Methane dynamics in different boreal lake types 211
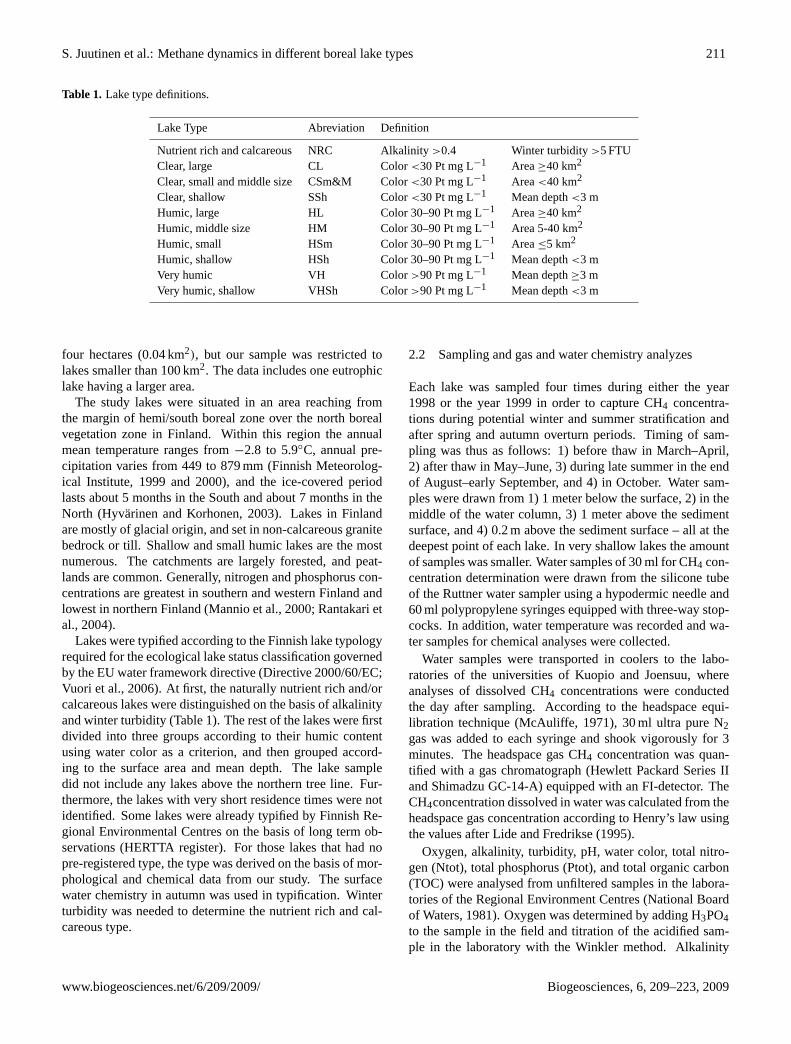
Table 1. Lake type definitions.
Lake Type Abreviation Definition
Nutrient rich and calcareous NRC Alkalinity>0.4 Winter turbidity>5 FTUClear, large CL Color<30 Pt mg L−1 Area≥40 km2
Clear, small and middle size CSm&M Color<30 Pt mg L−1 Area<40 km2
Clear, shallow SSh Color<30 Pt mg L−1 Mean depth<3 mHumic, large HL Color 30–90 Pt mg L−1 Area≥40 km2
Humic, middle size HM Color 30–90 Pt mg L−1 Area 5-40 km2
Humic, small HSm Color 30–90 Pt mg L−1 Area≤5 km2
Humic, shallow HSh Color 30–90 Pt mg L−1 Mean depth<3 mVery humic VH Color>90 Pt mg L−1 Mean depth≥3 mVery humic, shallow VHSh Color>90 Pt mg L−1 Mean depth<3 m
four hectares (0.04 km2), but our sample was restricted tolakes smaller than 100 km2. The data includes one eutrophiclake having a larger area.
The study lakes were situated in an area reaching fromthe margin of hemi/south boreal zone over the north borealvegetation zone in Finland. Within this region the annualmean temperature ranges from−2.8 to 5.9◦C, annual pre-cipitation varies from 449 to 879 mm (Finnish Meteorolog-ical Institute, 1999 and 2000), and the ice-covered periodlasts about 5 months in the South and about 7 months in theNorth (Hyvarinen and Korhonen, 2003). Lakes in Finlandare mostly of glacial origin, and set in non-calcareous granitebedrock or till. Shallow and small humic lakes are the mostnumerous. The catchments are largely forested, and peat-lands are common. Generally, nitrogen and phosphorus con-centrations are greatest in southern and western Finland andlowest in northern Finland (Mannio et al., 2000; Rantakari etal., 2004).
Lakes were typified according to the Finnish lake typologyrequired for the ecological lake status classification governedby the EU water framework directive (Directive 2000/60/EC;Vuori et al., 2006). At first, the naturally nutrient rich and/orcalcareous lakes were distinguished on the basis of alkalinityand winter turbidity (Table 1). The rest of the lakes were firstdivided into three groups according to their humic contentusing water color as a criterion, and then grouped accord-ing to the surface area and mean depth. The lake sampledid not include any lakes above the northern tree line. Fur-thermore, the lakes with very short residence times were notidentified. Some lakes were already typified by Finnish Re-gional Environmental Centres on the basis of long term ob-servations (HERTTA register). For those lakes that had nopre-registered type, the type was derived on the basis of mor-phological and chemical data from our study. The surfacewater chemistry in autumn was used in typification. Winterturbidity was needed to determine the nutrient rich and cal-careous type.
2.2 Sampling and gas and water chemistry analyzes
Each lake was sampled four times during either the year1998 or the year 1999 in order to capture CH4 concentra-tions during potential winter and summer stratification andafter spring and autumn overturn periods. Timing of sam-pling was thus as follows: 1) before thaw in March–April,2) after thaw in May–June, 3) during late summer in the endof August–early September, and 4) in October. Water sam-ples were drawn from 1) 1 meter below the surface, 2) in themiddle of the water column, 3) 1 meter above the sedimentsurface, and 4) 0.2 m above the sediment surface – all at thedeepest point of each lake. In very shallow lakes the amountof samples was smaller. Water samples of 30 ml for CH4 con-centration determination were drawn from the silicone tubeof the Ruttner water sampler using a hypodermic needle and60 ml polypropylene syringes equipped with three-way stop-cocks. In addition, water temperature was recorded and wa-ter samples for chemical analyses were collected.
Water samples were transported in coolers to the labo-ratories of the universities of Kuopio and Joensuu, whereanalyses of dissolved CH4 concentrations were conductedthe day after sampling. According to the headspace equi-libration technique (McAuliffe, 1971), 30 ml ultra pure N2gas was added to each syringe and shook vigorously for 3minutes. The headspace gas CH4 concentration was quan-tified with a gas chromatograph (Hewlett Packard Series IIand Shimadzu GC-14-A) equipped with an FI-detector. TheCH4concentration dissolved in water was calculated from theheadspace gas concentration according to Henry’s law usingthe values after Lide and Fredrikse (1995).
Oxygen, alkalinity, turbidity, pH, water color, total nitro-gen (Ntot), total phosphorus (Ptot), and total organic carbon(TOC) were analysed from unfiltered samples in the labora-tories of the Regional Environment Centres (National Boardof Waters, 1981). Oxygen was determined by adding H3PO4to the sample in the field and titration of the acidified sam-ple in the laboratory with the Winkler method. Alkalinity
www.biogeosciences.net/6/209/2009/ Biogeosciences, 6, 209–223, 2009
212 S. Juutinen et al.: Methane dynamics in different boreal lake types
was measured by Gran titration. Conductivity was measuredconductometrically with temperature compensating cell. Thevalues of pH were obtained electrometrically at 25◦C witha pH meter. Water color (milligrams platinium per liter)was measured by optical comparison with standard platinumcobalt chloride disks. Total nitrogen was determined by ox-idation with K2S2O8. Total phosphorus was measured withspectrophotometer. Total organic carbon was determined byoxidizing the sample by combustion and measuring C usingIR-spectrophotometry.
2.3 Morphometric and catchment characteristics
Data on area, mean depth, total volume and volume of waterlayers for the lakes in the sample were either derived fromthe register or measured directly in this study. If lake basinvolume was not available in the register, it was estimated us-ing regressions based on representative lake data (n=1831)available in the Finnish Environment Institute. The catch-ment boundaries were interpreted using topographic maps,and were digitized. We used a Landsat TM grid and digi-tal elevation model with ArcView geo-referencing softwareto obtain catchment and lake areas, catchment to lake ratios,and proportions of agricultural land, peatlands, and forests onupland soil, and areas of water and human settlements. Thepeatland category included both pristine and forestry drainedareas.
2.4 Calculation of CH4 fluxes and CH4 storage in water
Annual flux estimate is the sum of the spring and fall storagechange fluxes and the diffusive efflux over the open waterperiod. Ebullition was not measured and it is not part of theestimate. Fluxes were calculated for the whole lake and thendivided by the lake area to get estimate per unit area. Thediffusion rate between the water and the atmosphere was es-timated on the basis of surface water CH4 concentration.
The diffusive fluxF (mol m−2 d−1) between the water sur-face and the atmosphere was calculated as:
F = k × (Cw − Ceq) (1)
wherek is the gas transfer coefficient (m d−1) and Cw themeasured CH4 concentration (mol m−3) in the surface wa-ter (at the depth of 1 m) andCeq the methane concentra-tion in water that is in equilibrium with the atmosphere atin situ temperature. The CH4 concentration in the lake waterin equilibrium with the atmosphere was calculated assum-ing the atmospheric CH4 concentration of 1.72µL L−1 forthe year 1994 and taking into account the annual increase of0.01% (Houghton et al., 1996). Gas transfer coefficientk wasestimated according to Cole and Caraco (1998). They deter-mined experimentallyk for tracer gas SF6 in small shelteredlake and normalized it to Schmidt number 600 (CO2 at tem-perature of 20◦C). An empirical relationship between wind
speed andk600 value based on several tracer studies (Coleand Caraco, 1998), was used to determinek600 (cm h−1):
k600 = 2.07+ 0.215× U1.710 (2)
whereU10 denotes the wind speed at 10 m height. We ap-plied a value of 3 m s−1, which is the average wind speed at10 m height in the inland stations of Finnish MeteorologicalInstitute during the open water period.
When piston velocity is known for one gas and tempera-ture, it can be applied to another gas and temperature by theratio of the Schmidt numbers. To calculatek for CH4 weused
kCH4 = k600 × (ScCH4/600)−0.5, (3)
where Schmidt numbers for CH4 (ScCH4) evaluated for par-ticular temperature and water density were calculated fromempirical third-order polynomial fit with water temperatureas an independent variable (Jahne et al., 1987). For the expo-nent we used value−0.5 according to Hamilton et al. (1994)and MacIntyre et al. (1995).
To calculate the diffusive flux over the whole ice-free pe-riod, the before ice-out concentration was extrapolated over0.5 months after the ice-out. Similarly, the after ice-out con-centration was assumed to last for 1.5 months, the summertime concentration for 3 months, and the autumn concentra-tion over 2 months of the ice-free period of 7 months. Thesesame periods were used when estimating the CO2 emissionsfrom our lakes (Kortelainen et al., 2006). In the current study,time spans were proportionally the same for lakes havingshorter ice-free period.
The CH4 storage was calculated for the water column (m2)
at sampling points and for whole lakes by multiplying con-centration values by the volume of each layer assuming hor-izontal mixing of CH4. Storage change fluxes were calcu-lated from the differences in CH4 storage between winter andspring, and between late summer and autumn. This flux com-pared with the estimate of potential flux. Potential flux is theCH4 storage exceeding the equilibrium concentration in thewater column during late winter and late summer, which isis assumed to be released to the atmosphere during circu-lation (Michmerhuizen et al., 1996). If storage was largerduring spring and autumn than during late winter and latesummer, the larger storage was used to calculate storage flux,since the timing of the sampling might have been too early.Methane storage in the water column at sampling point (m2)
was calculated by extrapolating the measured dissolved CH4concentration over depth ranges 0–0.5 m above the sediment,0.5–2 m above sediment, 2 m above sediment to 2 m belowthe lake surface, and 2–0 m below the lake surface. Theweighted estimate was produced by calculating storage in thewhole volume of lake, integrating storage in the above depthranges and dividing it by lake area.
Biogeosciences, 6, 209–223, 2009 www.biogeosciences.net/6/209/2009/

S. Juutinen et al.: Methane dynamics in different boreal lake types 213
2.5 Data analyses
Statistical distributions of CH4 concentrations and fluxes arepresented for the different lake types. We used multiple lin-ear regression analysis (SPSS 15.0 for Windows) to quan-tify relationships between environmental variables and CH4concentration during different phases of the annual lake cy-cle. Correlations among methane, climatic, chemical andmorphological variables were inspected using regression andprincipal component analyses. Those showed that many ofthe chemical variables determined for the water samples typ-ically correlate strongly with each other. A limited set ofvariables were kept in further analyses. Effect of area, max-imum depth, mean depth, area:maximum depth, area:meandepth, oxygen saturation, Ptot, Ntot, TOC, Ptot:TOC, meanannual temperature, and water temperature on the CH4 con-centrations was examined. Each variable was used as an in-dependent variable alone. Thirdly, selected variable combi-nations were used to build regression models. Patterns withinhumic categories were examined, and lake types of differentsize categories but with same humic content (Table 1) werepooled into one group in order to increase the number of ob-servations in the group and to facilitate the statistical anal-yses. In the tables we give results only for the whole data.Relationships between central values of some environmentalvariables and CH4 flux components for the lake types wereexplored visually (Fig. 6) and by regression analysis. For theconcentrations, near-bottom and surface water samples wereanalysed independently during both the late summer (sum-mer stratification) and the late winter (winter stratification).Loge andarc sin
√x were used for unevenly distributed data.
We also examined the relationship between the CH4 con-centration in near-bottom water in winter or summer and thelake status in terms of phosphorus and oxygen. For this pur-pose the lakes were divided in groups according to their to-tal phosphorus concentration and occurrence of anoxia in thenear-bottom water. Three groups were identified accordingto total phosphorus: Ptot<30µg L−1, 30≤Ptot≤50µg L−1,Ptot>50µg L−1. Four groups were identified according toanoxia: Lakes never facing anoxia, and the lakes in whichthe near bottom water was anoxic either in winter or sum-mer, or more often. The water was considered anoxic if O2saturation was below 5%. Differences in mean CH4 concen-trations between the categories were tested using the Mann-Whitney U-test. Differences in catchment land cover be-tween these groups were similarly tested. We also show cen-tral CH4 emissions estimates for the lakes of statistic sample(177 lakes) in size classes 0.04–<0.1, 0.1–<0.5, 0.5–<1, 1–<10,>10 km2.
3 Results
3.1 Distribution of lake types
The most numerous lake types were very humic shallow(VHSh), humic shallow (HSh) and nutrient rich and calcare-ous (NRC) (Table 2). The surface area of lakes ranged from0.04 to 119.8 km2. The median lake area was 0.28 km2 andonly 25% of the lakes had an area over 1.6 km2. Most ofthose small lakes were typified into the three shallow types(Table 2). Most NRC lakes were also shallow and had a smallarea. Defined by color (Pt mg L−1), proportions of lakeswith clear, humic or very humic water were 22%, 40%, or38%, respectively. The lakes in type NRC included manyhighly humic lakes. Nutrient-rich and calcareous lakes, andvery humic lakes were more common in the southern partof the study region, while the distributions of humic large,clear shallow, and humic small lakes were more northern.Catchments of NRC lakes had the greatest proportional coverof agricultural land, while proportional peatland cover waslargest in the catchments of larger humic lakes and very hu-mic lakes. Very humic lakes and NRC lakes had small waterarea in catchments and large catchments relative to the lakesize. Those lake types had the greatest total nutrient con-centrations; in humic lakes the nutrients are largely bound inorganic matter (Table 2).
3.2 Methane concentrations
Average surface water CH4 concentration was 1.0µmol L−1,and the bottom water concentration averaged 20.6µmol L−1,yet it was less than 2.3µmol L−1 in 75% of the lakes. Veryhigh CH4 concentrations were rare (three samples had con-centration over 1000µmol L−1) (Table 3). Methane concen-trations were generally greatest in the water layer closest tothe sediment during late winter (md 7.9µmol L−1), and dur-ing late summer (md 0.3µmol L−1). The surface water con-centrations were most often the largest during the late sum-mer, the median value being 0.2µmol L−1. The vertical con-centration gradient was the largest during the late winter (Ta-ble 3, Fig. 2). Median concentration in the bottom was 113times and 1.6 times the surface concentration under the icecover and during the late summer, respectively. The relation-ship between bottom and surface water CH4 concentrationswas weak. It was significant among all the lakes (r2=0.14),and among the clear small and middle size and shallow lakes,humic shallow and very humic lakes during the stratificationperiods.
Lake type characteristics were reflected in CH4 concentra-tions, but within each lake type the variation in CH4 concen-trations was considerable. Statistical relationships betweenCH4 concentrations and environmental variables were weakthough significant in the large data (Table 4). General patternwas that surface water CH4 concentration was more relatedto the morphological variables while the bottom water CH4
www.biogeosciences.net/6/209/2009/ Biogeosciences, 6, 209–223, 2009

214 S. Juutinen et al.: Methane dynamics in different boreal lake types
a) b) Spring, surface
0.0
0.3
0.6
0.9a) Winter, surface
CH
4 (µ
mol
L-1
)0.0
0.3
0.6
0.9
e) Winter, bottomC
H4
(µm
ol L
-1)
0
10
20
30
40f) Spring, bottom
0.0
0.3
0.6
0.9
1.2
c) Summer, surface
0.0
0.3
0.6
0.9 d) Autumn, surface
0.0
0.3
0.6
0.9
g) Summer, bottom
0.0
0.3
0.6
0.9
1.2 h) Autumn, bottom
0.0
0.3
0.6
0.9
1.2
Lake Type
NRC CLCSmMCSh HL HM
HSmHSh VHVHShC
H4
stor
age
(mm
ol m
-2)
0.0
0.3
0.6
0.9
1.2
Lake Type
NRC CLCSmMCSh HL HM
HSmHSh VHVHSh
0.0
0.3
0.6
0.9
1.2
Lake Type
NRC CLCSmMCSh HL HM
HSmHSh VHVHSh
0.0
0.3
0.6
0.9
1.2
Lake Type
NRC CLCSmMCSh HL HM
HSmHSh VHVHSh
0.0
0.3
0.6
0.9
1.2i) Winter j) Spring k) Summer l) Autumn
Fig.2
Fig. 2. CH4 concentrations and CH4 storages (whole lake integrated, mmol m−2) in the different lake types (see Table 1). Bars show mediansof surface(a–d)and bottom water CH4 concentrations(e–h), and the CH4 storages(i–l). Upper and lower quartiles are marked with dashedlines (these mark the two lakes in the type HL). Note the different scales and that some upper quartiles are outside of the scale.
Table 2. Medians for alkalinity, turbidity, Ptot, Ntot, color and TOC of the surface water at fall, lake area (A), maximum depth (D) andproportional cover of agricultural land (Agr.), forests (For.), peat and water (Wat) in the catchments in the whole data and the different laketypes. Mean annual temperature (T) was measured in the nearest weather stations (Finnish Meteorological Institute 1999 and 2000). Threelakes could not be typified due to missing water chemistry data, and land cover distribution was analyzed only for 187 lakes. Type definitionsfrom the Table 1.
Lakes N Alk. Turb. Ptot Ntot Color TOC A D T pH Agr. For. Peat Wat.
(mmol l−) (FTU) (µg l−1) (µg l−1) (Pt mg l−1) (mg l−1) (km2) (m) (◦C) (%) (%) (%) (%)
Stat. 177 0.1 1.3 14 460 70 9 0.24 6.2 3.2 6.5 2.6 67 12 9Eutr. 30 0.2 6.5 60 970 140 11 0.94 4.0 3.6 6.6 11.6 61 17 5All 207 0.1 1.5 16 505 80 9 0.28 6.0 3.3 6.6 3.6 67 12 8
TypesNRC 27 0.4 5.3 57 840 75 9 0.52 5.1 4.1 6.8 20.4 60 2 7CL 1 0.2 1.1 15 280 15 5 44.26 26.5 3.1 7.2 4.2 72 6 17CSm&M 17 0.1 0.6 6 270 15 4 1.35 13.4 3.2 6.7 2.3 68 6 19CSh 21 0.1 0.7 6 300 20 5 0.14 6.2 1.5 6.8 0.0 69 5 13HL 2 0.2 1.3 16 300 60 9 52.75 17.8 0.1 7.1 0.9 60 29 10HM 4 0.2 0.9 11 510 35 8 20.17 15.6 3.6 7.0 3.8 58 18 17HSm 19 0.1 1.0 11 360 50 8 1.03 14.0 2.2 6.5 3.0 71 9 11HSh 45 0.1 1.3 14 485 65 9 0.19 4.0 2.8 6.5 4.2 70 11 10VH 11 0.1 1.6 31 635 170 16 1.40 12.5 3.3 6.3 10.0 64 19 5VHSh 57 0.1 2.0 24 635 160 17 0.10 3.8 3.4 6.3 1.5 63 22 5
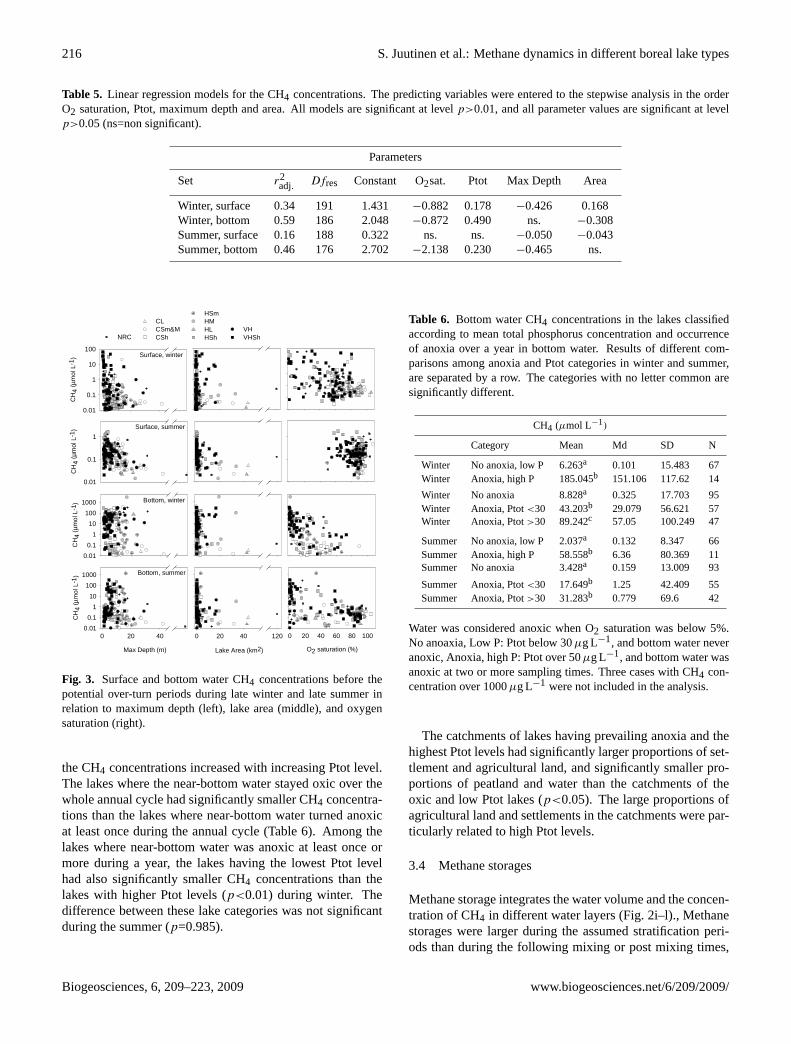
concentration was related to oxygen and nutrient concentra-tions (Table 4, Fig. 3). Methane concentration in bottom wa-ter correlated with morphology only during summer, but notunder the ice over.
Surface water CH4 concentration was primarily related tolake depth. Both in winter and summer medians of CH4concentration were greatest in the shallow lake types. Themedians varied from 0.12 in HSh to 0.26µmol L−1 in NRCduring winter and from 0.18 for VHSh to 0.31µmol L−1for
HSh during summer (Fig. 2a–d). Surface water CH4 concen-tration correlated negatively with the lake depth, oxygen sat-uration, and positively with concentrations of Ptot and TOCduring winter (Table 4). There was a weak positive correla-tion with mean annual temperature. During summer, surfacewater CH4 concentration had negative correlation with lakearea, depth, and area to depth ratio, and weakly negative cor-relation with oxygen saturation.
Biogeosciences, 6, 209–223, 2009 www.biogeosciences.net/6/209/2009/

S. Juutinen et al.: Methane dynamics in different boreal lake types 215
Table 3. Statistical distributions of CH4 concentrations (µmol L−1) in 1 m below surface (surface) and 0.2 m above the sediment (bottom).
Depth Sampling Mean Lower Median Upper Max N
quartile quartile
Bottom Winter 53.62 0.13 7.94 47.31 3013.76 192Bottom Spring 3.23 0.05 0.10 0.20 227.39 196Bottom Summer 21.49 0.12 0.27 3.18 1331.15 183Bottom Autumn 4.25 0.05 0.10 0.23 393.33 190Surface Winter 3.39 0.03 0.07 0.55 60.19 201Surface Spring 0.16 0.05 0.10 0.19 2.50 203Surface Summer 0.25 0.08 0.17 0.31 1.69 200Surface Autumn 0.24 0.04 0.08 0.18 5.12 201
Table 4. Relationships between CH4 concentrations and environmental variables that correlated significantly with CH4 at p level <0.05.Sign indicating positive or negative correlations and the regression coefficient are given before and after the variable, respectively. Effectof area, maximum depth, mean depth, area:maximum depth, area:mean depth, oxygen saturation, Ptot, Ntot, TOC, Ptot:TOC, mean annualtemperature, and water temperature on the CH4 concentrations was examined. Effect of each factor was tested independently in regressionanalysis.
Winter, Surface Summer, surface Winter, bottom Summer, bottom
−Max depth, 0.24 −Area, 0.11 −O2%, 0.51 −O2%, 0.38−Mean depth, 0.23 −Max depth, 0.10 +Ptot, 0.29 +Ptot, 0.16−O2%, 0.22 −Mean depth, 0.08 +Ptot:TOC, 0.17 +Ptot:TOC, 0.07+Ptot, 0.17 −Area:mean depth, 0.06 +TOC, 0.05 −Area, 0.06+TOC, 0.09 −Area:max depth, 0.06 +Water T, 0.02 −Area:mean depth, 0.06+Ptot:TOC, 0.07 −O2%, 0.02 −Area:max depth, 0.06+Mean T, 0.02 +TOC, 0.05
+Water T, 0.03
Bottom water CH4 concentration was the highest in win-ter in the large humic lakes (HL, HM), CSh and NRC lakes,for those the medians were from 28.43 to 81.12µmol L−1
(Fig. 2e–h). These were followed by the smaller humicand very humic lakes, and the types HSh>VH>VHSh hadmedians from 10.38 to 18.5µmol L−1. During summerthe deeper very humic (VH) lakes had the greatest bottomconcentrations (md 1.08µmol L−1). Large CH4 concentra-tions were common also in NRC lakes and in the otherhumic lakes (HSh>HM>VHSh). Bottom water CH4 con-centration in winter and summer alike correlated negativelywith oxygen saturation and positively with Ptot concentra-tion and Ptot:TOC ratio (Table 4). It correlated weakly withTOC concentration and water temperature. During summer,CH4 concentration had also negative correlation with lakearea and area-to-depth ratio. The most extreme cases (CH4>1000µmol L−1) were not associated with anoxic water,and possibly sediment interstitial water was mixed with thelower water layers during sampling in those cases.
Stepwise regression models with O2 saturation, Ptot, meandepth and area as independent variables explained up to 34%
of variation in surface water CH4 concentration and up to59% of variation in bottom water CH4 concentration whenall lakes were included (Table 5). All of these parametersdid not get significant parameter values in the humic classspecific models, which likely indicate shorter environmen-tal gradients within a humic class than in the complete dataset. For example, oxygen saturation seemed to be insignifi-cant factor in NRC lakes, because the majority of those lakessuffered oxygen deficiency during the late winter.
3.3 Dissolved CH4 and lake status
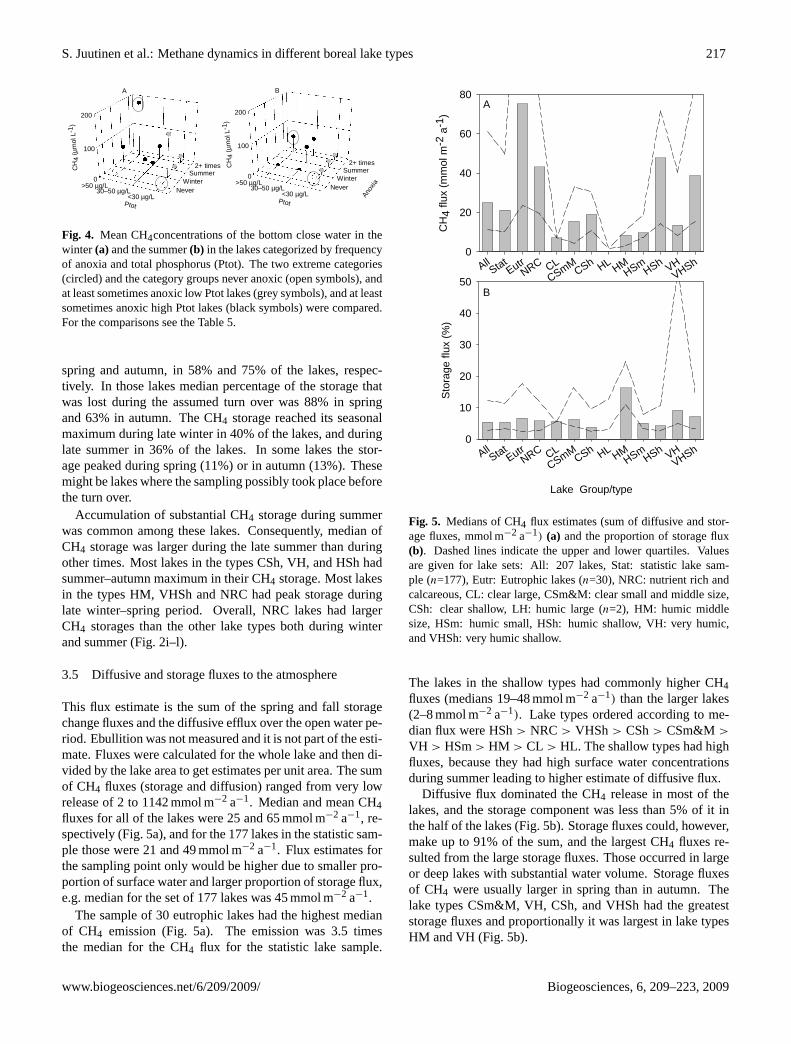
Methane concentration of bottom close water could beviewed as an indicator of lake status in terms of oxygenand nutrients. In the late winter, the CH4 concentrationswere significantly greater in the lakes suffering anoxia andhaving the highest Ptot levels (Md 151.1µmol L−1) than inthe lakes in which bottom water stayed oxic and Ptot lev-els were low (Md 0.1µmol L−1) (Fig. 4a, Table 6). Thedifference in CH4 concentrations between these two cate-gories was smaller although statistically significant also dur-ing the late summer (Fig. 4b). Within any category of anoxia,
www.biogeosciences.net/6/209/2009/ Biogeosciences, 6, 209–223, 2009
216 S. Juutinen et al.: Methane dynamics in different boreal lake types
Table 5. Linear regression models for the CH4 concentrations. The predicting variables were entered to the stepwise analysis in the orderO2 saturation, Ptot, maximum depth and area. All models are significant at levelp>0.01, and all parameter values are significant at levelp>0.05 (ns=non significant).
Parameters
Set r2adj. Dfres Constant O2sat. Ptot Max Depth Area
Winter, surface 0.34 191 1.431 −0.882 0.178 −0.426 0.168Winter, bottom 0.59 186 2.048 −0.872 0.490 ns. −0.308Summer, surface 0.16 188 0.322 ns. ns. −0.050 −0.043Summer, bottom 0.46 176 2.702 −2.138 0.230 −0.465 ns.
Surface, winter
CH
4 (µ
mol
L-1
)
0.01
0.1
1
10
100
O2 saturation (%)
0 20 40 60 80 100
Surface, summer
CH
4 (µ
mol
L-1
)
0.01
0.1
1
Bottom, winter
CH
4 (µ
mol
L-1
)
0.010.1
110
1001000
Bottom, summer
Max Depth (m)
0 20 40
CH
4 (µ
mol
L-1
)
0.010.1
110
1001000
Lake Area (km2)
0 20 40 120
NRC
CLCSm&MCSh
HSmHMHLHSh
VHVHSh
Fig. 3. Surface and bottom water CH4 concentrations before thepotential over-turn periods during late winter and late summer inrelation to maximum depth (left), lake area (middle), and oxygensaturation (right).
the CH4 concentrations increased with increasing Ptot level.The lakes where the near-bottom water stayed oxic over thewhole annual cycle had significantly smaller CH4 concentra-tions than the lakes where near-bottom water turned anoxicat least once during the annual cycle (Table 6). Among thelakes where near-bottom water was anoxic at least once ormore during a year, the lakes having the lowest Ptot levelhad also significantly smaller CH4 concentrations than thelakes with higher Ptot levels (p<0.01) during winter. Thedifference between these lake categories was not significantduring the summer (p=0.985).
Table 6. Bottom water CH4 concentrations in the lakes classifiedaccording to mean total phosphorus concentration and occurrenceof anoxia over a year in bottom water. Results of different com-parisons among anoxia and Ptot categories in winter and summer,are separated by a row. The categories with no letter common aresignificantly different.
CH4 (µmol L−1)
Category Mean Md SD N
Winter No anoxia, low P 6.263a 0.101 15.483 67Winter Anoxia, high P 185.045b 151.106 117.62 14
Winter No anoxia 8.828a 0.325 17.703 95Winter Anoxia, Ptot<30 43.203b 29.079 56.621 57Winter Anoxia, Ptot>30 89.242c 57.05 100.249 47
Summer No anoxia, low P 2.037a 0.132 8.347 66Summer Anoxia, high P 58.558b 6.36 80.369 11Summer No anoxia 3.428a 0.159 13.009 93
Summer Anoxia, Ptot<30 17.649b 1.25 42.409 55Summer Anoxia, Ptot>30 31.283b 0.779 69.6 42
Water was considered anoxic when O2 saturation was below 5%.No anoaxia, Low P: Ptot below 30µg L−1, and bottom water neveranoxic, Anoxia, high P: Ptot over 50µg L−1, and bottom water wasanoxic at two or more sampling times. Three cases with CH4 con-centration over 1000µg L−1 were not included in the analysis.
The catchments of lakes having prevailing anoxia and thehighest Ptot levels had significantly larger proportions of set-tlement and agricultural land, and significantly smaller pro-portions of peatland and water than the catchments of theoxic and low Ptot lakes (p<0.05). The large proportions ofagricultural land and settlements in the catchments were par-ticularly related to high Ptot levels.
3.4 Methane storages
Methane storage integrates the water volume and the concen-tration of CH4 in different water layers (Fig. 2i–l)., Methanestorages were larger during the assumed stratification peri-ods than during the following mixing or post mixing times,
Biogeosciences, 6, 209–223, 2009 www.biogeosciences.net/6/209/2009/
S. Juutinen et al.: Methane dynamics in different boreal lake types 217
0
100
200
NeverWinter
Summer2+ times
<30 µg/L30–50 µg/L
>50 µg/L
CH
4 (µ
mol
L-1
)
Ptot
0
100
200
NeverWinter
Summer2+ times
<30 µg/L30–50 µg/L
>50 µg/L
CH
4 (µ
mol
L-1
)
Anox
ia
Ptot
A B
Fig. 4. Mean CH4concentrations of the bottom close water in thewinter (a) and the summer(b) in the lakes categorized by frequencyof anoxia and total phosphorus (Ptot). The two extreme categories(circled) and the category groups never anoxic (open symbols), andat least sometimes anoxic low Ptot lakes (grey symbols), and at leastsometimes anoxic high Ptot lakes (black symbols) were compared.For the comparisons see the Table 5.
spring and autumn, in 58% and 75% of the lakes, respec-tively. In those lakes median percentage of the storage thatwas lost during the assumed turn over was 88% in springand 63% in autumn. The CH4 storage reached its seasonalmaximum during late winter in 40% of the lakes, and duringlate summer in 36% of the lakes. In some lakes the stor-age peaked during spring (11%) or in autumn (13%). Thesemight be lakes where the sampling possibly took place beforethe turn over.
Accumulation of substantial CH4 storage during summerwas common among these lakes. Consequently, median ofCH4 storage was larger during the late summer than duringother times. Most lakes in the types CSh, VH, and HSh hadsummer–autumn maximum in their CH4 storage. Most lakesin the types HM, VHSh and NRC had peak storage duringlate winter–spring period. Overall, NRC lakes had largerCH4 storages than the other lake types both during winterand summer (Fig. 2i–l).
3.5 Diffusive and storage fluxes to the atmosphere
This flux estimate is the sum of the spring and fall storagechange fluxes and the diffusive efflux over the open water pe-riod. Ebullition was not measured and it is not part of the esti-mate. Fluxes were calculated for the whole lake and then di-vided by the lake area to get estimates per unit area. The sumof CH4 fluxes (storage and diffusion) ranged from very lowrelease of 2 to 1142 mmol m−2 a−1. Median and mean CH4fluxes for all of the lakes were 25 and 65 mmol m−2 a−1, re-spectively (Fig. 5a), and for the 177 lakes in the statistic sam-ple those were 21 and 49 mmol m−2 a−1. Flux estimates forthe sampling point only would be higher due to smaller pro-portion of surface water and larger proportion of storage flux,e.g. median for the set of 177 lakes was 45 mmol m−2 a−1.
The sample of 30 eutrophic lakes had the highest medianof CH4 emission (Fig. 5a). The emission was 3.5 timesthe median for the CH4 flux for the statistic lake sample.
Lake Group/type
AllStat
EutrNRC CL
CSmMCSh HL HMHSmHSh VH
VHShS
tora
ge fl
ux (%
)0
10
20
30
40
50All
StatEutr
NRC CLCSmMCSh HL HM
HSmHSh VHVHSh
CH
4 flu
x (m
mol
m-2
a-1
)
0
20
40
60
80A
B
Fig.5.
Fig. 5. Medians of CH4 flux estimates (sum of diffusive and stor-age fluxes, mmol m−2 a−1) (a) and the proportion of storage flux(b). Dashed lines indicate the upper and lower quartiles. Valuesare given for lake sets: All: 207 lakes, Stat: statistic lake sam-ple (n=177), Eutr: Eutrophic lakes (n=30), NRC: nutrient rich andcalcareous, CL: clear large, CSm&M: clear small and middle size,CSh: clear shallow, LH: humic large (n=2), HM: humic middlesize, HSm: humic small, HSh: humic shallow, VH: very humic,and VHSh: very humic shallow.
The lakes in the shallow types had commonly higher CH4fluxes (medians 19–48 mmol m−2 a−1) than the larger lakes(2–8 mmol m−2 a−1). Lake types ordered according to me-dian flux were HSh> NRC > VHSh > CSh> CSm&M >
VH > HSm> HM > CL > HL. The shallow types had highfluxes, because they had high surface water concentrationsduring summer leading to higher estimate of diffusive flux.
Diffusive flux dominated the CH4 release in most of thelakes, and the storage component was less than 5% of it inthe half of the lakes (Fig. 5b). Storage fluxes could, however,make up to 91% of the sum, and the largest CH4 fluxes re-sulted from the large storage fluxes. Those occurred in largeor deep lakes with substantial water volume. Storage fluxesof CH4 were usually larger in spring than in autumn. Thelake types CSm&M, VH, CSh, and VHSh had the greateststorage fluxes and proportionally it was largest in lake typesHM and VH (Fig. 5b).
www.biogeosciences.net/6/209/2009/ Biogeosciences, 6, 209–223, 2009

218 S. Juutinen et al.: Methane dynamics in different boreal lake types
Table 7. Regression models for the different flux components and their sum (mmol m−2 a−1). Independent variables were given in theorder of maximum depth (m), lake area (km2), and Ntot(µg L−1) for the stepwise linear regression analysis. Ptot as an independent variableproduced very similar result than Ntot.
Component Model r2 Dres F p
Sum y=0.202−0.285×MaxD−0.206×Area+0.548×Ntot 0.34 196 35.7 <0.001Spring Storage y=1.239−0.211×MaxDepth 0.03 198 6.0 0.015Autumn Storage y=−2.912−0.211×Area+0.383×MaxDepth+0.426×Ntot 0.25 196 23.3 <0.001Sum of Storages y=−1.615−0.168×Area+0.432×Ntot 0.11 197 12.9 0.015Diffusion y=0.558−0.360×MaxDepth−0.179×Area+0.488×Ntot 0.37 196 40.6 <0.001
Ntot (µg L-1)
400 600 800Sum
CH
4 Fl
ux (m
mol
m-2
a-1 )
0
20
40
60
Ntot (µg L-1)
400 600 800
Sto
rage
Flu
x (m
mol
m-2
a-1 )
0
1
2
3
Area (km2)
0 1 2 3 4 5 20 40 60Sum
CH
4 Fl
ux (m
mol
m-2
a-1 )
0
20
40
60
Area (km2)
0 1 2 3 4 5 20 40 60
Sto
rage
Flu
x (m
mol
m-2
a-1 )
0
1
2
3
Depth (m)
0 5 10 15 20 25 30Sum
CH
4 Fl
ux (m
mol
m-2
a-1 )
0
20
40
60
Depth (m)
0 5 10 15 20 25 30
Sto
rage
Flu
x (m
mol
m-2
a-1 )
0
1
2
3
y=-7.159+0.058x, r2=0.38, p=0.026 y=-0.299+0.003x, r2=0.72, p=0.001
y=26.561-0.488x, r2=0.38, p=0.025lny+1=3.455-0.518x, r2=0.74, p,0.001
y=1.259-0.020x, r2=0.54, p=0.006lny+1=0.865-0.154x, r2=0.57, p,0.004
y=43.184-1.961x, r2=0.67, p=0.001 y=1.764-0.067x, r2=0.57, p=0.004
A
B
C
D
E
F
NRC
CLCSm&MCSh
HLHMHSmHSh
VHVHSh
Fig. 6. Relationships between type specific central values of envi-ronmental variables and CH4 fluxes. Sum flux includes diffusiveand storage fluxes and is dominated by the diffusion component(a–c). Storage CH4 flux is sum of spring and autumn storages(d–f).
Regression models with maximum depth, lake area andNtot (or Ptot) as independent variables explained 3–37% ofthe variation in different flux components (Table 7). Dif-fusion components and sum of diffusion and storage fluxeswere related to lake area and depth, and to nutrient status.Storage component showed variability that was harder topredict, and there may be size dependent differences in therelationships. Maximum depth received positive coefficientvalue for the autumn storage fluxes, while the coefficient was
negative in the diffusion component model. Relationshipsbetween mean values of CH4 fluxes and environmental vari-ables (see Table 2) for the lake types hide much of the detailsand the variation, but those illustrated the major factors asso-ciated with the variation in CH4 fluxes (Fig. 6). Large storagefluxes were related to eutrophic lake environments (Fig. 6d),high Ntot concentration and large agricultural land cover inthe catchment, but also to small area. The sum of diffusiveand storage fluxes was higher in the shallow and small lakesthan in the large lakes. Among the small lakes, however, themore eutrophic and more humic lakes had higher fluxes thanthe clear ones (Fig. 6a–c).
4 Discussion
We present data on CH4 concentrations and storage changeand diffusive fluxes derived from the concentrations. Ourdata are unique in the number of lakes examined, and statis-tic sample of the lakes and large geographical area providedsome extensive environmental gradients. Lakes within thissample are typically small and humic. Globally, however,small lakes dominate: one third of the total world lake sur-face area consists of lakes that are smaller than 0.1 km2,and the estimated global average of lake size is 0.012 km2
(Downing et al., 2006). All of the lakes in our study were0.04 km2 or larger, and consequently median lake area in thecurrent study, 0.28 km2, is larger than the estimate of averageglobal lake area.
The CH4 concentration in lake water is affected by manyprocesses, and the large overall variability in CH4 concen-trations in this study may result from the large data. Thesefacts may contribute to the rather weak statistical relation-ships between CH4 and environmental variables in this study.We applied a regional lake typology to group lakes that havemore similar physical and biological processes contributingto the CH4 within those groups. Results indicate that thatthe grouping factors, natural nutrient content, humic content,area and depth, are associated with the variation in CH4 con-centration and with the flux estimates derived from the con-centrations.
Biogeosciences, 6, 209–223, 2009 www.biogeosciences.net/6/209/2009/

S. Juutinen et al.: Methane dynamics in different boreal lake types 219
The lake types are defined for assessing the ecological sta-tus of lakes in relation to each type’s natural conditions (Di-rective 2000/60/EC; Vuori et al., 2006). At the time being wecould not relate CH4 data with ecological status categories,because the work by the environmental authorities is stillcontinuing. Status changes are indicated by changes e.g. inabundance and primary production of aquatic macrophyte orplanktic species, and frequency of oxygen deficiency (Man-nio et al., 2000; Dodson et al., 2005; Vuori et al., 2006).All these may have impact on CH4 production and oxidationconditions, and cause variability observed in CH4 concentra-tions.
4.1 Methane concentrations
Average CH4 concentrations in the surface waters in thecurrent study, 0.2–1.8µmol L−1 (Table 3) were comparableto average surface water concentration of CH4 in 13 olig-otrophic Swedish lakes of 0.1–1.9µmol L−1 and in 11 Wis-consin lakes of 0.3–2.3µmol L−1 (Bastviken et al., 2004).The highest dissolved CH4 concentrations measured close tothe sediment in our study were similar with, for example,those reported for the eutrophic Lakes 277 and Wintergreen(Rudd and Hamilton, 1978; Strayer and Tiedje, 1978). Ac-cording to our data, the key variables associated with varia-tion in lake water CH4 concentration are oxygen saturation,nutrient status implying productivity, lake area and depth,which is in line with studies of Michmerhuizen et al. (1998);Huttunen et al. (2003), and Bastviken et al. (2004).
Poor oxygen saturation and high nutrient status predicthigh CH4 concentration in the bottom water (Fig. 3, Table 4).These factors indicate a condition favoring higher CH4 pro-duction rates and hindering CH4 oxidation (e.g. Rudd andHamilton, 1978; Huttunen et al., 2003). In addition, bot-tom CH4 concentration was positively yet weakly relatedwith TOC and water temperature, but this can be also due tothe southern distribution of most productive and humic lakes,and strong stratification and oxygen consumption rates in hu-mic lakes (Bastviken et al., 2004, Kankaala et al., 2007). Thenegative correlation between area-to-depth ratio (consideredsmall for a deep lake with small area) and CH4 concentrationsuggest that wind driven water column mixing can keep bot-tom water CH4 concentration low during open water season.The summer bottom water CH4 examined against the laketypes pointed that CH4 accumulation is likely when there isa risk of oxygen deficiency (Fig. 2): e.g. in deep lakes, nutri-ent rich lakes and in very humic lakes having strong stratifi-cation (Riera et al., 1999; Huttunen et al., 2002a; Bastvikenet al., 2004; Kankaala et al., 2007). In winter CH4 accumula-tion is likely in shallow lakes due to small water volume and,thereafter, small oxygen storage.
The CH4 concentrations in bottom-close water duringwinter were significantly higher in lakes having frequentlyanoxic bottom water and highest Ptot levels than in lakes hav-ing lower Ptot levels or less frequent anoxia (Fig. 4, Table 5).
Because of this connection among nutrient level, oxygen sat-uration and CH4, the amount of CH4 in the sediment closewater might serve as a classification measure that integratesoxygen and nutrient status (cf. Huttunen et al. 2006). Anoxiaand high nutrient levels are typically correlated due to oxy-gen consumption by decomposition and by nutrient releasefrom the sediment in anoxic conditions. However, factors af-fecting the water column mixing and gas exchange, i.e depthand area (Fee et al., 1996) have an impact on lake oxygenstatus during the open water season too (Table 4).
Factors that are associated with the surface water CH4 con-centration are significant since the surface water CH4 con-centration is the driver of diffusive CH4 flux to the atmo-sphere. The surface water CH4 concentrations were typicallythe highest in shallow lakes both during the late winter andthe late summer (Table 4, Figs. 2 and 3). Significant rela-tionships between CH4 concentration and oxygen saturation,Ptot and TOC in winter indicate that during the ice cover thenutrient rich and humic shallow lakes tend to have propor-tionally large anoxic water volume, allowing CH4 accumu-lation at the water layers where oxygen deficiency hindersoxidation of CH4.
During the open water season, in turn, lake area and depthand their ratio affect, first, how much of the CH4 reachesthe surface layer and, second, the loss of CH4 from lake sur-face to the atmosphere. In the shallow lakes the epilimnionand productive littoral sediments have a large contributionto the total sediment area and gas efflux to the water col-umn. In the epilimnion the sedimentary gases are mixedto the surface layer, while the hypolimnion is isolated fromthe surface layer by stratification (den Heyer and Kalf, 1998;Bastviken et al., 2004; Murase et al., 2005; Bastviken et al.,2008). The shallow lakes may also maintain the high surfaceCH4 concentration due to lower gas exchange rates betweenthe surface and the atmosphere, because these lakes likelyhave small area and are wind sheltered (cf. Bastviken et al.,2004). Correlation between bottom water and surface wa-ter concentrations was poor, which follows from the multipleprocesses in the sediment throughout the water column andwater surface determining the CH4 concentration (Rudd andHamilton, 1978; Bastviken et al. 2004; Kankaala et al., 2006,2007). Besides, the surface water CH4 likely originates fromdifferent sediments than just below the sampling point due tothe lateral mixing of the water (Bastviken et al., 2008).
Identifying the formation of CH4 storage in a lake is im-portant, because CH4 storage can turn to large CH4 release.Eutrophic and humic lakes with substantial volume can besites of big storage fluxes, but storage formation can bealso common in smaller lakes due to their susceptibility toanoxia. The current study also shows that accumulation ofCH4 storage during summer is comparable to CH4 accumu-lation during the ice covered season in many lakes of thisregion (Fig. 2). It has been shown that summer storage canmake significant part of the annual CH4 release particularlyin the humic lakes (Kankaala et al., 2007).
www.biogeosciences.net/6/209/2009/ Biogeosciences, 6, 209–223, 2009

220 S. Juutinen et al.: Methane dynamics in different boreal lake types
Lake area (km2)
0.001 0.01 0.1 1 10 100
CH
4 effl
ux (m
mol
m-2
a-1 )
0
200
400
600
1200 This study (177 lakes)Swedish lakesWisconsin lakesMendotaCrystalLake 227Priest Pond2 Eutrophic Finnish lakesArea <0.1 km2, mean
Fig. 7. Sum of the diffusive and storage fluxes in relation to lake sur-face area in the lakes of this study and some other studied lakes. Me-dian CH4 values (black circles) are plotted against median lake sizein the size classes<0.1, 0.1–<0.5, 0.5–1, 1–<10, 10–<100, and>100 km2 for the lakes of statistic sample of our study. Estimatesof CH4 release (diffusion and storage fluxes) from some other lakesstudied by Rudd and Hamilton (1978), Fallon et al. (1980), Mich-merhuizen et al. (1998), Casper et al. (2000), Huttunen et al. (2003)and Bastviken et al. (2004, Table 1) are plotted for a comparison.
4.2 Diffusive and storage fluxes to the atmosphere
Two flux components, CH4 diffusion from the surface duringthe open water season and the release of accumulated CH4storage during the over turn periods, were estimated on thebasis of the concentration data. These estimates provide onlya partial fraction of annual CH4 release from the lakes, be-cause ebullition and plant-mediated fluxes are not included.The uncertainty in our flux estimates follows from assump-tions concerning the use of concentration data and boundarylayer models, and those of horizontal and vertical scaling upover the whole lake. A constant wind speed value was usedto estimate diffusive flux, which thus might be overestimatedfor the small and sheltered lakes while underestimated for thelarger lakes where the surface is more exposed to wind (seeBastviken et al., 2004). The boundary layer diffusion modeloften gives values lower than chamber measurements, an-other method to estimate fluxes, yet not in a consistent man-ner (Phelps et al., 1998; Duchemin et al., 1999; Kankaala etal., 2006; Repo et al., 2007).
Another part of our budget is based on the assumption thatthe difference between the before and after turnover storageterms is released to the atmosphere, but part of the differ-ence can be due to CH4 oxidation. For example, in Lakes227, Williams and Kevaton oxidation consumed a small pro-portion of CH4 in the water body during the spring over-turn. Methane consumption was larger in relatively shallowL. Kevaton, and 60–80% of the pre-overturn CH4 storagewas oxidized in deeper Lake 227 and meromictic Mekko-jarvi in autumn (Rudd and Hamilton, 1978; Michmerhuizenet al., 1996; Liikanen et al., 2002; Kankaala et al., 2007).
Ebullition may dominate CH4 flux in many of the nutrient-rich and shallow lakes in our study (Huttunen et al., 2003;Bastviken et al., 2004). Thus, concentration data alonegive a biased indication of CH4 emissions and, moreover,
CH4 released in bubbles may cause some problems to pre-dict variation in observed concentration data. In addition,the vegetated and very shallow littoral areas fall outside ofthis estimation. They might have much higher CH4 emis-sions than predicted on the basis of CH4 concentration in thepelagic zone (Smith and Lewis, 1992; Juutinen et al., 2003;Bergstrom et al., 2007). Although water layers are assumedto be horizontally mixed, sometimes horizontal concentra-tion gradients have been identified. Those can be caused byCH4 inputs from littoral sediments, adjacent peatlands, or in-coming streams (Schmidt and Conrad, 1993; Larmola et al.,2004; Murase et al., 2005; Repo et al., 2007; Bastviken et al.,2008). Moreover, Some uncertainty related to volume esti-mates and vertical and horizontal extrapolation based on fourconcentration measures is evident.
Median flux value for the 177 statistically selected lakesis 21 mmol m−2 a−1 (Fig. 5). The average value for theselakes, 49 mmol m−2 a−1, is close to the average estimate of41 mmol m−2 a−1 for 8 Swedish lakes including the sameflux components (Bastviken et al., 2004). The estimates aregenerally similar within the same lake size range (Fig. 7).In addition, CH4 flux estimates with the same flux compo-nents for some Wisconsin lakes (Michmerhuizen et al., 1998;Bastviken et al., 2005) are comparable and show similar rela-tion to the lake size within the same lake size range. The sumof diffusion and storage components for the smaller Wiscon-sin lakes, in turn, were much higher than the flux estimatesof our study. The difference could be partly related to thesmaller size, implying the large sediment area-to-volume ra-tio. In addition, the more continental climate and quick warmup of those lakes leading to longer stratification period andthus larger storage flux of CH4. Those lakes had also warmersediments than the Swedish – and presumably other morenorthern – lakes (Bastviken et al., 2004). Eutrophic lakes,for example a hypereutrophic Finnish lake, L. Kevaton, hadhigher CH4 emissions (Fig. 7) (Huttunen et al., 2003).
The explanatory power of the predictive models for CH4fluxes remained rather low, but our data indicates that pro-ductivity, oxygen saturation, and factors associated to thegas transport from sediments to the water column and to theatmosphere largely determine the estimated sum of storageand diffusion flux. The lake area or depth seems to integratemuch of these factors among the studied lakes (Figs. 5, 6, 7,Table 7). Bastviken et al. (2004) concluded that CH4 fluxescan be predicted on the basis of total phosphorus, DOC, andmethane concentrations, and that ebullition is dependent onwater depth. Michmerhuizen et al. (1998) connected smallarea with the highest storage fluxes. In small and shallowlakes, sediments, where methanogenesis take place, are intouch with large water volume. In addition, probability ofsubstantial littoral contribution, i.e. macrophyte and micro-phyte production and input of organic matter to the system, isconsiderable. Small water volume when associated with highorganic matter content is susceptible to formation of anoxicconditions favoring CH4 accumulation.
Biogeosciences, 6, 209–223, 2009 www.biogeosciences.net/6/209/2009/

S. Juutinen et al.: Methane dynamics in different boreal lake types 221
Overall, humic and nutrient-rich lakes, which had higherCH4 fluxes than the clear and oligotrophic lakes, were com-mon among the small lakes resulting in higher concentrationsand fluxes of CH4 fluxes in small lakes than in larger lakes.Climate and topography of the study region may thus affectour conclusion that lake area could be a simple scaling uptool (Fig. 7). However, factors determining productivity andsusceptibility to anoxia should be included to the predictivemodels of CH4 fluxes. The climatic effect on the CH4 fluxeswithin this geographical gradient was negligible, but a longerclimatic gradient might include greater differences in pro-ductivity and also in CH4. The weak regression coefficientin the model for spring storage might be due to the influenceof the length of the ice cover period to the storage formation.
4.3 Global CH4 flux
Estimate of global CH4 flux based on these data is 3.7 Tg a−1.It is based on CH4 flux values for different size classes andthe recent estimates of total lake area in each size class(Downing et al., 2006). Methane values come from the statis-tic sample of 177 lakes in our study, but for lakes havingsize<0.1 km2, we calculated mean (135 mmol m−2 a−1) us-ing data from 55 lakes in our study and data from some otherlakes (see Fig. 7, Rudd and Hamilton, 1978; Bastviken et al.,2004).
This estimate is smaller than the recent estimates, whichrange from 8 to 48 Tg a−1 and include ebullition (Bastvikenet al., 2006; Walter et al., 2007). Ebullition and fluxesfrom vegetated littoral zone are worth of recognition, becausethose may contribute more than the sum of storage and diffu-sion fluxes to the lake wide fluxes (Smith and Lewis, 1992;Huttunen et al., 2003; Juutinen et al., 2003; Bastviken et al.,2004; Bersgtrom et al. 2007; Walter et al., 2007). Assumingthat each flux component has an equal contribution, and thusmultiplying the estimate by three, it (about 10 Tg a−1) wouldoverlap the lower end of the previous estimates. Our data isrepresentative for the boreal zone, i.e. for a large number oflakes, but it is unclear whether global CH4 emission estimatewould be affected by southern lakes possibly having differentconditions and CH4 emissions.
5 Conclusions
The current study focused on small northern lakes, wherelake size tended to be a strong predictor of methane concen-trations and fluxes. Lake size, i.e. depth or area, seems tointegrate the combination of factors driving CH4 concentra-tion dynamics, but knowledge on lake nutrient and oxygenstatus would improve the estimation. The other way round,CH4 concentration in bottom close water could serve as ameasure of excess nutrients and occurrence of anoxia whendoing environmental monitoring of lakes. In the absence ofmore accurate data, lake area from remote surveys could be
used as an approximation for the CH4 emissions in borealand arctic landscapes with similar glacial history. Small lakesseem to have a disproportionate significance with respect toCH4 release, even if large lakes dominate regional emissionestimates in absolute numbers. Our study support earlier lakestudies on CH4 dynamics regarding to regulating factors andalso the magnitude of global CH4 emission estimate.
Acknowledgements.This work is dedicated to the memory of ourdear colleague and co-author Jari Huttunen who suddenly passedaway during the final stages of the project. We also acknowledgeDavid Bastviken and an anonymous reviewer for valuable sug-gestions to improve this manuscript. Riitta Niinioja from FinnishEnvironment Institute (Joensuu) is thanked for the discussions andhelp with Finnish lake typology procedure. This study was fundedby the Finnish Academy, and we acknowledge the personal grantsto S. Juutinen (no. 213012) and to T. Larmola (no. 121353).
Edited by: T. J. Battin
References
Bastviken, D., Ejlertsson, J., and Tranvik, L.: Measurement ofmethane oxidation in lakes: A comparison of methods, Env. Sci.Tech. 36, 3354–3361, 2002.
Bastviken, D., Cole, J., Pace, M., and Tranvik, L.: Methane emis-sions from lakes: Dependence of lake characteristics, two re-gional assessments, and a global estimate, Glob. Biogeochem.Cycles, 18, GB4009, doi:10.1029/2004GB002238, 2004.
Bastviken, D., Cole J. J., Pace, M., and Van de Bogert, M. C.: Fatesof methane from different lake habitats: Connecting whole-lakebudgets and CH4 emissions, J. Geophys. Res., 113, G02024,doi:10.1029/2007JG00068, 2008.
Bergstrom, I., Makela, S., Kankaala, P., and Kortelainen, P.:Methane efflux from littoral vegetation stands of southern bo-real lakes: and upscaled, regional estimate, Atmos. Environ., 41,339–351, 2007.
Chanton, J. P., Martens, C. S., and Kelley, C. A.: Gas transportfrom methane saturated, tidal freshwater and wetland sediments,Limnol. Oceanogr., 34, 807–819, 1989.
Cole, J. J. and Caraco, N. F.: Atmospheric exchange of carbon diox-ide in a low-wind oligotrophic lake measured by the addition ofSF6, Limnol. Oceanogr., 43, 647–656, 1998.
Cole, J. J., Prairie, Y. T., Caraco, N. F., McDowell, W. H., Tranvik,L. J., Striegl, R. G., Duarte, C. M., Kortelainen, P., Downing, J.A., Middelburg, J. J., and Melack, J.: Plumbing the global carboncycle: Integrating inland waters into the terrestrial carbon bud-get, Ecosystems,10, 171–184, doi:10.1007/s10021-006-9013-8,2007.
Dacey, J. W. H. and Klug, M. J.: Methane efflux from lake sedi-ments through water lilies, Science, 203, 1253–1254, 1979.
den Heyer, C. and Kalff, J.: Organic matter mineralization rates insediments: A within- and among-lake study, Limnol. Oceanogr.,43, 695–705, 1998.
Directive 2000/30/EC of the European Parliament and the councilof 23 October 2000 establishing a framework for community ac-tion in the field of water policy, Official Journal of the EuropeanCommunities L327, 1–72.
www.biogeosciences.net/6/209/2009/ Biogeosciences, 6, 209–223, 2009

222 S. Juutinen et al.: Methane dynamics in different boreal lake types
Dodson, S. I., Lillie, R. A., and Will-Wolf, S.: Land use, wa-ter chemistry, aquatic vegetation, and zooplankton communitystructure of shallow lakes, Ecol. Appl., 15, 1191–1198, 2005.
Downing, J. A., Prairie, Y. T., Cole, J. J., Duarte, C. M., Tranvik, L.J., Striegl, R. G., McDowel, W. H., Kortelainen, P., Caraco, N. F.,Melack, K. J. M., and Middelburg, J. J.: The global abundanceand size distribution of lakes, ponds, and impoundments, Limnol.Oceanogr., 51, 2388–2397, 2006.
Duchemin, E., Lucotte, M., and Canuel, R.: Comparison of staticchamber and thin boundary layer equation methods for measur-ing greenhouse gas emissions from large water bodies, Environ.Sci. Tech., 33, 350–357, 1999.
Fee, E. J., Hecky, R. E., Kasian, S. E. M., and Cruikshank, D.R.: Effects of lake size, water clarity, and climatic variabilityon mixing depths in Canadian Shield lakes, Limnol. Oceanogr.,41, 912–920, 1996.
Finnish Meteorological Institute: Meteorological yearbook of Fin-land, 1998, 78 pp., 1999, (in Finnish).
Finnish Meteorological Institute: Meteorological yearbook of Fin-land, 1999, 78 pp., 2000, (in Finnish).
Hamilton, J. D., Kelly, C. A., Rudd, J. W. M., Heslein, R. H., andRoulet, N. T.: Flux to the atmosphere of CH4 and CO2 from wet-land ponds on the Hudson Bay Lowlands (HBLs), J. Geophys.Res., 99(D1), 1495–1510, 1994.
Huttunen, J. T., Vaisanen, T., Heikkinen, M., Hellsten, S., Nykanen,H., Nenonen, O., and Martikainen, P. J.: Exchange of CO2, CH4and N2O between the atmosphere and two northern boreal pondswith catchments dominated by peatlands or forests, Plant. Soil,242, 137–146, 2002.
Huttunen, J. T., Alm, J., Liikanen, A., Juutinen, S., Larmola,T., Hammar, T., Silvola, J., and Martikainen, P. J.: Fluxes ofmethane, carbon dioxide and nitrous oxide in boreal lakes andpotential anthropogenic effects on the aquatic greenhouse gasemissions, Chemosphere, 52, 609–621, 2003.
Huttunen, J. T., Vaisanen, T. S., Hellsten, S. K., and Martikainen,P. J.: Methane fluxes at the sediment – water interface in someboreal lakes and reservoirs, Bor. Env. Res., 11, 27–34, 2006.
Hyvarinen, V. and Korhonen, J.: Hydrological Yearbook 1996–2000, The Finnish Environment, 599, 219 pp., Finnish Environ-ment Institute, Helsinki, 2003, (in Finnish).
Jahne, B., Munnich, K. O., Bosinger, R., Dutzi, A., Huber, W., andLibner, P.: On the parameters influencing air-water gas exchange,J. Geophys. Res., 92, 1937–1949, 1987.
Juutinen, S., Alm, J., Larmola, T., Huttunen, J.T., Morero, M., Mar-tikainen, P. J., and Silvola, J.: Major implication of the littoralzone for methane release from boreal lakes, Glob. Biogeochem.Cycles, 17(4), 1117, doi:10.1029/2003GB002105, 2003.
Kankaala, P., Huotari, J., Peltomaa, E., Saloranta, T., and Ojala, A.:Methanotrophic activity in relation to methane efflux and totalheterotrophic bacterial production in a stratified, humic, boreallake, Limnol. Oceanogr., 51, 1195–1204, 2006.
Kankaala, P., Taipale, S., Nykanen, H., and Jones, R. I.: Oxida-tion, efflux, and isotopic fractionation of methane during autum-nal turnover in a polyhumic, boreal lake, J. Geophys. Res., 112,Go2003, doi:10/1029/2006JG000336, 2007.
Kelly, C. A. and Chynoweth, D. P.: The contributions of tempera-ture and of the input of organic matter in controlling rates of sed-iment methanogenesis, Limnol. Oceanogr., 26, 891–897, 1981.
Kortelainen, P., Huttunen, J., Vaisanen, T., Mattsson, T., Kar-
jalainen, P., and Martikainen, P.J.: CH4, CO2 and N2O super-saturation in 12 Finnish lakes before and after ice melt, Verh. Int.Ver. Limnol., 27, 1410–1414, 2000.
Kortelainen, P., Pajunen, H., Rantakari, M., and Saarnisto, M.: Alarge carbon pool and small sink in boreal Holocene lake sedi-ments, Global Change Biol., 10, 1648–1653, 2004.
Kortelainen, P., Rantakari, M., Huttunen, J.T., Mattson, T., Alm,J., Juutinen, S., Larmola, T., Silvola, J., and Martikainen, P. J.:Sediment respiration and lake trophic state are important predic-tors of large CO2 evasion from small boreal lakes, Glob. ChangeBiol., 12, 1554–1567, 2006.
Larmola, T., Alm, J., Juutinen, S., Huttunen, J. T., Martikainen,P. J., and Silvola, J.: Contribution of vegetated littoral zone towinter fluxes of carbon dioxide and methane from boreal lakes, J.Geophys. Res., 109, D19102, doi:10.1029/2004JD004875, 2004.
Lide, D. R. and Fredrikse, H. P. R.: CRC Handbook of Chemistryand Physics, 76th ed., CRC Press, Boca Raton, Fla, 1995.
Liikanen, A., Huttunen, J. T., Murtoniemi, T., Tanskanen, H.,Vaisanen, T., Silvola, J., Alm, J., and Martikainen, P. J.: Spatialand seasonal variation in greenhouse gas and nutrient dynamicsand their interactions in the sediments of a boreal eutrophic lake,Biogeochemistry, 65, 83–103, 2003.
Liikanen, A., Huttunen, J.T., Valli, K., and Martikainen, P. J.:Methane cycling in the sediment and water column of mid-borealhyper-eutrophic lake Kevaton, Arch. Hydrobiol., 154, 585–603,2002.
MacIntyre, S., Wanninkof, R., and Chanton, J. P.: Trace gas ex-change across the air-water interface in freshwater and coastalmarine environments, in , edited by: Matson, P. A. and Harriss,R. C., Biogenic trace gases: Measuring emissions from soil andwater. Methods in ecology, 52–97, Blackwell Science, 1995.
Mannio, J., Raike, A., and Vuorenmaa, J.: Finnish lake survey 1995:regional characteristics of lake chemistry, Verh. Internat. Verein.Limnol., 27, 362–367, 2000.
McAuliffe, C. C.: GC determination of solutes by multiple phaseequilibration, Chem. Technol., 1, 46–51, 1971.
Michmerhuizen, C. M., Striegl, R. G., and McDonald, M. E.: Po-tential methane emission from north-temperate lakes followingice melt, Limnol. Oceanog., 41, 985–991, 1996.
Murase, J., Sakai, Y., Kametani, A., and Sugimoto, A.: Dynamicsof methane in mesotrophic Lake Biwa, Japan, Ecol. Res., 20,377–385, 2005.
National Board of Waters: Methods of water analysis employed bythe Water Administration, Helsinki, 136 pp. National Board ofWaters, Finland, 1981.
Phelps, A. R., Peterson, K. M., and Jeffries, M. O.: Methane effluxfrom high-latitude lakes during spring ice melt, J. Geophys. Res.,103, 29029–29030, 1998.
Rantakari, M., Kortelainen, P., Vuorenmaa, J., Mannio, J., and For-sius, M.: Finnish lake survey: the role of catchment attributes indetermining nitrogen, phosphorous and organic carbon concen-trations, Water Air Soil Poll. Focus, 4, 683–399, 2004.
Rantakari, M. and Kortelainen, P.: Interannual variation and cli-matic regulation of the CO2 emission from large boreal lakes,Glob. Change Biol., 11, 1368–1380, 2005.
Repo, M. E., Huttunen, J. T., Naumov, A. V., Chichulin, A. V., Lap-shina, E. D., Bleuten, W., and Martikainen, P. J.: Release of CO2and CH4 from small wetland lakes in western Siberia, Tellus, 59,788–796, doi:10.1111/j.1600-0889.2007.00301.x, 2007.
Biogeosciences, 6, 209–223, 2009 www.biogeosciences.net/6/209/2009/
S. Juutinen et al.: Methane dynamics in different boreal lake types 223
Riera, J. L., Schindler, J. E., and Kratz, T. K.: Seasonal dynamicsof carbon dioxide and methane in two clear-water lakes and twobog lakes in northern Wisconsin, USA, Can. J. Fish. Aquat. Sci.,56, 265–274, 1999.
Rudd, J. M. W. and Hamilton, R. D.: Methane cycling in a eutrophicshield lake and its effects on whole lake metabolism, Limnol.Oceanogr., 23, 337–349, 1978.
Saarnio, S., Winiwater, W., and Leitao, J.: Methane release fromwetlands and watercourses in Europe, Atm. Env., 43, 1421–1429,doi:10.1016/j.atmosenv.2008.04.007, 2009.
Schmidt, U. and Conrad, R.: Hydrogen, carbon monoxide, andmethane dynamics in Lake Constance, Limnol. Oceanogr., 38,1214–1226, 1993.
Smith, L. K. and Lewis, M. W.: Seasonality of methane emissionsfrom five lakes and associated wetlands of the Colorado Rockies,Glob. Biogeochem. Cycles, 6, 323–338, 1992.
Smith, L. C., Sheng, Y., MacDonald, G. M., and Hinz-man, L. D.: Disappearing arctic lakes, Science, 308, 1429,doi:10.1126/Science.1108142, 2005.
Smol, J. P. and Douglas, M. S. V.: Crossing the final ecologi-cal threshold in high Arctic ponds, Proc. Nat. Acad. Sci., 104,12395–12397, 2007.
Sorrano, P. A., Cheruvelil, K. S., Stevenson, R. J., Rollins, S. L.,Holden, S. W., Heaton, S., and Torgn, E.: A framework for de-veloping ecosystem-specific nutrient criteria: Integrating biolog-ical thresholds with predictive modeling, Limnol. Oceanogr., 53,773–787, 2008.
Strayer, R. F. and Tiedje, J. M.: In situ methane production in small,hypereutrophic, hard-water lake: Loss of methane from sedi-ments by vertical diffusion and ebullition, Limnol. Oceangr., 23,1201–1206, 1978.
Walter, K. M., Smith, L. C., and Chapin III, F. S.: Methane bub-bling from northern lakes: present and future contributions to theglobal methane budget, Phil. Trans. Royal Soc., 365, 1657–1676,2007.
Vuori, K. M., Back, S., Hellsten, S., Karjalainen, S. M., Kaup-pila, P., Lax, H.-G., Lepisto, L., Londesborough, S., Mitikka,S., Niemela, P., Niemi, J., Perus, J., Pietiainen, O.-P., Pilke, A.,Riihimaki, J., Rissanen, J., Tami, J., Tolonen, K., Vehanen, T.,Vuoristo, H., and Westerberg, V.: The basis for typology and eco-logical classification of water bodies in Finland, The Finnish En-vironment 807, 151 pp., Finnish Environment Institute (SYKE),2006, (in Finnish with English abstract).
www.biogeosciences.net/6/209/2009/ Biogeosciences, 6, 209–223, 2009