Embed Size (px)
Citation preview


Message from the Dean
In this digital age of tweets and Facebook posts, writing (real writing!) seems to be a slowly dying art. Why write, after all, when a picture posted on Instagram can supposedly paint a thousand words?
Many young (and not so young) people seem no longer able to read past the headlines and the first few paragraphs of any article, as shown, for instance, by their quick reactions to what the headlines might be saying, often without realizing that the author was actu-ally being ironic and was in fact presenting an opposite view—something that would be obvious only if one bothered to read the article to the end.
Social media can oftentimes be depressing for someone like me. Forget about spelling and grammar—critical thinking, itself, appears to be a dying art. Many young people seem to accept the notion that “if it’s on the internet, then it must be true.” When I read clashes that are going on over digital news sites like Rappler, I am dismayed by the quality of the arguments and the total lack of logic that are manifest in them.
What does this all have to do with Techne?
I am pleasantly refreshed by a publication like Techne. In many ways, it is almost anach-ronistic—it is a hardcopy publication in an age of digitization; it encourages people to write at length on selected topics in an age of soundbites; and it requires critical thinking at a time when society no longer seems to demand it.
I congratulate the Department of Operations and Information Technology for putting together this latest issue of Techne, and staying at the forefront of encouraging writing, reading, and the critical thinking. These two activities engender the very heart of graduate education made even more and not less important in this digital age.
Rodolfo P. AngDean

Message from the Operations and IT Head
Warm greetings and congratulations to our Management Science and Operations Management students for their excellent final projects featured in the Techne journal. Now on its sixth edition, the journal features our students’ expertise in the operations field shown by their inno-vative use of the various management tools and techniques in various projects and research.
What makes this edition important is the fact that the students’ projects will, for the second time, reach a wide group of companies and professional organizations involved in similar endeavors to improve the Filipino people’s lives and well-being. I hope that our colleagues in the operations field make this journal available to their employees and friends.
The current edition touches various aspects of our lives—from milk matters for infants and books for elementary school kids to projects for professionals and enrollment tips for graduate students. These contents are a fitting tribute to our goal of nation-building and being a man for others.
As always, I congratulate and thank the members of our Operations Cluster faculty for their tireless efforts in motivating and guiding our students to create enlightening and outstanding projects.
To all our readers, old and new, welcome and thank you, and enjoy your reading!
Ralph AnteHead, Department of Operations and IT

Message from Editor
The first Techne: Managing through Numbers publication came out in 2010 as a compila-tion of end-of-term articles written by MBA students taking up Management Science and Operations Management courses and put together by the AGSB Operations Management Department. Fast forward to 2016 and we have now Techne 6. That’s about one Techneissue per year. We believe that we have set a track record. We hope to continue publishing in the years to come worthwhile articles involving application of technical tools and models to aid in achieving good management decisions.
The readership of our publication has increased through the years, covering schools, libraries, top corporations, and professional associations. If you are reading this for the first time, we welcome your time, hopefully, well spent. We pray you will find the contents of the seven selected articles from our students inspiring and useful, if not in the imme-diate present, then perhaps in the days to come.
For the first time, we are lucky to have gathered articles that cover the various stages of man’s development. We start with handling special babies (Milk Matters), to providing books to grade school kids (Silid-Aklatan Para Kay Juan), to dealing with truckers (Fleet Management), to handling technical personnel (Manpower Mix Decision), and to enrolling potential graduate students (Applying to AGSB: European Experience).
Also in this issue, we share the discoveries made by our MBA students through the use of linear programming, to wit:
The article “Optimizing Capacity” demonstrates the application of production process models. These models are often characterized by the fact that goods produced are intended not only to be directly sold in the market but also to serve as inputs to the production of other goods.
The article “Financial Literacy Index” proposes to determine the financial literacy score of a subject group and develop strategies that will lead to achieving finan-cial well-being.
Included in this issue are reaction papers prepared by our students on Operations Management forums that are conducted on a regular basis.
As always, we hope you will find enjoyment in this issue. Let us know if we are hitting the nail and to which new worlds we need to bring the Enterprise to venture.
Ed Legaspi
The Story of Juan
This case revolves around the story of Juan.
Juan is a baby born prematurely. As he lies in the Neonatal Intensive Care Unit (NICU), he is fighting for his dear life.
The story of Juan is not extraordinary. As a matter of fact, it is an everyday occurrence. What is even more alarming is the staggering number of cases like Juan’s. According to UNICEF (2012), around 350,000 premature babies are born in the Philippines annually. This data makes the Philippines the eighth country in the world (out of 184 countries) with the most number of premature births. Moreover, it is the 17th country with the highest volume of deaths due to preterm birth complications.
Juan, along with many others like him, needs a fighting chance in life.
Milk Does Matter
Preterm birth is the primary cause of infant morbidity in the world. According to UNICEF Mother and Child Specialist Dr. Mariella Castillo, breast milk is still considered as a critical factor in providing appropriate newborn care. The UNICEF’s 2014 State of the World’s Children report shows that only thirty four percent (34%) of infants under six months are exclusively breastfed (Gavilan, 2014). The reasons for the failure to breastfeed vary from time constraints and inability to produce milk, both of which can be addressed by proper education and
Milk MattersDolores Chacker-Estacio
Maria Vanessa CristiOrange Garcia
Maria Corazon ReyesAngelo Roque
Sheridine Crissa Yao

5MILK MATTERS
resources. Ironically, for a developing country like the Philippines, it is surprising that mothers still opt to buy milk substitutes—probably due to the heavy advertising which amounted to $100 million in 2006 alone—when it is, in fact, the mothers themselves who can provide what is best for their children. Breastfeeding is likewise more economical as well as more beneficial to both the mother and the baby.
The Champions for Juan
The Phi Lambda Delta Sorority is a medical sorority which has, since 1969, shared in the mission and vision of its mother college to produce a community of doctors who possess a heightened social consciousness through a firm commitment to the excellence and leadership in commu-nity-oriented medical service directed especially to the underserved.
To answer the cries of help from babies like Juan, the Phi Lambda Delta Sorority founded Milk Matters, the first and the only youth-led breastfeeding program in the Philippines. On March 15, 2014, the sorority started its very first milk-letting activity. The program’s mission is to provide breast milk as the primary source of nutrition for all Filipino infants through community-based programs and activities.
Under the Milk Matters Program, the Phi Lambda Delta Sorority conducts a milk drive which targets two sources as supply chains: the first source is donated breast milk from lactating mothers all over Metro Manila and second is breast milk collected through milk-letting drives conducted by the group every three months. Of the two collection models, the milk-letting drive has reaped more donations of breast milk. During these milk-letting drives, lactating mothers in the community who are willing to donate their breast milk for free are assembled while participating in wellness lectures and other activities promoting maternal and child health.
The immediate goal of the Milk Matters project is to generate safe and sustainable supply of breast milk by hosting enough milk drives to meet the pressing demand at the NICU of the group’s mother hospital. The ultimate goal of the program is to push for the establishment of community-based milk banks in the country.
The Mission for Juan
The NICU administers medical care to babies who are premature, i.e., those born before 37 weeks of pregnancy. These neonatal patients are characterized as having low birth weight (which is less than 5.5 pounds) and having a medical condition that requires special care. One primary
6TECHNE ATENEO STUDENT BUSINESS REVIEW
factor that dictates the survival of premature babies is their access to milk. As part of a government directive, the hospital where the NICU is situated has banned the use of formula milk. In effect, its patients rely on the supply of breast milk to gain strength and weight to improve their chances of survival.
The problem in this set-up is the deficit in the breast milk supply. It is also the very same problem identified by the NICU as this need contributes significantly to the malnu-trition and even deaths of its neonatal patients.
The objective of this mission is to help the Phi Lambda Delta Sorority address the milk-deficit problem by orga-nizing more sustainable milk-letting activities. There is a need to create a compelling case for the Phi Lambda Delta Sorority’s cause for the likes of Juan.
The Quantitative Methods for the Mission
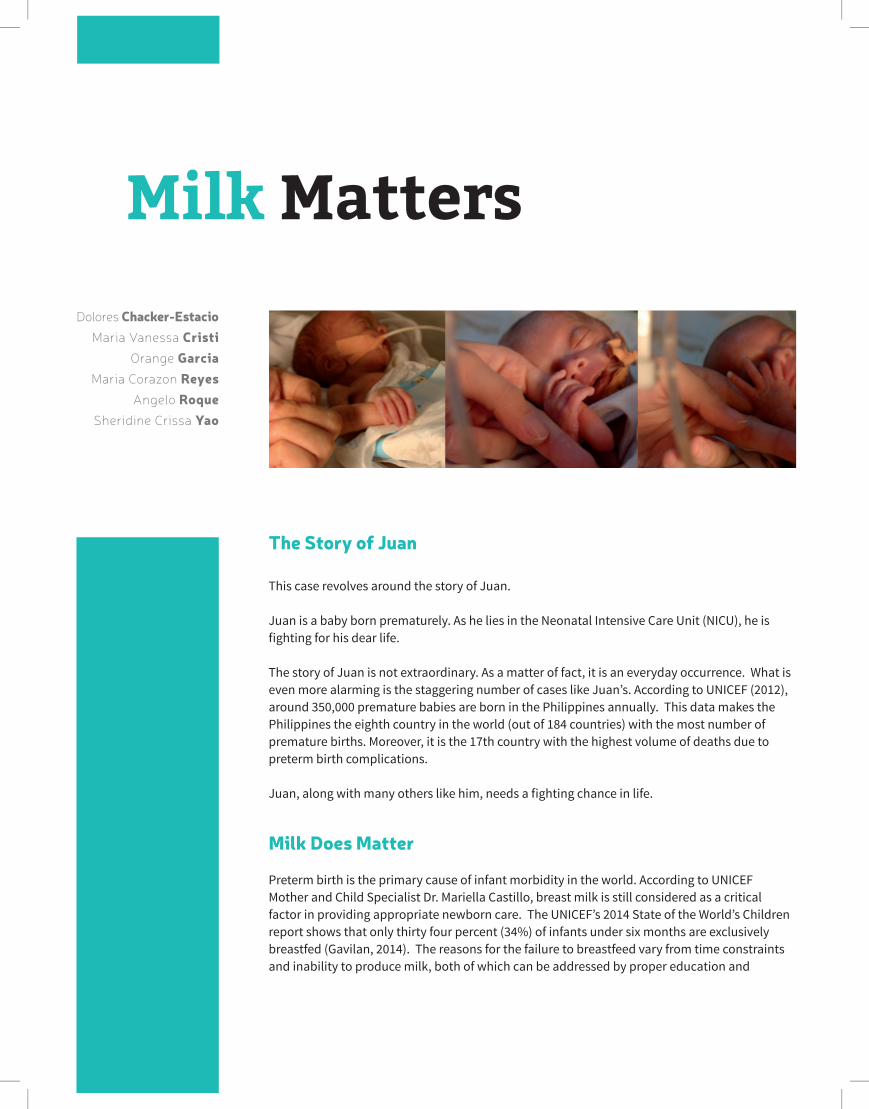
With the utilization of quantitative methods (refer to Figure 1), the essential questions are the following:
1. What are we really up against? How much deficit in the breast milk supply are we talking about?
2. How bad is it, really? How much risk are we talking about if the problem is not addressed?
3. How can we help? How much difference and impact can we really make?
What Is Juan Really Up Against?
To address the first essential question, there is a need to forecast the milk demand of the NICU patients using multiple linear regression. The daily patient headcount and the daily cumulative weight of patients are used as independent variables to determine daily milk demand. Based on expert opinion, daily neonatal caloric need is determined by weight.
Table 1 presents the NICU’s daily demand for milk (in oz.) with the corresponding total weights (in kg) and total headcount of neonates. Appendix A lists the complete data for all 44 observations.
Figure 1. Quantitative Methods

7MILK MATTERS
Table 1. Milk Demands of the NICU per day
DayNeonate Headcount (X1)(in number of babies)
Total Weight of All Neonates (X2) (in kg)
Total Demand for Milk (Y) (in oz.)
1 42 70.05 387.892 45 72.42 402.303 45 72.84 406.994 43 72.92 408.255 46 73.09 416.27... ... ... ...40 56 95.15 551.8641 63 95.56 551.5242 63 97.65 562.2343 59 98.23 552.1444 65 101.71 580.24
Formula is Y = a + b1X1 + b2X2
Where a = -33.9741
b1 = 1.7602
b2 = 5.0163
Based on the summary output on Table 2 showing the regression statistics, the model used is good: the R square value of 0.977886 is close to 1.0, with t Stat values greater than 2, meaning there is a significant linear relationship between the dependent variable which is milk demand and both independent variables. P-values of less than 0.05 mean that the results are statistically significant.
Table 2. Summary Output
SUMMARY OUTPUTRegression Statistics
Multiple R 0.988881251R Square 0.977886128
Adjusted R Square 0.976807403
Standard Error 7.447248328
Observations 44

8TECHNE ATENEO STUDENT BUSINESS REVIEW
ANOVA
df SS MS F Significance F
Regression 2 100553.9239 50276.96194 906.5199 1.16313E-34Residual 41 2273.921814 55.46150766
Total 43 102827.8457
Coefficients Standard Error t Stat P-value Lower 95% Upper 95%
Intercept -33.9741226 11.88180754 -2.85933958 0.006647 -57.9699197 -9.97832553X Variable 1 1.760224249 0.562743669 3.127932568 0.003235 0.623740354 2.896708143X Variable 2 5.016331565 0.366214945 13.6977795 6.82E-17 4.27674548 5.75591765
To show the Line Fit for Variable X1, which is headcount, and Variable X2, which is total (cumulative) weight, refer to Figures 1 and 2 of Appendix B.
Another factor to consider is the capacity of the NICU. The NICU has a maximum capacity of 75 beds, but can still be pushed to maximum overcapacity of up to 100 infants. The demand for breast milk can now be forecasted based on these headcounts, while averaging the 44 days of data gathered from NICU. Table 3 below shows the headcounts, cumulative weights, and forecasted demand based on our model. This formula will later be used to compute for total milk demand using Monte Carlo simulation.
Table 3. Summary of Headcounts, Cumulative Weights, and Forecasted Demand Based on Linear Regression Model
Average of 44 Days Max Over Capacity
Neonatal (Per Day) 51 100Cumulative Weight (Per Day) in Kilos 82.46 161.6862745Demand (Per Day) in Ounces 469.7392 953.695098
Daily Cumulative Demand For Milk (oz.) = (-33.97) + (1.76*X1) + (5.02*X2)Where X1 Neonatal Head CountWhere X2 Cumulative Weight of Inpatient Neonates (kg)
9MILK MATTERS
How Bad Is It for Juan?
Aft er determining that the model is good for forecasting using linear regression, the next step is to proceed with the Monte Carlo simulation to conduct a risk analysis in answering the second essential question.
The demand and supply of breast milk fl uctuates on a daily basis in the NICU. Uncertainties that dictate the demand include the number of neonates admitted per day and their cumulative weights. Uncertainties that dictate the supply include the amount of milk that can be collected from new mothers admitted at the OB ward, direct outpatient donations, and milk collected by Phi Lambda Delta Sorority from donations from lactating mothers in Metro Manila. Frequency tables of each can be found in Appendix C.
Based on the above listed uncertainties, a Monte Carlo simulation was conducted with a 50,000 trial run. The monthly surplus or defi cit was simulated using a uniform random number generated in Oracle Crystal Ball. The upper and lower limits, mid points, and probabilities are listed in Appendix C.
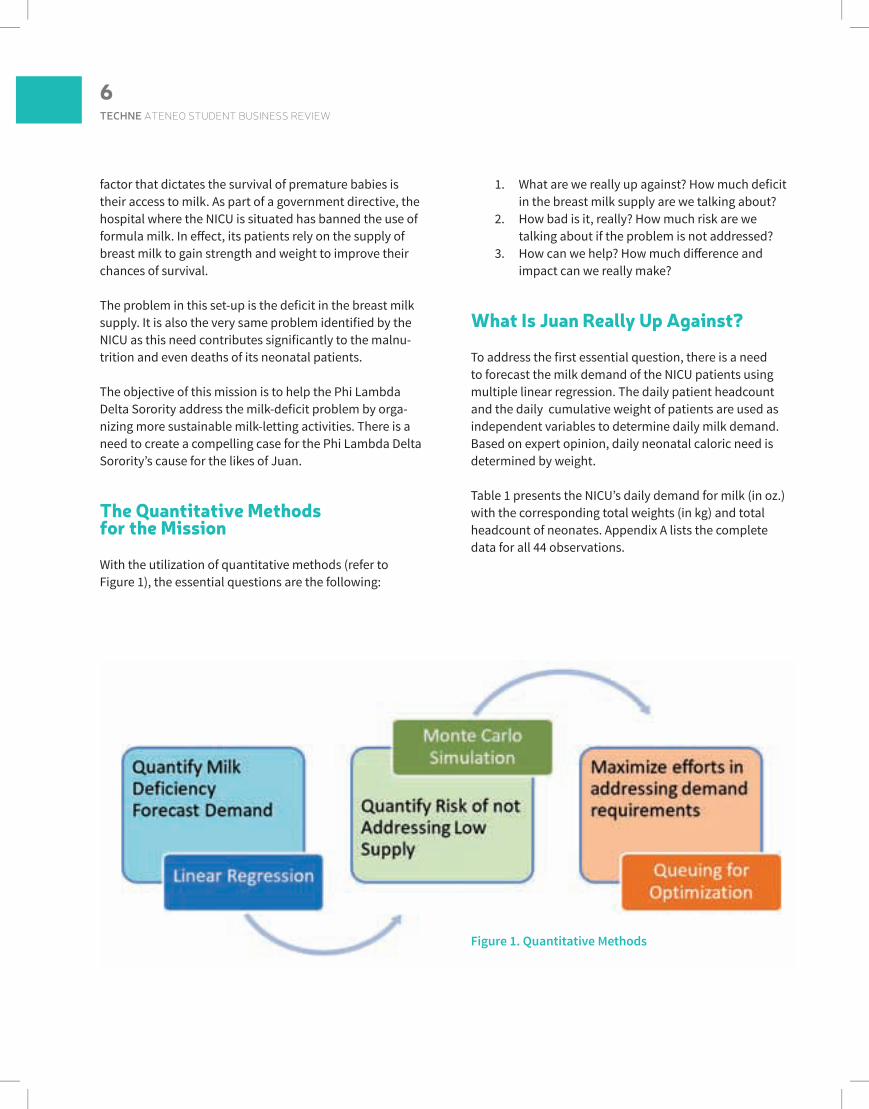
Table 4. Monte Carlo Simulation using Oracle Crystal Ball
N/day 48
Total Weight/day 72.72709099
Demand/day 415.5999967
Surplus/(Defi cit) -415.5999967
Phi Donations per day 0
Collected from mom per day 0
Collected from ward per day 0
Total Collection per day 0
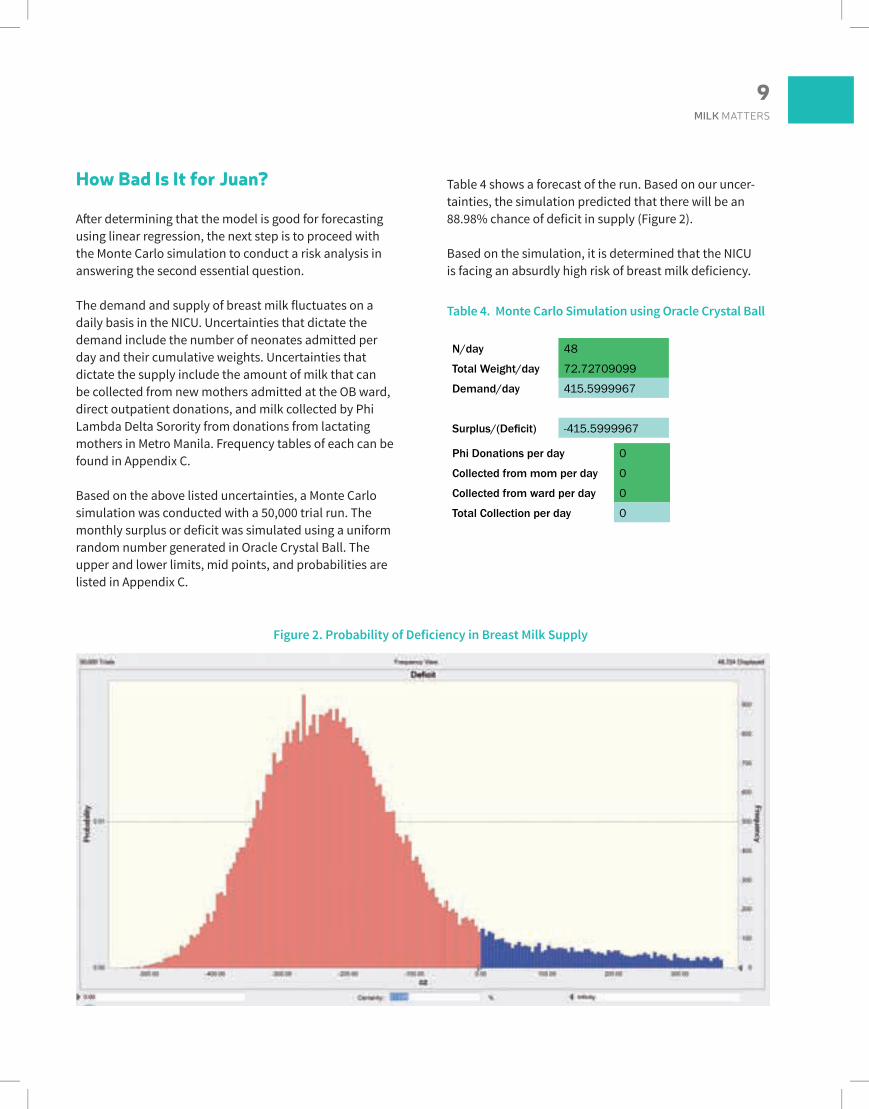
Table 4 shows a forecast of the run. Based on our uncer-tainties, the simulation predicted that there will be an 88.98% chance of defi cit in supply (Figure 2).
Based on the simulation, it is determined that the NICU is facing an absurdly high risk of breast milk defi ciency.
Figure 2. Probability of Defi ciency in Breast Milk Supply

10TECHNE ATENEO STUDENT BUSINESS REVIEW
Among the uncertainties faced were the lack of control over the amount of neonates admitted and the weights of the neonates. Though efforts can be directed to increase the supply from collections from inpatient and outpatient mothers, the Phi Lambda Delta Sorority believes that it has the most control over milk-letting drives and histor-ically can collect the most amount of breast milk for the NICU.
Historically, the Phi Lambda Delta Sorority can hold a milk-letting drive with up to 251 participating mothers. Table 5 shows the computation for the ideal number of milk-letting drives per month, using case modelling. Having computed that the Phi Lambda Delta Sorority should ideally have seven milk-letting drives in one month to meet the milk demand for the NICU, the sorority needs to rationalize whether such an effort is feasible.
The sorority’s milk-letting drives are purely voluntary effort on the part of medical students, and as such, there is limited manpower and monetary resources to sustain seven milk drives in one month. At most, the sorority believes that it can conduct a milk-letting drive once in every two weeks. The group cannot completely meet all of the demands of the NICU through solely conducting milk-letting drives, as its original goal states, but such efforts can definitely lessen the deficiency and add to the outpatients and inpatients milk collections.
Table 5. Ideal Milk Drive Frequency: Case Model
Daily Demand (in oz.) 416
x Days in a Month 30
Monthy Demand (in oz.) 12,480
Donor Moms per Drive 251
x Average Milk Output per Mom (in oz.) 8
Average Milk Output per Drive (in oz.) 2,008
Monthly Demand (in oz) 12,480
÷ Average Milk Output per Drive (in oz.) 2,008
Number of Drives per Month 6.22
≈ 7
Making It Better for Juan
To answer the last essential question, the Phi Lambda Delta Sorority Lambda Delta Sorority needs to improve the efficiency of its milk-letting drives. The quantitative tool to be used in enhancing the efficiency is the concept of Queuing Theory.
The milk-letting drive begins with a house-to-house call for lactating mothers four to five days before the activity. Screening interview forms are given to prospective mothers who fill out these forms and submit them to a representative in the community at least a day before the activity. These forms are reviewed by doctors who screen the eligibility of the donors. The donors are informed a day before the activity that they are eligible to donate breast milk. On the day of the activity, the mothers are given a mini physical exam to ensure that they are qua-lified to join the drive. Mothers are then queued to the breast pumps for donation. At present, the Phi Lambda Delta Sorority hosts the milk-letting drive by renting pumps for PHP850.00 per pump. While waiting for their turn, mothers are presented with public health lectures and are encouraged to join other activities to engage them and prevent walk-outs. At the end of the activity, mothers are given loot bags with child care paraphernalia as token of appreciation. Survey forms are also passed around to assess the mothers’ experience of the event.
On a survey conducted by the Phi Lambda Delta Sorority during one of its milk-letting drives, mothers who partici-pated were 100% likely to return to donate. More than this statistic, however, donor mothers needed to have a ‘good experience’ (e.g., efficient, smooth flow with less waiting time) for them to be a repeat donor. In the survey, it was found that lactating mothers begin experiencing discom-fort after an hour of being unable to express milk from full breasts. On this basis, a throughput time of less than or equal to 60 minutes per mother was assigned.
Two methods were considered to test out the theory in improving efficiency. The first is to simply increase the number of pumps to be used in order to decrease the waiting time of the volunteer mothers. The second is to improve service by making multiple queues and catego-rizing the mothers into these queues based on the volume of milk they can let.
11MILK MATTERS
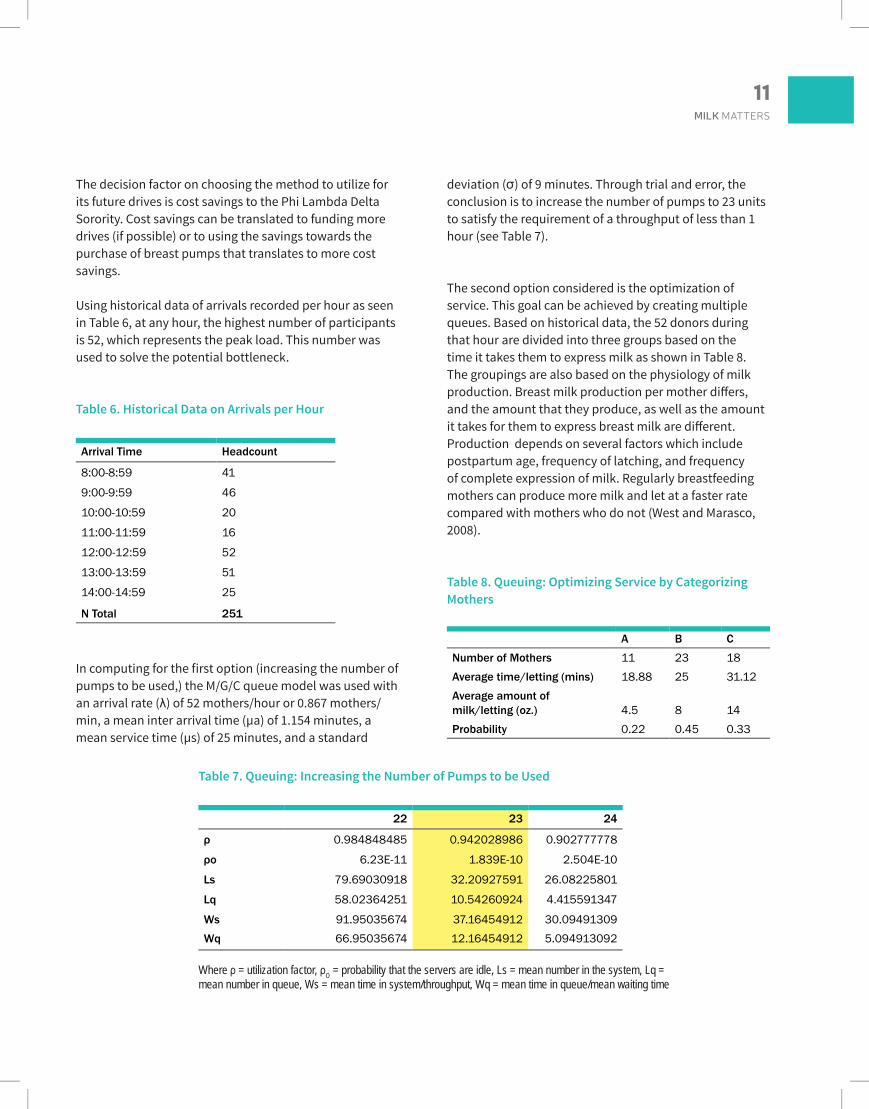
The decision factor on choosing the method to utilize for its future drives is cost savings to the Phi Lambda Delta Sorority. Cost savings can be translated to funding more drives (if possible) or to using the savings towards the purchase of breast pumps that translates to more cost savings.
Using historical data of arrivals recorded per hour as seen in Table 6, at any hour, the highest number of participants is 52, which represents the peak load. This number was used to solve the potential bottleneck.
Table 6. Historical Data on Arrivals per Hour
Arrival Time Headcount
8:00-8:59 41
9:00-9:59 46
10:00-10:59 20
11:00-11:59 16
12:00-12:59 52
13:00-13:59 51
14:00-14:59 25
N Total 251
In computing for the first option (increasing the number of pumps to be used,) the M/G/C queue model was used with an arrival rate (λ) of 52 mothers/hour or 0.867 mothers/min, a mean inter arrival time (μa) of 1.154 minutes, a mean service time (μs) of 25 minutes, and a standard
Table 7. Queuing: Increasing the Number of Pumps to be Used
22 23 24
ρ 0.984848485 0.942028986 0.902777778
ρo 6.23E-11 1.839E-10 2.504E-10
Ls 79.69030918 32.20927591 26.08225801
Lq 58.02364251 10.54260924 4.415591347
Ws 91.95035674 37.16454912 30.09491309Wq 66.95035674 12.16454912 5.094913092
Where ρ = utilization factor, ρO = probability that the servers are idle, Ls = mean number in the system, Lq = mean number in queue, Ws = mean time in system/throughput, Wq = mean time in queue/mean waiting time
deviation (σ) of 9 minutes. Through trial and error, the conclusion is to increase the number of pumps to 23 units to satisfy the requirement of a throughput of less than 1 hour (see Table 7).
The second option considered is the optimization of service. This goal can be achieved by creating multiple queues. Based on historical data, the 52 donors during that hour are divided into three groups based on the time it takes them to express milk as shown in Table 8. The groupings are also based on the physiology of milk production. Breast milk production per mother differs, and the amount that they produce, as well as the amount it takes for them to express breast milk are different. Production depends on several factors which include postpartum age, frequency of latching, and frequency of complete expression of milk. Regularly breastfeeding mothers can produce more milk and let at a faster rate compared with mothers who do not (West and Marasco, 2008).
Table 8. Queuing: Optimizing Service by Categorizing Mothers
A B C
Number of Mothers 11 23 18Average time/letting (mins) 18.88 25 31.12Average amount of milk/letting (oz.) 4.5 8 14Probability 0.22 0.45 0.33
12TECHNE ATENEO STUDENT BUSINESS REVIEW
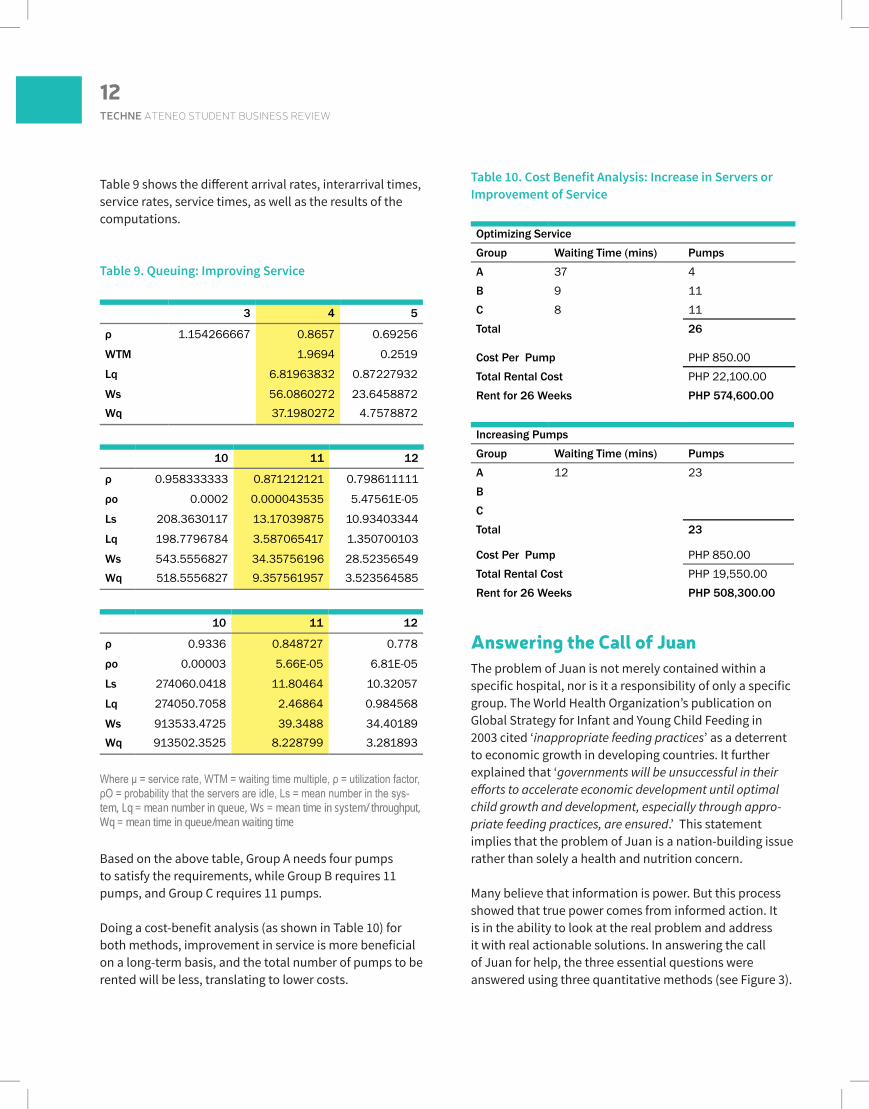
Table 9 shows the different arrival rates, interarrival times, service rates, service times, as well as the results of the computations.
Table 9. Queuing: Improving Service
3 4 5
ρ 1.154266667 0.8657 0.69256
WTM 1.9694 0.2519
Lq 6.81963832 0.87227932
Ws 56.0860272 23.6458872Wq 37.1980272 4.7578872
10 11 12
ρ 0.958333333 0.871212121 0.798611111
ρo 0.0002 0.000043535 5.47561E-05
Ls 208.3630117 13.17039875 10.93403344
Lq 198.7796784 3.587065417 1.350700103
Ws 543.5556827 34.35756196 28.52356549Wq 518.5556827 9.357561957 3.523564585
10 11 12
ρ 0.9336 0.848727 0.778
ρo 0.00003 5.66E-05 6.81E-05
Ls 274060.0418 11.80464 10.32057
Lq 274050.7058 2.46864 0.984568
Ws 913533.4725 39.3488 34.40189Wq 913502.3525 8.228799 3.281893
Where μ = service rate, WTM = waiting time multiple, ρ = utilization factor, ρO = probability that the servers are idle, Ls = mean number in the sys-tem, Lq = mean number in queue, Ws = mean time in system/ throughput, Wq = mean time in queue/mean waiting time
Based on the above table, Group A needs four pumps to satisfy the requirements, while Group B requires 11 pumps, and Group C requires 11 pumps.
Doing a cost-benefit analysis (as shown in Table 10) for both methods, improvement in service is more beneficial on a long-term basis, and the total number of pumps to be rented will be less, translating to lower costs.
Table 10. Cost Benefit Analysis: Increase in Servers or Improvement of Service
Optimizing Service
Group Waiting Time (mins) Pumps
A 37 4B 9 11C 8 11Total 26
Cost Per Pump PHP 850.00Total Rental Cost PHP 22,100.00Rent for 26 Weeks PHP 574,600.00
Increasing Pumps
Group Waiting Time (mins) Pumps
A 12 23B
C
Total 23
Cost Per Pump PHP 850.00Total Rental Cost PHP 19,550.00Rent for 26 Weeks PHP 508,300.00
Answering the Call of JuanThe problem of Juan is not merely contained within a specific hospital, nor is it a responsibility of only a specific group. The World Health Organization’s publication on Global Strategy for Infant and Young Child Feeding in 2003 cited ‘inappropriate feeding practices’ as a deterrent to economic growth in developing countries. It further explained that ‘governments will be unsuccessful in their efforts to accelerate economic development until optimal child growth and development, especially through appro-priate feeding practices, are ensured.’ This statement implies that the problem of Juan is a nation-building issue rather than solely a health and nutrition concern.
Many believe that information is power. But this process showed that true power comes from informed action. It is in the ability to look at the real problem and address it with real actionable solutions. In answering the call of Juan for help, the three essential questions were answered using three quantitative methods (see Figure 3).

13MILK MATTERS
With forecasting using linear regression, the defi cit was quantifi ed. Likewise, with Monte Carlo simulation, the impact of the defi cit was determined by putting a real number to a real problem. And with the queuing theory, the initial steps on how to strategically meet the defi cit were identifi ed.
In a country where estimated 1,000 Juans are born every day, the eff orts presented here may seem dismal. But even if these eff orts would result to saving the life of one
Juan and give him the fi ghting chance for life, then it’s all worth it.
Appendix A. PGH-NICU Statistics
N/Day Cumulative Weight/Day
Total Milk Demand/
Day
Total Milk Supplied/
DayDefi cit Inpatient
DonationOutpatient
Donation
The Soro-rity’s Milk Collection
from Dona-tions
kg oz oz oz oz oz oz
6/28/2015 51 76.14 443.09 303.36 -139.73 1198
6/29/2015 51 78.80 453.41 363.21 -90.20
6/30/2015 51 83.50 476.70 284.38 -192.32
7/1/2015 49 73.57 427.00 278.41 -148.58 80
7/2/2015 49 75.13 436.18 171.96 -264.22 30
7/3/2015 48 77.40 436.79 234.47 -202.33 88 300
Figure 3. Quantitative Methods

14TECHNE ATENEO STUDENT BUSINESS REVIEW
7/4/2015 48 77.58 445.46 315.05 -130.41 100 140
7/5/2015 51 80.32 465.43 318.63 -146.80 80 248
7/6/2015 54 84.01 488.90 216.30 -272.60 100
7/7/2015 51 78.03 446.57 216.78 -229.79 220
7/8/2015 51 77.67 438.73 202.65 -236.08 100 250
7/9/2015 49 78.84 439.68 128.16 -311.52 80
7/10/2015 45 72.84 406.99 210.29 -196.70 140 100
7/11/2015 50 80.37 451.96 163.39 -288.57 125
7/12/2015 49 81.61 455.40 158.72 -296.68 80
7/13/2015 43 72.92 408.25 94.27 -313.98 68
7/14/2015 45 72.42 402.30 106.75 -295.55 50 70
7/15/2015 45 75.18 421.55 109.66 -311.89 155
7/16/2015 42 70.05 387.89 141.88 -246.01 88
7/17/2015 46 73.09 416.27 126.13 -290.15 40 80
7/18/2015 46 74.83 421.27 122.54 -298.73 120
7/19/2015 49 76.40 436.94 162.44 -274.50 80 480
7/20/2015 50 83.83 473.76 153.48 -320.28 20
7/21/2015 55 89.82 527.10 206.86 -320.24 40
7/22/2015 54 88.66 521.63 135.19 -386.44 80
7/23/2015 56 95.15 551.86 177.29 -374.57 40 140
7/24/2015 57 90.93 531.08 198.03 -333.05 80 120
7/25/2015 55 89.44 520.94 136.14 -384.80 90
7/26/2015 59 90.95 522.44 166.87 -355.57 40 160
7/27/2015 65 101.71 580.24 166.57 -413.68 144
7/28/2015 63 95.56 551.52 161.56 -389.96 60 508
7/29/2015 63 97.65 562.23 207.48 -354.74
7/30/2015 59 98.23 552.14 158.72 -393.42 80
7/31/2015 49 83.70 466.47 162.54 -303.92 200
8/1/2015 45 73.44 398.60 125.89 -272.71 40
8/2/2015 51 77.46 442.14 155.00 -287.13 140
8/3/2015 49 81.94 454.73 166.47 -288.27 48 168
8/4/2015 48 80.14 458.78 160.68 -298.10 80 40
8/5/2015 48 81.15 462.61 139.72 -322.89 80
8/6/2015 51 86.52 486.33 164.94 -321.39 30 620
8/7/2015 53 90.40 505.23 173.63 -331.59 40
8/8/2015 55 89.38 499.87 183.17 -316.70 80
8/9/2015 50 84.74 483.17 138.37 -344.80
8/10/2015 52 86.60 505.71 151.35 -354.36 40
Table 10. Raw data gathered over 44 days showing daily neonatal headcount, cumulative weights in kg, cumulative milk demand in oz., total milk supplied in oz., amount of breastmilk collected from 3 sources: inpatient donation, outpatient donation, and the Phi Lambda Delta Sorority Milk Letting Drive donation.

15MILK MATTERS
Appendix B. Line Fit Diagrams
Figure 4. Line Fit for Headcount (Variable X1)
Figure 5. Line Fit for Total Weight (Variable X2)

16TECHNE ATENEO STUDENT BUSINESS REVIEW
Appendix C
Table 11. Frequency Table: Total Daily Neonate Headcount
X1: Total Head Count
Head Count Lower Limit Upper Limit Probability
39 0.000 0.011 0.011
40 0.011 0.023 0.011
41 0.023 0.034 0.011
42 0.034 0.045 0.011
43 0.045 0.057 0.011
44 0.057 0.102 0.045
45 0.102 0.216 0.114
46 0.216 0.273 0.057
47 0.273 0.307 0.034
48 0.307 0.398 0.091
49 0.398 0.489 0.091
50 0.489 0.580 0.091
51 0.580 0.705 0.125
52 0.705 0.773 0.068
53 0.773 0.841 0.068
54 0.841 0.864 0.023
55 0.864 0.909 0.045
56 0.909 0.932 0.023
57 0.932 0.943 0.011
58 0.943 0.943 0.000
59 0.943 0.966 0.023
60 0.966 0.966 0.000
61 0.966 0.966 0.000
62 0.966 0.966 0.000
63 0.966 0.989 0.023
64 0.989 0.989 0.00065 0.989 1.000 0.011
Table 12. Frequency Table: Total Daily Neonate Weight
X2: Total Weight
kg Range in kg
Mid Point Lower Limit Upper Limit Probability
72.7 70.1 75.3 0.2
78.0 75.3 80.6 0.3
83.2 80.6 85.9 0.2
88.5 85.9 91.2 0.2
93.8 91.2 96.4 0.099.1 96.4 101.7 0.1
Table 13. Frequency Table: Breast Milk Supplied by Inpatient Collections
Supply: In Patient Collection
oz. Range in oz.
Mid Point Lower Limit Upper Limit Probability
24.5 0 49 0.409
74.5 50 99 0.318
124.5 100 149 0.193
174.5 150 199 0.034224.5 200 249 0.045
Table 14. Frequency Table: Breast Milk Supplied by Outpatient Donors
Supply: Outpatient Collection
oz. Range in oz.
Mid Point Lower Limit Upper Limit Probability
49.5 0 99 0.841
149.5 100 199 0.091
249.5 200 299 0.034
349.5 300 399 0.011449.5 400 499 0.023

17MILK MATTERS
Table 15. Frequency Table: Breast Milk Supplied by Milk- Letting Drive
Supply: Phi Lambda Delta Donations
oz. Range in oz.
Mid Point Lower Limit Upper Limit Probability
99.5 0 199 0.932
299.5 200 399 0.011
499.5 400 599 0.023
699.5 600 799 0.023
899.5 800 999 0.0001099.5 1000 1199 0.011
Appendix D. Sources
Asingh. (2014). 4,775 babies born every day in the Philippines. Asian Pacific Post. Retrieved from http://www.asianpacificpost.com/article/6317-4775-babies-born-every-day-philippines.html
Gavilan, J. (2014). What’s keeping the Philippines from exclusive breastfeeding? Rappler. RetrievedLifted from http://www.rappler.com/move-ph/issues/hunger/specials/66233-exclusive-breastfeeding-philippines
GMA News. (2011). UNICEF: Only 34% of Filipino mothers breastfeed babies. GMA News Online. Retrieved from http://www.gmanetwork.com/news/story/235284/news/nation/unicef-only-34-of-filipino-mothers-breastfeed-babies
Republic Act No. 10028. Expanded Breastfeeding Promotion Act of 2009. Retrieved from http://www.lawphil.net/statutes/repacts/ra2010/ra_10028_2010.html
UNICEF. (2012). Time to focus on more than 350,000 preterm births in the Philippines every year. Retrieved from http://www.unicef.org/philippines/media_19960.html
West, D., & Marasco, L. (2008). Milk production overview. Retrieved from http://www.lowmilksupply.org/overview.shtml
World Health Organization. (2002, April 16). Infant and young child nutri-tion: Global strategy on infant and young child feeding. Retrieved from http://apps.who.int/gb/archive/pdf_files/WHA55/ea5515.pdf?ua=1
Introduction
Is financial literacy correlated with the quality of life of a person and the country of his/her origin?
The Philippines was at the forefront of economic development as it ended 2014 with a 6.1% full-year growth, landing second to China among Asian countries. The largest contributor to the country’s economic rehabilitation is the services sector which includes real estate and business activities to where the BPO industry belongs. This particular industry translates to more jobs and money to the growing lower-to-middle-income young working population. While this development may signify a straightforward improvement in the quality of life of citi-zens because of the perceived increase in monetary opportunities, its benefit or setback is still dependent on the outlook (or the lack of it) of the individual towards money. Money is a tool; how an individual utilizes it to achieve sustainable personal gain and independence lies in his/her knowledge on how to use it.
Financial Literacy Index
Gwendolyn ErmacRyan Norman Lim
Brimen Son MajometanoBon Nelson Sibulan
Julius Torribiano
19FINANCIAL LITERACY INDEX
What is Financial Literacy?
Financial literacy is defined as the “people’s ability to process economic information and make informed decisions about financial planning, wealth accumulation, debt, and pensions (Lusardi and Mitchell, 2014).”
Philippine Financial Literacy Ranking
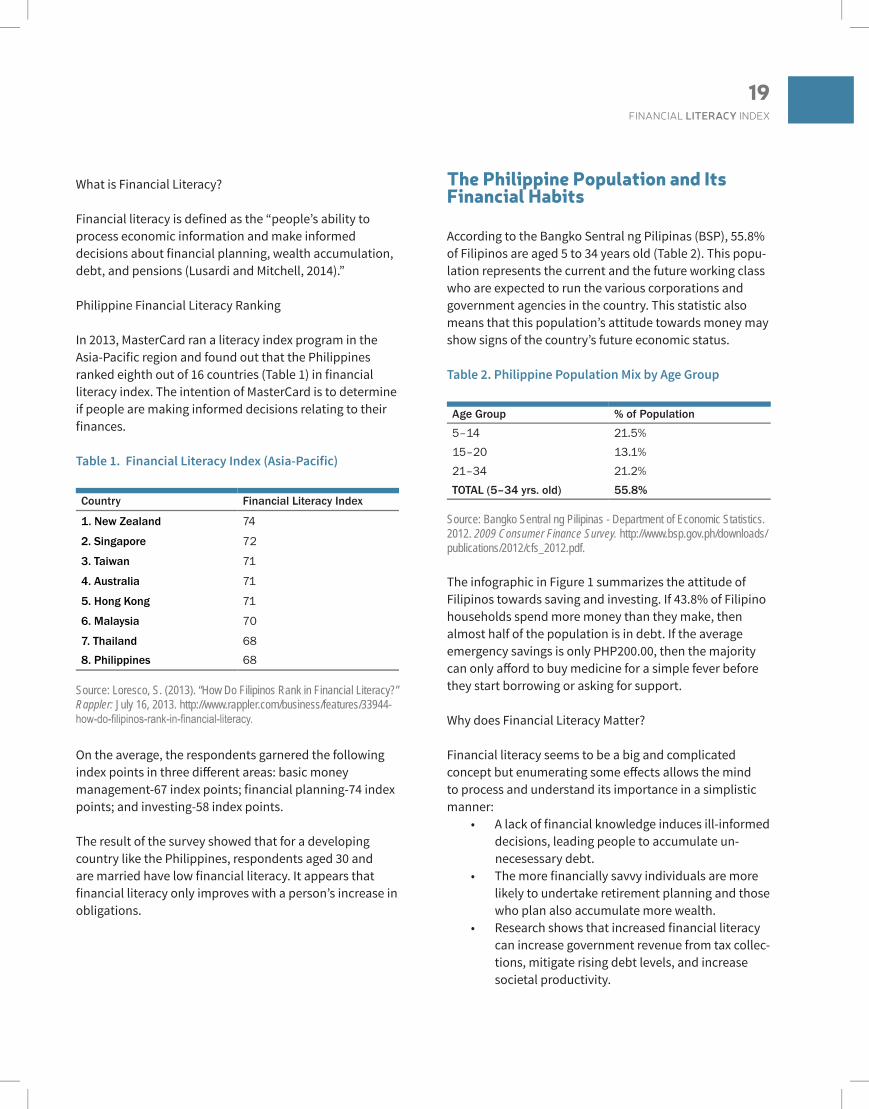
In 2013, MasterCard ran a literacy index program in the Asia-Pacific region and found out that the Philippines ranked eighth out of 16 countries (Table 1) in financial literacy index. The intention of MasterCard is to determine if people are making informed decisions relating to their finances.
Table 1. Financial Literacy Index (Asia-Pacific)
Country Financial Literacy Index
1. New Zealand 74
2. Singapore 72
3. Taiwan 71
4. Australia 71
5. Hong Kong 71
6. Malaysia 70
7. Thailand 688. Philippines 68
Source: Loresco, S. (2013). “How Do Filipinos Rank in Financial Literacy?” Rappler: July 16, 2013. http://www.rappler.com/business/features/33944-how-do-filipinos-rank-in-financial-literacy.
On the average, the respondents garnered the following index points in three different areas: basic money management-67 index points; financial planning-74 index points; and investing-58 index points.
The result of the survey showed that for a developing country like the Philippines, respondents aged 30 and are married have low financial literacy. It appears that financial literacy only improves with a person’s increase in obligations.
The Philippine Population and Its Financial Habits
According to the Bangko Sentral ng Pilipinas (BSP), 55.8% of Filipinos are aged 5 to 34 years old (Table 2). This popu-lation represents the current and the future working class who are expected to run the various corporations and government agencies in the country. This statistic also means that this population’s attitude towards money may show signs of the country’s future economic status.
Table 2. Philippine Population Mix by Age Group
Age Group % of Population
5–14 21.5% 15–20 13.1% 21–34 21.2% TOTAL (5–34 yrs. old) 55.8%
Source: Bangko Sentral ng Pilipinas - Department of Economic Statistics. 2012. 2009 Consumer Finance Survey. http://www.bsp.gov.ph/downloads/publications/2012/cfs_2012.pdf.
The infographic in Figure 1 summarizes the attitude of Filipinos towards saving and investing. If 43.8% of Filipino households spend more money than they make, then almost half of the population is in debt. If the average emergency savings is only PHP200.00, then the majority can only afford to buy medicine for a simple fever before they start borrowing or asking for support.
Why does Financial Literacy Matter?
Financial literacy seems to be a big and complicated concept but enumerating some effects allows the mind to process and understand its importance in a simplistic manner:
• A lack of financial knowledge induces ill-informed decisions, leading people to accumulate un-
necesessary debt.• The more financially savvy individuals are more
likely to undertake retirement planning and those who plan also accumulate more wealth.
• Research shows that increased financial literacy can increase government revenue from tax collec-tions, mitigate rising debt levels, and increase societal productivity.

20TECHNE ATENEO STUDENT BUSINESS REVIEW
• Numerically and financially literate persons are more likely to participate in financial market and invest in stocks.
• Less financially savvy individuals incur high trans-action costs by paying higher fees and engaging in high-cost borrowing.
• Findings of a US Federal Government study show that people who fall prey to financial scams have lower financial literacy.
For the past years, there have been lots of studies and efforts to improve financial literacy in the Philippines
especially among the young professionals. However, prog-ress has not been promising due to the following factors:
• Fear of math. The Philippines is a nation of citi-zens not very fond of numbers, so much so that the country only ranked 115th out of 142 coun-tries in perceived quality of Math and Science education. Other neighbor countries included in the study were Indonesia (53rd), Vietnam (59th), Thailand (60th), Cambodia (97th), and Bangladesh (106th).
• Lack of knowledge/awareness of available finan-cial services
Figure 1. Infographic on Filipino Households Saving and Investing
Source: Money Summit & Wealth Expo. 2012. Less than 1% of Filipino Households Invests in Securities. http://money-summit.com/less-than-1-of-filipino-households-invests-in-securities/.

21FINANCIAL LITERACY INDEX
• Intangible benefits of savings and investments in the present life of people
• Low appeal of long-term gratification from savings and investments like retirement, travels, and debt-free existence
• Skeptical attitude towards motives and inten-tions of financial institutions offering services
• Young population
A healthy population makes a healthy nation. To minimize a debt-laden population which will hinder the overall development of the Philippines, a non-profit organization (NGO) is recommended to be organized and established.
Name of the NGO: #SIGURADO (Assured)
Objective: To improve awareness and consciousness of the Filipinos on financial literacy for a sustainable quality of life through non-revenue-generating activities, program planning, and policy-making.
Quantitative Models Used
Three quantitative models are utilized in #SIGURADO in order to improve the overall financial literacy score (FLS) of Filipinos. These include multiple linear regression, linear programming, and program evaluation review tech-nique/critical path method (PERT/CPM). The use of each model is explained in Table 3.
Table 3. Summary of Quantitative Models Used
Quantitative Model Used Objective(s)
Multiple Linear Regression
To gauge whether age, educa-tional attainment, and income/salary level are good predictors of FLS and to form a multiple linear regression model to esti-mate the overall FLS of Filipinos based on the good predictors
Linear Programming To determine the optimal number of financial interven-tions (“programs”) that will be launched by the NGO per target age group over a period of one year
Quantitative Model Used Objective(s)
PERT/CPM To estimate the feasibility of creating a road map for launch-ing different financial literacy programs aimed to improve the overall FLS of Filipinos; to determine if the project is within the maximum overall budget constraint; and to crash the project time to the shortest pos-sible duration at the least cost increase possible
Multiple Linear Regression
Lusardi and Mitchell, who have conducted multiple studies on financial literacy (2011), have designed a standard set of questions on financial literacy and imple-mented them in numerous surveys in the US and other parts of the world (2014).
Four principles should be present in the survey questions: simplicity, relevance, brevity, and capacity to differentiate. The questions should be simple and should measure the fundamental building blocks in decision-making. It should be relevant and connect to day-to-day financial deci-sion-making. Brevity means the questions should be short and concise. Lastly, the respondents should have the capacity to differentiate various financial concepts such as saving, borrowing, and investing.
A total of 12 questions were asked on core concepts: saving and investing, as well as spending and borrowing (see Appendix 1 for the list of questions). Each correct question corresponds to 0.8333 points. Financial literacy score ranges in increasing order from 0 (no correct answer) to 10 (all correct answers).
Age group, educational attainment, and salary range were also identified in the survey. These were the independent variables in the multiple regression model.
• Age group: 18–24 years old, 25–34 years old, 35–44 years old, or 45–60 years old
• Educational attainment: did not reach graduate school (0) or reached graduate school (1)
• Salary range: PHP0–20,000, PHP20,001–40,000, or PHP40,001 and above

22TECHNE ATENEO STUDENT BUSINESS REVIEW
A total of 113 respondents answered the survey through Google and offline forms (Appendix 4). A multiple linear regression was used to check if age, educational attain-ment, and salary are good predictors of financial literacy score. Based on the primary data, Table 4 shows the average financial score per group.
salary (t-stat=3.13) are all higher than 1.64. Therefore, the three are good predictors for financial literacy score.
Thus, since the model is good and independent variables (X’s) are good predictors, the multiple regression model is: Y = 6.5931 + 0.0228X1 + 0.4428X2 + 0.00002X3 where Y = financial literacy score, X1 = age, X2 = educational attain-ment, and X3 = salary.
Multiple linear regression yielded the mean overall base (“lower confidence limit”) FLS of 8.1926 across all age groups.
Linear Programming
Linear programming, specifically integer programming, was used as an objective tool to determine the optimal number of financial interventions (“programs”) that will be launched by the NGO per target age group over a period of one year to improve/increase the overall FLS to a target maximum of 9.5000.
Objective FunctionTo maximize E or the increment on the overall floor finan-cial literacy score. Thus, the resulting overall FLS = overall base (“floor”) FLS + E, where FLS ranges from 0.0 to 10.0.
Figure 2. Multiple Linear Regression Results
Table 4. Average Financial Score per Group
Midpoint ofAge Group (X1)
EducationalAttainment (X2)
Midpointof Salary (X3)
Financial LiteracyScore (Y)
21 0 10,000 7.9164
21 0 30,000 8.333021 0 50,000 8.3330
21 1 30,000 8.3330
21 1 50,000 8.3330
30 0 10,000 7.2914
30 0 30,000 8.0156
30 0 50,000 8.1518
30 1 10,000 7.2219
30 1 30,000 8.5711
30 1 50,000 8.8633
40 0 10,000 7.9164
40 0 30,000 7.9164
40 0 50,000 8.1247
40 1 30,000 9.5830
40 1 50,000 8.5413
53 0 10,000 7.4997
53 0 50,000 9.499653 1 50,000 9.9996
Regression under data analysis in Microsoft Excel was used to validate the hypothesis. For the purposes of this study, a 90% confidence level was used. The output of the regression is shown in Figure 2.
Based on the result, R2 is only 58.60%, which is insuffi-cient to conclude that the model is good. Thus, ANOVA was then used to validate if the model works. Based on ANOVA, significance F is 0.003, which is less than 0.1 (1 minus confidence level of 0.9). Therefore, there is sufficient evidence to say that the model is good. Using t-stat for each independent variable, the values for age (t-stat=2.05), educational attainment (t-stat=1.78), and

23FINANCIAL LITERACY INDEX
Equation 1. Linear Programming - Objective Function
Decision Variables
The decision variables and their corresponding coeffi-cients are shown in Table 5. They stand for: X1 = number of lecture sessions to be conducted during
the year for the 18–24 age groupX2 = number of mentoring sessions to be conducted
during the year for the 18–24 age groupX3 = number of digital marketing campaigns to be
launched during the year for the 18–24 age groupX4 = number of events to be launched during the year for
the 18–24 age groupX5 = number of lecture sessions to be conducted during
the year for the 25–34 age groupX6 = number of mentoring sessions to be conducted
during the year for the 25–34 age groupX7 = number of digital marketing campaigns to be
launched during the year for the 25–34 age groupX8 = number of events to be launched during the year for
the 25–34 age group
X9 = number of lecture sessions to be conducted during the year for the 35–44 age group
X10 = number of mentoring sessions to be conducted during the year for the 35–44 age group
X11 = number of digital marketing campaigns to be launched during the year for the 35–44 age group
X12 = number of events to be launched during the year for the 35–44 age group
X13 = number of lecture sessions to be conducted during the year for the 45–60 age group
X14 = number of mentoring sessions to be conducted during the year for the 45–60 age group
X15 = number of digital marketing campaigns to be launched during the year for the 45–60 age group
X16 = number of events to be launched during the year for the 45–60 age group
24TECHNE ATENEO STUDENT BUSINESS REVIEW
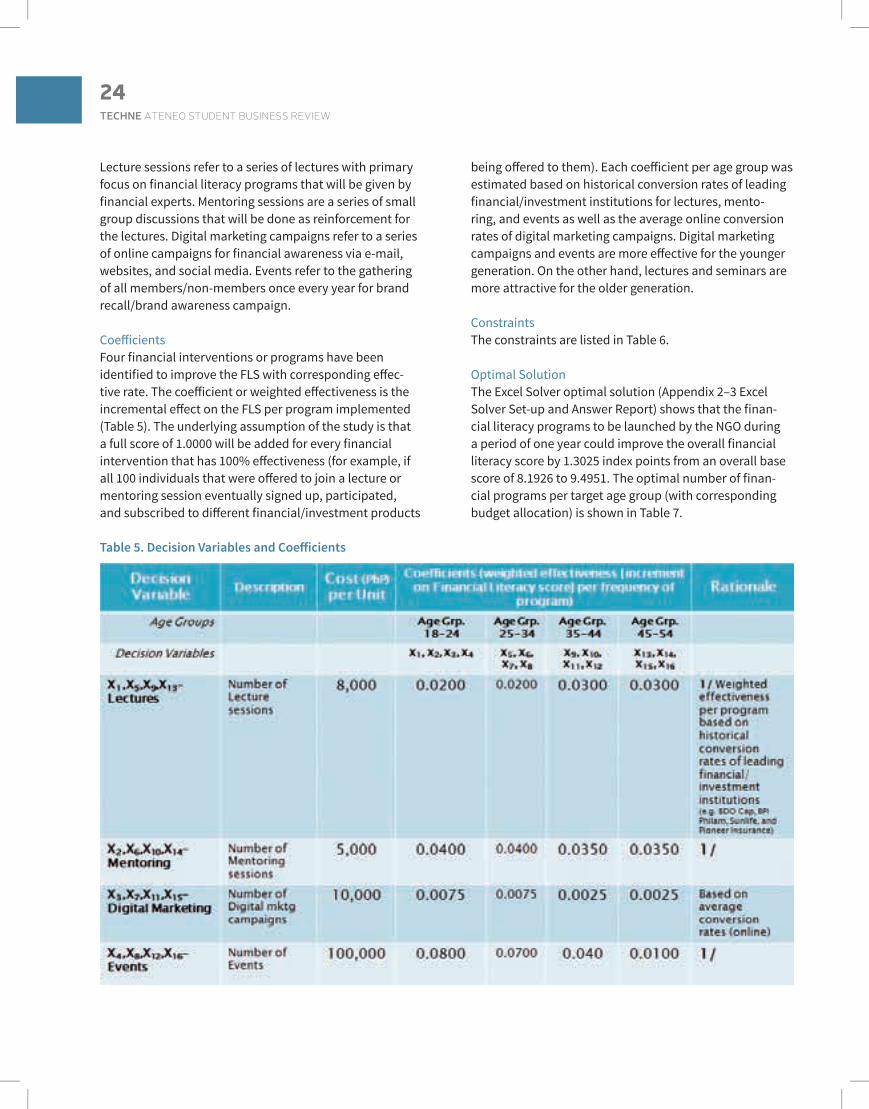
Lecture sessions refer to a series of lectures with primary focus on financial literacy programs that will be given by financial experts. Mentoring sessions are a series of small group discussions that will be done as reinforcement for the lectures. Digital marketing campaigns refer to a series of online campaigns for financial awareness via e-mail, websites, and social media. Events refer to the gathering of all members/non-members once every year for brand recall/brand awareness campaign.
CoefficientsFour financial interventions or programs have been identified to improve the FLS with corresponding effec-tive rate. The coefficient or weighted effectiveness is the incremental effect on the FLS per program implemented (Table 5). The underlying assumption of the study is that a full score of 1.0000 will be added for every financial intervention that has 100% effectiveness (for example, if all 100 individuals that were offered to join a lecture or mentoring session eventually signed up, participated, and subscribed to different financial/investment products
being offered to them). Each coefficient per age group was estimated based on historical conversion rates of leading financial/investment institutions for lectures, mento-ring, and events as well as the average online conversion rates of digital marketing campaigns. Digital marketing campaigns and events are more effective for the younger generation. On the other hand, lectures and seminars are more attractive for the older generation.
ConstraintsThe constraints are listed in Table 6.
Optimal SolutionThe Excel Solver optimal solution (Appendix 2–3 Excel Solver Set-up and Answer Report) shows that the finan-cial literacy programs to be launched by the NGO during a period of one year could improve the overall financial literacy score by 1.3025 index points from an overall base score of 8.1926 to 9.4951. The optimal number of finan-cial programs per target age group (with corresponding budget allocation) is shown in Table 7.
Table 5. Decision Variables and Coefficients

25FINANCIAL LITERACY INDEX
Table 6. List of Constraints

26TECHNE ATENEO STUDENT BUSINESS REVIEW
Table 7. Excel Solver Optimal Solution, all amounts in PHP
Table 6 (continued)

27FINANCIAL LITERACY INDEX
PERT/CPM
Based on the optimal number of financial programs provided by linear programming to jumpstart the poten-tial NGO’s objectives, a series of activities are listed below. These will be used as a road map to complete the project. They are segmented into six categories as follows:
A. Fund-raising dinner. Prospective sponsors (private companies) will be invited to a dinner presentation showcasing the mission/vision and advocacy of the NGO.
B. Request for funding from government officials. Public officials (senators and congressmen) will be engaged to subsidize the NGO’s operations expense.
C. Lecture series. A series of lectures with primary focus on financial literacy programs will be given by financial experts.
D. Mentoring sessions. A series of small group discussions will be done as reinforcement for the lectures.
E. Digital marketing. A series of online campaigns will be conducted for financial awareness via e-mail, websites, and social media.
F. Events. All members/non-members will be gathered once every year for brand recall/brand awareness campaign.
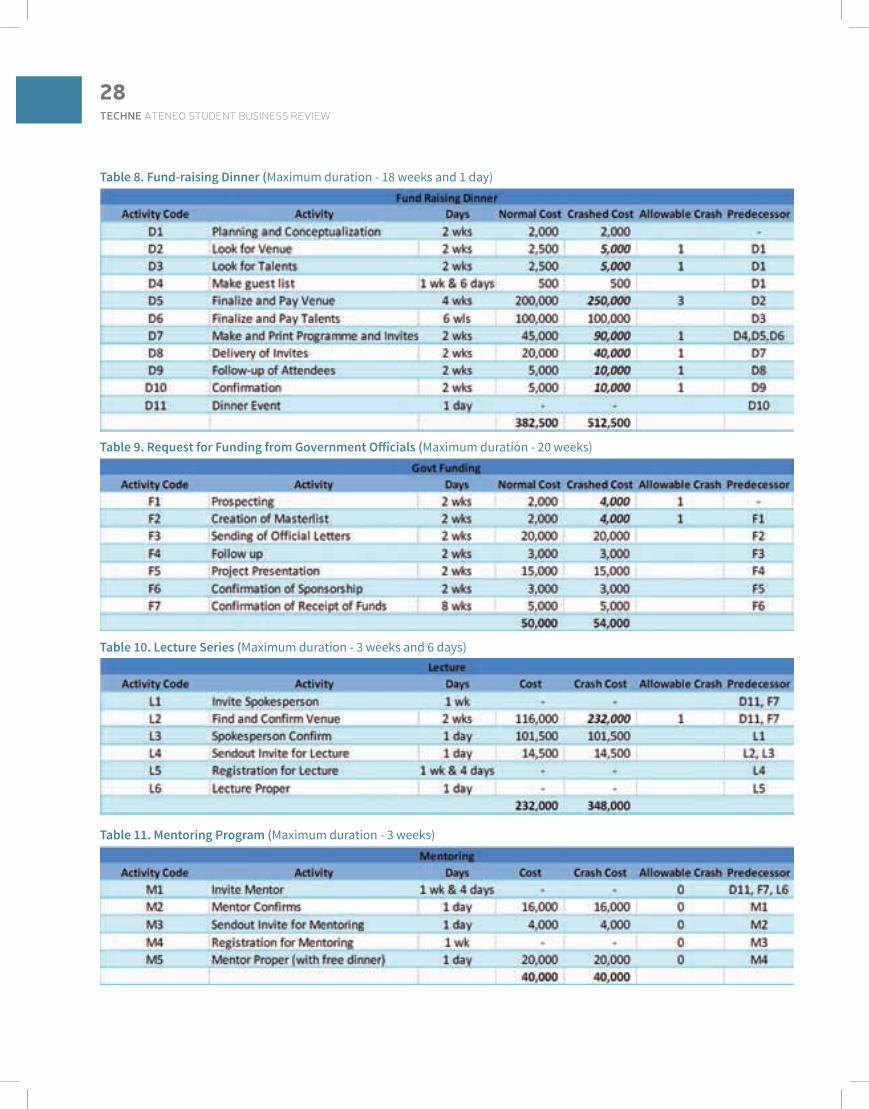
Project ActivitiesUsing PERT/CPM, all activities needed to complete each category were listed in Tables 8–13 to identify the soonest completion of the project.
Based on the network diagram (Appendix 4), there are 15 paths formed (Table 14) by the 46 activities (Tables 8–13) in the road map of the NGO’s financial literacy program. Table 14 also identifies the critical path, or the path formed by activities F1-F2-F3-F4-F5-F6-F7-E1-E2-E3-E4-E5-E6-E7-E8-E9-E10, totaling 46 weeks (around 10.7 months).
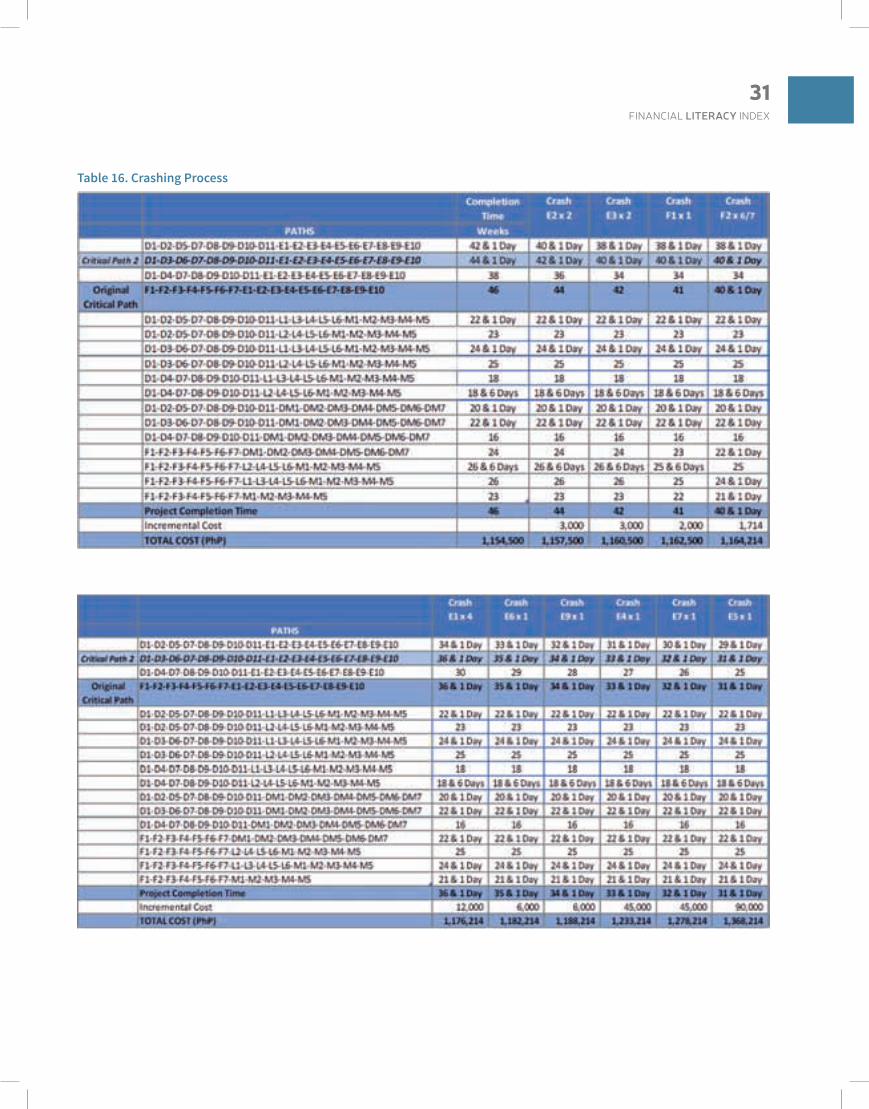
Applying regular time and costs to the project activities, the financial literacy program is expected to take around 10.7 months at a normal cost of PHP1,154,500. The next step is to crash the project time to the shortest possible duration at the least possible cost increase detailed in Table 15.
Using around six months (26 weeks) as the maximum crashing target, another critical path emerges: D1-D3-D6-D7-D8-D9-D10-D11-E1-E2-E3-E4-E5-E6-E7-E8-E9-E10, totaling 40 weeks (9.3 months). Table 16 describes the crashing process.
Furthermore, based on the crashing of 10 identified acti- vities (that can be expedited) and their dependencies, the fastest time it will take for the NGO to complete the financial literacy program (project for the first year) is 31 weeks and 1 day (7.3 months) with incremental cost of PHP213,714 (PHP1,368,214 – PHP1,154,500). Note also that the total crashed cost of PHP1,368,214 is within the maximum financial constraint of PHP1,432,500 (PHP1,000,000 is the maximum budget for the financial interventions/programs (lectures, mentoring, digital marketing, and events + PHP432,500 out-of-pocket expenses relating to dinner presentations for prospective private sponsors and request for funding from govern-ment officials).
Conclusion and Recommendation
As the Philippines continue to receive promising economic forecast until the next decades, it is imperative to improve the financial literacy of the millennials who comprise 55% of the total population. Multiple linear regression helped identify that a person’s income, educational attainment, and age are good indicators to determine a person’s finan-cial literacy. Among the three, income is the best indicator with a T-Stat of 3.13.
Linear programming was then used to determine that overall financial literacy score can be increased from 8.193 to 9.495 by having a number of financial programs (as summarized in Table 17) per age group in a period of one year.
Lastly, using PERT/CPM, 17 paths were formed by 46 acti- vities on the financial literacy program which can be fully completed after 46 weeks (around 10.7 months) which would cost a total of PHP1,154,500. However, by crashing 10 identified activities, the program can be completed as early as 31 weeks and 1 day (7.3 months) with an incre-mental cost of PHP213,714, totaling PHP1,368,214.
28TECHNE ATENEO STUDENT BUSINESS REVIEW
Table 9. Request for Funding from Government Officials (Maximum duration - 20 weeks)
Table 10. Lecture Series (Maximum duration - 3 weeks and 6 days)
Table 11. Mentoring Program (Maximum duration - 3 weeks)
Table 8. Fund-raising Dinner (Maximum duration - 18 weeks and 1 day)

29FINANCIAL LITERACY INDEX
Table 12. Digital Marketing (Maximum duration - 4 weeks)
Table 13. Events (Maximum duration - 26 weeks)
Table 14. Critical Path

30TECHNE ATENEO STUDENT BUSINESS REVIEW
Table 15. Time-Cost Trade-off
31FINANCIAL LITERACY INDEX
Table 16. Crashing Process

32TECHNE ATENEO STUDENT BUSINESS REVIEW
Table 17. Proposed Financial Progress
Bibliography Bangko Sentral ng Pilipinas - Department of Economic Statistics, 2012. 2009 Consumer Finance Survey. http://www.bsp.gov.ph/downloads/Publications/2012/CFS_2012.pdf
Chen, S. 2013. “Why Financial Literacy Matters: Students must be able to Make Sound, Informed Fiscal Decisions.” The Daily Californian: February 18, 2013. http://www.dailycal.org/2013/02/19/why-financial-literacy-matters/.
Loresco, S. 2013. “How Do Filipinos Rank in Financial Literacy?” Rappler, July 16, 2013. http://www.rappler.com/business/features/33944-how-do-filipinos-rank-in-financial-literacy.
Lusardi, A., and O. S. Mitchell. 2014. “The Economic Importance of Financial Literacy: Theory and Evidences.” Journal of Economic Literature, American Economic Association 52(1): 5–44.
Lusardi, A., and O. S. Mitchell. 2011a. “The Outlook for Financial Literacy.” In Financial Literacy: Implications for Retirement Security and the Financial Marketplace, edited by O. S. Mitchell and A. Lusardi, 1–15. Oxford: Oxford University Press.
Lusardi, A., and O. S. Mitchell. 2011b. “Financial Literacy and Planning: Implications for Retirement Wellbeing.” In Financial Literacy: Implications for Retirement Security and the Financial Marketplace. Edited by O. S. Mitchell and A. Lusardi, 17–39. Oxford: Oxford University Press.
Lusardi, A., and O. S. Mitchell. 2011c. “Financial Literacy around the World: An Overview.” Journal of Pension Economics and Finance 10(4): 497–508.
Lusardi, A. and O. S. Mitchell. 2011d. “Financial Literacy and Retirement Planning in the United States.” Journal of Pension Economics and Finance 10(4): 509–525.
Money Summit & Wealth Expo. 2012. Less than 1% of Filipino Households Invests in Securities. http://money-summit.com/less-than-1-of-filipino-households-invests-in-securities/.
Tandoc, E., Jr. 2012. “Do the Math: Why Filipino Students Don’t Fit the Asian Stereotype.” Philippine Daily Inquirer: August 5, 2012. http://global-nation.inquirer.net/46423/do-the-math-why-filipino-students-dont-fi the-asian stereotype#ixzz3rjBL8300.
The mode of survey used in this study was through Google forms. It is thus recommend that further studies be done using traditional forms of data gathering to reach a broader population, especially those without an internet connection.
Moreover, requiring the exact age of the respondents would be highly beneficial to have a more accurate linear regression model. Researchers who will conduct further studies may also look into other variables that they deem important to predict and increase financial literacy of Filipinos.
33FINANCIAL LITERACY INDEX
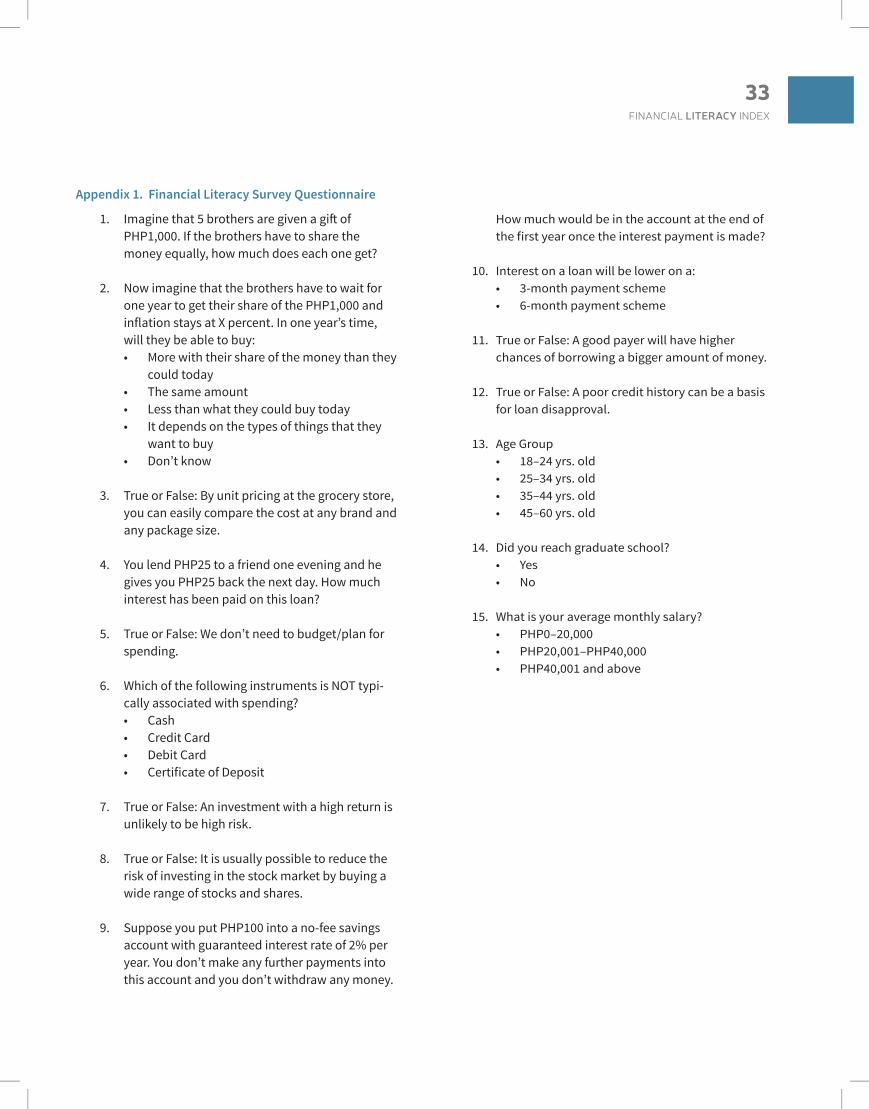
Appendix 1. Financial Literacy Survey Questionnaire
1. Imagine that 5 brothers are given a gift of PHP1,000. If the brothers have to share the money equally, how much does each one get?
2. Now imagine that the brothers have to wait for one year to get their share of the PHP1,000 and inflation stays at X percent. In one year’s time, will they be able to buy:• More with their share of the money than they
could today • The same amount • Less than what they could buy today • It depends on the types of things that they
want to buy • Don’t know
3. True or False: By unit pricing at the grocery store, you can easily compare the cost at any brand and any package size.
4. You lend PHP25 to a friend one evening and he gives you PHP25 back the next day. How much interest has been paid on this loan?
5. True or False: We don’t need to budget/plan for spending.
6. Which of the following instruments is NOT typi-cally associated with spending?• Cash • Credit Card • Debit Card • Certificate of Deposit
7. True or False: An investment with a high return is unlikely to be high risk.
8. True or False: It is usually possible to reduce the risk of investing in the stock market by buying a wide range of stocks and shares.
9. Suppose you put PHP100 into a no-fee savings account with guaranteed interest rate of 2% per year. You don’t make any further payments into this account and you don’t withdraw any money.
How much would be in the account at the end of the first year once the interest payment is made?
10. Interest on a loan will be lower on a:• 3-month payment scheme • 6-month payment scheme
11. True or False: A good payer will have higher chances of borrowing a bigger amount of money.
12. True or False: A poor credit history can be a basis for loan disapproval.
13. Age Group• 18–24 yrs. old• 25–34 yrs. old• 35–44 yrs. old• 45–60 yrs. old
14. Did you reach graduate school?• Yes• No
15. What is your average monthly salary?• PHP0–20,000• PHP20,001–PHP40,000• PHP40,001 and above

34TECHNE ATENEO STUDENT BUSINESS REVIEW
Appendix 2. Excel Solver Set-up

35FINANCIAL LITERACY INDEX

36TECHNE ATENEO STUDENT BUSINESS REVIEW
Appendix 3. Excel Solver Answer Report
Appendix 4. Network Diagram

37FINANCIAL LITERACY INDEX
Appendix 3. Excel Solver Answer Report (continued)
38TECHNE ATENEO STUDENT BUSINESS REVIEW
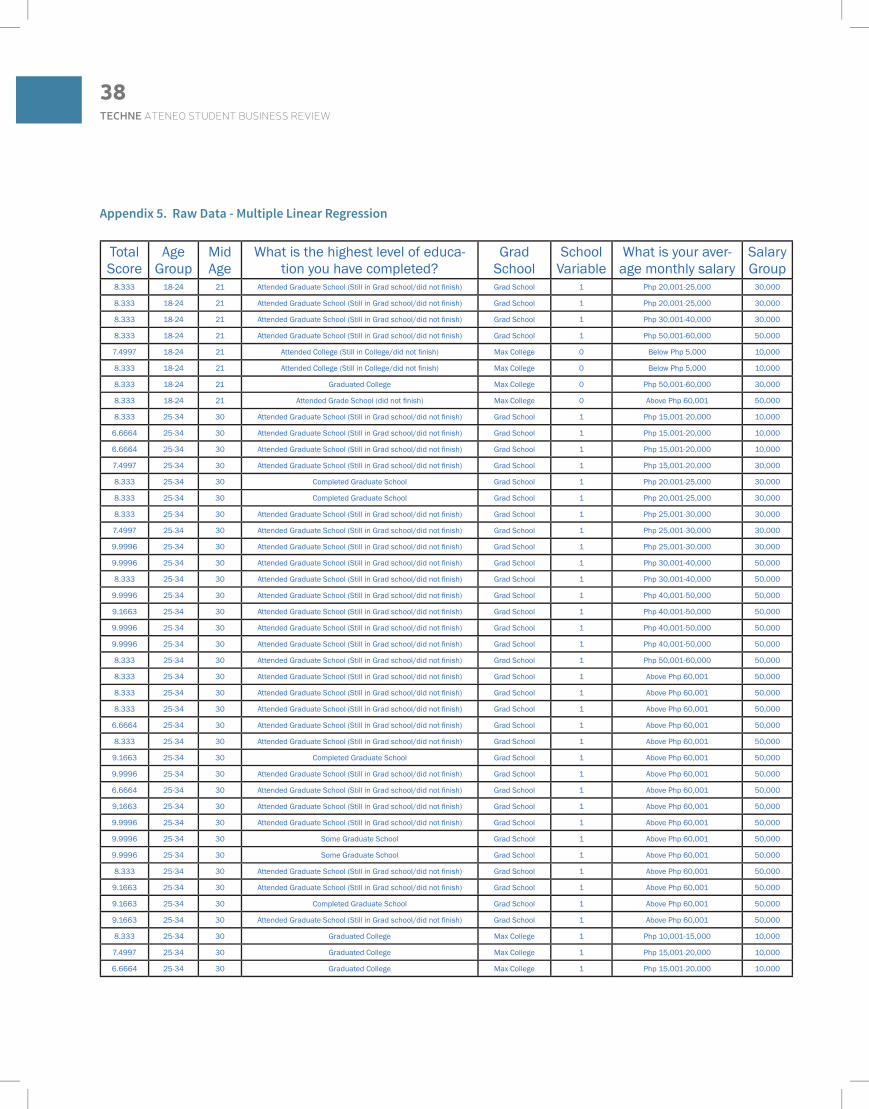
Appendix 5. Raw Data - Multiple Linear Regression
Total Score
Age Group
Mid Age
What is the highest level of educa-tion you have completed?
Grad School
School Variable
What is your aver-age monthly salary
Salary Group
8.333 18-24 21 Attended Graduate School (Still in Grad school/did not finish) Grad School 1 Php 20,001-25,000 30,000
8.333 18-24 21 Attended Graduate School (Still in Grad school/did not finish) Grad School 1 Php 20,001-25,000 30,000
8.333 18-24 21 Attended Graduate School (Still in Grad school/did not finish) Grad School 1 Php 30,001-40,000 30,000
8.333 18-24 21 Attended Graduate School (Still in Grad school/did not finish) Grad School 1 Php 50,001-60,000 50,000
7.4997 18-24 21 Attended College (Still in College/did not finish) Max College 0 Below Php 5,000 10,000
8.333 18-24 21 Attended College (Still in College/did not finish) Max College 0 Below Php 5,000 10,000
8.333 18-24 21 Graduated College Max College 0 Php 50,001-60,000 30,000
8.333 18-24 21 Attended Grade School (did not finish) Max College 0 Above Php 60,001 50,000
8.333 25-34 30 Attended Graduate School (Still in Grad school/did not finish) Grad School 1 Php 15,001-20,000 10,000
6.6664 25-34 30 Attended Graduate School (Still in Grad school/did not finish) Grad School 1 Php 15,001-20,000 10,000
6.6664 25-34 30 Attended Graduate School (Still in Grad school/did not finish) Grad School 1 Php 15,001-20,000 10,000
7.4997 25-34 30 Attended Graduate School (Still in Grad school/did not finish) Grad School 1 Php 15,001-20,000 30,000
8.333 25-34 30 Completed Graduate School Grad School 1 Php 20,001-25,000 30,000
8.333 25-34 30 Completed Graduate School Grad School 1 Php 20,001-25,000 30,000
8.333 25-34 30 Attended Graduate School (Still in Grad school/did not finish) Grad School 1 Php 25,001-30,000 30,000
7.4997 25-34 30 Attended Graduate School (Still in Grad school/did not finish) Grad School 1 Php 25,001-30,000 30,000
9.9996 25-34 30 Attended Graduate School (Still in Grad school/did not finish) Grad School 1 Php 25,001-30,000 30,000
9.9996 25-34 30 Attended Graduate School (Still in Grad school/did not finish) Grad School 1 Php 30,001-40,000 50,000
8.333 25-34 30 Attended Graduate School (Still in Grad school/did not finish) Grad School 1 Php 30,001-40,000 50,000
9.9996 25-34 30 Attended Graduate School (Still in Grad school/did not finish) Grad School 1 Php 40,001-50,000 50,000
9.1663 25-34 30 Attended Graduate School (Still in Grad school/did not finish) Grad School 1 Php 40,001-50,000 50,000
9.9996 25-34 30 Attended Graduate School (Still in Grad school/did not finish) Grad School 1 Php 40,001-50,000 50,000
9.9996 25-34 30 Attended Graduate School (Still in Grad school/did not finish) Grad School 1 Php 40,001-50,000 50,000
8.333 25-34 30 Attended Graduate School (Still in Grad school/did not finish) Grad School 1 Php 50,001-60,000 50,000
8.333 25-34 30 Attended Graduate School (Still in Grad school/did not finish) Grad School 1 Above Php 60,001 50,000
8.333 25-34 30 Attended Graduate School (Still in Grad school/did not finish) Grad School 1 Above Php 60,001 50,000
8.333 25-34 30 Attended Graduate School (Still in Grad school/did not finish) Grad School 1 Above Php 60,001 50,000
6.6664 25-34 30 Attended Graduate School (Still in Grad school/did not finish) Grad School 1 Above Php 60,001 50,000
8.333 25-34 30 Attended Graduate School (Still in Grad school/did not finish) Grad School 1 Above Php 60,001 50,000
9.1663 25-34 30 Completed Graduate School Grad School 1 Above Php 60,001 50,000
9.9996 25-34 30 Attended Graduate School (Still in Grad school/did not finish) Grad School 1 Above Php 60,001 50,000
6.6664 25-34 30 Attended Graduate School (Still in Grad school/did not finish) Grad School 1 Above Php 60,001 50,000
9,1663 25-34 30 Attended Graduate School (Still in Grad school/did not finish) Grad School 1 Above Php 60,001 50,000
9.9996 25-34 30 Attended Graduate School (Still in Grad school/did not finish) Grad School 1 Above Php 60,001 50,000
9.9996 25-34 30 Some Graduate School Grad School 1 Above Php 60,001 50,000
9.9996 25-34 30 Some Graduate School Grad School 1 Above Php 60,001 50,000
8.333 25-34 30 Attended Graduate School (Still in Grad school/did not finish) Grad School 1 Above Php 60,001 50,000
9.1663 25-34 30 Attended Graduate School (Still in Grad school/did not finish) Grad School 1 Above Php 60,001 50,000
9.1663 25-34 30 Completed Graduate School Grad School 1 Above Php 60,001 50,000
9.1663 25-34 30 Attended Graduate School (Still in Grad school/did not finish) Grad School 1 Above Php 60,001 50,000
8.333 25-34 30 Graduated College Max College 1 Php 10,001-15,000 10,000
7.4997 25-34 30 Graduated College Max College 1 Php 15,001-20,000 10,000
6.6664 25-34 30 Graduated College Max College 1 Php 15,001-20,000 10,000
39FINANCIAL LITERACY INDEX
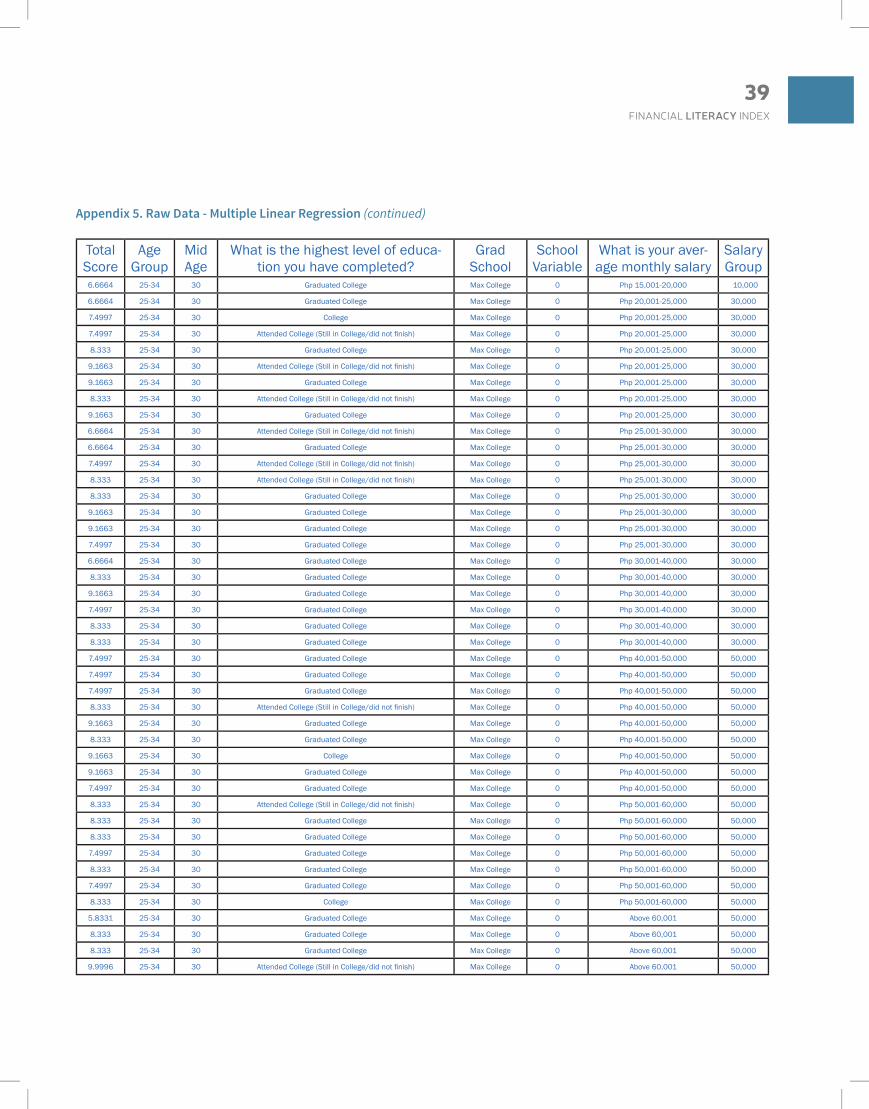
Appendix 5. Raw Data - Multiple Linear Regression (continued)
Total Score
Age Group
Mid Age
What is the highest level of educa-tion you have completed?
Grad School
School Variable
What is your aver-age monthly salary
Salary Group
6.6664 25-34 30 Graduated College Max College 0 Php 15,001-20,000 10,000
6.6664 25-34 30 Graduated College Max College 0 Php 20,001-25,000 30,000
7.4997 25-34 30 College Max College 0 Php 20,001-25,000 30,000
7.4997 25-34 30 Attended College (Still in College/did not finish) Max College 0 Php 20,001-25,000 30,000
8.333 25-34 30 Graduated College Max College 0 Php 20,001-25,000 30,000
9.1663 25-34 30 Attended College (Still in College/did not finish) Max College 0 Php 20,001-25,000 30,000
9.1663 25-34 30 Graduated College Max College 0 Php 20,001-25,000 30,000
8.333 25-34 30 Attended College (Still in College/did not finish) Max College 0 Php 20,001-25,000 30,000
9.1663 25-34 30 Graduated College Max College 0 Php 20,001-25,000 30,000
6.6664 25-34 30 Attended College (Still in College/did not finish) Max College 0 Php 25,001-30,000 30,000
6.6664 25-34 30 Graduated College Max College 0 Php 25,001-30,000 30,000
7.4997 25-34 30 Attended College (Still in College/did not finish) Max College 0 Php 25,001-30,000 30,000
8.333 25-34 30 Attended College (Still in College/did not finish) Max College 0 Php 25,001-30,000 30,000
8.333 25-34 30 Graduated College Max College 0 Php 25,001-30,000 30,000
9.1663 25-34 30 Graduated College Max College 0 Php 25,001-30,000 30,000
9.1663 25-34 30 Graduated College Max College 0 Php 25,001-30,000 30,000
7.4997 25-34 30 Graduated College Max College 0 Php 25,001-30,000 30,000
6.6664 25-34 30 Graduated College Max College 0 Php 30,001-40,000 30,000
8.333 25-34 30 Graduated College Max College 0 Php 30,001-40,000 30,000
9.1663 25-34 30 Graduated College Max College 0 Php 30,001-40,000 30,000
7.4997 25-34 30 Graduated College Max College 0 Php 30,001-40,000 30,000
8.333 25-34 30 Graduated College Max College 0 Php 30,001-40,000 30,000
8.333 25-34 30 Graduated College Max College 0 Php 30,001-40,000 30,000
7.4997 25-34 30 Graduated College Max College 0 Php 40,001-50,000 50,000
7.4997 25-34 30 Graduated College Max College 0 Php 40,001-50,000 50,000
7.4997 25-34 30 Graduated College Max College 0 Php 40,001-50,000 50,000
8.333 25-34 30 Attended College (Still in College/did not finish) Max College 0 Php 40,001-50,000 50,000
9.1663 25-34 30 Graduated College Max College 0 Php 40,001-50,000 50,000
8.333 25-34 30 Graduated College Max College 0 Php 40,001-50,000 50,000
9.1663 25-34 30 College Max College 0 Php 40,001-50,000 50,000
9.1663 25-34 30 Graduated College Max College 0 Php 40,001-50,000 50,000
7.4997 25-34 30 Graduated College Max College 0 Php 40,001-50,000 50,000
8.333 25-34 30 Attended College (Still in College/did not finish) Max College 0 Php 50,001-60,000 50,000
8.333 25-34 30 Graduated College Max College 0 Php 50,001-60,000 50,000
8.333 25-34 30 Graduated College Max College 0 Php 50,001-60,000 50,000
7.4997 25-34 30 Graduated College Max College 0 Php 50,001-60,000 50,000
8.333 25-34 30 Graduated College Max College 0 Php 50,001-60,000 50,000
7.4997 25-34 30 Graduated College Max College 0 Php 50,001-60,000 50,000
8.333 25-34 30 College Max College 0 Php 50,001-60,000 50,000
5.8331 25-34 30 Graduated College Max College 0 Above 60,001 50,000
8.333 25-34 30 Graduated College Max College 0 Above 60,001 50,000
8.333 25-34 30 Graduated College Max College 0 Above 60,001 50,000
9.9996 25-34 30 Attended College (Still in College/did not finish) Max College 0 Above 60,001 50,000
40TECHNE ATENEO STUDENT BUSINESS REVIEW
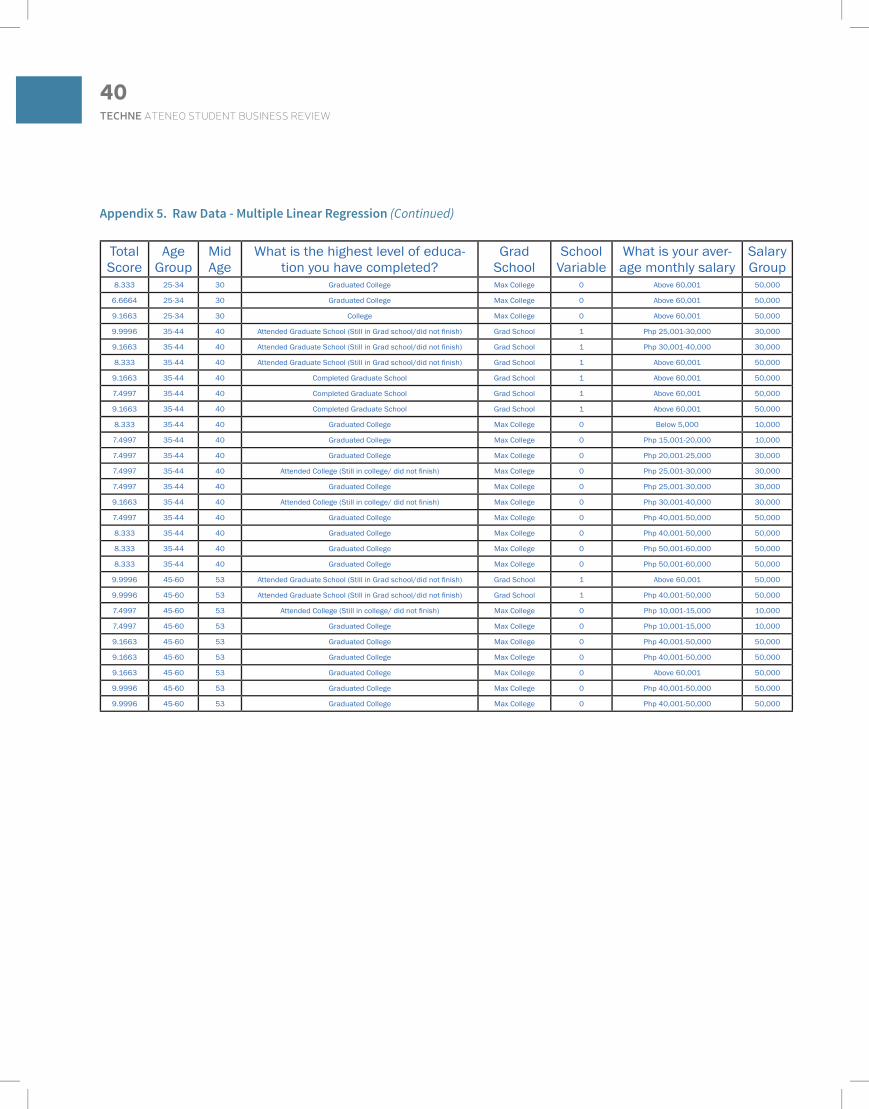
Appendix 5. Raw Data - Multiple Linear Regression (Continued)
Total Score
Age Group
Mid Age
What is the highest level of educa-tion you have completed?
Grad School
School Variable
What is your aver-age monthly salary
Salary Group
8.333 25-34 30 Graduated College Max College 0 Above 60,001 50,000
6.6664 25-34 30 Graduated College Max College 0 Above 60,001 50,000
9.1663 25-34 30 College Max College 0 Above 60,001 50,000
9.9996 35-44 40 Attended Graduate School (Still in Grad school/did not finish) Grad School 1 Php 25,001-30,000 30,000
9.1663 35-44 40 Attended Graduate School (Still in Grad school/did not finish) Grad School 1 Php 30,001-40,000 30,000
8.333 35-44 40 Attended Graduate School (Still in Grad school/did not finish) Grad School 1 Above 60,001 50,000
9.1663 35-44 40 Completed Graduate School Grad School 1 Above 60,001 50,000
7.4997 35-44 40 Completed Graduate School Grad School 1 Above 60,001 50,000
9.1663 35-44 40 Completed Graduate School Grad School 1 Above 60,001 50,000
8.333 35-44 40 Graduated College Max College 0 Below 5,000 10,000
7.4997 35-44 40 Graduated College Max College 0 Php 15,001-20,000 10,000
7.4997 35-44 40 Graduated College Max College 0 Php 20,001-25,000 30,000
7.4997 35-44 40 Attended College (Still in college/ did not finish) Max College 0 Php 25,001-30,000 30,000
7.4997 35-44 40 Graduated College Max College 0 Php 25,001-30,000 30,000
9.1663 35-44 40 Attended College (Still in college/ did not finish) Max College 0 Php 30,001-40,000 30,000
7.4997 35-44 40 Graduated College Max College 0 Php 40,001-50,000 50,000
8.333 35-44 40 Graduated College Max College 0 Php 40,001-50,000 50,000
8.333 35-44 40 Graduated College Max College 0 Php 50,001-60,000 50,000
8.333 35-44 40 Graduated College Max College 0 Php 50,001-60,000 50,000
9.9996 45-60 53 Attended Graduate School (Still in Grad school/did not finish) Grad School 1 Above 60,001 50,000
9.9996 45-60 53 Attended Graduate School (Still in Grad school/did not finish) Grad School 1 Php 40,001-50,000 50,000
7.4997 45-60 53 Attended College (Still in college/ did not finish) Max College 0 Php 10,001-15,000 10,000
7.4997 45-60 53 Graduated College Max College 0 Php 10,001-15,000 10,000
9.1663 45-60 53 Graduated College Max College 0 Php 40,001-50,000 50,000
9.1663 45-60 53 Graduated College Max College 0 Php 40,001-50,000 50,000
9.1663 45-60 53 Graduated College Max College 0 Above 60,001 50,000
9.9996 45-60 53 Graduated College Max College 0 Php 40,001-50,000 50,000
9.9996 45-60 53 Graduated College Max College 0 Php 40,001-50,000 50,000

41FINANCIAL LITERACY INDEX

About the Company
Its vision is “Bring Light to Life.”
Emerged from NSG’s (Nippon Sheet Glass) Telecommunication Device (TD) business, Go!Foton is a global photonics company with a strong presence in the optical communications industry. Go!Foton’s operations include facilities in the US, Europe, Japan, China, and the Philippines. The Philippine facility is called GF Micro Optics Philippines, Inc.
GF Micro Optics Philippines, Inc. is engaged in the design and manufacture of materials, components, and devices for fiber optics telecommunication. The company is an export-oriented entity, which is under the jurisdiction of the Philippine Economic Zone Authority (PEZA). The facility is located inside Laguna Technopark in Biñan, Laguna.
After the management buyout of NSG Telecommunication Division (TD) business, Go!Foton became the exclusive distributor of SELFOC Micro Lens products for the optical
Optimizing Capacity
Errol Stanley P. Bitera
43OPTIMIZING CAPACITY
communications market worldwide. By building on NSG’s material and manufacturing expertise, Go!Foton extended its leadership role by introducing Original Opti-Sourcing™. This program delivers custom solutions to enhance quality, minimize risk, and drive down cost to allow customers/partners to focus on what they do best. Go!Foton has evolved from a conventional materials supplier into a full service micro-optics solution provider.
Go!Foton uses Original Opti-Sourcing™ as a service to offer manufacturing capabilities to its customers in the optical communications market together with the company’s design and development capabilities in micro optics. By utilizing NSG Group’s and Go!Foton’s vast global resources, customers have access to Go!Foton’s “One-Stop-Shop” for all their optical component manufacturing needs.
Go!Foton complements its “Original” optical designs with specialized technology procured through partnerships with key industry leaders in areas such as thin film coating, fiber interface modules for PON technology, and other unique technologies. This approach enables Go!Foton to offer a comprehensive “tool box” of component solutions in areas such as broadband FTTx and PON networking, both high growth optical industries in today’s marketplace.
Introduction to the Problem
As Go!Foton’s global manufacturing arm, GF Micro Optics Philippines operates several product lines. Capacity planning is conducted every month but no mathematical models are being used to determine the capacity allocation and quantity needed for inventory production. The Planner only makes estimates usually based on the previous month’s order quantity. Obviously, the current method of capacity allocation planning and inventory production planning does not determine the optimum quantity for stocking inventory and the optimal product mix that will maximize profit.
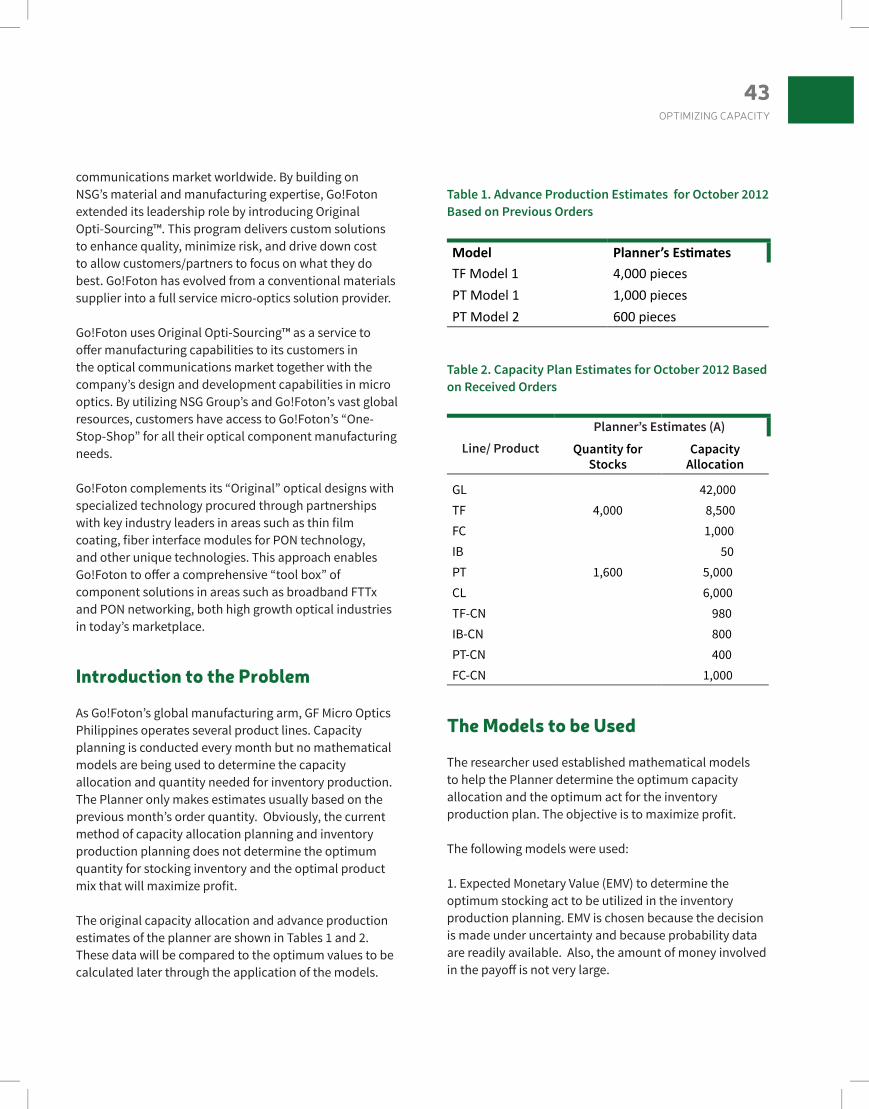
The original capacity allocation and advance production estimates of the planner are shown in Tables 1 and 2. These data will be compared to the optimum values to be calculated later through the application of the models.
Table 1. Advance Production Estimates for October 2012 Based on Previous Orders
Model Planner’s EstimatesTF Model 1 4,000 piecesPT Model 1 1,000 piecesPT Model 2 600 pieces
Table 2. Capacity Plan Estimates for October 2012 Based on Received Orders
Planner’s Estimates (A)Line/ Product Quantity for
StocksCapacity
Allocation
GL 42,000TF 4,000 8,500FC 1,000IB 50PT 1,600 5,000CL 6,000TF-CN 980IB-CN 800PT-CN 400FC-CN 1,000
The Models to be Used
The researcher used established mathematical models to help the Planner determine the optimum capacity allocation and the optimum act for the inventory production plan. The objective is to maximize profit.
The following models were used:
1. Expected Monetary Value (EMV) to determine the optimum stocking act to be utilized in the inventory production planning. EMV is chosen because the decision is made under uncertainty and because probability data are readily available. Also, the amount of money involved in the payoff is not very large.

44TECHNE ATENEO STUDENT BUSINESS REVIEW
2. Linear Programming (LP) model to determine the optimal product mix to be used to decide the capacity allocation. The LP model was chosen because the decision problem is very complex.
Data Source
Table 3 shows the sources of the data used in this study.
Table 3. Table of Data Source Data Units Source Months
Product Demand pieces/month PPMC 22Model Demand pieces/month PPMC 22Line Capacity pieces/month PPMC 22Sales $ Acct. 22Selling Price $/piece Acct. 22Product Cost $/piece Acct. 22Holding Cost $/piece Acct. 22
Application of the Model
Table 4. Product and Line DetailsProduct/ Line Selling Price ($) Total Production Cost of
Finished Goods Directly Sold to Market ($)
Product Cost When Used by Other Product Lines (as semi-finished goods), Also Called as Transfer
Cost ($)
Capacity (pieces)
GL 3.78 0.85 0.40 125,000
TF 34.70 21.00 10.50 18,000
FC 25.30 19.00 7.00 2,500
IB 305.00 207.00 180.00 1,600
PT 29.50 17.60 15.00 4,955
CL 32.79 16.00 11.00 6,270
TF-CN 41.50 25.50 NA
IB-CN 375.00 219.00 NA
PT-CN 34.50 20.60 NA
FC-CN 32.38 23.50 NA
CN 14,500
PL 60,000
The data for selling price, production cost, and line capacity are shown in Table 4. The process flow and the relationship of each product line are shown in Figure 1.
Note: Total Product Cost = (Transfer Cost of Semi-finished Goods x No. of Units Used) + Cost of New Materials Added + Labor + Overhead
45OPTIMIZING CAPACITY
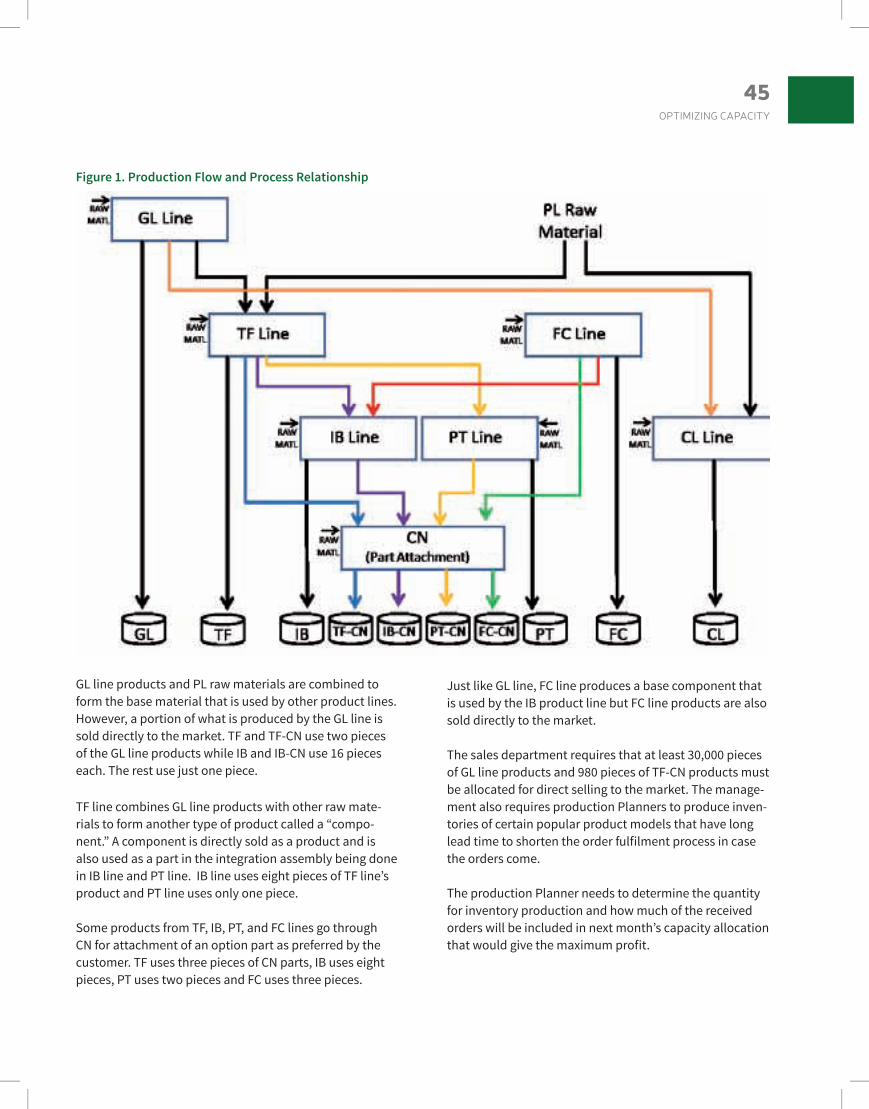
GL line products and PL raw materials are combined to form the base material that is used by other product lines. However, a portion of what is produced by the GL line is sold directly to the market. TF and TF-CN use two pieces of the GL line products while IB and IB-CN use 16 pieces each. The rest use just one piece.
TF line combines GL line products with other raw mate-rials to form another type of product called a “compo-nent.” A component is directly sold as a product and is also used as a part in the integration assembly being done in IB line and PT line. IB line uses eight pieces of TF line’s product and PT line uses only one piece.
Some products from TF, IB, PT, and FC lines go through CN for attachment of an option part as preferred by the customer. TF uses three pieces of CN parts, IB uses eight pieces, PT uses two pieces and FC uses three pieces.
Just like GL line, FC line produces a base component that is used by the IB product line but FC line products are also sold directly to the market.
The sales department requires that at least 30,000 pieces of GL line products and 980 pieces of TF-CN products must be allocated for direct selling to the market. The manage-ment also requires production Planners to produce inven-tories of certain popular product models that have long lead time to shorten the order fulfilment process in case the orders come.
The production Planner needs to determine the quantity for inventory production and how much of the received orders will be included in next month’s capacity allocation that would give the maximum profit.
Figure 1. Production Flow and Process Relationship
46TECHNE ATENEO STUDENT BUSINESS REVIEW
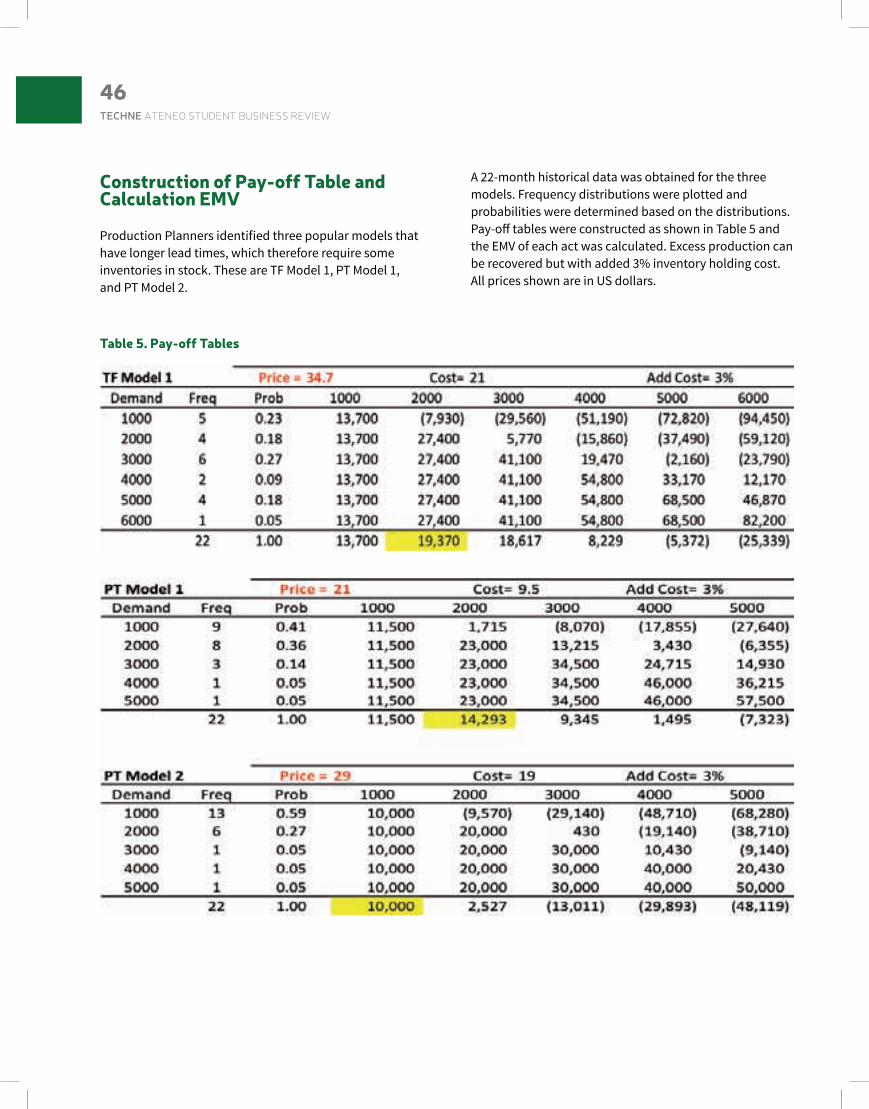
Construction of Pay-off Table and Calculation EMV
Production Planners identifi ed three popular models that have longer lead times, which therefore require some inventories in stock. These are TF Model 1, PT Model 1, and PT Model 2.
A 22-month historical data was obtained for the three models. Frequency distributions were plotted and probabilities were determined based on the distributions. Pay-off tables were constructed as shown in Table 5 and the EMV of each act was calculated. Excess production can be recovered but with added 3% inventory holding cost. All prices shown are in US dollars.
Table 5. Pay-off Tables

47OPTIMIZING CAPACITY
Formulation of Linear Programming and Solver Solution
Formulations of equations for linear programming were based on Figure 1. The objective is to determine
the optimum product-mix that will maximize profit. All constraints are defined by production Planners including sales policy constraints. The complete Excel Solver results are entered as attachments 1 to 3.

48TECHNE ATENEO STUDENT BUSINESS REVIEW
Analysis and Interpretation of Results
1. The optimum act is the act with the greatest Expected Monetary Value (EMV), and thus the smallest expected opportunity loss. A summary is shown in Table 6. A Comparison of the results of EMV calculation against the original estimation made by the planner on the quantity for inventory production is also shown.
2. The solution of this linear programming gives the optimum (maximum profit) capacity allocation for the company. A summary is shown in Table 7. A comparison of the results of linear programming against the original estimation made by the Planner is also shown.
If the Planner’s original estimation is used, some pro-ducts are over allocated and some are under allocated. The Planner gave priority to some low-profit products like
Table 6. EMV Comparison
Model Planner’s Estimation EMV Impact TF Model 4,000 2,000 Over productionPT Model 1 1,000 2,000 Opportunity LossPT Model 2 1,000 1,000 Opportunity Loss
Table 7. LP Solution Summary
Line/ Product
Planner’s Estimate (A)LP Solution (pieces) (B)
Difference (A minus B) RemarksQty for Stocks
Capacity Allocation
GL 42,000 67,455 (25,455) not maximizedTF 4,000 8,500 10,620 1,880 over allocatedFC 1,000 1,055 (55)IB 50 50 deferPT 1,600 5,000 4,955 1,645 over allocatedCL 6,000 6,270 (270)
TF-CN 980 980 (0)IB-CN 800 1,445 (645) under allocatedPT-CN 400 400 deferFC-CN 1,000 1,000 defer
TF and PT instead of high-profit products like IB-CN. GL production is also not maximized. If the original plan of allocation will be used, the potential maximum profit of USD742,312.85 for next month will not be achieved. The original Planner’s allocation will only generate a profit of USD626,901.40. Using Linear Programming, additional revenue of USD115,411.45 or PHP4,847,280.00 will be generated.

49OPTIMIZING CAPACITY
Recommendation/ConclusionEMV and LP models are useful for planning advance pro-duction and capacity allocation. It is recommended that the results from the models be used as a guide to decide on which customer product order will be prioritized. The sensitivity report serves as guide on which constraint to increase or decrease.
Utilize EMV in determining the optimum stocking act to be utilized in inventory production.
Utilize linear programming in determining the optimum product mix for capacity allocation.
However, in making projections, care must be taken so as not to treat either inventory or product mix in isola-tion. Conventional wisdom still holds that inventory is a function of demand, meaning, a manufacturer should
not produce or put to stock more than what it can sell. So, where practical or necessary, it helps to use models like EMV and linear programming, or other mathematical tools, in combination.
ReferencesBonini, C.P., Hausman, W.H. & Bierman, H. (1997). Quanti-tative Analysis for Management. Boston: McGraw-Hill.
Verizon Wireless. (2010). Verizon Network Planning Flash, NP-FL-2010-015
Go!Foton (2009). Corporate Strategy. Retrieved from http://www.gofoton.com/company/ corporate_strategy.html
GL TF FC IB PT CL TF-CN IB-CN PT-CN FT-CN
Decision Variables 67455 10620 1055 0 4955 6270 980 1445 0 0Total Profit
Objective Function 2.93 13.7 6.3 98 11.9 16.79 2.93 156 13.9 8.88 742,321.85
Constraints Slack
GL Line Capacity Constraint 1 2 16 1 1 2 16 1 125000 ≤ 125000 2.50389E-06
TF Line Capacity Constraint 1 8 1 1 1 1 18000 ≤ 18000 -4.19459E-08
FC Line Capacity Constraint 1 1 1 2500 ≤ 2500 -5.8194E-09
IB Line Capacity Constraint 1 1 1445 ≤ 1600 155
PT Line Capacity Constraint 1 1 4955 ≤ 4955 -1.15433E-08
CL Line Capacity Constraint 1 6270 ≤ 6270 -6.90306E-10
CN Line Capacity Constraint 3 8 2 3 14500 ≤ 14500 -3.37568E-08
PL Line Capacity Constraints 2 16 1 1 2 16 1 57545≤ 60,000 2455
GL Product Sales Constraints 1 1 67,455 ≥ 30,000 37,455
TF-CN Product Sales-Constraints
1 980 ≥ 900 1.0777SE-10
Attachment 1
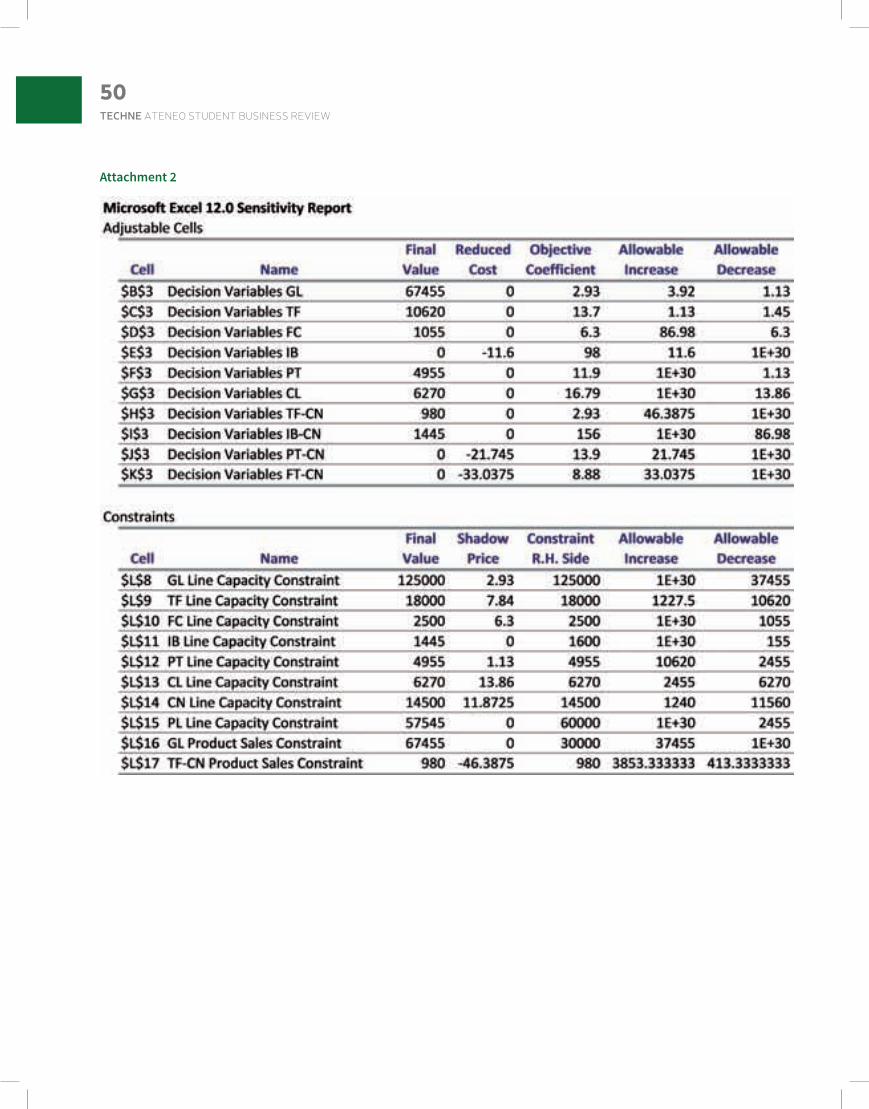
50TECHNE ATENEO STUDENT BUSINESS REVIEW
Attachment 2

51OPTIMIZING CAPACITY
Attachment 3

The era of technological advancement brings forth a wide array of electronic learning tools and resources. Probably every person in the civilized world older than seven years has heard of the words Google, Yahoo, and YouTube. Yet, these very same youngsters are likely still striving to learn how to read and write. While the world wide web is easily accessible (based on Nielsen’s report in 2011, about 1 in 3 Filipinos use the Internet despite the Philippines having one of the slowest average connection speed across the world), the same cannot be said about regular access to books and other reading materials.
Speaking at the launch of the Library Locator Map in June 2014, Education Secretary Bro. Armin Luistro highlighted the important role of stakeholders in ensuring that each child has access to books. This is made easier if the child knows where a library is located, and has access to it, which can foster his love for reading.1
1 Source: Official Gazette, Department of Education. (2014, June 27). DepEd Launches the Library Locator Map in Public Schools. Retrieved June 9, 2015 from http://www.gov.ph/2014/06/27/deped-launches-library-locator-map-in-public-schools/.
Silid-Aklatan Para Kay Juan
Chickie LaurenteGay Arles
Jhoana PascuaMek Bondoc
Jody James PadlanVinz Racelis
Juliet Biglang-AwaAndree Silvestre
Carla AmadoAr Jacosalem
Frank AstorPicci Posadas
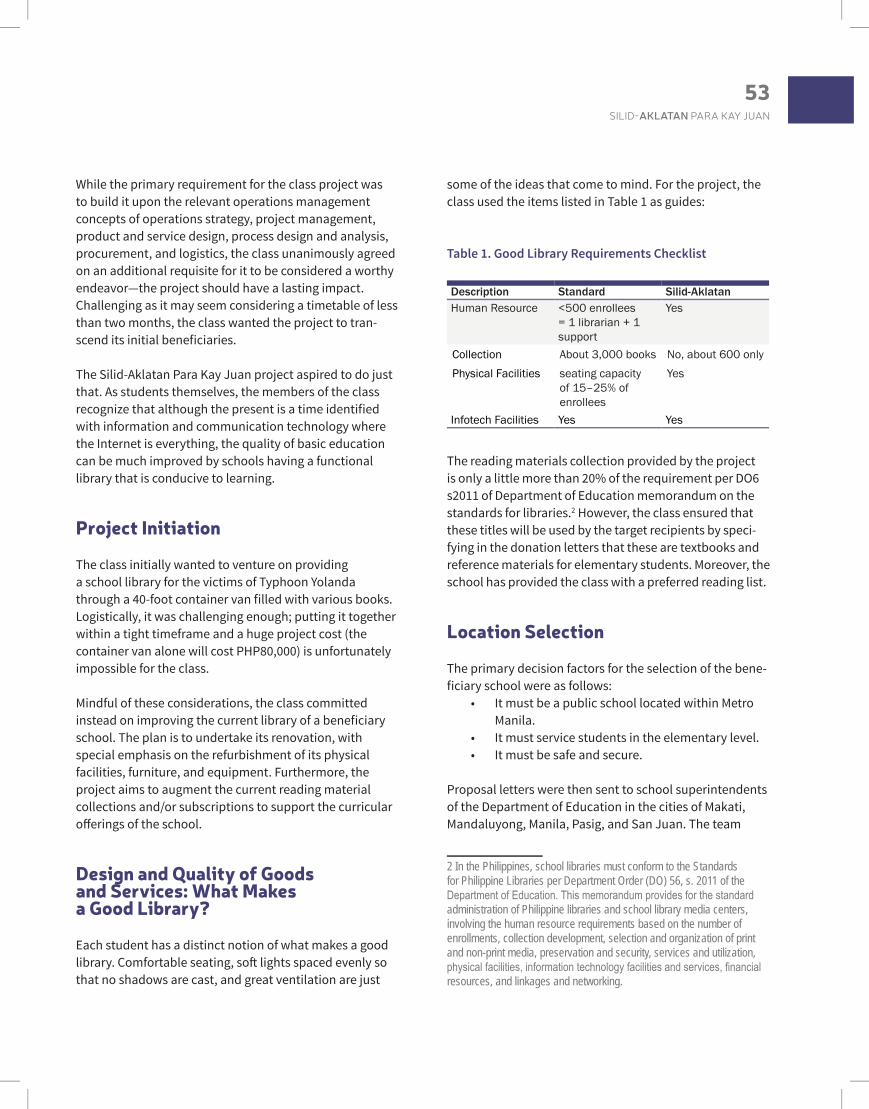
53SILID-AKLATAN PARA KAY JUAN
While the primary requirement for the class project was to build it upon the relevant operations management concepts of operations strategy, project management, product and service design, process design and analysis, procurement, and logistics, the class unanimously agreed on an additional requisite for it to be considered a worthy endeavor—the project should have a lasting impact. Challenging as it may seem considering a timetable of less than two months, the class wanted the project to tran-scend its initial beneficiaries.
The Silid-Aklatan Para Kay Juan project aspired to do just that. As students themselves, the members of the class recognize that although the present is a time identified with information and communication technology where the Internet is everything, the quality of basic education can be much improved by schools having a functional library that is conducive to learning.
Project Initiation
The class initially wanted to venture on providing a school library for the victims of Typhoon Yolanda through a 40-foot container van filled with various books. Logistically, it was challenging enough; putting it together within a tight timeframe and a huge project cost (the container van alone will cost PHP80,000) is unfortunately impossible for the class.
Mindful of these considerations, the class committed instead on improving the current library of a beneficiary school. The plan is to undertake its renovation, with special emphasis on the refurbishment of its physical facilities, furniture, and equipment. Furthermore, the project aims to augment the current reading material collections and/or subscriptions to support the curricular offerings of the school.
Design and Quality of Goods and Services: What Makes a Good Library?
Each student has a distinct notion of what makes a good library. Comfortable seating, soft lights spaced evenly so that no shadows are cast, and great ventilation are just
some of the ideas that come to mind. For the project, the class used the items listed in Table 1 as guides:
Table 1. Good Library Requirements Checklist
Description Standard Silid-AklatanHuman Resource <500 enrollees
= 1 librarian + 1 support
Yes
Collection About 3,000 books No, about 600 onlyPhysical Facilities seating capacity
of 15–25% of enrollees
Yes
Infotech Facilities Yes Yes
The reading materials collection provided by the project is only a little more than 20% of the requirement per DO6 s2011 of Department of Education memorandum on the standards for libraries.2 However, the class ensured that these titles will be used by the target recipients by speci-fying in the donation letters that these are textbooks and reference materials for elementary students. Moreover, the school has provided the class with a preferred reading list.
Location Selection
The primary decision factors for the selection of the bene-ficiary school were as follows:
• It must be a public school located within Metro Manila.
• It must service students in the elementary level.• It must be safe and secure.
Proposal letters were then sent to school superintendents of the Department of Education in the cities of Makati, Mandaluyong, Manila, Pasig, and San Juan. The team
2 In the Philippines, school libraries must conform to the Standards for Philippine Libraries per Department Order (DO) 56, s. 2011 of the Department of Education. This memorandum provides for the standard administration of Philippine libraries and school library media centers, involving the human resource requirements based on the number of enrollments, collection development, selection and organization of print and non-print media, preservation and security, services and utilization, physical facilities, information technology facilities and services, financial resources, and linkages and networking.
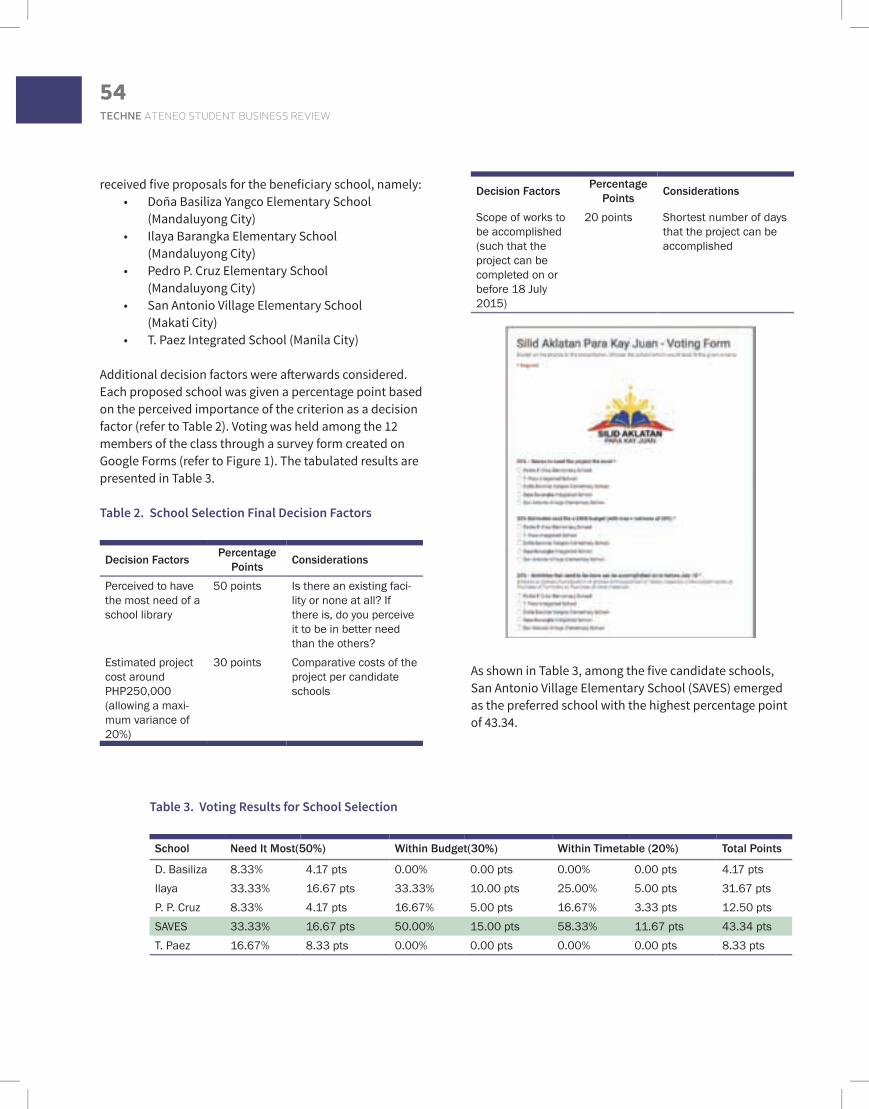
54TECHNE ATENEO STUDENT BUSINESS REVIEW
received five proposals for the beneficiary school, namely:• Doña Basiliza Yangco Elementary School
(Mandaluyong City)• Ilaya Barangka Elementary School
(Mandaluyong City)• Pedro P. Cruz Elementary School
(Mandaluyong City)• San Antonio Village Elementary School
(Makati City)• T. Paez Integrated School (Manila City)
Additional decision factors were afterwards considered. Each proposed school was given a percentage point based on the perceived importance of the criterion as a decision factor (refer to Table 2). Voting was held among the 12 members of the class through a survey form created on Google Forms (refer to Figure 1). The tabulated results are presented in Table 3.
Table 2. School Selection Final Decision Factors
Decision Factors Percentage Points Considerations
Perceived to have the most need of a school library
50 points Is there an existing faci- lity or none at all? If there is, do you perceive it to be in better need than the others?
Estimated project cost around PHP250,000 (allowing a maxi-mum variance of 20%)
30 points Comparative costs of the project per candidate schools
Decision Factors Percentage Points Considerations
Scope of works to be accomplished (such that the project can be completed on or before 18 July 2015)
20 points Shortest number of days that the project can be accomplished
As shown in Table 3, among the five candidate schools, San Antonio Village Elementary School (SAVES) emerged as the preferred school with the highest percentage point of 43.34.
Table 3. Voting Results for School Selection
School Need It Most(50%) Within Budget(30%) Within Timetable (20%) Total Points
D. Basiliza 8.33% 4.17 pts 0.00% 0.00 pts 0.00% 0.00 pts 4.17 ptsIlaya 33.33% 16.67 pts 33.33% 10.00 pts 25.00% 5.00 pts 31.67 ptsP. P. Cruz 8.33% 4.17 pts 16.67% 5.00 pts 16.67% 3.33 pts 12.50 ptsSAVES 33.33% 16.67 pts 50.00% 15.00 pts 58.33% 11.67 pts 43.34 ptsT. Paez 16.67% 8.33 pts 0.00% 0.00 pts 0.00% 0.00 pts 8.33 pts
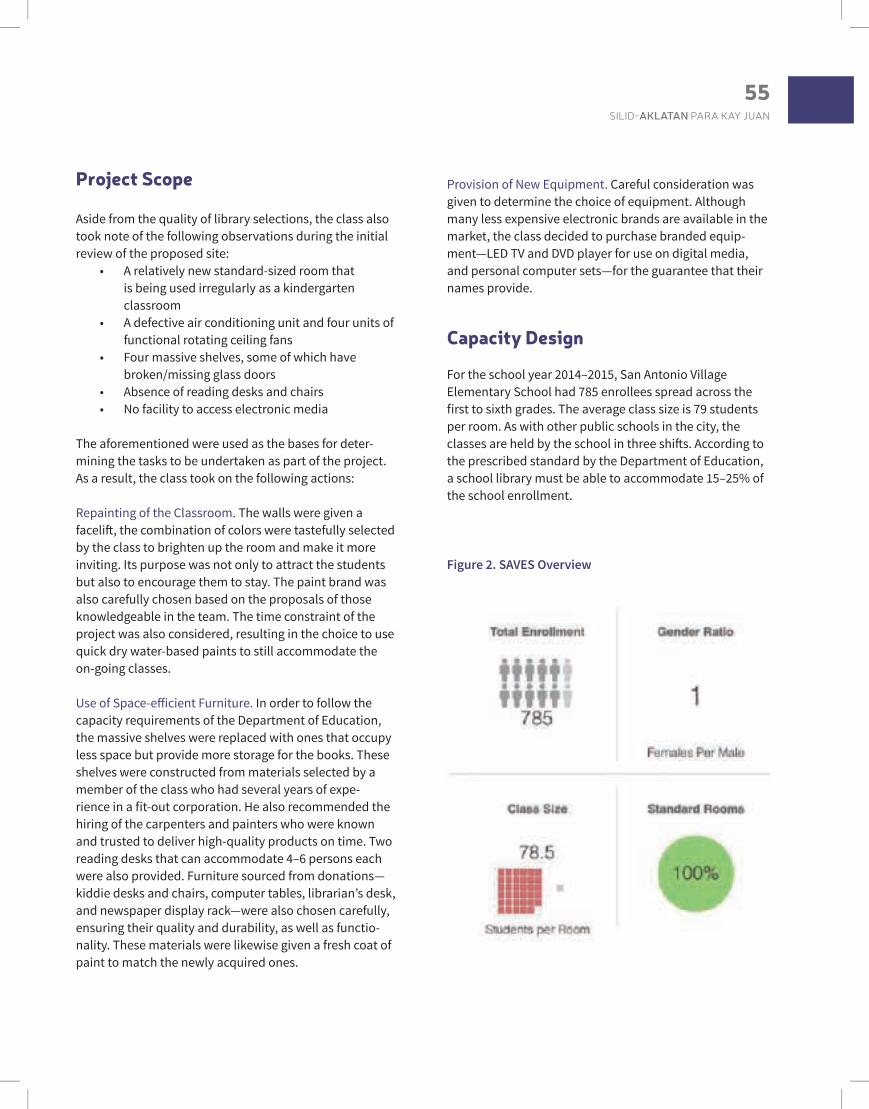
55SILID-AKLATAN PARA KAY JUAN
Project Scope
Aside from the quality of library selections, the class also took note of the following observations during the initial review of the proposed site:
• A relatively new standard-sized room that is being used irregularly as a kindergarten classroom
• A defective air conditioning unit and four units of functional rotating ceiling fans
• Four massive shelves, some of which have broken/missing glass doors
• Absence of reading desks and chairs • No facility to access electronic media
The aforementioned were used as the bases for deter-mining the tasks to be undertaken as part of the project. As a result, the class took on the following actions:
Repainting of the Classroom. The walls were given a facelift, the combination of colors were tastefully selected by the class to brighten up the room and make it more inviting. Its purpose was not only to attract the students but also to encourage them to stay. The paint brand was also carefully chosen based on the proposals of those knowledgeable in the team. The time constraint of the project was also considered, resulting in the choice to use quick dry water-based paints to still accommodate the on-going classes.
Use of Space-efficient Furniture. In order to follow the capacity requirements of the Department of Education, the massive shelves were replaced with ones that occupy less space but provide more storage for the books. These shelves were constructed from materials selected by a member of the class who had several years of expe- rience in a fit-out corporation. He also recommended the hiring of the carpenters and painters who were known and trusted to deliver high-quality products on time. Two reading desks that can accommodate 4–6 persons each were also provided. Furniture sourced from donations—kiddie desks and chairs, computer tables, librarian’s desk, and newspaper display rack—were also chosen carefully, ensuring their quality and durability, as well as functio- nality. These materials were likewise given a fresh coat of paint to match the newly acquired ones.
Provision of New Equipment. Careful consideration was given to determine the choice of equipment. Although many less expensive electronic brands are available in the market, the class decided to purchase branded equip-ment—LED TV and DVD player for use on digital media, and personal computer sets—for the guarantee that their names provide.
Capacity Design
For the school year 2014–2015, San Antonio Village Elementary School had 785 enrollees spread across the first to sixth grades. The average class size is 79 students per room. As with other public schools in the city, the classes are held by the school in three shifts. According to the prescribed standard by the Department of Education, a school library must be able to accommodate 15–25% of the school enrollment.
Figure 2. SAVES Overview

56TECHNE ATENEO STUDENT BUSINESS REVIEW
Based on the data in Figures 2 and 3, the required seating capacity for the school library is as follows:
785 enrollees / 3 shifts = 262 students 262 students x 15% = 39 students
The awarded library is presently able to accommodate a seating capacity of 40, plus an additional 20 with the purchase of additional furniture.
Facilities Layout
First Layout. The first layout was drafted based on an approximate area of 25 square meters (5 m x 5 m), the size of a regular classroom. Initially, the class tried to make use of the Standards for Philippine Libraries to design the proposed library. The standards has customary specifica-tions for a particular education level, viz. dimensions of
the bookshelves (height, length, and depth) and appro-priate height of tables and chairs.
Aside from the dimensions of furniture, the class also identified other items prescribed in the circular that can be included in the layout such as a newspaper stand, card catalog cabinet, and bag counter. Capacity was also taken into account. Due to the limitation in size, the book-shelves, tables, chairs, librarian’s desk, and additional items were forced to fit the 25 square meters, without considering the flow of people yet. In this layout, the bookshelves were placed on one side of the room, making
Figure 3. SAVES Enrollment (SY 2014–2015)
Figure 4. First Layout
the windows free for air flow and ambient light. The libra- rian’s desk was positioned on the opposite side with the tables and chairs set on the center of the room. Each table was designed to seat 8–10 people for bigger capacity and multiple usages.

57SILID-AKLATAN PARA KAY JUAN
Second Layout. The second layout was drafted after the class has identified the recipient library. The class was then able to put into consideration the exact measure-ments of the facility, the orientation of the door and windows, the physical state of the library, the items that are already present, and those that need to be procured.Since there is only one door for entry and exit, the libra- rian’s desk was placed near it. Shelves, meanwhile, were positioned at the center of the room, plus one other shelf along the wall behind the librarian’s desk. Tables and
chairs were laid beside the walls to make full use of the natural lighting from the windows. A computer kiosk and a couch were also placed on one side. The space was clearly limited and after considering the flow of students in the available spaces, the card catalog cabinet and bag counter were removed from the layout.
Third Layout. The third and final layout was further enhanced and revised according to budget, as well as to the preferences of the school administration and
Figure 5a. Second Layout Figure 5b. Second Layout
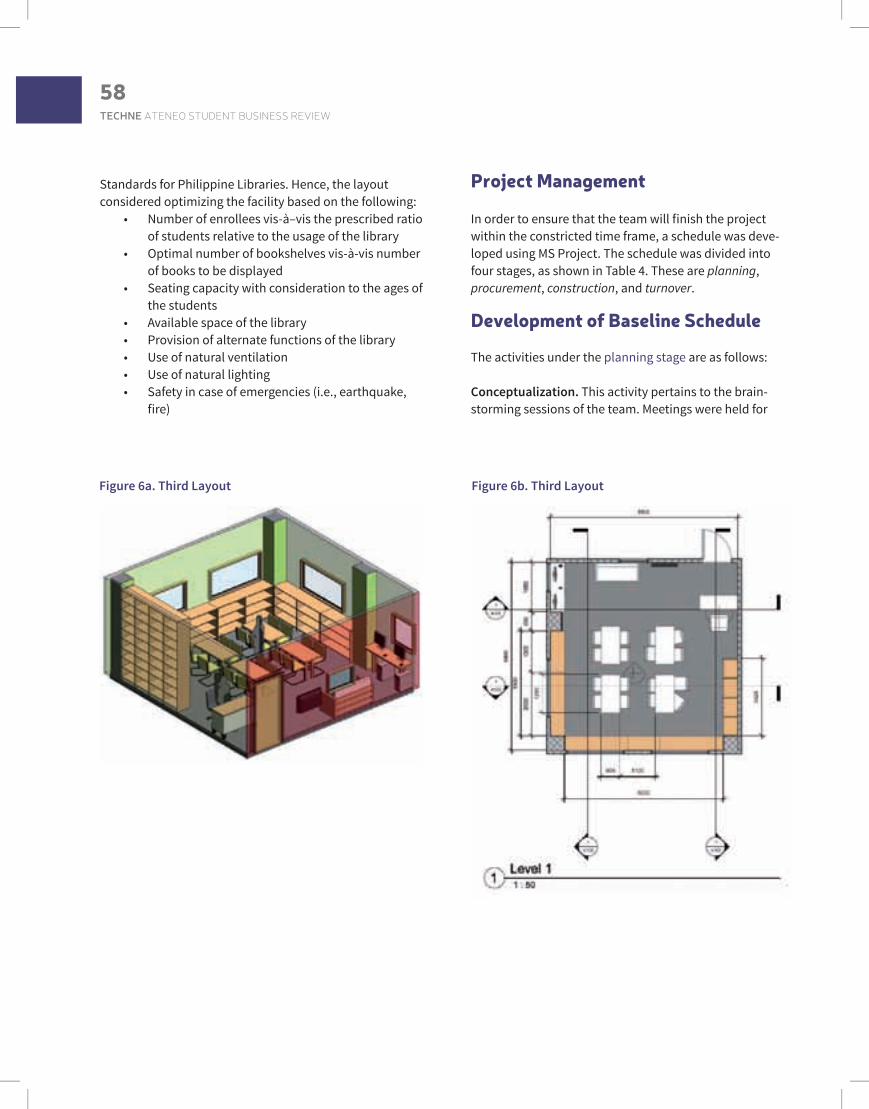
58TECHNE ATENEO STUDENT BUSINESS REVIEW
Standards for Philippine Libraries. Hence, the layout considered optimizing the facility based on the following:
• Number of enrollees vis-à–vis the prescribed ratio of students relative to the usage of the library
• Optimal number of bookshelves vis-à-vis number of books to be displayed
• Seating capacity with consideration to the ages of the students
• Available space of the library • Provision of alternate functions of the library • Use of natural ventilation • Use of natural lighting • Safety in case of emergencies (i.e., earthquake,
fire)
Project Management
In order to ensure that the team will finish the project within the constricted time frame, a schedule was deve- loped using MS Project. The schedule was divided into four stages, as shown in Table 4. These are planning, procurement, construction, and turnover.
Development of Baseline Schedule
The activities under the planning stage are as follows:
Conceptualization. This activity pertains to the brain-storming sessions of the team. Meetings were held for
Figure 6a. Third Layout Figure 6b. Third Layout

59SILID-AKLATAN PARA KAY JUAN
Table 4. Project Management Schedule
ID Task Name Predecessor/s Baseline Duration Baseline Start Baseline Finish
1 Planning2 Conceptualization 3 days 5/29/2015 6/2/20153 Kick-off meeting 2 0 days 6/2/2015 6/2/20164 Library search 3 7 days 6/3/2015 6/11/20155 Library award 4 0 days 6/11/2015 6/11/20156 1st stage of sponsorship 5 7 days 6/12/2015 6/22/20157 2nd stage of sponsorship 6 7 days 6/23/2015 7/1/20158 Design of library 5 7 days 6/12/2015 6/22/20159 Bill of materials 8 2 days 6/23/2015 6/24/201510 Contractor search 8 14 days 6/23/2016 7/10/201511 Contract award 10 0 days 7/10/2015 7/10/201512 Procurement13 Tables, chairs (outsourced, LLI) 6,9 14 days 6/25/2015 7/14/201514 Shelves (outsourced, LLI) 6,9 14 days 6/25/2015 7/14/201515 Window blinds 7,9 5 days 7/2/2015 7/8/201516 Painting 7,9 3 days 7/2/2015 7/6/201517 Miscellaneous (globes, maps, etc.) 7,9 3 days 7/2/2015 7/6/201518 Computers 7,9 7 days 7/2/2015 7/10/201519 Books 7,9 7 days 7/2/2015 7/10/201520 Split-type air conditioning unit 7,9 7 days 7/2/2015 7/10/201521 Cleaning materials 7 2 days 7/2/2015 7/3/201522 Construction23 Clean-up 21,11 4 days 7/13/2015 7/16/201524 Painting of ceiling 16,23 2 days 7/17/2015 7/20/201525 Painting of walls 16,23 2 days 7/17/2015 7/20/201526 A/C unit installation 25 1 day 7/21/2015 7/21/201527 Window blinds installation 25 1 day 7/21/2015 7/21/2015
28 Furnishing13,14,15,17, 18, 19,24,25, 26, 27 4 days 7/22/2015 7/27/2015
29 Library construction completion 28 0 days 7/27/2015 7/27/201530 Turnover of library31 Turnover ceremony 29 0 days 7/27/2015 7/27/2015

60TECHNE ATENEO STUDENT BUSINESS REVIEW
discussions and exchanges of ideas, concepts, issues, and challenges that the project may face. Three days were allotted for conceptualization until a final decision on what project to pursue is reached.
Kick-off Meeting. This was one-day event held at the class. A presentation was prepared to show the proposed project for the term.
Library Search. Seven working days were allotted for the search of the beneficiary school. This activity involved calling the superintendents, writing letters to school prin-cipals, and visiting the schools for ocular inspections.
Library Award. The team met up to finally choose the library recipient among the proposed schools. This was considered a milestone event.
First Stage of Sponsorship. During conceptualization, it was decided that solicitations for sponsorships will commence after the team has finally decided which library to pursue. One of the reasons was that the letter requesting for sponsorships should bear descriptions of the project and the beneficiary. The first stage of spon-sorship would shoulder the expenses for materials consi- dered as long lead items. Seven days were allotted for this activity.
Second Stage of Sponsorship. Solicitation activities were conducted until the team reaches the required budget to finish the project. Seven days were considered in the baseline schedule.
Design of Library. Designing the library commenced after the recipient school was chosen. Ocular inspections were held to obtain actual measurements of the physical struc-ture. Revit software from Autodesk was used to create a 3D model which helped facilitate spatial planning to explore different options for the layout. It also was utilized to coordinate, collaborate, and communicate the design intent to all project stakeholders. Five days were originally considered for this activity.
Bills of Materials. The bills of materials were taken after designing the library. Because the model was to scale, material quantities for the shelves, tables, and chairs were
easily obtained. Bills of materials also included all items to be bought for the library such as maps, globe, paint, window blinds, TV, books, etc. Two days were allotted for this activity.
Contractor Search. After the design of the library, the class searched for contractors to do the actual labor during construction. Contractors included painters and carpen-ters. Fourteen days were allotted and careful planning was put into this activity since the team expected this is where most of the budget will be placed. Different contractors with their cost proposals were considered.
Contract Award. The contract was awarded based on the cost and availability of the painters and carpenters. The availability was checked against the project schedule. This was considered a milestone event.
Activities under the procurement stage are as follows:
Tables, Chairs, and Shelves. Tables, chairs, and shelves were the furniture that would take up the most space in the library. This activity included long lead items and would consume fourteen days to finish. It involved the analysis whether to pursue procurement or have it sub-contracted so that the materials would be customized to fit the library. Considerations were placed on the cost, schedule, and fit for purpose.
Non-long lead materials were as follows. Duration ranged from three to seven days for each. Procurement of these materials was scheduled in parallel as assignments were divided among the group.
• Window blinds• Paint• Computers• Books• Miscellaneous• Cleaning materials• Split-type air conditioner
Activities under the construction stage are as follows:
Clean-up. This activity pertains to the cleaning and clearing of the library. The original library had a lot of
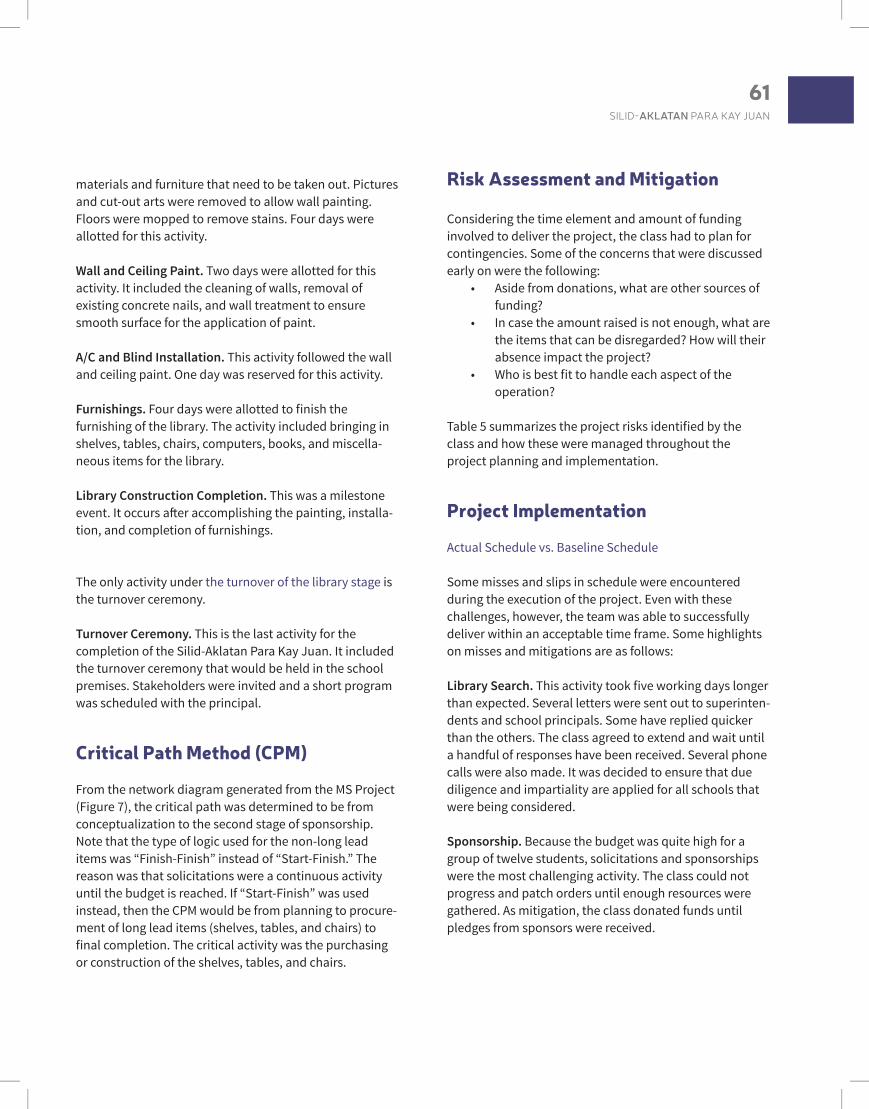
61SILID-AKLATAN PARA KAY JUAN
materials and furniture that need to be taken out. Pictures and cut-out arts were removed to allow wall painting. Floors were mopped to remove stains. Four days were allotted for this activity.
Wall and Ceiling Paint. Two days were allotted for this activity. It included the cleaning of walls, removal of existing concrete nails, and wall treatment to ensure smooth surface for the application of paint.
A/C and Blind Installation. This activity followed the wall and ceiling paint. One day was reserved for this activity.
Furnishings. Four days were allotted to finish the furnishing of the library. The activity included bringing in shelves, tables, chairs, computers, books, and miscella-neous items for the library.
Library Construction Completion. This was a milestone event. It occurs after accomplishing the painting, installa-tion, and completion of furnishings.
The only activity under the turnover of the library stage is the turnover ceremony.
Turnover Ceremony. This is the last activity for the completion of the Silid-Aklatan Para Kay Juan. It included the turnover ceremony that would be held in the school premises. Stakeholders were invited and a short program was scheduled with the principal.
Critical Path Method (CPM)
From the network diagram generated from the MS Project (Figure 7), the critical path was determined to be from conceptualization to the second stage of sponsorship. Note that the type of logic used for the non-long lead items was “Finish-Finish” instead of “Start-Finish.” The reason was that solicitations were a continuous activity until the budget is reached. If “Start-Finish” was used instead, then the CPM would be from planning to procure-ment of long lead items (shelves, tables, and chairs) to final completion. The critical activity was the purchasing or construction of the shelves, tables, and chairs.
Risk Assessment and Mitigation
Considering the time element and amount of funding involved to deliver the project, the class had to plan for contingencies. Some of the concerns that were discussed early on were the following:
• Aside from donations, what are other sources of funding?
• In case the amount raised is not enough, what are the items that can be disregarded? How will their absence impact the project?
• Who is best fit to handle each aspect of the operation?
Table 5 summarizes the project risks identified by the class and how these were managed throughout the project planning and implementation.
Project Implementation
Actual Schedule vs. Baseline Schedule
Some misses and slips in schedule were encountered during the execution of the project. Even with these challenges, however, the team was able to successfully deliver within an acceptable time frame. Some highlights on misses and mitigations are as follows:
Library Search. This activity took five working days longer than expected. Several letters were sent out to superinten-dents and school principals. Some have replied quicker than the others. The class agreed to extend and wait until a handful of responses have been received. Several phone calls were also made. It was decided to ensure that due diligence and impartiality are applied for all schools that were being considered.
Sponsorship. Because the budget was quite high for a group of twelve students, solicitations and sponsorships were the most challenging activity. The class could not progress and patch orders until enough resources were gathered. As mitigation, the class donated funds until pledges from sponsors were received.

62TECHNE ATENEO STUDENT BUSINESS REVIEW
Design of Library and Bill of Materials. These combined activities took more than nine working days to complete compared with the baseline schedule. Several revisions on the library layout were performed to ensure that the design suited what the school really needed. The bill of materials was revised several times as well since the materials were heavily dependent on the budget.
Procurement of Long Lead Items (tables, chairs, and shelves). This is one of the most critical activities in terms of cost and schedule. Because the schedule was already showing delays, the class expedited this activity. Instead of sub-contracting them, the class hired carpenters and foremen who made these materials within the school premises. This ensured that proper measurements are captured and fit-out are done as required. A total of ten working days was saved because of this mitigation.
Procurement and Installation of Air Conditioning Unit. This activity was cancelled due to limited funds received. Although there were actual dates in the schedule, due to technical difficulties in manipulating the MS Project, this activity did not happen and had no impact in the schedule.
Turnover Ceremony. The class was ready to turn over the library as per baseline schedule; however, July 27th was declared a holiday. With school’s permission, it was moved to July 31st. Two days before the event, the class received a call from the school asking that the turnover ceremony be postponed due to unforeseen school activi-ties. The class then decided to use the remaining days to deliver more books coming from book donors. The turn-over was then held on August 7th.
Supply Chain Management: The Six-step Process Sourcing of Materials and Labor
Assess the Opportunity. The evaluation of materials to be procured was based on the initial layout design and space of the room, while items to be purchased were prioritized due to the limited budget. Identified items of priority are as follows:
• Civil works• Painting works• Furniture and fixtures• Appliances/Equipment• Library materials
Figure 7. Network Diagram
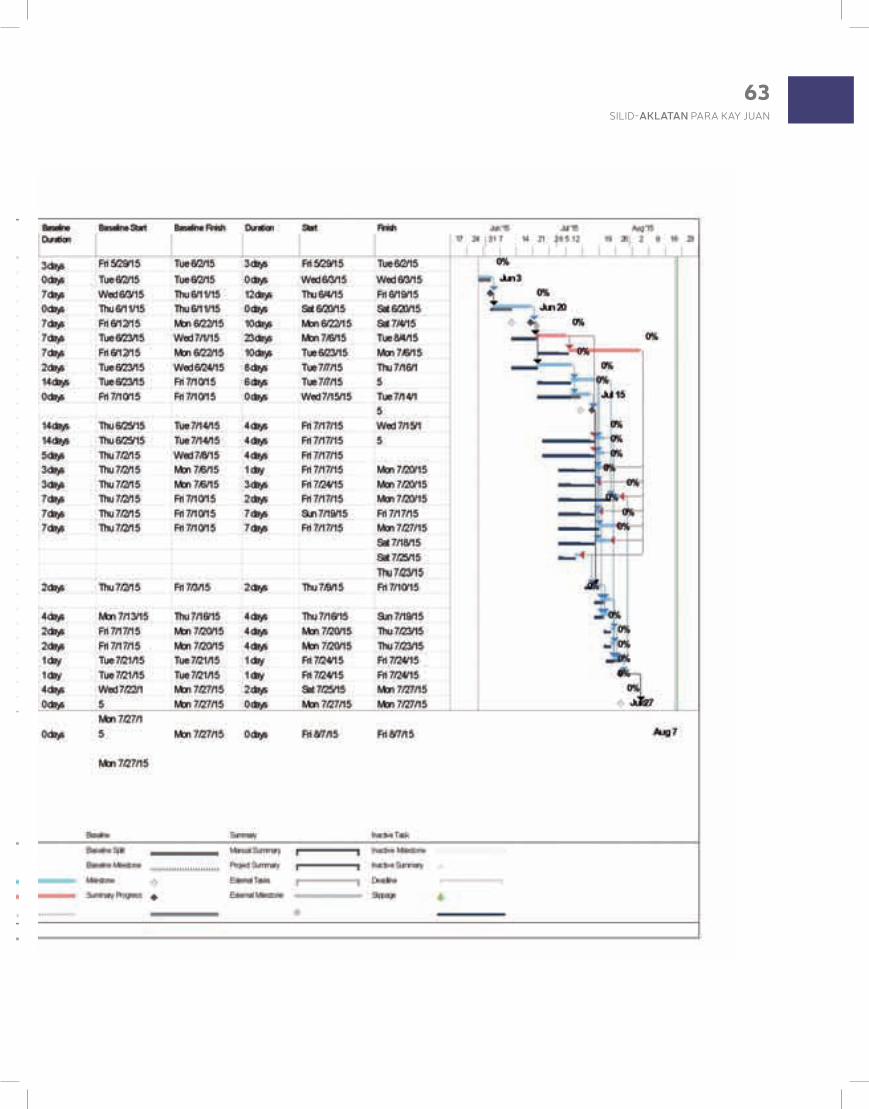
63SILID-AKLATAN PARA KAY JUAN

64TECHNE ATENEO STUDENT BUSINESS REVIEW

65SILID-AKLATAN PARA KAY JUAN
Engage Sourcing Agents. A number of members of the class volunteered on sourcing the vendors given their existing relationships with them, as well as knowledge on where to get the best prices.
Assess the Supply Base. Quotations were acquired from different vendors to establish the costing of the project.
Develop Sourcing Strategy. As the pricing of materials were pooled together, evaluation criteria for both stake-holders surfaced:
Material/Goods criteria:• Is the item within budget?
• Is the quality of craftsmanship good?• Will the item last for more than five years?• Will it be more price-efficient if the item is
built?• Does it suit the needs of the students?• Does it suit the needs of the librarian?• Is the vendor located near the point-of-
contact’s (POC) location? • Is the vendor near the project location?• Will the vendor deliver the goods?• Will the POC deliver the goods?• Is the delivery of the goods within the project
time frame?
Table 5. Contingency Risks and Measures
Risk/s Contingency Measure/s
FundingSponsorship/ Donations
a. Delay in raising fund b. Insufficient amount raised from sponsor- ship/donation
a. Each member of the class provided seed money to address immediate expenses.Each member of the class was tasked to submit three sponsor-ship leads, which the Sponsorship Committee can work on.
b. The class divided the item requirement/s into 3 tiers, from which decisions on purchases were made according to priority. The 3 tiers were:
1. Highly Important – Their absence will greatly impact the project. 2. Not Necessarily Important – Their presence will enhance the project but the absence will not affect the project.
3. Least Important – These are items that the project can do without.
FacilitySchool RestrictionsGuidelines on Library Specifications
a. Limited window of availability given by the school for the construction work b. Delay of construction due to the rainy seasonc. Not meeting library specifications
a. Coordination of schedule was made with the school administrators (from which a memo was released informing the school community of the project).
b. Fabrication and painting can be done indoors.c. Deliverables were prioritized based on the guidelines.
Personnel a. Job assignment mismatchb. Availability to work on the project, atten- dance to meetingsc. Not meeting expec- ted service levels
a. Assignments were made based on professional experience.b. Meetings were held twice a week for updates.c. PM to call on delays.
MaterialsLogistics
a. Delay in delivery Ready-made or custom-built?
a. Alternative means of delivery were explored.b. The class determined which items can be bought ready-made and which
should be custom-built (with consideration on funding, timeline, and space provided).
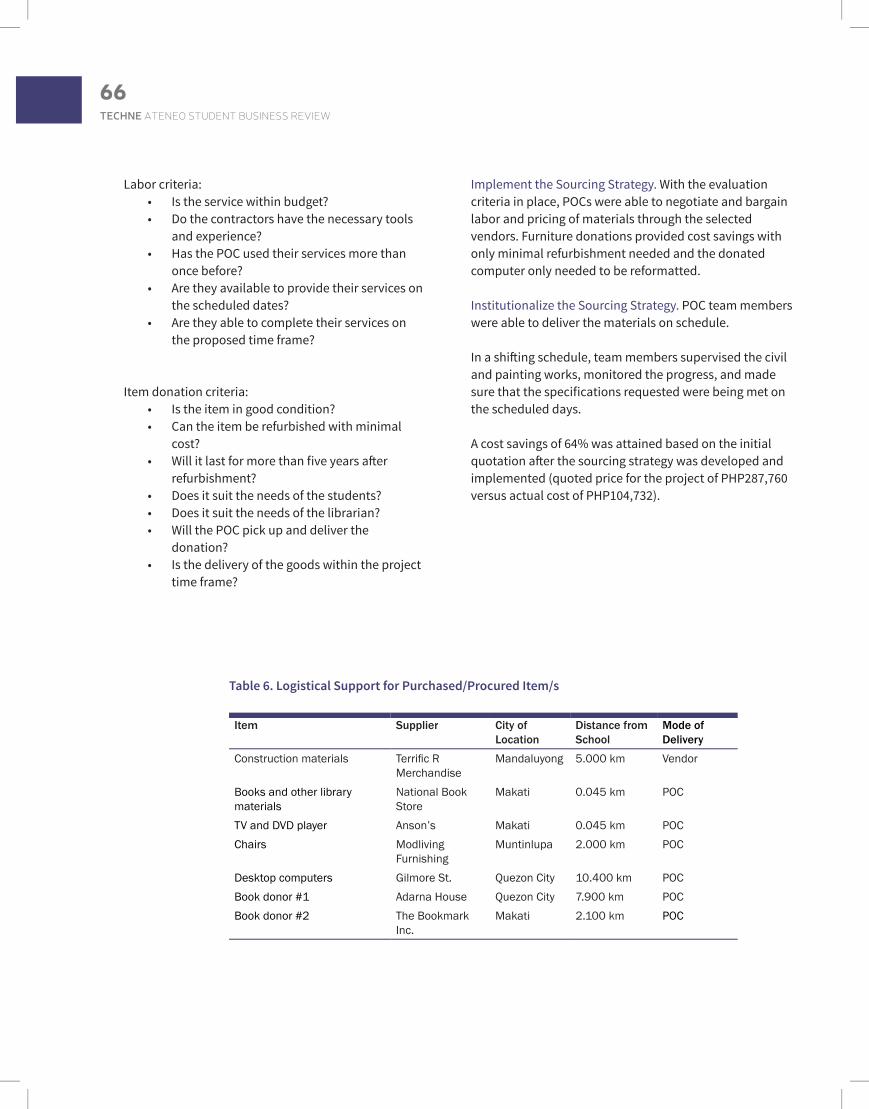
66TECHNE ATENEO STUDENT BUSINESS REVIEW
Labor criteria:• Is the service within budget?• Do the contractors have the necessary tools
and experience?• Has the POC used their services more than
once before?• Are they available to provide their services on
the scheduled dates?• Are they able to complete their services on
the proposed time frame?
Item donation criteria:• Is the item in good condition?• Can the item be refurbished with minimal
cost?• Will it last for more than five years after
refurbishment?• Does it suit the needs of the students?• Does it suit the needs of the librarian?• Will the POC pick up and deliver the
donation?• Is the delivery of the goods within the project
time frame?
Implement the Sourcing Strategy. With the evaluation criteria in place, POCs were able to negotiate and bargain labor and pricing of materials through the selected vendors. Furniture donations provided cost savings with only minimal refurbishment needed and the donated computer only needed to be reformatted.
Institutionalize the Sourcing Strategy. POC team members were able to deliver the materials on schedule.
In a shifting schedule, team members supervised the civil and painting works, monitored the progress, and made sure that the specifications requested were being met on the scheduled days.
A cost savings of 64% was attained based on the initial quotation after the sourcing strategy was developed and implemented (quoted price for the project of PHP287,760 versus actual cost of PHP104,732).
Table 6. Logistical Support for Purchased/Procured Item/s
Item Supplier City of Location
Distance from School
Mode of Delivery
Construction materials Terrific R Merchandise
Mandaluyong 5.000 km Vendor
Books and other library materials
National Book Store
Makati 0.045 km POC
TV and DVD player Anson’s Makati 0.045 km POCChairs Modliving
FurnishingMuntinlupa 2.000 km POC
Desktop computers Gilmore St. Quezon City 10.400 km POCBook donor #1 Adarna House Quezon City 7.900 km POCBook donor #2 The Bookmark
Inc.Makati 2.100 km POC

67SILID-AKLATAN PARA KAY JUAN
Figure 8. Actual Photo of Finished Library
Implementing Logistics
POCs with the vendors were responsible for having the materials and labor delivered to the project location. Items were purchased ahead of schedule and were stored at their residences.
Table 6 lists the types of items purchased and their respec-tive distances from the delivery and/or pickup location. Construction materials were delivered by the vendor to the project location and the rest were purchased by class members near the establishments that were identified as suppliers for the project.
Project Completion
The Actual Layout (Figure 8)
Bookshelves. The bookshelves were lined up and braced against the walls below the window, so as not to obstruct the natural lighting and ventilation, and to allow for maximum spread of book displays.
Computer Kiosk and Computers. The computer kiosk and computers were set facing the wall in a corner near the available electrical outlets.
Librarian’s Desk. The librarian’s desk was placed parallel to the door for easy monitoring of students coming in and going out.
Couch. A couch was obtained by the group via a donor. It was positioned against the wall in between the computers and the door. This provides the students more comfor-table seating.
Tables and Chairs. Two sets of tables and chairs were made: one for the bigger/older kids and one for the smaller/younger kids, taking into consideration their height differences for comfort. Relatively, this made the library more attractive and appropriately fit for their age.
Color. Two contrasting shades of blue were applied to the walls to make it cooler and comfortable for tired eyes. Dark brown and orange were used on bookshelves to make the books on display more attractive, while a matching brown was also used for the tables to unify the look. The dark color on the table also contributes
68TECHNE ATENEO STUDENT BUSINESS REVIEW
to making it almost maintenance-free from accidental writing or doodles by children. Orange and white used alternatively on the chairs served to neutralize the dark colors of the shelves and tables. The class generally wanted the library to look different from the other rooms in the school to make it more attractive for the students and encourage them to visit often.
Television and DVD Player. The TV and DVD player were hung on the wall in between the two windows for wider angle viewing and in consideration of the distance from the available electrical outlet.
Maintenance
The materials, design, and colors selected for the furniture in the library have the lowest level of upkeep necessary.
Tables have a dark color finish to keep doodles from being noticed. The dark color also discourages vandalism. The same goes for the shelves.
The sofa, though a donation, is made of leatherette which can be easily cleaned by wiping it off.
The more mobile furniture—tables and chairs—were also placed at the center of the room to allow for easy move-ment during regular cleaning.
Learnings
The goal of operations and supply chain management (OSCM) is to design, operate, and improve a system that creates and delivers various products and services. The selected class project intends to hand over a student-friendly “third place” that is conducive to learning and a venue to improve the quality of education of elementary school students. It involves a complex series of transfor-mation process.
The concepts learned in the Operations Management (OPEMAN) class were matched with practical applications. These include organizing the different types of processes,
calculating and ensuring the right capacity of usage, determining how long each process takes (to transform the old library), measuring and monitoring the quality of processes, and more importantly, analyzing how all these information were used to arrive at the decisions related to the design and execution of the class project.
In the limited number of days consumed in the comple-tion of this project, the scope of work involved actually went through the full OSCM process.
Planning. Here, the class determined how the anticipated demand for the turnover of the library will meet the deve-loped metrics to monitor that the entire transformation process is efficient and that the commitment of each class member is delivered.
Sourcing. This involved two phases, although performed simultaneously. On the one hand was the selection of suppliers to deliver the goods and services needed to complete the library transformation; on the other was the sourcing of funds required to cover all the project expenses.
Making. This included the scheduling process for outsourced workers (e.g., carpenters, painters, etc.) and the coordination of material and other critical resources. Speed, work quality, and worker productivity were monitored.
Delivering. This process also refers to the logistics process. Carriers were picked to move the items and library reference materials from the suppliers and donors to the school. Some were also brought personally. Coordination and scheduling was appreciated through this project.
Returning. This involved all types of follow-up activi-ties required for after-construction and library turnover support.
The orchestration of these activities proved critical in providing the finished product—a renovated library. Working on this project, the team appreciated more the concepts of efficiency, effectiveness, and value.

69SILID-AKLATAN PARA KAY JUAN
Conclusion
There is no one way to do something better, but it can be done through careful planning and forecasting. Dividing the scope of work into several phases and exploring the various combinations of successions (i.e., determining the critical path) is an important strategy for saving time and money through the reduction of man-days. Establishing controls to ensure that quality is met 99.9999% also equates to greater savings since wastage is reduced.
Although each member of the class had, at one time or another, performed and even unknowingly applied the various OSCM decisions in their respective work, the practical uses of OSCM concepts, when done in concert with the lessons in class, serve to emphasize these tools’ usefulness to ensure that business processes are made effective and the use of resources are done efficiently.

Background
Chelsea Technical Group (Chelsea) is the top 2 planning and engineering consulting firm in the Philippines. Its consulting services span from design to construction supervision of vital infrastructure and establishments. Their services do not only earn high revenues per project, but also create long-term jobs and economic dynamism. Chelsea is involved in planning, designing, and construction supervising of the various aspects of a project related to structural and sanitary, civil and construction supervision/management, electrical and environmental, mechanical, and architectural.
Chelsea’s services are vital to the construction of the following:• vertical structures and high-rise buildings• industrial and food processing plants• water resources and food control projects• roads, bridges, and transport systems• commercial establishments
ManpowerMix Decision
Kristina Relampagos

71MANPOWER MIX DECISION
• property and land development projects• water supply and sanitation projects• regional development master plans• ports and harbors
Various departments in the company are involved in the different phases to complete a project. Each phase spans from one to 12 months and requires one or more consul-tants (engineers, architects) depending on the type of project, location, and specialization.
Chelsea Technical Group houses approximately 100 in-house engineers and architects. In some cases when the current working capacity is maximized, it outsources some phases of a project to another firm. While this action enables Chelsea to bid for projects continuously, outsourcing parts of a project (not the whole project) to other firms costs more than the quoted amount to the client and increases chance for error to 8 percent from an internal average of only 1.5 percent.
Problem
With the country’s improving economy, there is an increasing demand for engineering and architectural consultancy. However, the company is still not comfor-table with the revenue against the demand-growth ratio. Management then pushed the business development department to bid for more projects than the target and budget within the year. It proved to be a success but is causing overcapacity issues, specifically for the civil engineering (CE) department. Variations between quoted and available resources for the CE department were seen. Chelsea Technical Group must now identify the mix of projects handled by internal CEs and freelance CEs that will maximize profit.
Options to Consider
To solve Chealsea’s problem, there are two options to consider:
Option 1. Use of in-house personnel for all projectsEach civil engineer is allotted a monthly fee of PHP123,000 and allowance of PHP80,000 for incremental costs
(lodging, transportation, meals, and other daily expenses). The company also includes PHP70,000 monthly cost for its operations in its quotations. Quoted price for CE projects is at PHP310,000 per effective month. All projects listed in this case are to be launched simultaneously beginning January 2016 as all on-going short-term projects will have been done by December 2015.
Table 1 shows costs, planned revenues based on quota-tions, and expected profits assuming that all 21 CEs are from the internal pool. However, Option 1 will not be able to cover all projects since only 13 CEs will be available as the rest of the CEs have been assigned to long-term proj-ects. The rest will have to be outsourced to freelance CEs whose monthly fee is 23% higher than rate of in-house CEs (PHP151,290). The same monthly incremental and opera-tional costs apply. In addition, to save on other project-re-lated costs subsequent to the CE’s part of the projects, the following sets of projects must be covered together by an all-internal or all-freelancer team: Projects C & D—Davao (Mindanao projects), and Projects I & J—Iloilo (Visayas projects).
Since quoted prices or revenue are fixed, Chelsea will have to absorb the increase in cost. From this, they are expected to make a 23% profit.
Option 2. Increase manpower availability through reduced timelinesTo reduce the chances of outsourcing to other firms, which increases chance of error from 1.5 percent to 8 percent, the department has proposed new shorter time-lines for some projects with the following implications:
• There will be a slight increase in CEs required (+7 CEs).
• There will be 10 more internal CEs coming from long-term projects. These CEs can each accom-modate an extra project due to the proposed higher monthly fee of 15% overcapacity fee (PHP141,450). The incremental cost of PHP80,000 per month per CE, and monthly operations cost of PHP70,000 will remain the same.
• The original 13 CEs will be paid the usual monthly fee per project (PHP123,000)
• The rest of the projects not covered by the 20 CEs (13 internal + 7 internal on overcapacity), will still

72TECHNE ATENEO STUDENT BUSINESS REVIEW
be outsourced to freelancer CEs at 23% higher monthly fee than original.
The re-adjustment as detailed in Table 2 assumes profits based on all-internal non-overcapacity CEs. It would have been higher but given the conditions on higher fees due to the lack of CEs, actual profit will change.
Now, the department is not only tasked to select which of the 10 projects they will cover internally and which to assign to freelancers to maximize profit; it must also iden-tify the capacity level, given the proposed second option.
Analysis
Selecting the projects that will be covered by the depart-ment and consequently, those that will be outsourced can be done using linear programming. Since revenues are the constant factors across options and conditions, these two are used for optimization.
The decision variables are the different projects which are identified by their project IDs, i.e., A, B, C, D, E, F, G, H, I, J, and must be binary, i.e., accepting values of 1 or 0 only (an answer of 1 for a project means that project is included in the solution, an answer of zero means it is not).
Table 1. Project Revenues and Costs Based on Option 1
Project CEs Needed
Working Months per CE
Effective Months
CE Monthly Cost
Incremental Cost Monthly
Total Cost for CE
Quoted Price (Revenue) Profit
a b c d e f g h
A 2 3 6 1,218,000 210,000 1,428,000 1,860,000 432,000
B 1 2 2 406,000 140,000 546,000 620,000 74,000
C 3 5 15 3,045,000 350,000 3,395,000 4,650,000 1,255,000
D 2 7 14 2,842,000 490,000 3,332,000 4,340,000 1,008,000
E 3 1 3 609,000 70,000 679,000 930,000 251,000
F 1 8 8 1,624,000 560,000 2,184,000 2,480,000 296,000
G 2 3 6 1,218,000 210,000 1,428,000 1,860,000 432,000
H 2 9 18 3,654,000 630,000 4,284,000 5,580,000 1,296,000
I 2 8 16 3,248,000 560,000 3,808,000 4,960,000 1,152,000
J 3 4 12 2,436,000 280,000 2,716,000 3,720,000 1,004,000Total 21 20,300,000 3,500,000 23,800,000 31,000,000 7,200,000
Where: c = a x b d = c x (P123,000 + P80,000) for Internal CEs e = b x P70,000 f = d + e h = g - f

73MANPOWER MIX DECISION
The objective is to maximize revenues = 1860000A + 620000B + 4650000C + 4340000D + 930000E + 2480000F + 1860000G + 5580000H + 4960000I + 3720000J
Three constraints are identified. The first constraint sets the limit to the number of in-house CEs that can be used:
For Option 1: 2A + B + 3C + 2D + 3E + F + 2G + 2H + 2I + 3J <= 13
For Option 2: 2A + B + 3C + 5D + 3E + F + 2G + 4H + 4I + 3J <= 13
Table 2. Project Revenues and Costs Based on Option 2
Project CEs Needed
Working Months per CE
Effective Months
CE Monthly Cost
Incremental Cost
Monthly
Total Cost for CE
Quoted Price (Revenue) Profit
a b c d e f g h
A 2 3 6 1,218,000 210,000 1,428,000 1,860,000 432,000
B 1 2 2 406,000 140,000 546,000 620,000 74,000
C 3 5 15 3,045,000 350,000 3,395,000 4,650,000 1,255,000
D 5 2.8 14 2,842,000 196,000 3,038,000 4,340,000 1,302,000
E 3 1 3 609,000 70,000 679,000 930,000 251,000
F 1 8 8 1,624,000 560,000 2,184,000 2,480,000 296,000
G 2 3 6 1,218,000 210,000 1,428,000 1,860,000 432,000
H 4 4.5 18 3,654,000 315,000 3,969,000 5,580,000 1,611,000
I 4 4 16 3,248,000 280,000 3,528,000 4,960,000 1,432,000
J 3 4 12 2,436,000 280,000 2,716,000 3,720,000 1,004,000Total 28 20,300,000 2,611,000 22,911,000 31,000,000 8,089,000
Where: c = a x b d = c x (P123,000 + P80,000) for Internal CEs e = b x P70,000 f = d + e h = g - f
The second and third constraints pertain to the Mindanao and Visayas projects:
For Mindanao projects: C + D = 2For Visayas projects: I + J = 2
Option 1 Analysis
The Solver template for Option 1 is shown in Figure 1 in the Appendix. The optimization solution identifies C, D, F, H, I, and J as the projects to be covered from Internal CEs resulting in a total revenue of PHP25,730,000. Combining these with the freelancer CEs for the other projects, the
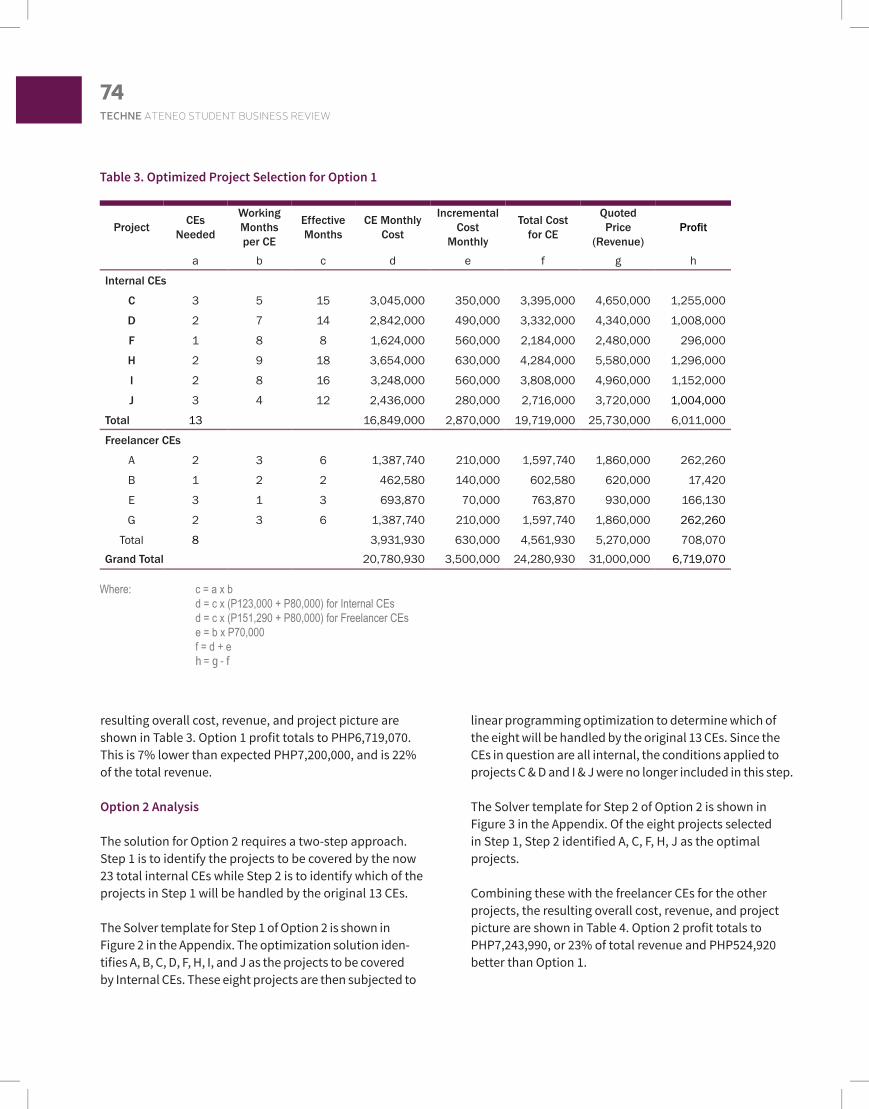
74TECHNE ATENEO STUDENT BUSINESS REVIEW
resulting overall cost, revenue, and project picture are shown in Table 3. Option 1 profit totals to PHP6,719,070. This is 7% lower than expected PHP7,200,000, and is 22% of the total revenue.
Option 2 Analysis
The solution for Option 2 requires a two-step approach. Step 1 is to identify the projects to be covered by the now 23 total internal CEs while Step 2 is to identify which of the projects in Step 1 will be handled by the original 13 CEs.
The Solver template for Step 1 of Option 2 is shown in Figure 2 in the Appendix. The optimization solution iden-tifies A, B, C, D, F, H, I, and J as the projects to be covered by Internal CEs. These eight projects are then subjected to
linear programming optimization to determine which of the eight will be handled by the original 13 CEs. Since the CEs in question are all internal, the conditions applied to projects C & D and I & J were no longer included in this step.
The Solver template for Step 2 of Option 2 is shown in Figure 3 in the Appendix. Of the eight projects selected in Step 1, Step 2 identified A, C, F, H, J as the optimal projects.
Combining these with the freelancer CEs for the other projects, the resulting overall cost, revenue, and project picture are shown in Table 4. Option 2 profit totals to PHP7,243,990, or 23% of total revenue and PHP524,920 better than Option 1.
Table 3. Optimized Project Selection for Option 1
Project CEs Needed
Working Months per CE
Effective Months
CE Monthly Cost
Incremental Cost
Monthly
Total Cost for CE
Quoted Price
(Revenue)Profit
a b c d e f g h
Internal CEs
C 3 5 15 3,045,000 350,000 3,395,000 4,650,000 1,255,000
D 2 7 14 2,842,000 490,000 3,332,000 4,340,000 1,008,000
F 1 8 8 1,624,000 560,000 2,184,000 2,480,000 296,000
H 2 9 18 3,654,000 630,000 4,284,000 5,580,000 1,296,000
I 2 8 16 3,248,000 560,000 3,808,000 4,960,000 1,152,000
J 3 4 12 2,436,000 280,000 2,716,000 3,720,000 1,004,000
Total 13 16,849,000 2,870,000 19,719,000 25,730,000 6,011,000
Freelancer CEs
A 2 3 6 1,387,740 210,000 1,597,740 1,860,000 262,260
B 1 2 2 462,580 140,000 602,580 620,000 17,420
E 3 1 3 693,870 70,000 763,870 930,000 166,130
G 2 3 6 1,387,740 210,000 1,597,740 1,860,000 262,260
Total 8 3,931,930 630,000 4,561,930 5,270,000 708,070Grand Total 20,780,930 3,500,000 24,280,930 31,000,000 6,719,070
Where: c = a x b d = c x (P123,000 + P80,000) for Internal CEs d = c x (P151,290 + P80,000) for Freelancer CEs e = b x P70,000 f = d + e h = g - f
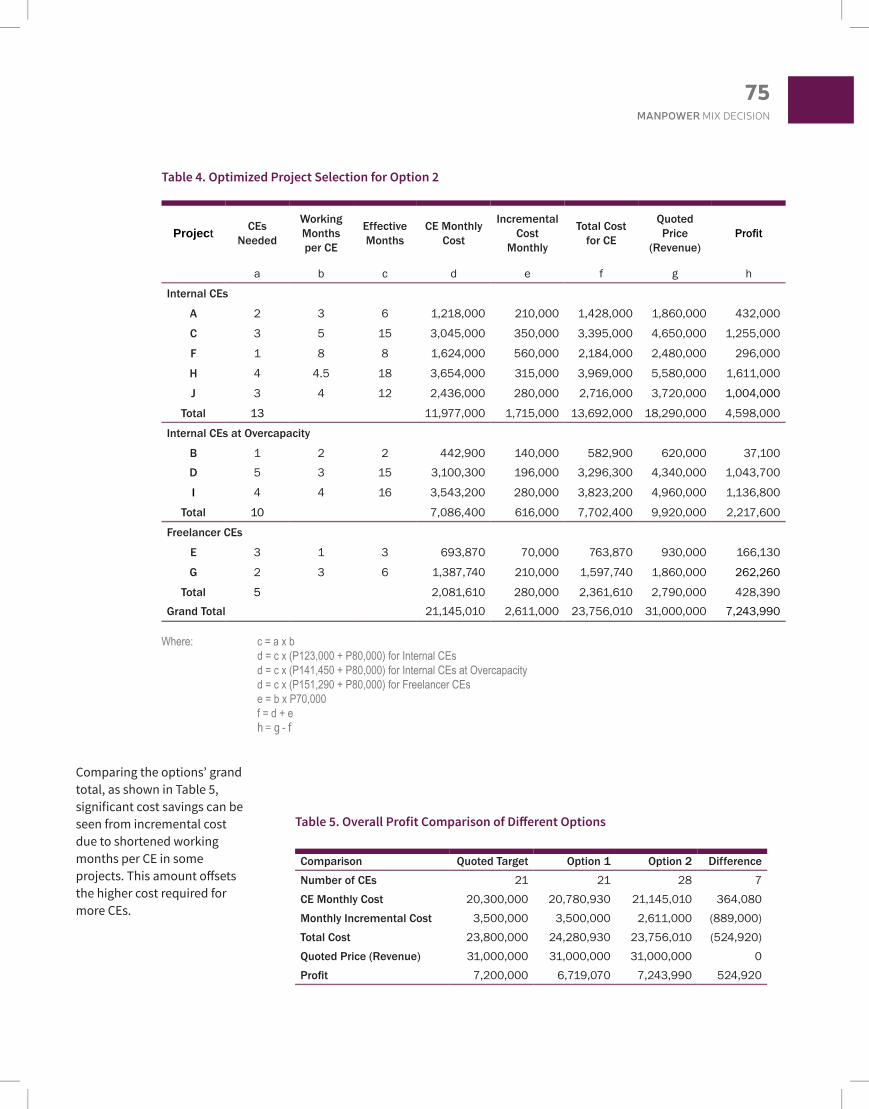
75MANPOWER MIX DECISION
Table 4. Optimized Project Selection for Option 2
Project CEs Needed
Working Months per CE
Effective Months
CE Monthly Cost
Incremental Cost
Monthly
Total Cost for CE
Quoted Price
(Revenue)Profit
a b c d e f g h
Internal CEs
A 2 3 6 1,218,000 210,000 1,428,000 1,860,000 432,000
C 3 5 15 3,045,000 350,000 3,395,000 4,650,000 1,255,000
F 1 8 8 1,624,000 560,000 2,184,000 2,480,000 296,000
H 4 4.5 18 3,654,000 315,000 3,969,000 5,580,000 1,611,000
J 3 4 12 2,436,000 280,000 2,716,000 3,720,000 1,004,000
Total 13 11,977,000 1,715,000 13,692,000 18,290,000 4,598,000
Internal CEs at Overcapacity
B 1 2 2 442,900 140,000 582,900 620,000 37,100
D 5 3 15 3,100,300 196,000 3,296,300 4,340,000 1,043,700
I 4 4 16 3,543,200 280,000 3,823,200 4,960,000 1,136,800
Total 10 7,086,400 616,000 7,702,400 9,920,000 2,217,600
Freelancer CEs
E 3 1 3 693,870 70,000 763,870 930,000 166,130
G 2 3 6 1,387,740 210,000 1,597,740 1,860,000 262,260
Total 5 2,081,610 280,000 2,361,610 2,790,000 428,390Grand Total 21,145,010 2,611,000 23,756,010 31,000,000 7,243,990
Where: c = a x b d = c x (P123,000 + P80,000) for Internal CEs d = c x (P141,450 + P80,000) for Internal CEs at Overcapacity d = c x (P151,290 + P80,000) for Freelancer CEs e = b x P70,000 f = d + e h = g - f
Table 5. Overall Profit Comparison of Different Options
Comparison Quoted Target Option 1 Option 2 Difference
Number of CEs 21 21 28 7CE Monthly Cost 20,300,000 20,780,930 21,145,010 364,080Monthly Incremental Cost 3,500,000 3,500,000 2,611,000 (889,000)Total Cost 23,800,000 24,280,930 23,756,010 (524,920)Quoted Price (Revenue) 31,000,000 31,000,000 31,000,000 0Profit 7,200,000 6,719,070 7,243,990 524,920
Comparing the options’ grand total, as shown in Table 5, significant cost savings can be seen from incremental cost due to shortened working months per CE in some projects. This amount offsets the higher cost required for more CEs.

76TECHNE ATENEO STUDENT BUSINESS REVIEW
Conclusion
In order to make a more comprehensive recommenda-tion to top management, the options are pegged against company priorities. Favorable results are highlighted.
Factors Option 1 (Original)
Option 2 (Adjusted)
a. Total profit yield (PHP) 6,719,070 7,243,990
b. Chance for error (lower chances will be good for future project pros-pects and company image)
Closer to 8% due to more outsourced CEs
Closer to 1.5% due to more internal CEs
c. Shorter work months per CE (results to faster turnaround, higher cash flow, and availability of CE for another project)
Average work-ing months per CE = 2.4
Average work-ing months per CE = 1.3
d. Employee workload well-managed ensu- ring continued service
Yes No due to CEs at overcapa- city
e. More opportunities for employee experience, growth and compen-sation
No Yes
f. Administrative and finance work
Within typical scope
Slightly beyond typical scope due to CEs at overcapacity
Recommendation
Based on these overall management factors, Option 2 is the more advisable route to take. Despite having a more complicated manpower mix, as well as administrative and finance work, the company will earn significantly better profit. It is also poised to give more sustainable benefits in minimizing error risk and creating more work and growth opportunities for CEs.
Appendix I. Solver Template for Option 1

77MANPOWER MIX DECISION
To make the recommendation more compelling, the team should put together case studies or examples of projects where there is a significant composition of freelancer CEs. This action will present a concrete example on how the 8 percent error margin affects client relations and company liability until project completion. Sustainable benefit argu-ment can also be supported by potential projects coming from the clients of these 10 projects and the credentials of the CEs who are willing to go through overcapacity. Finally, it would benefit Chelsea Technical Group to get CE depart-ment’s sign-off on all multi-departmental projects in order to manage manpower and resources better.
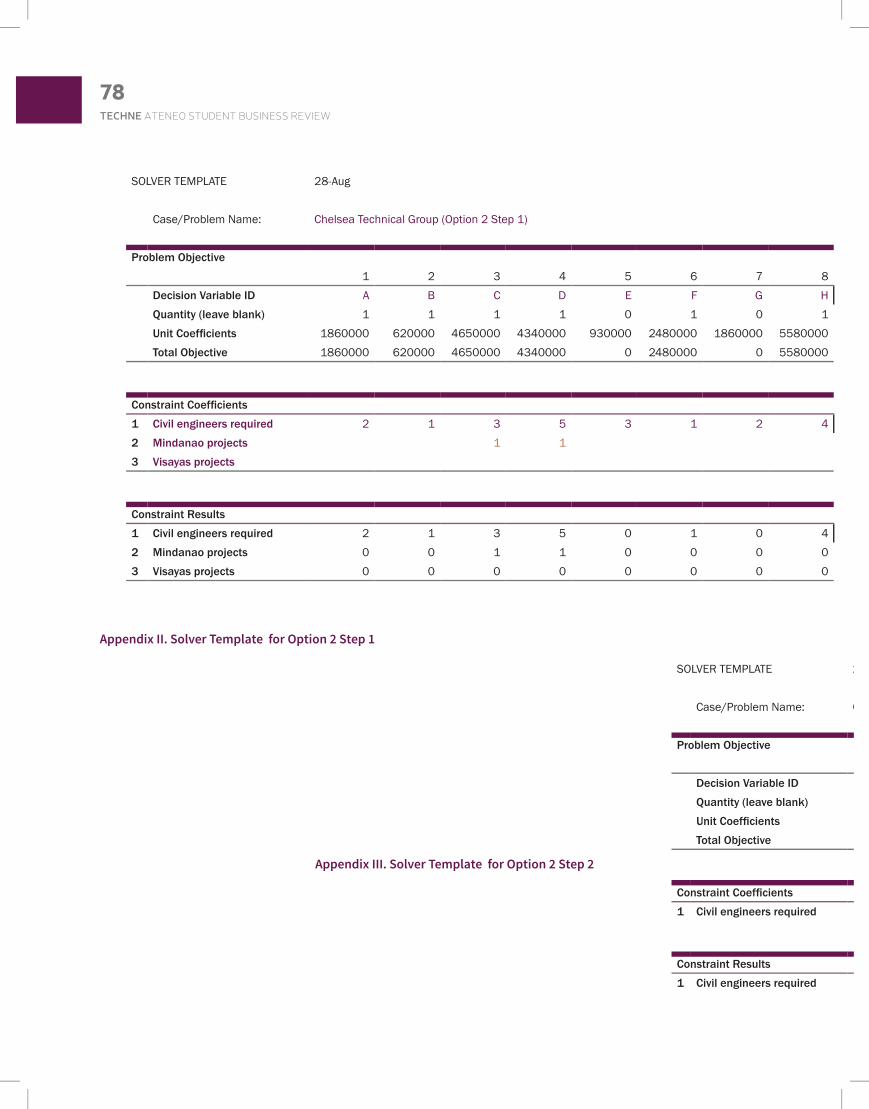
78TECHNE ATENEO STUDENT BUSINESS REVIEW
SOLVER TEMPLATE 28-Aug
Case/Problem Name: Chelsea Technical Group (Option 2 Step 1)
Problem Objective
1 2 3 4 5 6 7 8 Decision Variable ID A B C D E F G H Quantity (leave blank) 1 1 1 1 0 1 0 1 Unit Coefficients 1860000 620000 4650000 4340000 930000 2480000 1860000 5580000 Total Objective 1860000 620000 4650000 4340000 0 2480000 0 5580000
Constraint Coefficients 1 Civil engineers required 2 1 3 5 3 1 2 42 Mindanao projects 1 1 3 Visayas projects
Constraint Results
1 Civil engineers required 2 1 3 5 0 1 0 42 Mindanao projects 0 0 1 1 0 0 0 03 Visayas projects 0 0 0 0 0 0 0 0
SOLVER TEMPLATE 28-Aug
Case/Problem Name: Chelsea Technical Group (Option 2 Step 2)
Problem Objective Total
1 2 3 4 5 6 7 8 Objective
Decision Variable ID A B C D F H I J Quantity (leave blank) 1 0 1 0 1 1 0 1 Unit Coefficients 1860000 620000 4650000 4340000 2480000 5580000 4960000 3720000 Total Objective 1860000 0 4650000 0 2480000 5580000 0 3720000 18290000
Constraint Coefficients 1 Civil engineers required 2 1 3 5 1 4 4 3
Constraint Results Used Available Unused
1 Civil engineers required 2 0 3 0 1 4 0 3 13 13 0
Appendix II. Solver Template for Option 2 Step 1
Appendix III. Solver Template for Option 2 Step 2

79MANPOWER MIX DECISION
SOLVER TEMPLATE 28-Aug
Case/Problem Name: Chelsea Technical Group (Option 2 Step 1)
Problem Objective
1 2 3 4 5 6 7 8 Decision Variable ID A B C D E F G H Quantity (leave blank) 1 1 1 1 0 1 0 1 Unit Coefficients 1860000 620000 4650000 4340000 930000 2480000 1860000 5580000 Total Objective 1860000 620000 4650000 4340000 0 2480000 0 5580000
Constraint Coefficients 1 Civil engineers required 2 1 3 5 3 1 2 42 Mindanao projects 1 1 3 Visayas projects
Constraint Results
1 Civil engineers required 2 1 3 5 0 1 0 42 Mindanao projects 0 0 1 1 0 0 0 03 Visayas projects 0 0 0 0 0 0 0 0
SOLVER TEMPLATE 28-Aug
Case/Problem Name: Chelsea Technical Group (Option 2 Step 2)
Problem Objective Total
1 2 3 4 5 6 7 8 Objective
Decision Variable ID A B C D F H I J Quantity (leave blank) 1 0 1 0 1 1 0 1 Unit Coefficients 1860000 620000 4650000 4340000 2480000 5580000 4960000 3720000 Total Objective 1860000 0 4650000 0 2480000 5580000 0 3720000 18290000
Constraint Coefficients 1 Civil engineers required 2 1 3 5 1 4 4 3
Constraint Results Used Available Unused
1 Civil engineers required 2 0 3 0 1 4 0 3 13 13 0
Total
9 10 Objective
I J 1 1
4960000 3720000 4960000 3720000 28210000
4 3 1 1
Used Available Unused
4 3 23 23 00 0 2 2 01 1 2 2 0
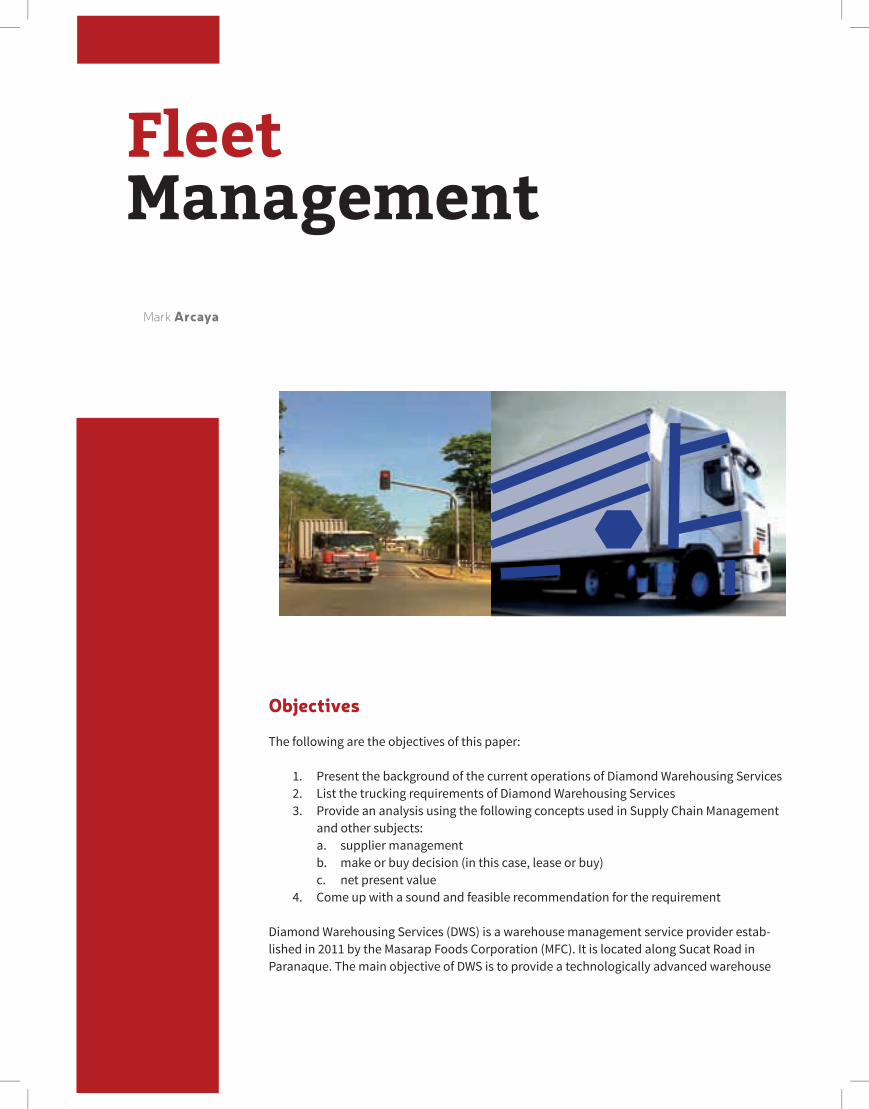
Objectives
The following are the objectives of this paper:
1. Present the background of the current operations of Diamond Warehousing Services2. List the trucking requirements of Diamond Warehousing Services3. Provide an analysis using the following concepts used in Supply Chain Management
and other subjects:a. supplier managementb. make or buy decision (in this case, lease or buy)c. net present value
4. Come up with a sound and feasible recommendation for the requirement
Diamond Warehousing Services (DWS) is a warehouse management service provider estab-lished in 2011 by the Masarap Foods Corporation (MFC). It is located along Sucat Road in Paranaque. The main objective of DWS is to provide a technologically advanced warehouse
FleetManagement
Mark Arcaya
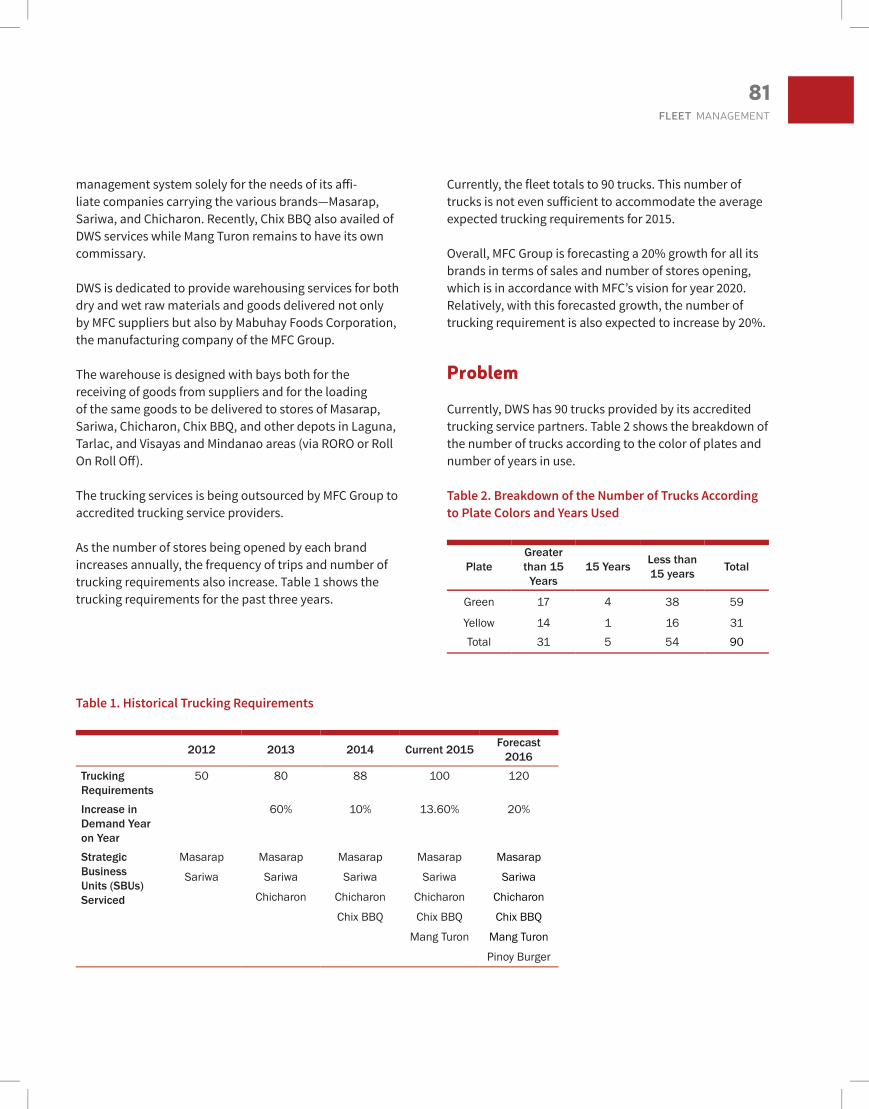
81FLEET MANAGEMENT
management system solely for the needs of its affi-liate companies carrying the various brands—Masarap, Sariwa, and Chicharon. Recently, Chix BBQ also availed of DWS services while Mang Turon remains to have its own commissary.
DWS is dedicated to provide warehousing services for both dry and wet raw materials and goods delivered not only by MFC suppliers but also by Mabuhay Foods Corporation, the manufacturing company of the MFC Group.
The warehouse is designed with bays both for the receiving of goods from suppliers and for the loading of the same goods to be delivered to stores of Masarap, Sariwa, Chicharon, Chix BBQ, and other depots in Laguna, Tarlac, and Visayas and Mindanao areas (via RORO or Roll On Roll Off).
The trucking services is being outsourced by MFC Group to accredited trucking service providers.
As the number of stores being opened by each brand increases annually, the frequency of trips and number of trucking requirements also increase. Table 1 shows the trucking requirements for the past three years.
Table 1. Historical Trucking Requirements
2012 2013 2014 Current 2015 Forecast 2016
Trucking Requirements
50 80 88 100 120
Increase in Demand Year on Year
60% 10% 13.60% 20%
Strategic Business Units (SBUs) Serviced
Masarap Masarap Masarap Masarap Masarap
Sariwa Sariwa Sariwa Sariwa Sariwa
Chicharon Chicharon Chicharon Chicharon
Chix BBQ Chix BBQ Chix BBQ
Mang Turon Mang Turon
Pinoy Burger
Currently, the fleet totals to 90 trucks. This number of trucks is not even sufficient to accommodate the average expected trucking requirements for 2015.
Overall, MFC Group is forecasting a 20% growth for all its brands in terms of sales and number of stores opening, which is in accordance with MFC’s vision for year 2020. Relatively, with this forecasted growth, the number of trucking requirement is also expected to increase by 20%.
Problem
Currently, DWS has 90 trucks provided by its accredited trucking service partners. Table 2 shows the breakdown of the number of trucks according to the color of plates and number of years in use.
Table 2. Breakdown of the Number of Trucks According to Plate Colors and Years Used
PlateGreater than 15
Years15 Years Less than
15 years Total
Green 17 4 38 59
Yellow 14 1 16 31Total 31 5 54 90

82TECHNE ATENEO STUDENT BUSINESS REVIEW
Due to government mandate, Land Transportation Franchising and Regulatory Board (LTFRB) regulates that only yellow-plate trucks that are used for less than 15 years will be allowed to transport goods.
Carriers, also known as common carriers, that offer their services to the general public for a fee are classified as public utility vehicles and are required to use yellow plates. However, private vehicles that can refuse carriage to the general public and usually carrying only their own cargo can use green plates. Because of the nature of their business that involves the public, common carriers are more regulated than private carriers.
Only 60% of the existing fleet of MFC’s trucks are less than 15 years. Out of this, only 30% have yellow plates. Thus, only 16 trucks can be ideally used by DWS for its operations. This is only 16% of the total number of trucks required by MFC for 2015 and only 13% of the forecasted requirement for 2016.
Given this data, DWS is in need of additional 104 trucks to meet the forecasted increase in demand for 2016.
What are the feasible options for DWS? How can the company meet the trucking service demand for 2016 with the least cost possible?
Areas for Consideration
High Capitalization
Even though DWS has a stable pool of trucking service partners, the immediate need for 104 trucks would mean high investment on the part of truckers.
Upon checking with the truckers, not one has the capacity to provide 104 trucks immediately, even if they reallo-cate to DWS their existing trucks from other clients. In addition, the truckers do not have the financial capacity to purchase either used or brand new trucks with that quantity.
Upon checking, the cost of a brand new truck is around PHP1,200,000 (VAT in) with three years warranty. Salvage value is approximately at PHP845,000 after five years of
use. Similarly, used trucks that have been used for five years, will cost approximately PHP845,000.
Space
A fleet of 104 trucks would require a big space. Although DWS has a relatively big and not yet fully utilized area, it can only allow trucks currently queuing for loading and unloading. Parking of trucks within the DWS compound will greatly affect the receiving and dispatching turn-around time.
Expertise on Truck Management
DWS specializes on warehouse management and has no expertise on truck management. Thus, the trucking service is outsourced to accredited and reliable trucking service agencies. DWS also relies on trucking service agen-cies’ knowledge on best routes and traffic rules (such as truck ban window, truck lanes, loading capacities, etc.) for its current in-store distribution activities. Similarly, DWS expects from the truckers the maintenance and repairs of trucks as their core competence.
On the other hand, the immediate need for trucks requires fleet management experience. Hiring new personnel with truck management experience or training existing ones will not meet the urgency of the need.
In addition, IT infrastructure should also be in place to support such operations. Given the recent migration of the whole MFC Group to SAP, another system that would monitor and manage these trucks is not being considered in terms of cost, manpower, and knowledge transfer.
Current Costs for Trucking Services
Based on historical data, existing trucks average four roundtrips in a day and operates 312 days in a year (out of 365 days). Table 3 shows the current cost of trucking services paid to existing truckers. The existing trucks are four-wheeler closed vans for security and avoidance of traffic restrictions.
The estimated repair and maintenance cost is based on the usage days of a truck (312 days) while the manpower + service fee is based on the number of trips in a year (312

83FLEET MANAGEMENT
days x 4 trips/day). Both these costs are annualized and rounded off. Administrative expenses are already annual in nature.
Alternative Courses of Action
Given the above considerations, three feasible courses of action were identified. Each course of action is evaluated using the net present value method (NPV) or total cost approach to determine whether to lease or buy trucks.
Using the total cost approach, all costs including the annual service fee common to all alternatives will be included. The annual service fee covers actual manpower costs of the logistics provider plus 30%. The 30% markup of manpower costs covers indirect costs, administra-tive costs, and the profit margin of the logistics service provider.
The discounting rate used is 10%, similar to the growth rate expected by MFC as mentioned earlier.
Option 1: DWS to Purchase Used Trucks to be Managed by Truckers
The following are the pros and cons of purchasing used trucks. Although these trucks will be owned by DWS, manpower and management will be taken care of the truckers.
Pros:1. Lower capital investment. The projected invest-
ment is around PHP845,000.2. Lower depreciation, if not fully depreciated3. There is no need for yellow plates since the trucks
are owned by DWS and will service only MFC.
Cons:1. Manufacturer’s warranty is already used up.2. There is a possible history of major accident.3. Less reliability because of high probability of
Table 3. Estimated Cost of Trucking Services, in Pesos
Annual Cost
Repairs & Maintenance
200,000
Tires
Batteries
Change Oil &Filter
Tune Up / Calibration
Admin+Others
80,000Vehicle Insurance
Road Taxes
LTFRB
Manpower + Service Fee 2,080,000
Driver Rate 800,000
Helper Rate 800,000
Total 1,600,000
30% Service Fee 480,000 TOTAL 2,360,000

84TECHNE ATENEO STUDENT BUSINESS REVIEW
breakdown; high maintenance cost4. Lower resale value5. Outdated safety features6. Probably has “mestizo parts” or parts that are
not original and maybe a combination of various brands
7. Older units will most likely fail emission tests.
In terms of cost, Table 4 shows the computation of the cash flow per truck for this option. The total expected cash out will be PHP9.79 million per truck for the next five years. Repairs and maintenance are assumed to be 1.5 times the cost of maintaining brand new trucks since the frequency is expected to be almost doubled given that the trucks are old.
Table 4. NPV Cost Computation for Purchasing Used Trucks
VALUE WHEN 0 1 2 3 4 5
Purchase Value 845,000 Now (845,000)
Annual Service Fee
2,080,000 Now - 5 Years
(2,080,000) (2,080,000) (2,080,000) (2,080,000) (2,080,000)
Annual Repairs & Maintenance + Admin Expenses
280,000 1 - 5 Years
(280,000) (280,000) (280,000) (280,000) (280,000)
Salvage Value No Salvage Value
Cash Flow (845,000) (2,360,000) (2,360,000) (2,360,000) (2,360,000) (2,360,000)
10% Factor 1.000 0.909 0.826 0.751 0.683 0.621
Present Value (845,000) (2,145,240) (1,949,360) (1,772,360) (1,611,880) (1,465,560)
Net Present Value (9,789,400)
Option 2: DWS to Purchase New Trucks to be Managed by Truckers
The pros and cons if new trucks will be purchased are:
Pros:1. Ownership and operation of the truck is with MFC
group, thus, it will be exclusively used for MFC.2. There is no need for yellow plate since the trucks
are owned by MFC and services only MFC.3. Lower cost for maintenance as compared to used
trucks
Cons:1. MFC will shoulder the cost of repair and main-
tenance since the trucker will only provide manpower services.
2. Since the trucks are under the name of MFC, any liability from accident will be accounted to MFC.
3. The depreciation of the units is with MFC group
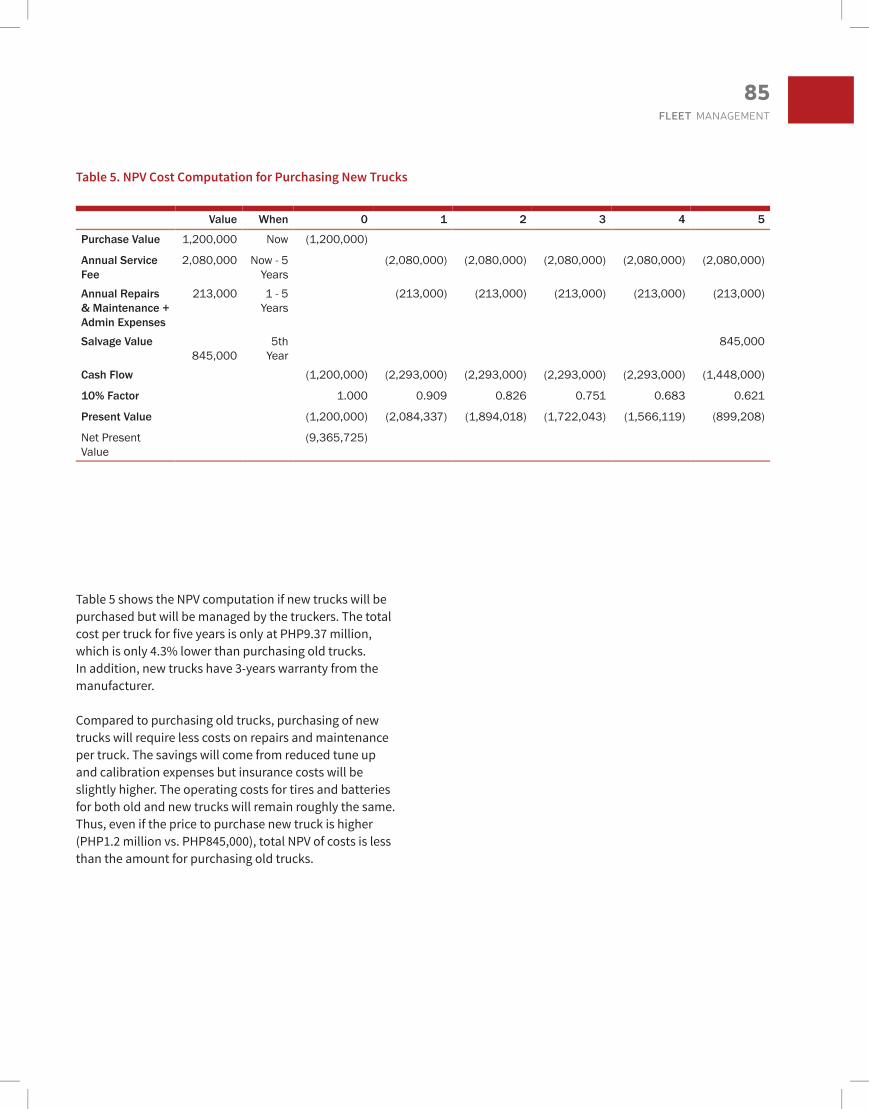
85FLEET MANAGEMENT
Table 5. NPV Cost Computation for Purchasing New Trucks
Value When 0 1 2 3 4 5
Purchase Value 1,200,000 Now (1,200,000)
Annual Service Fee
2,080,000 Now - 5 Years
(2,080,000) (2,080,000) (2,080,000) (2,080,000) (2,080,000)
Annual Repairs & Maintenance + Admin Expenses
213,000 1 - 5 Years
(213,000) (213,000) (213,000) (213,000) (213,000)
Salvage Value 845,000
5th Year
845,000
Cash Flow (1,200,000) (2,293,000) (2,293,000) (2,293,000) (2,293,000) (1,448,000)
10% Factor 1.000 0.909 0.826 0.751 0.683 0.621
Present Value (1,200,000) (2,084,337) (1,894,018) (1,722,043) (1,566,119) (899,208)
Net Present Value
(9,365,725)
Table 5 shows the NPV computation if new trucks will be purchased but will be managed by the truckers. The total cost per truck for five years is only at PHP9.37 million, which is only 4.3% lower than purchasing old trucks. In addition, new trucks have 3-years warranty from the manufacturer.
Compared to purchasing old trucks, purchasing of new trucks will require less costs on repairs and maintenance per truck. The savings will come from reduced tune up and calibration expenses but insurance costs will be slightly higher. The operating costs for tires and batteries for both old and new trucks will remain roughly the same. Thus, even if the price to purchase new truck is higher (PHP1.2 million vs. PHP845,000), total NPV of costs is less than the amount for purchasing old trucks.

86TECHNE ATENEO STUDENT BUSINESS REVIEW
Option 3: DWS to Purchase New Trucks, Lease to Own By Truckers
Another option is for DWS to initially purchase the units on behalf of the truckers. The truckers will then amortize the units so they can own them after five years. Here are the pros and cons:
Pros:1. Ownership is with MFC and is leased by the
trucker.2. Ownership will be transferred to the trucker after
five years.3. The trucker pays amortization to DWS.4. Repair and maintenance will be to the account of
the trucker as a lessee. 5. There is no need for yellow plate since the trucks
are owned by MFC and services only MFC.6. The quality of service and maintenance of trucks
will be expected from the truckers since the units will be transferred to them eventually.
Cons:1. Since the trucks are leased, the trucker can use
the trucks for its other clients’ needs.2. Since MFC is not in the leasing business, addi-
tional permits and registrations are required.
In terms of cost as shown in Table 6, this option provides DWS the least cost per truck for the next five years—PHP8 million only. This is roughly 15% less cost compared with the second option of PHP9.37 million.
The computation of amortization is based on the standard computation with assumption that the units will be fully depreciated in five years. Interest rate used is 6% based on the initial advice of MFC Corporate Finance.
Annual repairs and maintenance will be taken care of the truckers. No salvage value will then be realized since the units will be owned by the truckers after five years.
Value When 0 1 2 3 4 5
Purchase Value 1,200,000 Now (1,200,000)
Annual Amortization
284,584 284,584 284,584 284,584 284,584 284,584
Annual Service Fee
2,080,000 Now - 5 Years
(2,080,000) (2,080,000) (2,080,000) (2,080,000) (2,080,000)
Annual Repairs & Maintenance + Admin Expenses
c/o Trucker
Salvage Value 650,000 5th Year
Cash Flow (1,200,000) (1,795,416) (1,795,416) (1,795,416) (1,795,416) (1,795,416)
10% Factor 1.000 0.909 0.826 0.751 0.683 0.621
Present Value (1,200,000) (1,632,033) (1,483,014) (1,348,357) (1,226,269) (1,114,953)
Net Present Value
(8,004,627)
Table 6. NPV Cost Computation for New Trucks Acquired on Lease to Own

87FLEET MANAGEMENT
Recommendation
Given the evaluation above, it is recommended that DWS takes Option 3 for the following reasons:
1. It offers the least cost per truck for the next five years.
2. It does not give DWS responsibility over repairs and maintenance which is not its core competence.
3. Truckers are expected to deliver the same quantity of service and to maintain the trucks since eventu-ally, ownership will be transferred to them.
However, using this option leaves risk on the part of DWS in terms of exclusivity of truck use. Since the truckers are leasing to own the units, they can use the trucks for their other clients. To arrest this concern, DWS needs to include exclusivity clauses in the contract.
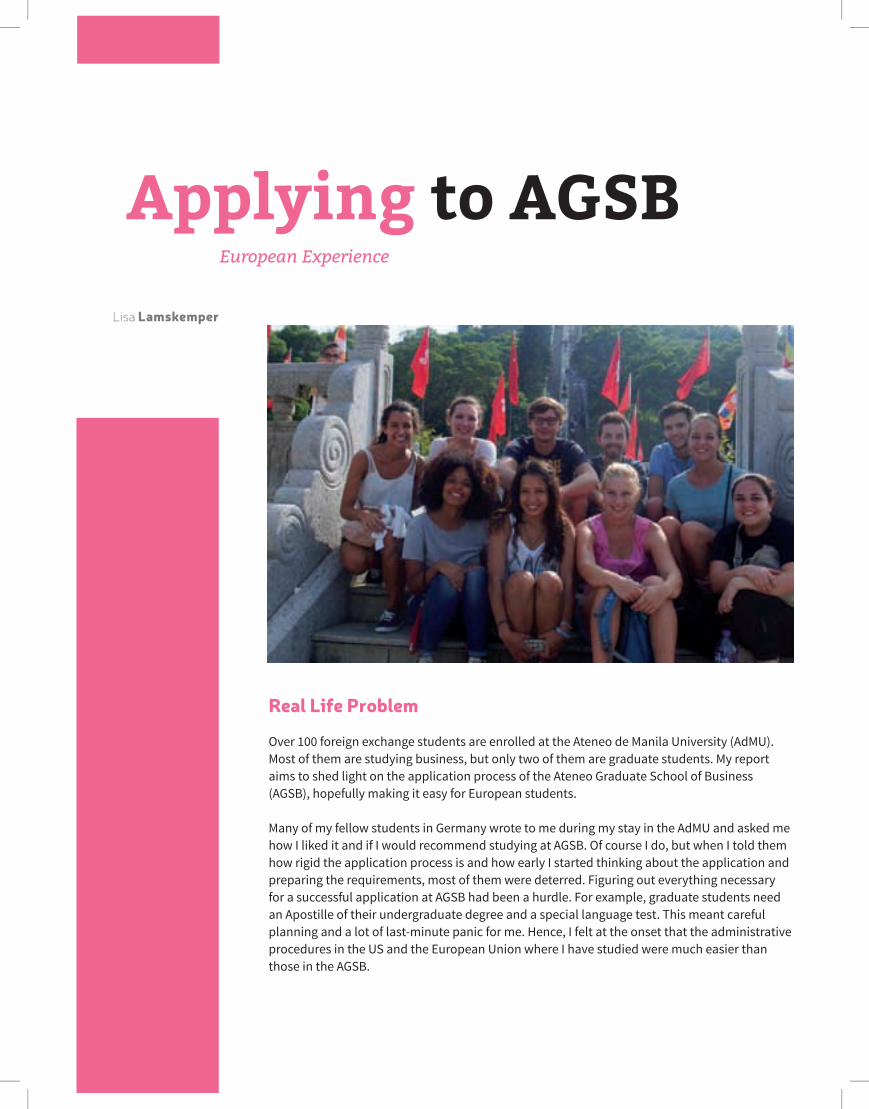
Real Life Problem
Over 100 foreign exchange students are enrolled at the Ateneo de Manila University (AdMU). Most of them are studying business, but only two of them are graduate students. My report aims to shed light on the application process of the Ateneo Graduate School of Business (AGSB), hopefully making it easy for European students.
Many of my fellow students in Germany wrote to me during my stay in the AdMU and asked me how I liked it and if I would recommend studying at AGSB. Of course I do, but when I told them how rigid the application process is and how early I started thinking about the application and preparing the requirements, most of them were deterred. Figuring out everything necessary for a successful application at AGSB had been a hurdle. For example, graduate students need an Apostille of their undergraduate degree and a special language test. This meant careful planning and a lot of last-minute panic for me. Hence, I felt at the onset that the administrative procedures in the US and the European Union where I have studied were much easier than those in the AGSB.
Applying to AGSBLisa Lamskemper
European Experience

89APPLYING TO AGSB
Additionally, there are international exchange students who study at a graduate level in their home countries, but take undergraduate classes at the Ateneo. They told me accordingly that the information provided by AGSB was not as clear and as comprehensive as that of the under-graduate admissions. This paper, however, will focus only on the application process for AGSB.
Project management techniques like network diagram, critical path analysis, and cost of crashing project times are used to highlight how much time European students should allot in planning for their semester abroad and how much money they will spend on it.
The analysis is based on the information provided in the Ateneo de Manila University Information Sheet (later
revised as AGSB Fact Sheet) handed out to all students after they received their nomination email from AdMU. Interspersed as well are interpretations and explanations based on my own research, observation, and experience.
Information Given
The documents on Student Exchange Application Requirements (as shown in Figure 1), Office Semester Dates (Figure 2), Student Exchange Application Deadlines (Figure 3), Exchange Program-related Information (Figure 4), and Applying for a Visa (Figure 5) obtained from the university served as the primary sources for identifying the main activities and milestones.
Figure 1. Student Exchange Application Requirements

90TECHNE ATENEO STUDENT BUSINESS REVIEW
Project Management
Setting Milestones
The first milestone is set to “Submission of Application Documents.” It is determined to be 14 days prior to the official application deadline.
The second milestone can be defined as “Obtaining 59 Multiple-entry Visas to the Philippines” which should be done before the flight to Manila goes off. Usually, one has to be in Manila for the enrollment seven days preceding the start of the term.
Consequently, the finish dates for the milestones will be
set at these days and the steps in reaching these mile-stones have to be planned around them.
Milestone: Submission of Application Documents
The following documents are needed for a successful application at AGSB:
1. Graduate application form
The form includes information about the appli-cant’s education, the courses he/she wishes to take, and the motivation for studying. It will take approximately three days to familiarize oneself
Figure 2. Office Semester Dates
Figure 3. Student Exchange Application
Deadlines

91APPLYING TO AGSB
with the course schedule (http://www.gsb.ateneo.edu/grad-programs/standard-mba-pro-gram) and to fill out the form.
2. Authenticated by the Philippine Embassy:a. Bachelor’s degree transcript of records
(TOR) in the native language and English translation
b. Certificate of graduation/diploma in the native language and English translation
The Philippine Embassy authenticates only docu-ments previously authenticated by the regional government, which on its behalf only authen-ticates original copies signed by the certified contact person at the applicant’s home univer-sity. These steps can be accomplished by mail. An estimate of ten working days should be allotted for processing the request for each authority involved. Additional two days should be consi-dered for shipping. The regional government and the embassy charge 20 € per copy. A special parcel carrier should be used to avoid losing or damaging the original certificate of graduation
in the mail. This will cost an additional 5 € per shipment (hence, 10 € for return).
The documents should be delivered to the right government agency and consulate. I ended up mailing it three times because the documents were not complete and the local authority was not responsible for it. The documents should be authenticated by the agency and consulate in the region where the applicant obtained his/her bachelor degree, and not in the region where he/she currently stays or in the region where the applicant’s home university is located. As in the case of Germany, the main embassy in Berlin is not responsible for it. If unsure, the applicant should contact the embassy. They usually know how to deal with these requests.
3. Current graduate school transcript of records (TOR)
The applicant should email the Students Office of his/her home university. Usually, it takes one d a y to send a PDF version of the TOR and it
Figure 4. Exchange Program-related Information

92TECHNE ATENEO STUDENT BUSINESS REVIEW
is free of charge.4. Photocopy of passport bio-page
The applicant can have this document photo-copied at any photocopying shop. It will take one day and cost around 20 cents.
5. Letter of nomination/endorsement from inter-national office (certifying that the applicant is an official exchange student from partner university).
The international office of the applicant’s univer-sity provides this letter when he/she is nominated for the study at AdMU. A quick email will help to remind the university of the nomination letter (~ one day).
6. Certificate of English language proficiency (for those whose mother tongue is not English)—any of the three below:a. TOEFL (Paper-based test) minimum score:
575b. TOEFL (Internet-based test) minimum score:
90c. IELTS minimum score of 6.5
The applicant should note that the TOEFL and IELTS results become available after at least 20 working days. The applicant may opt to review for any of these tests. An adequate preparation would be at least 14 days. The cost for the tests is approximately 200 € and the preparation book can be bought for 20 €.
7. Medical Insurance
This requirement can be easily found online. First hits at Google.com start at 60 € per month. Doing some research is ideal to be able to find a cheaper price.
8. Health certificate in the English language (stating that the applicant is fit to travel and study abroad)
All general practitioners can issue a health certi- ficate. However, since this is not an emergency, you might have to wait a week to get an appoint-ment and approximately another day for the issuance of the certificate. Most doctors charge 15 € for it (~7+1 day waiting).
Figure 5. Applying for a VISA

93APPLYING TO AGSB
9. Arrival form (with arrival details)
This form indicates the applicant’s estimated arrival time. Long-distance flights are cheapest three months prior to departure. I wanted to have an official Letter of Admission from AdMU, so I left most fields blank and sent an updated form later in the year (~0.5 days).
10. Housing/Accommodation form
This is similar to the arrival form: I decided to look for accommodation on my own since I was not ready to make earlier commitment while still in the process of applying.
11. Two (2) pieces of 2” x 2” photo
This picture size is really uncommon in Europe; it is not usually available in usual photo studios or booths. The applicant should look for a photo studio that offers American/Indian passport pictures. Approximately 5 € will be charged over and above the regular price (~15€, ~1 day).
Milestone: Obtaining a Visa
1. Valid passport (at least six months before expira-tion on the date of visa application)
The applicant can apply for a passport at a local government office. However, a 4.5 cm x 3.5 cm photograph is needed. The usual processing time is 28 days and the cost is 59 €.
2. One copy of the FA Form 2-A
This form requires the date of estimated arrival and purpose of travel, thus, the flight should be booked earlier and the applicant should have received the Official Acceptance Letter (~0.5 days).
3. One photograph taken in the last six months (4.5 cm x 3.5 cm)
This photo can be taken at a usual photo booth
(~2.5€ , 0.5 days)
4. Copy of flight booking including return ticket
The applicant can book a flight with Philippine Airlines starting at 900 €. The applicant may need a little more time for cheaper deals (~0.5 days).
5. Proof of payment (54 €)
The payment can be transferred directly to the embassy. It will take three working days to have the payment posted in their account. The appli-cant should secure a print out of the receipt (54 €, 3 days).
It takes approximately 21 days for the embassy to process the Visa. The mailing to the embassy with insurance costs 4 € per way.
Derivation of Activities
The activities, their respective durations (in days), costs (in euros), and predecessors are put together in Table 1.
Network Diagram and Critical Path Analysis
After entering all the information in MS Project, the network diagram (Gantt Chart) and critical path analysis (with critical activities identified in red) are automatically generated, as shown in Figure 6.
Hence, the critical path is:
Confirm nomination → Prepare for test → Take test →Get graduate application form → Send bachelor certifi-cate to university→ Obtain certified copies from univer-sity → Send to local government→ Get authentication by regional government → Send to embassy → Obtain accreditation by embassy → Transfer all documents to international office → Obtain official letter of accep-tance → Book flights →Get proof of payment → Send to embassy→ Obtain visa
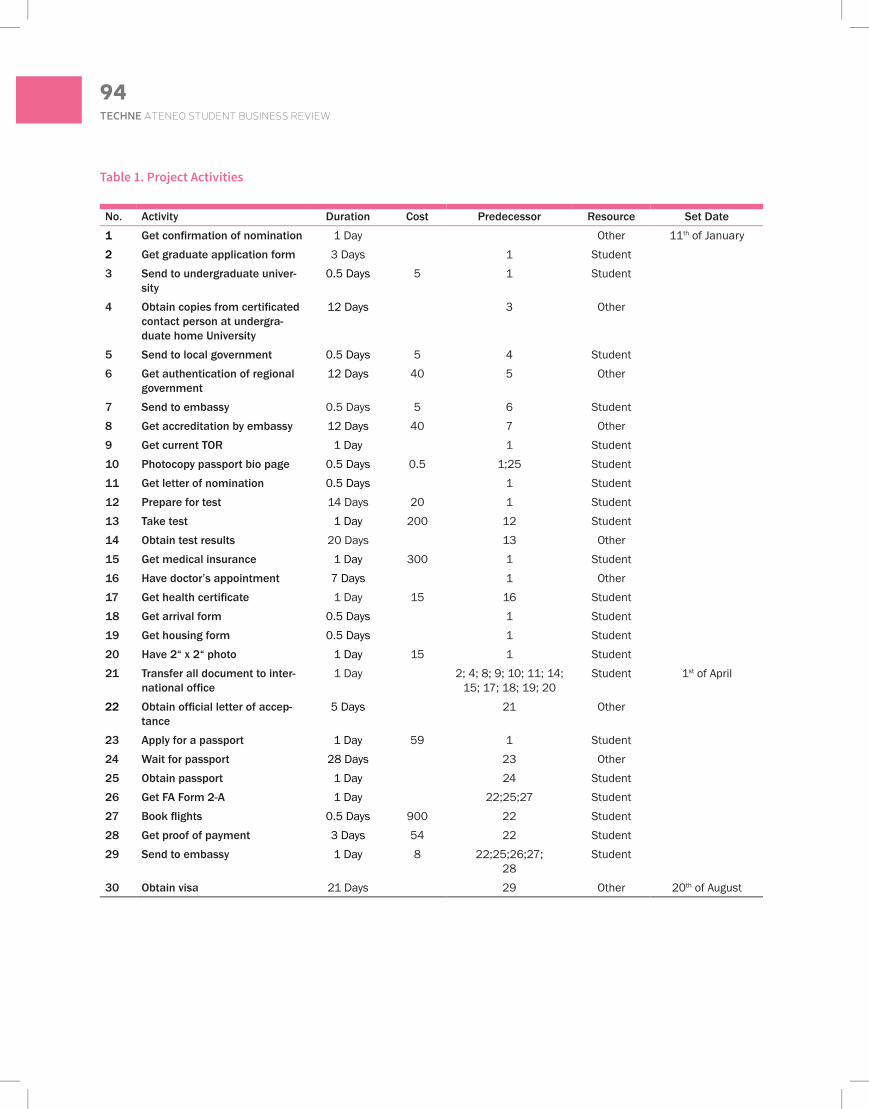
94TECHNE ATENEO STUDENT BUSINESS REVIEW
Table 1. Project Activities
No. Activity Duration Cost Predecessor Resource Set Date
1 Get confirmation of nomination 1 Day Other 11th of January2 Get graduate application form 3 Days 1 Student3 Send to undergraduate univer-
sity0.5 Days 5 1 Student
4 Obtain copies from certificated contact person at undergra-duate home University
12 Days 3 Other
5 Send to local government 0.5 Days 5 4 Student6 Get authentication of regional
government12 Days 40 5 Other
7 Send to embassy 0.5 Days 5 6 Student8 Get accreditation by embassy 12 Days 40 7 Other9 Get current TOR 1 Day 1 Student10 Photocopy passport bio page 0.5 Days 0.5 1;25 Student11 Get letter of nomination 0.5 Days 1 Student12 Prepare for test 14 Days 20 1 Student13 Take test 1 Day 200 12 Student14 Obtain test results 20 Days 13 Other15 Get medical insurance 1 Day 300 1 Student16 Have doctor’s appointment 7 Days 1 Other17 Get health certificate 1 Day 15 16 Student18 Get arrival form 0.5 Days 1 Student19 Get housing form 0.5 Days 1 Student20 Have 2“ x 2“ photo 1 Day 15 1 Student21 Transfer all document to inter-
national office1 Day 2; 4; 8; 9; 10; 11; 14;
15; 17; 18; 19; 20Student 1st of April
22 Obtain official letter of accep-tance
5 Days 21 Other
23 Apply for a passport 1 Day 59 1 Student24 Wait for passport 28 Days 23 Other25 Obtain passport 1 Day 24 Student26 Get FA Form 2-A 1 Day 22;25;27 Student27 Book flights 0.5 Days 900 22 Student28 Get proof of payment 3 Days 54 22 Student29 Send to embassy 1 Day 8 22;25;26;27;
28Student
30 Obtain visa 21 Days 29 Other 20th of August
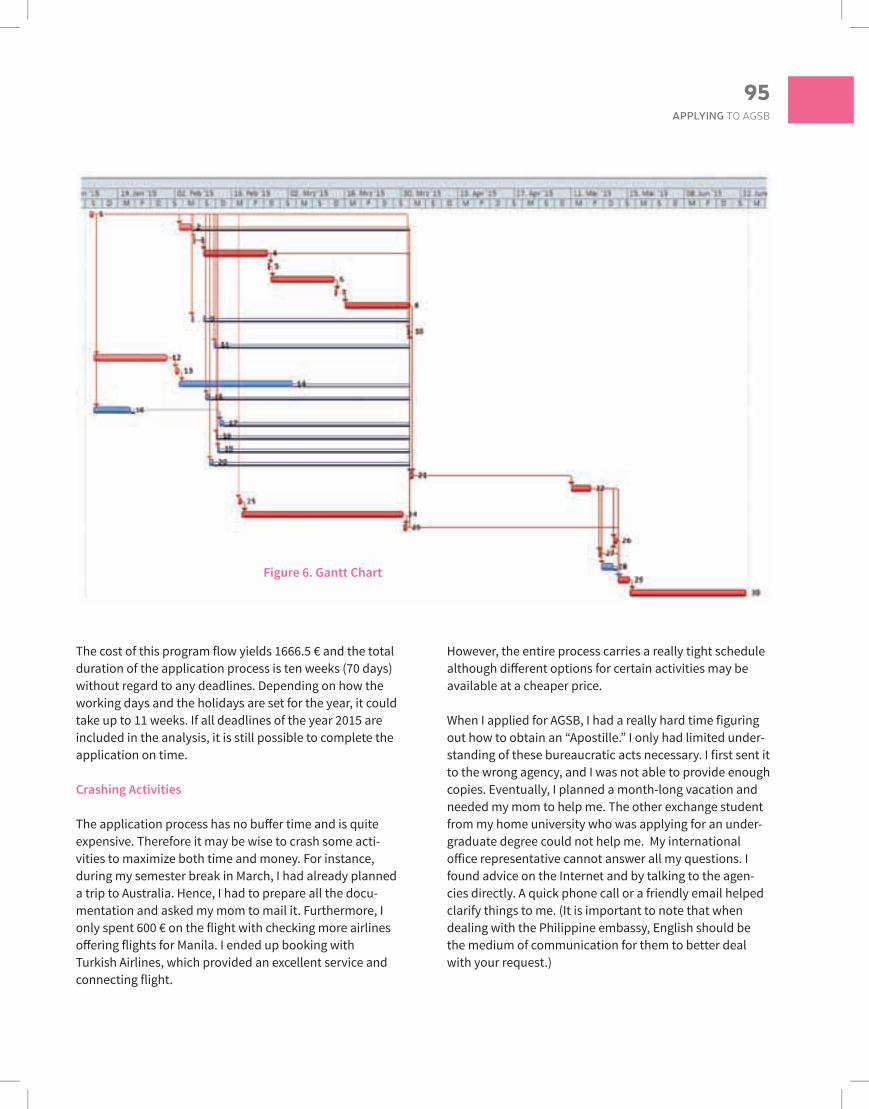
95APPLYING TO AGSB
The cost of this program flow yields 1666.5 € and the total duration of the application process is ten weeks (70 days) without regard to any deadlines. Depending on how the working days and the holidays are set for the year, it could take up to 11 weeks. If all deadlines of the year 2015 are included in the analysis, it is still possible to complete the application on time.
Crashing Activities
The application process has no buffer time and is quite expensive. Therefore it may be wise to crash some acti- vities to maximize both time and money. For instance, during my semester break in March, I had already planned a trip to Australia. Hence, I had to prepare all the docu-mentation and asked my mom to mail it. Furthermore, I only spent 600 € on the flight with checking more airlines offering flights for Manila. I ended up booking with Turkish Airlines, which provided an excellent service and connecting flight.
However, the entire process carries a really tight schedule although different options for certain activities may be available at a cheaper price.
When I applied for AGSB, I had a really hard time figuring out how to obtain an “Apostille.” I only had limited under-standing of these bureaucratic acts necessary. I first sent it to the wrong agency, and I was not able to provide enough copies. Eventually, I planned a month-long vacation and needed my mom to help me. The other exchange student from my home university who was applying for an under-graduate degree could not help me. My international office representative cannot answer all my questions. I found advice on the Internet and by talking to the agen-cies directly. A quick phone call or a friendly email helped clarify things to me. (It is important to note that when dealing with the Philippine embassy, English should be the medium of communication for them to better deal with your request.)
Figure 6. Gantt Chart
96TECHNE ATENEO STUDENT BUSINESS REVIEW
1. Authenticated by the Philippine Embassy:a. Bachelor’s degree transcript of records
(TOR) in the native language and English translation
b. Certificate of graduation/diploma in the native language and English translation
This activity can be fast-tracked. The applicant can always get the authenticated copies perso- nally at the undergraduate university, regional government, and embassy. Each will only take a day. The cost, however, will increase since one has to buy a train ticket to cross the country. Each ticket (back and forth) will cost approximately 150 €.
On my end, however, the authentication process was the most convenient since my bachelor’s university and local government are based in the same city. Although it was more costly, I went to some of the agencies personally.
2. Certificate of English language proficiency (for those whose mother tongue is not English)—any of the three below:a. TOEFL (Paper-based test) minimum score:
575b. TOEFL (Internet-based test) minimum score:
90c. IELTS minimum score: 6.5
The applicant can speed up the preparation for the test by taking a preparation course. This will only take one week and costs around 200 €. The results may vary according to one’s prior knowl-edge of the English language.
3. Medical insurance
If further research is done, the applicant can find offers starting from 40 € per month. Finding these offers will take you at least five days.
4. Valid passport (for at least sixmonths)
The applicant can apply for the faster processing of a passport. This will cost 91 €. The passport will be ready in three days.
5. Copy of flight booking including return ticket
With a little more research, the applicant can find a flight for 600 €. However, this will take seven days. I recommend Turkish Airlines which provided me with an excellent service for the cheapest price.
Additionally, one can apply for a visa directly at the embassy. It will only take one day. The costs yield 150 € for the train ticket and 54 € for the payment. The embassy or consulate responsible for the visa application is the region as indicated in one’s ID.
The result of crashing is shown in Table 2 and the resulting revised Gantt Chart is shown in Figure 7.
If one needs to save some time, the easiest way is to crash the activity that has the best cost/time relationship. Therefore, the cost that occurred will be divided by the time crashed. The activity on the critical path that has the lowest cost-time ratio should be crashed. In this case, it is the preparation for test. The activities for crashing must be limited to those on the critical path.
It is also possible to save some money by doing more research on medical insurance and flight booking. A wider research enables one to find cheaper flights. Both activ-ities are not on the critical path and since there is some extra time, one should take advantage of it by doing more research.
As already stated, I saved some time by directly going to the local authorities to obtain the Apostille from my bachelor’s degree. This time, however, was used up when I sent incomplete copies (of the Apostille, etc.) to the wrong consulate. I believe that the train ticket to the consulate was a good investment which saved me some time and nerves.
Recommendations
I strongly recommend my fellow students to apply to AGSB. I hope I am able to clarify the application process for them. The different forms to submit and the different information to provide could be overwhelming. This list

97APPLYING TO AGSB
Table 2. Crashed Project
No. New No.
Activity Duration, Days
Cost, Euro
Crashed Cost
Crashed Duration
Ratio
1 1 Get confirmation of nmination 1
2 2 Get graduate application form 3
3 Send to undergraduate university 0.5 5
4 Obtain copies from certificied contact person at undergraduate home university
12
3+4 3 Obtain undergraduate copy 150 1 150
5 Send to local government 0.5 5
6 Authentication of regional government 12 40 190
5+6 4 Obtain authentication by regional government 190 1 7 Send to embassy 0.5 5
8 Get accreditation by embassy 12 40
7+8 5 Obtain red ribbon by the embassy 190 1 190
9 6 Get current TOR 1
10 7 Photocopy passport bio page 0.5 0.5
11 8 Get letter of nomination 0.5
12 9 Prepare for test 14 20 200 7 28.6
13 10 Take Test 1 200
14 11 Obtain test results 20
15 12 Get medical insurance 1 300
16 13 Have doctor’s appointment 7
17 14 Get health certificate 1 15
18 15 Get arrival form 0.5
19 16 Get housing form 0.5
20 17 Have 2“ x 2“ photo 1 15
21 18 Transfer all document to international ofice 1 22 19 Obtain official letter of acceptance 5
23 20 Apply for passport 1 59
24 21 Wait for passport 28 32 3 10.7
25 22 Obtain passport 1
26 23 Get FA form 2-A 1
27 24 Book flights 0.5 900 600 7
28 Get roof of payment 3 54
29 Send to embassy 1 8
30 Obtain visa 21
31 25 Get visa directly from embassy 204 1 204
98TECHNE ATENEO STUDENT BUSINESS REVIEW
is hopefully a good compilation of all information given by the OIR and additional data I found out. If one just sticks to it, nothing should go wrong. Nonetheless, if one has to speed up, he/she should just stick to the crashed activities. Depending on which phase one is in, different possibilities can be taken, e.g., going to the authorities by one self, applying for a fast passport/visa, etc.
The application yields an estimated cost of 1666.50 € and takes 11 weeks. Compared to applying to a partner university in Europe quite expensive. This is especially so if one is granted the ERASMUS scholarship for studying in Europe and none for going far abroad. Yet, one can save easily 400 € by doing more research on medical insurance and flight booking. One should also take into conside-ration that the cost of living in the Philippines is on average much lower than in most European countries. I believe that in total, it will end up the same. Hence, one should really take a chance and apply to AGSB since the experience one makes here is extraordinary and should not be missed.
Figure 7. Revised Gantt Chart

99APPLYING TO AGSB
Figure 7. Revised Gantt Chart
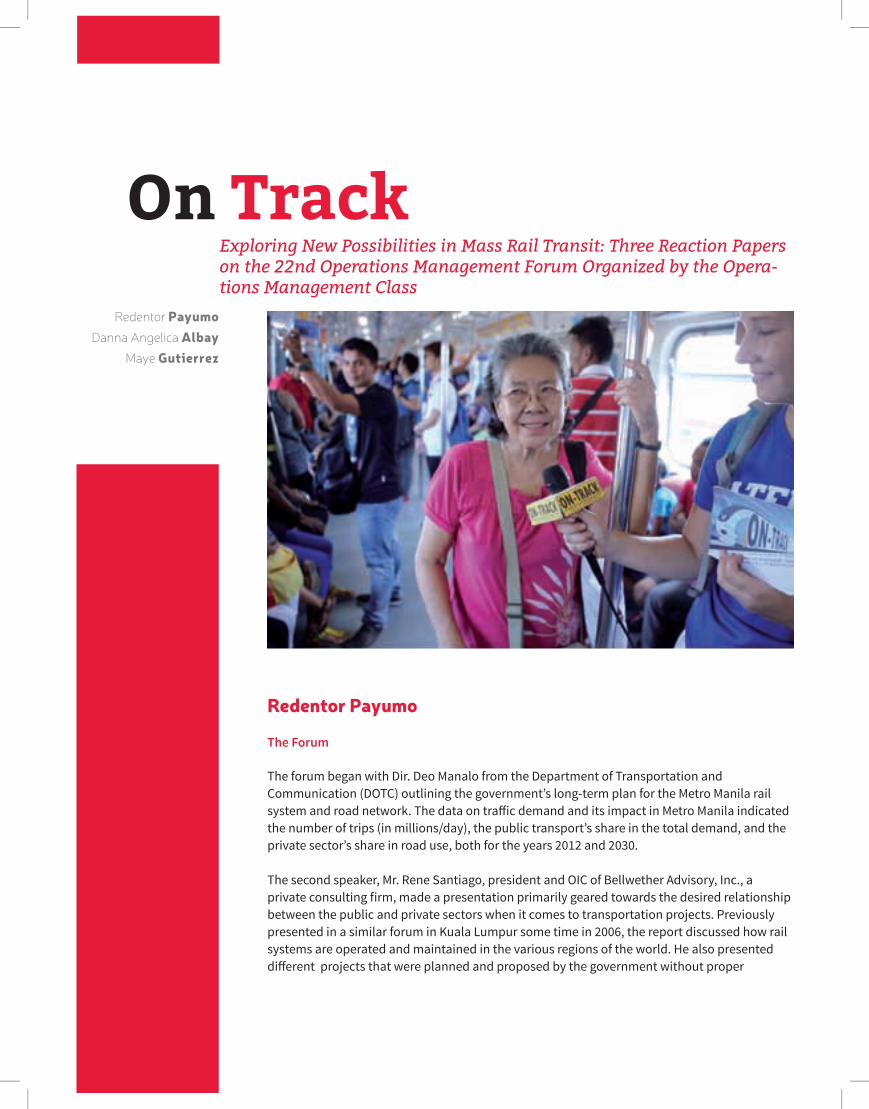
On TrackRedentor Payumo
Danna Angelica AlbayMaye Gutierrez
Exploring New Possibilities in Mass Rail Transit: Three Reaction Papers on the 22nd Operations Management Forum Organized by the Opera-tions Management Class
Redentor Payumo
The Forum
The forum began with Dir. Deo Manalo from the Department of Transportation and Communication (DOTC) outlining the government’s long-term plan for the Metro Manila rail system and road network. The data on traffic demand and its impact in Metro Manila indicated the number of trips (in millions/day), the public transport’s share in the total demand, and the private sector’s share in road use, both for the years 2012 and 2030.
The second speaker, Mr. Rene Santiago, president and OIC of Bellwether Advisory, Inc., a private consulting firm, made a presentation primarily geared towards the desired relationship between the public and private sectors when it comes to transportation projects. Previously presented in a similar forum in Kuala Lumpur some time in 2006, the report discussed how rail systems are operated and maintained in the various regions of the world. He also presented different projects that were planned and proposed by the government without proper

101ON TRACK
consultation and explained how the government missed a lot of opportunities by simply failing to take action and implement them. Mr. Santiago concluded his presenta-tion by stressing that the public and private sectors have to take a cooperative stand to address the problem of Philippine transportation, specifically the rail system.
The panel session that followed showed the volume of knowledge acquired by Mr. Boo Chanco on transportation issues, having observed the problem for many years and writing about them in his columns. I personally noticed the inability of the DOTC representative to effectively respond to the questions raised. It showed the help-lessness of the government as a whole when it comes to deciding on the implementation of developmental projects.
Deputy Director-General Rolando Tungpalan of the National Economic Development Authority (NEDA) confirmed the completion of feasibility studies for various road projects but expressed that the problem is always in the implementation phase.
The Applications
1. Modeling and Optimization. A manager always wants to choose the most effective course of action to attain the goals of the organization. In order to make a decision and to judge the effectiveness of different possible choices, the manager has to use some criterion or perfor-mance measure, the most commonly used of which is the financial consideration. Needless to say, government spending is one major issue that affects decision-making when it comes to transportation projects. All these projects go through feasibility studies. Projects costing more than PHP 1.0 billion go through NEDA’s scrutiny. In making the feasibility studies and in the review process conducted by NEDA, modeling and opti-mization can be used. This tool can be applied during the proposal of the construction of a rail station. A considerable amount of time could be devoted to gathering factual information regarding the precise location and physical char-acteristics of the structure, as well as a detailed study of the potential site and its accessibility to
the riding public. Other factors may be consid-ered such as the construction cost and the poten-tial return on investment based on the probable use of the station. After the manager has selected the critical factors or variables from the empirical situation, they are combined in a logical manner to form a model of the actual problem. Based on this model, which is a simplified representation of the empirical situation, a mathematical evalu-ation may lead to the correct decision.
2. Forecasting. In projects that involve the entire population in a certain area, in Metro Manila for example, data gathering is very important. More often than not, data for the future growth is not readily available. For instance is the information on the number of people that will be living in Metro Manila five to ten years from now. In this situation, forecasting is very essential, especially when the planned project will be completed several years in the future. If only the present data is utilized without any forecasting, it is possible that the project will not address the need by the time the project is completed.
Forecasts are essential for effective operation. They enable different parts of an organization to work together more smoothly. They may be considered inaccurate but it doesn’t make sense to keep a fixed data for future projections. The presentation by the DOTC representative indicates some data for the year 2030. This can only be derived through the tools of forecasting that use past or present data to estimate future values.
3. Program Evaluation and Review Technique/Critical Path Method (PERT/CPM). This tool is used to manage the planning and control of major projects with many separate activities that require proper sequencing and coordination. In the construction of a rail system, a number of different activities must be performed in a specified sequence with minimal effect to the activities of the people. Some of the activities may be done in a series and others in parallel. In any large complex project, the complete set of

102TECHNE ATENEO STUDENT BUSINESS REVIEW
activities usually involves a combination of series and parallel elements. As an example, probable major traffic congestion may occur during the construction of the stations if large pre-fabri-cated materials that arrived at the site cannot be fitted yet because the preceding activity is not yet completed. Projects that are badly needed by the riding public need to be completed the soonest time possible. This goal allows for less road congestion, convenience to the people, and earlier recovery of capital.
In the construction of a railway project, PERT/CPM will aid the manager in planning prior to the start of the project. It calculates the expected total amount of time it will take to complete the entire project and the amount of time that can be crashed to reduce the total construction time. PERT/CPM also highlights the bottleneck activities in the project where the manager can allocate more resources and keep a careful watch as the project progresses. This technique enables the manager to control the project once it has begun because it provides a way of monitoring progress and calling attention to the delays in activities that may move the project’s completion date.
Conclusion
While the initial reaction to the present problems of traffic and inadequate mass transportation system is blaming the large population and excessive number of private cars in Metro Manila, the forum presented some sort of enlightenment.
1. Our country has people who have the expertise to correct the problem. Sadly, they are not heard and some even opt to leave the country instead.
2. The Philippines has the tendency to be the first in many things but end up lagging behind. For example, the Philippine Airlines is Asia’s first airline to cross the Pacific and even the first to mount flights to Europe. Unfortunately, the present airport structures limit the number of flight departures and arrivals, preventing rapid
growth in the airline industry. Delays in flight schedule cost money and results in avoidable losses. The peace and order situation also adds to the woeful state of the tourism industry that could have contributed to the airline’s growth. Many nations that had observed the way the Philippines initiate projects brought their know-ledge back home. The results of these observa-tions and understanding brought about positive outcomes. We Filipinos have the knowledge but always fail to implement.
3. The Philippines has the necessary financial resources. The private sector expert indicated that DOTC holds PHP 6 billion on hand and does not know where to use it. Political issues hamper the implementation of many projects that could have solved the present problem.
4. Many opportunities are lost due to red tape and government inaction. These losses cost the government a lot of money and resources. The discussion revealed many failed biddings which caused several projects hanging and not implemented.
5. Lastly, after being told that no clear solution to the problem is in sight for the next ten years, what should an average citizen do to contribute to address the situation? Choosing the right leadership is vital. We face the present problem because of poor leadership, which is not neces-sarily due to the president but the people around him who provide incorrect information. Is leaving the country an option? For me, an average citizen can do so little, but when practiced as a group, actions may lead to something bigger. Being a disciplined road user may be one act of change as well as being continuously vigilant and involved in the development of the nation.
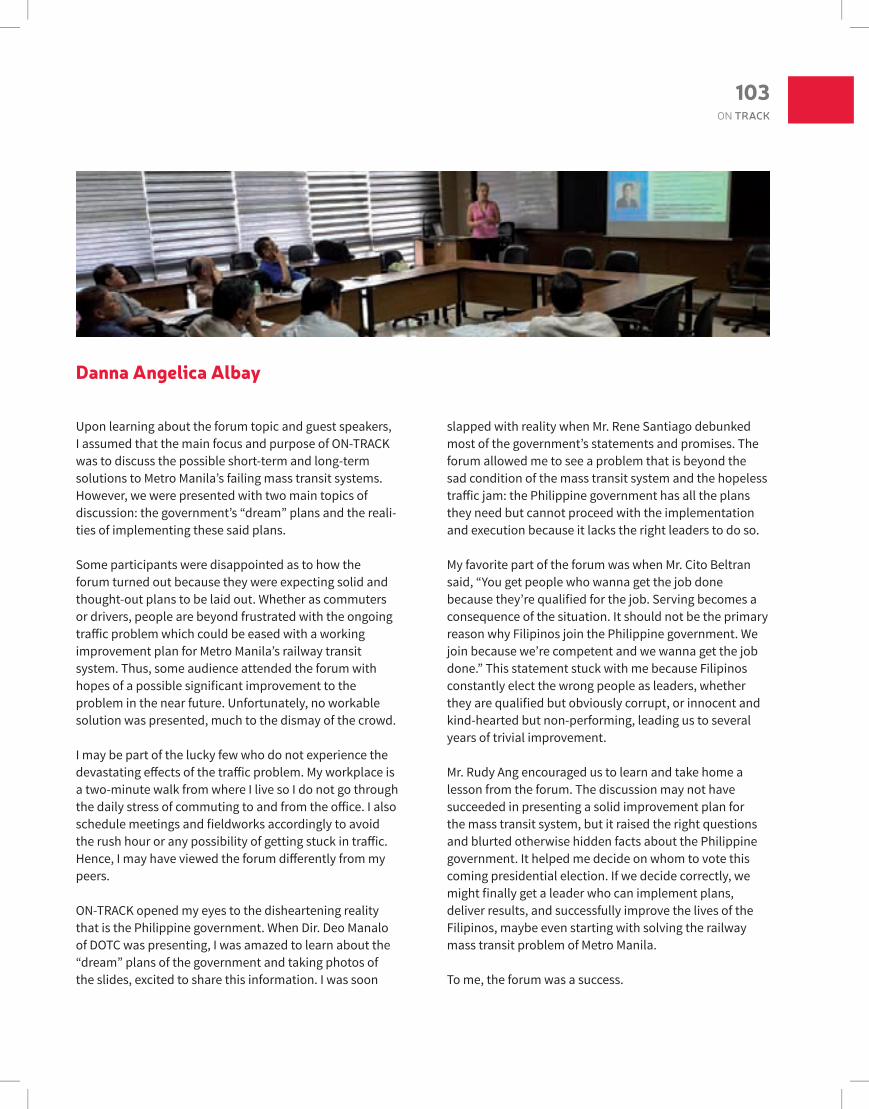
103ON TRACK
Danna Angelica Albay
Upon learning about the forum topic and guest speakers, I assumed that the main focus and purpose of ON-TRACK was to discuss the possible short-term and long-term solutions to Metro Manila’s failing mass transit systems. However, we were presented with two main topics of discussion: the government’s “dream” plans and the reali-ties of implementing these said plans.
Some participants were disappointed as to how the forum turned out because they were expecting solid and thought-out plans to be laid out. Whether as commuters or drivers, people are beyond frustrated with the ongoing traffic problem which could be eased with a working improvement plan for Metro Manila’s railway transit system. Thus, some audience attended the forum with hopes of a possible significant improvement to the problem in the near future. Unfortunately, no workable solution was presented, much to the dismay of the crowd.
I may be part of the lucky few who do not experience the devastating effects of the traffic problem. My workplace is a two-minute walk from where I live so I do not go through the daily stress of commuting to and from the office. I also schedule meetings and fieldworks accordingly to avoid the rush hour or any possibility of getting stuck in traffic. Hence, I may have viewed the forum differently from my peers.
ON-TRACK opened my eyes to the disheartening reality that is the Philippine government. When Dir. Deo Manalo of DOTC was presenting, I was amazed to learn about the “dream” plans of the government and taking photos of the slides, excited to share this information. I was soon
slapped with reality when Mr. Rene Santiago debunked most of the government’s statements and promises. The forum allowed me to see a problem that is beyond the sad condition of the mass transit system and the hopeless traffic jam: the Philippine government has all the plans they need but cannot proceed with the implementation and execution because it lacks the right leaders to do so.
My favorite part of the forum was when Mr. Cito Beltran said, “You get people who wanna get the job done because they’re qualified for the job. Serving becomes a consequence of the situation. It should not be the primary reason why Filipinos join the Philippine government. We join because we’re competent and we wanna get the job done.” This statement stuck with me because Filipinos constantly elect the wrong people as leaders, whether they are qualified but obviously corrupt, or innocent and kind-hearted but non-performing, leading us to several years of trivial improvement.
Mr. Rudy Ang encouraged us to learn and take home a lesson from the forum. The discussion may not have succeeded in presenting a solid improvement plan for the mass transit system, but it raised the right questions and blurted otherwise hidden facts about the Philippine government. It helped me decide on whom to vote this coming presidential election. If we decide correctly, we might finally get a leader who can implement plans, deliver results, and successfully improve the lives of the Filipinos, maybe even starting with solving the railway mass transit problem of Metro Manila.
To me, the forum was a success.

104TECHNE ATENEO STUDENT BUSINESS REVIEW
Maye Gutierrez
The forum ON-TRACK (idiomatic expression meaning something is developing as expected) held last Dec. 2, 2015 were attended by guest speakers Engr. Deo Manalo, Director of the Project Development Office of the Department of Transportation and Communications (DOTC) and Mr. Rene Santiago, who is a traffic expert of Bellwether Advisory, Inc. Joining the forum were Mr. Boo Chanco, a columnist of the Philippine Star and Mr. Rolando Tungpalan, Deputy Director-General for Investment Programming of the National Economic and Development Authority. The articulate Mr. Cito Beltran, a broadcast-journalist, served as the moderator of the forum.
It was obvious that Dir. Deo Manalo was nervous with his presentation. He may have learned that he will be facing Mr. Santiago, the pessimistic soothsayer. Dir. Manalo spoke well but Mr. Santiago was on a more aggressive stance. I found Mr. Beltran’s comment to be true that in forums like this, the government doesn’t normally send representatives knowing that they will always be on the losing end of a debate. Thus, I congratulate Dir. Manalo for his courage in joining the forum.
The goal of the national government through the LRT and MRT authority is to provide the public with an alternative means of transportation which should result in less traffic congestion on the roads, reduction in air pollution, and a cleaner environment. It should also offer considerable savings in traveling time, great economic benefits, and a
higher quality life for commuters. However, it looks like the focus has been lost along the way…
Many topics in management science can be applied in this activity.
PERT/CPM’s strength is the ability to calculate the exact amount of time it takes to accomplish a project. It provides managers with a schedule in which the project should be completed, based on the total of all minimum and maximum time limits for all activities.
In constructing a rail, multiple agencies are involved per activity. Among the initial activities would be: drafting an implementation plan; revising the plan at appropriate times in light of actual operations; securing funding for road facility planning; design and construction based on access need; and creating an intelligent transportation development system development, among others.
I find it crucial to personally talk to each department in case slashing of an activity is planned. Sadly, it is not an easy thing to do due to bureaucracy in the government.
FORECASTING is the act of predicting a business activity for a future period of time by gathering data.
It has been forecasted that Metro Manila residents will have to endure massive traffic jams until 2016 as work begins on at least 15 road projects. The government

105ON TRACK
promises faster travel after 2016 and until then, we have to be patient and wait.
LINEAR OPTIMIZATION is the method to achieve the best outcome (to maximize profit or minimize cost) through a mathematical model whose requirements are represented by linear relationships.
Congested streets and traffic jams cost the country as much as PHP 2.4 billion a day in lost productivity, time, and potential income. These three things are lost and one is gained—stress!
Objective: Minimize costOne constraint: budget x <= P2.4 billion a day
QUEUEING THEORY is the mathematical study of waiting in lines or queues. In queueing theory, a model is constructed so that queue lengths and waiting time can be predicted.
The ticket queue at the train station on peak hours can extend beyond 200 m on the street below (considering that the line has already snaked down a flight of stairs to the streets). Is it possible to adjust operational procedures or station design in order to obtain more efficient and responsive queue management to cater to the increasing amount of passengers? How much will it cost the govern-ment to implement these changes?
MONTE CARLO SIMULATION is a computerized mathe-matical technique that allows people to account for risk in quantitative analysis and decision-making. It is a method for evaluating a deterministic model using sets of random numbers as inputs.
By using sensitivity analysis, we can create different outcomes and their corresponding chances of occurrence. DOTC and MMDA can successfully calculate the domino effect of broken rails and poorly-maintained trains. Every sustainable urban and regional infrastructure develop-ments including the MRT and LRT highly benefits from the use of Monte Carlo simulation.
MODELLING AND OPTIMIZATION is the process of choosing the best choice from a set of possible alternatives.
Many salient points are considered before a track is constructed. These considerations include the exact loca-tion where tracks are to be built, the neighborhood that can benefit or suffer from its presence, the importance it will make on the nearby establishments, and the attrac-tions and destinations of the line, among others.

Contributors Everyone in the list is taking up or has completed his/her Master’s Degree in Business Administration at the Ateneo Graduate School of Business.
Danna Angelica Albay is a brand manager based in Manila who has worked in the retail industry for over nine years. She studied AB-Organizational Communication in De La Salle University, Manila.
Carla Amado is a licensed civil engineer and presently the division manager at the First Oceanic Property Management of Megaworld.
Mark Arcaya
Gay Arles is a licensed civil engineer and presently the project engineer of a multinational company involved in engineering, procurement, constructio, and management of various business lines such as E&C, I&I, and power.
Frank Astor is a licensed accountant and auditor (CPA and CIA) presently connected with SM Prime Holdings as assistant vice president for internal audit of malls and commercial proper-ties operations.
Juliet Biglang-awa is a certified public accountant who worked with Prestige Cars Makati, D.M. Consunji, Inc., J.T. Metro Joint Venture (Dubai Metro Project), and Warner Bros. Phils. She is presently the assistant manager for general accounting of Canon Business Process Services Philippines.
Errol Stanley Bitera has more than twenty years of experience in Manufacturing Operations. He is currently the general manager for operations of GFP Micro Optics Philippines, Inc. He gradu-ated from Silliman University with a Bachelor’s degree in mechanical engineering.
Mek Bondoc is a graduate of BS in Business Administration with Major in Hotel and Restaurant Management. He was the restaurant general manager at KFC Philippines. Presently, he is the administration head of Kato Repro Biotech Center.
Dolores Chacker-Estacio is a director for operations in a leading BPO provider. She has recently been relocated to the company’s headquarters in Colorado, along with her husband and two boys. She graduated from the University of the Philippines-Manila with a Bachelor of arts degree in organizational communication in 2003 and a master’s in development communica-tion from UP Open University in 2008.

107CONTRIBUTORS
Maria Vanessa Cristi is a practicing anesthesiologist, subspecializing in neuroanesthesiology. She graduated with a bachelor of science degree in biology from the University of the Philippines-Manila, and a medical degree from the University of the Philippines College of Medicine. She is taking her MBA because she has the compelling need to understand the business of healthcare.
Anthony Edward Garcia, “Orange” to family and friends, graduated with a degree in management and economics from Ateneo de Manila University. He has extensive exposure and experience in retail, mortgage banking and finance, educational management, business and organi-zational development.
Maye Gutierrez worked as a senior ourser at Cathay Pacific Airways. Having been based in Hong Kong for over fifteen years gave her the chance to compare the local railway system to those of other countries that she has visited. She graduated from Maryknoll College (presently Miriam College) with a degree in AB Business Administration.
Ar Jacosalem is a licensed real estate broker who used to work as Group Head for Operations of Major Homes, Inc., a real estate property development company. She now manages their own property sales company, Property Basket Real Estate Brokerage, and works as a freelancer for Upwork and Konsus.
Lisa Lamskemper graduated with a double bachelor of science degrees in European business from the Muenster University of Applied Science, Germany and in accounting and economics from the University of Hull, UK. She also studied Business (M.Sc.) at the Catholic University of Eichstaett-Ingolstadt, with a focus on management science. She joined AGSB as a foreign exchange student in mid-2015.
Chickie Laurente is the marketing planning and events manager of PhilPlans First Inc. She is also the managing director of Labelle Events Management Services Inc., an events company specializing in wedding coordination services. She is a graduate of AB Communication Arts from UST.
Ryan Norman Lim is a certified public accountant (CPA) and chartered financial analyst (CFA) Level 2 Exam passer with almost ten solid years of experience in banking and corporate finance with expertise in credit risk manage-ment, financial and investment advisory, and relationship management. He is currently a credit risk officer, with rank of senior manager in United Coconut Planters Bank. He earned his bachelor of science degree in business admin-istration and accountancy from the University of the Philippines–Diliman where he graduated cum laude.
Brimen Son Majometano is currently the senior manager for business analytics of US Auto Parts, the largest online provider of aftermarket auto parts in the United States. He has eight years of solid experience in business intel-ligence, data management, and analytics. He earned his bachelor of science degree instatistics major in actua-rial science from De La Salle University, Manila, where he graduated magna cum laude; and was also recently accepted at Harvard Extension School for Professional Graduate Certificate in Data Science.
Jody James Padlan is an institutional sales trader at Philippine National Bank but he has a bachelor’s degree in education with major in English and minor in library science.
Jhoana Pascua is a CPA and CIA (Certified Internal Auditor) who works as internal audit manager at SM Prime Holdings, Inc. She is a B.S. accountancy graduate from the University of La Salette in Santiago, Isabela.
Redentor Payumo is managing flight operations policies and procedures of the Philippine Airlines. He is a B.S. mechanical engineering graduate from Mapua Institute of Technology.
Picci Posadas is a supervisor at Suyen Corporation’s Legal Department.
Gwendolyn Quinto-Ermac has a solid sales and marketing background in the hotel industry with over eighteen years of experience on the said field. She is currently the director of sales and marketing of The Richmonde Hotel Ortigas in Pasig City. She earned her bachelor of science degree in tourism from the University of the Philippines, Diliman.

108TECHNE ATENEO STUDENT BUSINESS REVIEW
Vinz Racelis presently works as a project manager at A+B Expedio Integrated Marketing. He has a degree in business administration with major in e-commerce.
Kristina Relampagos is the marketing and business development manager for Gifted.PH and managing consultant for AXA Philippines-Quezon Avenue Agency. She also worked at TNS Philippines, a market research agency, for five years after graduating from Ateneo de Manila University with a degree in AB European Studies-International Business.
Maria Corazon Reyes is a senior manager for Corporate Sales at Center for Leadership and Change, Inc. She is a certified facilitator for 7 Habits of Highly Effective People program. She also conducts programs on customer service and sales. She is a graduate of Miriam College with a degree in communication arts.
Angelo Roque earned his degree in Bachelor of Science in Electronics and Communications from De La Salle University. He now works as a data management environ-ment consultant under Continental - Temic Automotive. Prior to joining Continental, Gelo also worked for Accenture and HP specializing in software configuration management and IT support.
Bon Nelson Sibulan has almost eight solid years of experience in Sales, and currently a sales planning and admin senior manager in Tupperware Brands Philippines handling national programs for development of their top sales leaders in the field. Prior to his current role, he led the area expansion and sales force development in several parts of North and Central Luzon as a regional sales head. The early years of his career was dedicated to the Pharmaceutical Industry covering south-west Mindanao.
Andree Silvestre is a licensed civil engineer and the opera-tions manager of Actuate Builders.
Julius Torribiano is currently working as a senior account manager in a sales program at Synnex Concentrix Corporation. He has eleven years of progressive inside and outside sales and sales management experience focused on IT industry (enterprise and SMB sales) clients in the United States. He earned his Bachelor of Science degree in marketing management from San Sebastian College–Recoletos Manila.
Sheridine Crissa Yao is a full-time corporate services manager at i-Fashion Marketing Co. which she has been a part of since 2011. She obtained her degree majoring in advertising management from De La Salle University–Manila.
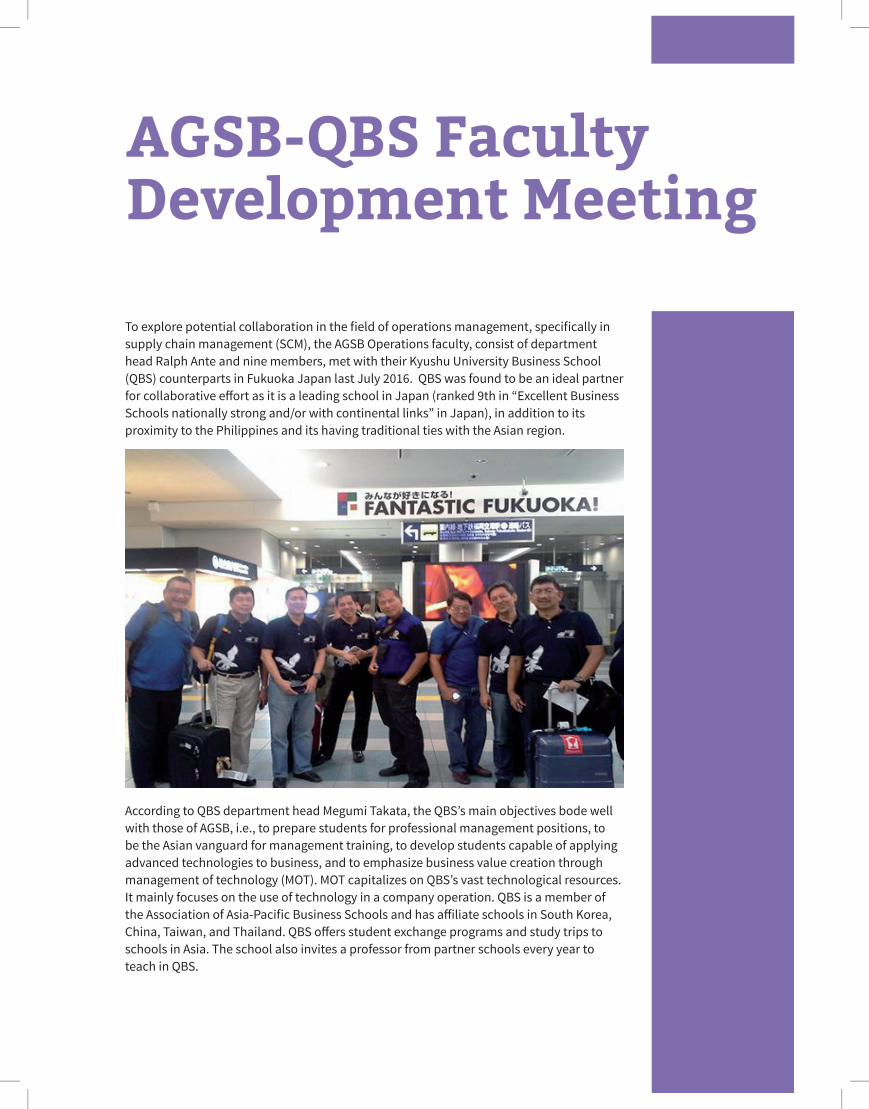
AGSB-QBS Faculty Development Meeting
To explore potential collaboration in the field of operations management, specifically in supply chain management (SCM), the AGSB Operations faculty, consist of department head Ralph Ante and nine members, met with their Kyushu University Business School (QBS) counterparts in Fukuoka Japan last July 2016. QBS was found to be an ideal partner for collaborative effort as it is a leading school in Japan (ranked 9th in “Excellent Business Schools nationally strong and/or with continental links” in Japan), in addition to its proximity to the Philippines and its having traditional ties with the Asian region.
According to QBS department head Megumi Takata, the QBS’s main objectives bode well with those of AGSB, i.e., to prepare students for professional management positions, to be the Asian vanguard for management training, to develop students capable of applying advanced technologies to business, and to emphasize business value creation through management of technology (MOT). MOT capitalizes on QBS’s vast technological resources. It mainly focuses on the use of technology in a company operation. QBS is a member of the Association of Asia-Pacific Business Schools and has affiliate schools in South Korea, China, Taiwan, and Thailand. QBS offers student exchange programs and study trips to schools in Asia. The school also invites a professor from partner schools every year to teach in QBS.

110TECHNE ATENEO STUDENT BUSINESS REVIEW
With regard to its student exchange program, QBS can accommodate two students from a foreign school per year. An existing agreement between ADMU and Kyushu University may be extended to AGSB students. The students selected by AGSB will be invited by QBS to attend MBA courses in their campus in Fukuoka. On the faculty exchange program, QBS offers an Asian univer-sity professor a chance to teach Asian Business Strategy, among other subjects, in QBS. The earliest schedule of this activity is from September 2018 to February 2019. As pointed out by QBS, in both the student and faculty possi-bilities, the main issue to be resolved is the difference in class term schedules between AGSB and QBS.
The discussions on supply chain and the possibility of establishing a master’s degree in SCM between the two schools were set for future meetings. QBS raised the effectiveness of doing this within the context of ASEAN integration although they have acknowledged that ASEAN is now more attractive than China and that the Philippines is in a good location geographically. AGSB also suggested doing possible joint research on SCM and assessment of the effects of natural disasters on supply chains.
Nagasaki is not far from Fukuoka, being just two hours away by train just a 2-hour train. From the two cities, It is inevitable to do a pilgrimage to the site of the martyrdom of Filipino saint Lorenzo Ruiz. Lorenzo became the country’s protomartyr in the 17th century. It is a fitting reminder of being men and women for others.
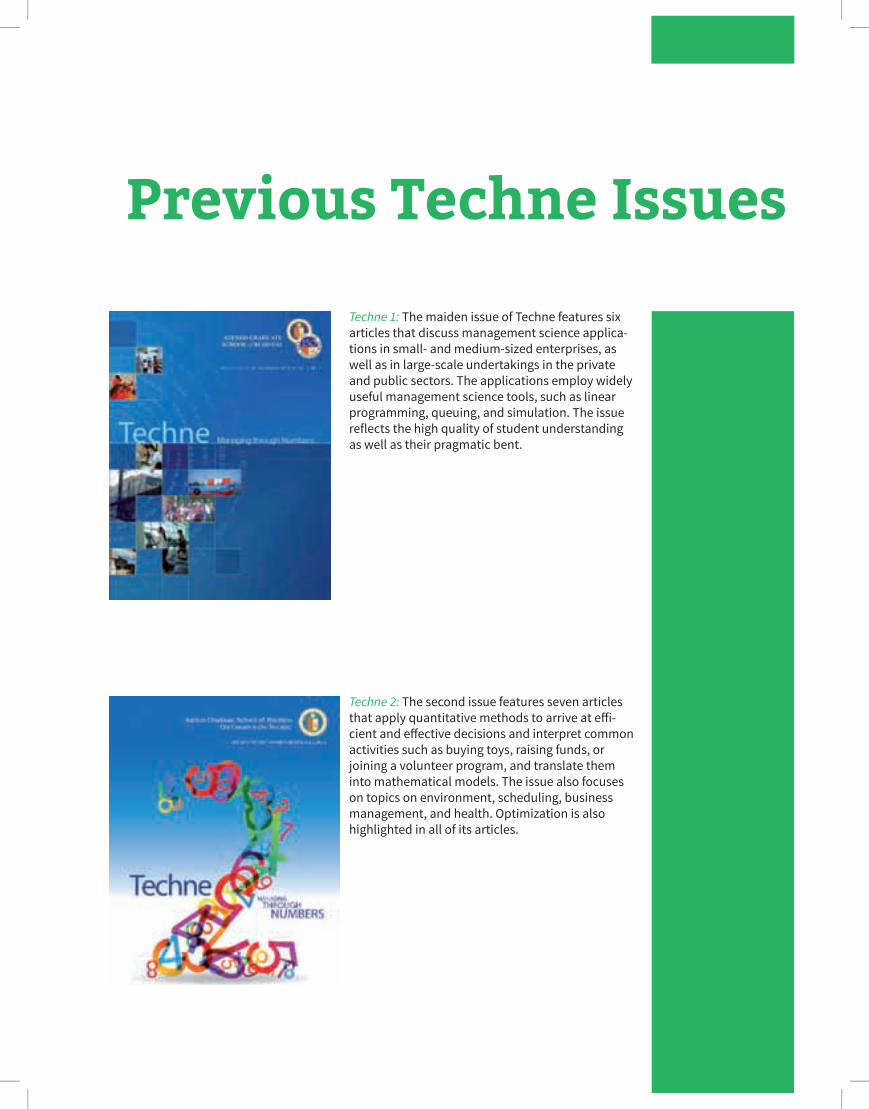
Previous Techne Issues
Techne 1: The maiden issue of Techne features six articles that discuss management science applica-tions in small- and medium-sized enterprises, as well as in large-scale undertakings in the private and public sectors. The applications employ widely useful management science tools, such as linear programming, queuing, and simulation. The issue reflects the high quality of student understanding as well as their pragmatic bent.
Techne 2: The second issue features seven articles that apply quantitative methods to arrive at effi-cient and effective decisions and interpret common activities such as buying toys, raising funds, or joining a volunteer program, and translate them into mathematical models. The issue also focuses on topics on environment, scheduling, business management, and health. Optimization is also highlighted in all of its articles.

112TECHNE ATENEO STUDENT BUSINESS REVIEW
Techne 3 and 4: The third and fourth issues combine as a double back-to-back issue with a total of 13 articles covering technical applications for large corporations, government, schools, SMEs, entrepreneurs, and CSR initia-tives. Articles discuss the best way to move people and things, reduce time, optimize resources, and justify green initiatives (the focus of Techne 3) backed by the use of mathematical tools such as Monte Carlo simulation, linear programming, linear regression, queuing models, project management, inventory management, integer program-ming, process improvement, and quality management.
Techne 5: This issue features six articles written for the operations management course with focus on systems and the goal of seeking the one best way to do things. Logi-cal processes such as fishbone diagrams, Pareto charts, poka-yokes, process flow diagrams, time and motion stud-ies, facility designs, and layouts were applied by the authors on varied scenarios that include preparing burgers and setting up a feeding program for school children, organizing career development sessions and institutionalizing enter-prise resource planning, operating a radiology department, and using biometrics.