Embed Size (px)
Citation preview

Nick van der Lijn, Faculty of Economics and Business Administration (room B420),
Tilburg University, PO Box 90153, 5000 LE Tilburg, The Netherlands; tel. + 31 13 66
3146 / 2019 (secr.) / 3145 (fax)
Measuring well-being with social indicators,HDI S, PQLI, and BWI for 133 countries
for 1975, 1980, 1985, 1988, and 1992
I. Introduction
In the 1970s there was a growing discontent with the predominant use of GNP per capita
data for measuring economic progress and human development. This discontent, which was
felt well before the 1970s (considering, for example, the UN report on the international
definition and measurement of the levels of living (United Nations 1954), and the social
indicators movement of the 1960s), was responded to through the initiation of two separate
developments. On the one hand, attempts were made to make income per capita data more
useful for international comparisons by using purchasing power adjusted real GDP per
capita figures. Substantial progress has been made in this respect. For a growing number
of countries these real GDP per capita figures are estimated and the accuracy of these
estimates is improving (see Summers and Heston 1984, 1988, 1991). On the other hand,
the importance of establishing supplementary measures to GNP per capita as a unit for
measuring development progress was recognized. In an effort to provide such an alternative
measure, Morris developed for the Overseas Development Council the Physical Quality of
Life Index (PQLI, Morris 1979). Other important exponents of work in this field are
Drenowski’s (1974) work on the measurement of levels of living and welfare, and the
OECD research programme on the measurement of social well-being (OECD 1976, 1982,
1986). A very important recent, and continuing, contribution is the annual publication of
theHuman Development Reportfor the United Nations Development Programme. The first
issue of the Human Development Report(HDR) in 1990 introduced the Human
Development Index, which was continuously refined in later publications.
For some time, an underlying theoretical rationale for using the various sets of social
indicators proposed for international and intercountry comparisons seemed to be lacking.
2 Nick van der Lijn
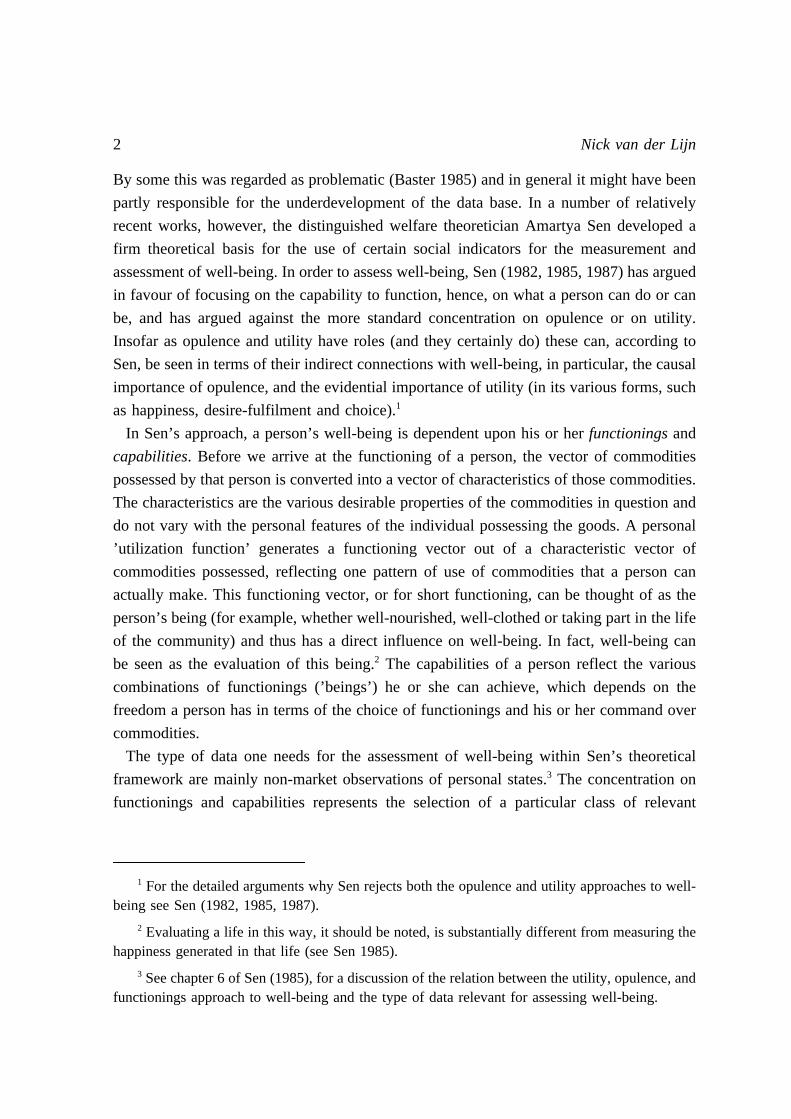
By some this was regarded as problematic (Baster 1985) and in general it might have been
partly responsible for the underdevelopment of the data base. In a number of relatively
recent works, however, the distinguished welfare theoretician Amartya Sen developed a
firm theoretical basis for the use of certain social indicators for the measurement and
assessment of well-being. In order to assess well-being, Sen (1982, 1985, 1987) has argued
in favour of focusing on the capability to function, hence, on what a person can do or can
be, and has argued against the more standard concentration on opulence or on utility.
Insofar as opulence and utility have roles (and they certainly do) these can, according to
Sen, be seen in terms of their indirect connections with well-being, in particular, the causal
importance of opulence, and the evidential importance of utility (in its various forms, such
as happiness, desire-fulfilment and choice).1
In Sen’s approach, a person’s well-being is dependent upon his or herfunctioningsand
capabilities. Before we arrive at the functioning of a person, the vector of commodities
possessed by that person is converted into a vector of characteristics of those commodities.
The characteristics are the various desirable properties of the commodities in question and
do not vary with the personal features of the individual possessing the goods. A personal
’utilization function’ generates a functioning vector out of a characteristic vector of
commodities possessed, reflecting one pattern of use of commodities that a person can
actually make. This functioning vector, or for short functioning, can be thought of as the
person’s being (for example, whether well-nourished, well-clothed or taking part in the life
of the community) and thus has a direct influence on well-being. In fact, well-being can
be seen as the evaluation of this being.2 The capabilities of a person reflect the various
combinations of functionings (’beings’) he or she can achieve, which depends on the
freedom a person has in terms of the choice of functionings and his or her command over
commodities.
The type of data one needs for the assessment of well-being within Sen’s theoretical
framework are mainly non-market observations of personal states.3 The concentration on
functionings and capabilities represents the selection of a particular class of relevant
1 For the detailed arguments why Sen rejects both the opulence and utility approaches to well-being see Sen (1982, 1985, 1987).
2 Evaluating a life in this way, it should be noted, is substantially different from measuring thehappiness generated in that life (see Sen 1985).
3 See chapter 6 of Sen (1985), for a discussion of the relation between the utility, opulence, andfunctionings approach to well-being and the type of data relevant for assessing well-being.

3Well-being and social indicators
indicators, mainly objective social indicators measuring ends, not means.4 To give one
example, the number of physicians per thousand inhabitants of a country does not say
much about the access to medical care of the masses, and thus to capabilities and well-
being, while life expectancy directly refers to one of the most important capabilities - that
of long life - and, hence, has a direct relation to well-being. The indicators considered to
be relevant refer to health (like morbidity or undernourishment), education, the ability to
be housed and sheltered, employment, leisure, security, etc. Unfortunately, although the
data base is expanding, internationally comparable data are not available for many of these
indicators. This, however, "should not prevent us from making use of whatever data may
be easily available already" (Sen 1985, p.73).
For comparisons between countries as well as for comparisons over time, it is often
convenient to examine a composite index. For empirical research on, say, the relationship
between well-being and economic development, one would also like to use such an index.
In fact, PQLI has been commonly used as a measure of the fulfilment of basic needs, or,
in more general terms, as a measure of social development.5 A disadvantage of a
composite index is that the information on individual indicators gets lost and that the
appropriate weighting scheme for the selected indicators is far from clear. Theoretically,
weighting concerns the valuation of the functioning vector. Although to some extent the
relative importance of the various functionings and capabilities might be examined, the
scope of ’objective’ weighting is limited. However, as long as the assumptions underlying
different weighting procedures are made clear, the problems of weighting are not
insurmountable (Baster 1985).
In this paper, bearing the theoretical contributions of Sen and the remark made above in
mind, several well-being indices are constructed for a number of years for the vast majority
4 Sen (1985) outlined in appendix A how comparisons of the achievements of differentcountries in the field of extending capabilities and enhancing functionings should be made. In thisappendix, intended primarily to illustrate the empirical relevance of his theoretical approach ratherthan to reach definite empirical conclusions, Sen compared for five countries a number of specificachievements (concerning life expectancy, infant mortality, child death rate, adult literacy rate andhigher education) in relation to their GNP per capita. In Sen’s theoretical framework these indicesrelate to capabilities to function and bear a direct relationship to well-being. The main economicconclusion which emerged from these comparisons was the relatively good performances of SriLanka and China.
5 For example, Newman and Thomson (1989) used PQLI in their analysis of the causal relationbetween economic growth and social development, while Stuart (1984) and Burkett (1985)examined the impact of the economic system on PQLI.

4 Nick van der Lijn
of countries with more than half a million inhabitants at the end of the 1980s. Due to data
limitations, the indicators used to construct these indices only concern health and education.
The constructed indices can be regarded to measure some kind of ’basic’ well-being, as the
underlying indicators most of all seek to measure the fulfilment of basic needs. As it is
unclear what should be regarded as the ’best’ index and how the respective indicators
should be weighted, three basic well-being indices are constructed using partially distinct
indicators and slightly different weighting schemes. Further, a brief comparison is made
of the achievements of various groups of countries. Summary statistics are presented per
continent, for developing and industrial economies, for (post)socialist and capitalist
countries, and for five major oil-exporting countries, and the main trends are discussed. In
this respect, this paper contributes to the literature as other studies aiming to assess the
relative achievements of various groups of countries on basic well-being usually consider
only one particular year (like Horvat 1974, Stuart 1984, Burkett 1985). Finally, some
conclusions are given.
II. Well-being indices for 133 countries
The first of the well-being indices constructed in this section is based on the Human
Development Index (HDI). At this time, the HDI is a weighted average of indices for life
expectancy at birth, adult literacy, average years of schooling, and purchasing power
adjusted real GDP per capita. This reflects the choice that "the measurement of human
development should for the time being focus on the three essential elements of human life -
longevity, knowledge and decent living standards" (HDR 1990, p.11-12). Within Sen’s
theoretical framework, the first three indices refer to ’capability welfare’ and bear a direct
relation to well-being, while the latter refers to ’commodity welfare’, which can be
regarded to be prior to capability welfare.6 Hence, real GDP per capita is regarded as one
of the factors influencing well-being, but not as well-being itself. For this reason, HDIS
only comprises the social indicators component of HDI.
The second index constructed in this section is well-known. PQLI is a weighted average
of indices of life expectancy at age 1, infant mortality, and adult literacy. The, so to speak,
6 A quote from Sen (1985, p.10-11) might clarify this issue more fully: "A functioning is thusdifferent both from (1) having goods (and the corresponding characteristics), to which it is posterior,and (2) having utility (in the form of happiness resulting from that functioning), to which it is, inan important way, prior."

5Well-being and social indicators
separation of life expectancy at birth (in HDIS) into life expectancy at age 1 and infant
mortality (in PQLI), means that more weight is attached to the mortality rate of infants
under one year of age relative to the mortality rates of other age-groups. Even more so than
HDIS, PQLI measures the fulfilment of basic needs. Educational achievements are
measured by adult literacy only. In order to capture a broader spectrum of education, gross
secondary school enrolment is added to the indicators comprising PQLI to obtain another
basic well-being index, BWI. For convenience, the social indicators used to construct HDIS,
PQLI, and BWI are represented in Table 1.
TABLE 1 Composition of several well-being indices
HDIS PQLI BWI
1a. Life expectancy at birth1b. Life expectancy at age 12. Infant mortality3. Adult literacy4. Gross secondary school enrolment5. Average years of schooling
X
X
X
XXX
XXXX
Note. The social indicators comprising HDIS form, together with realGDP per capita, the Human Development Index. PQLI is the PhysicalQuality of Life Index, BWI is the Basic Well-being Index.
TABLE 2 Fixed minimum and maximum values for the social indicatorsused to construct HDIS, PQLI, and BWI
Minimum Maximum
1a. Life expectancy at birth (years)1b. Life expectancy at age 1 (years)2. Infant mortality (per 1000 live births)3. Adult literacy (%)4. Gross secondary school enrolment (%)5. Average years of schooling
25300000
8585
23010010015
Note. The minimum and maximum values for the social indicators 1a, 3, and 5 come from HDR1994 (Table 5.1, p.92). The minimum and maximum values for indicator 2 are about equal to theones used by Morris (1979; 7 and 229, respectively). The values for indicator 1b are chosenconsidering the values for indicators 1a and 2, while the minimum and maximum value forindicator 4 is an obvious choice.
6 Nick van der Lijn
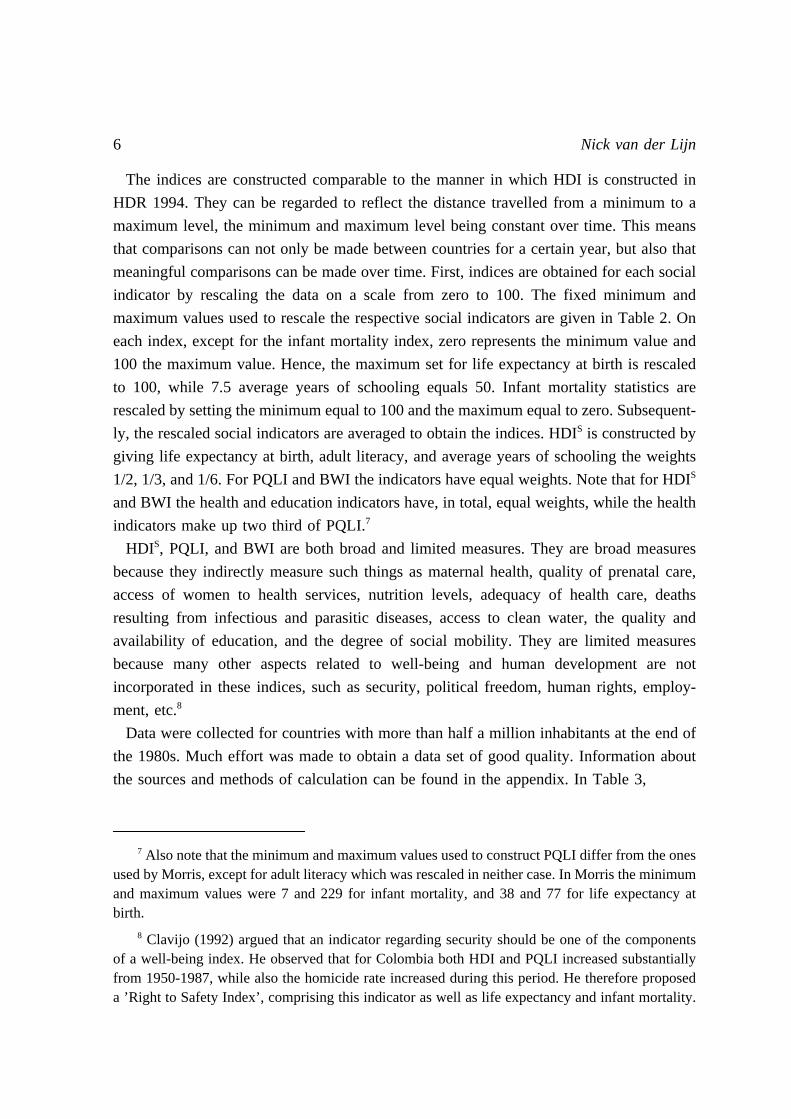
The indices are constructed comparable to the manner in which HDI is constructed in
HDR 1994. They can be regarded to reflect the distance travelled from a minimum to a
maximum level, the minimum and maximum level being constant over time. This means
that comparisons can not only be made between countries for a certain year, but also that
meaningful comparisons can be made over time. First, indices are obtained for each social
indicator by rescaling the data on a scale from zero to 100. The fixed minimum and
maximum values used to rescale the respective social indicators are given in Table 2. On
each index, except for the infant mortality index, zero represents the minimum value and
100 the maximum value. Hence, the maximum set for life expectancy at birth is rescaled
to 100, while 7.5 average years of schooling equals 50. Infant mortality statistics are
rescaled by setting the minimum equal to 100 and the maximum equal to zero. Subsequent-
ly, the rescaled social indicators are averaged to obtain the indices. HDIS is constructed by
giving life expectancy at birth, adult literacy, and average years of schooling the weights
1/2, 1/3, and 1/6. For PQLI and BWI the indicators have equal weights. Note that for HDIS
and BWI the health and education indicators have, in total, equal weights, while the health
indicators make up two third of PQLI.7
HDIS, PQLI, and BWI are both broad and limited measures. They are broad measures
because they indirectly measure such things as maternal health, quality of prenatal care,
access of women to health services, nutrition levels, adequacy of health care, deaths
resulting from infectious and parasitic diseases, access to clean water, the quality and
availability of education, and the degree of social mobility. They are limited measures
because many other aspects related to well-being and human development are not
incorporated in these indices, such as security, political freedom, human rights, employ-
ment, etc.8
Data were collected for countries with more than half a million inhabitants at the end of
the 1980s. Much effort was made to obtain a data set of good quality. Information about
the sources and methods of calculation can be found in the appendix. In Table 3,
7 Also note that the minimum and maximum values used to construct PQLI differ from the onesused by Morris, except for adult literacy which was rescaled in neither case. In Morris the minimumand maximum values were 7 and 229 for infant mortality, and 38 and 77 for life expectancy atbirth.
8 Clavijo (1992) argued that an indicator regarding security should be one of the componentsof a well-being index. He observed that for Colombia both HDI and PQLI increased substantiallyfrom 1950-1987, while also the homicide rate increased during this period. He therefore proposeda ’Right to Safety Index’, comprising this indicator as well as life expectancy and infant mortality.

7Well-being and social indicators
TABLE 3 HDIS, PQLI, and BWI for 133 countries for 1975, 1980, 1985, 1988, and 1992
HDIS PQLI BWI’80 ’85 ’88 ’92 ’75 ’80 ’85 ’88 ’92 ’75 ’80 ’85 ’88 ’92
AFRICA
1 Algeria 43 49 53 57 47 54 60 64 69 40 49 58 64 662 Angola 25 29 31 33 26 32 37 40 43 22 29 32 33 353 Benin 25 27 30 27 32 35 38 41 41 27 31 33 33 344 Botswana 48 54 55 57 53 60 66 68 70 44 50 57 59 665 Burkina Faso 20 23 24 26 26 29 32 34 38 20 22 25 27 306 Burundi 26 33 36 37 35 37 45 47 50 27 28 35 37 397 Cameroon 41 43 45 46 47 52 54 56 61 39 44 46 49 528 Centr. Afr.R. 30 32 34 33 32 39 40 46 45 26 32 34 37 37*9 Chad 22 24 27 29 26 31 34 37 41 21 24 27 30 33
10 Congo 47 47 44 44 53 59 59 57 57 54 61 63 63 62**11 Egypt 43 46 50 50 46 52 57 60 63 46 52 58 62 6712 Ethiopia 28 35 39 36 31 35 42 48 46 25 29 34 40 3713 Gabon 40 43 46 47 43 49 53 56 58 37 42 46 48 50**14 Gambia 20 22 25 27 23 28 31 34 37 20 24 28 29 3315 Ghana 42 45 47 50 47 51 55 57 61 45 48 51 53 5516 Guinea 21 20 23 26 24 28 28 32 35 21 25 24 26 2917 Guinea Bissau 17 22 24 28 21 25 31 33 38 17 20 26 27 30*18 Ivory Coast 32 40 43 43 38 43 52 54 55 31 37 44 46 4719 Kenya 44 51 53 54 50 56 63 66 67 41 46 53 55 5720 Lesotho 49 52 55 59 54 57 61 64 69 43 47 51 54 5821 Liberia 34 37 39 41 39 45 49 46 49 34 40 41 39 41**22 Libya 46 51 54 57 49 55 61 64 68 51 58 67 71 73**23 Madagascar 44 51 53 54 45 51 59 61 64 37 41 51 51 5224 Malawi 30 33 35 33 31 35 39 42 41 24 27 30 32 3225 Mali 21 26 28 29 22 26 32 34 37 18 22 25 27 2926 Mauritania 23 26 28 31 28 33 37 39 42 22 27 31 34 3527 Mauritius 64 66 68 68 74 78 80 82 82 65 70 73 74 7528 Morocco 39 45 48 52 44 49 56 60 63 37 43 50 54 5629 Mozambique 27 29 31 31 31 34 37 39 38 24 26 29 31 3030 Niger 17 23 25 28 23 26 33 36 39 18 21 26 28 3131 Nigeria 31 36 39 41 38 42 48 50 53 30 39 43 43 4632 Rwanda 35 35 37 37 39 44 45 48 48 29 34 35 38 3933 Senegal 25 30 32 34 30 33 39 46 49 25 28 33 39 4134 Sierra Leone 20 18 21 23 21 26 26 29 32 19 23 24 26 2835 Somalia 18 23 26 27 25 27 33 36 38 20 23 27 29 31**36 South Africa 58 61 60 62 63 67 71 70 74 52 56 66 68 73

8 Nick van der Lijn
TABLE 3 HDIS, PQLI, and BWI -continued
HDIS PQLI BWI’80 ’85 ’88 ’92 ’75 ’80 ’85 ’88 ’92 ’75 ’80 ’85 ’88 ’92
37 Sudan 28 29 30 32 33 38 40 42 45 29 33 35 37 3938 Swaziland 46 51 53 55 47 52 58 60 66 44 49 54 56 6239 Tanzania 39 42 45 42 43 48 52 56 53 33 37 40 43 4140 Togo 31 37 39 41 38 42 49 51 54 33 40 42 44 4641 Tunisia 49 54 57 60 52 60 67 71 74 45 52 60 64 6842 Uganda 32 34 36 33 44 43 46 48 46 34 34 38 40 38*43 Zaire 40 46 47 49 46 51 57 59 61 39 44 49 50 52*44 Zambia 47 48 50 45 54 58 60 62 58 44 48 49 52 48*45 Zimbabwe 50 50 53 52 58 63 63 66 66 46 49 58 62 61C. & N. AMERICA
46 Canada 87 89 90 90 91 92 94 94 94 91 92 95 96 9647 Costa Rica 76 77 79 80 83 87 88 90 91 73 77 77 77 8048 Cuba 77 82 82 83 84 88 91 91 91 75 86 89 91 8949 Dominican R. 61 65 66 68 67 70 74 76 78 59 63 68 76 77*50 El Salvador 53 56 60 63 62 64 68 71 75 51 54 57 61 6351 Guatemala 49 52 53 56 55 59 63 65 68 44 49 52 54 5652 Haiti 34 42 44 46 38 42 51 53 58 30 35 43 45 4953 Honduras 54 58 60 63 58 63 68 71 73 47 55 60 61 6354 Jamaica 75 79 79 79 85 87 90 90 91 78 80 84 83 8455 Mexico 65 69 70 72 73 76 80 81 83 63 69 74 75 7756 Nicaragua 55 61 64 65 60 65 72 74 75 51 60 63 66 6757 Panama 73 75 76 77 81 84 85 86 87 74 78 78 79 8058 Trin. & Tob. 75 76 79 80 84 86 87 88 88 75 81 84 87 8659 USA 87 88 89 89 91 92 93 93 93 91 91 94 93 93SOUTH AMERICA
60 Argentina 75 77 79 80 83 85 86 87 87 76 78 82 83 8361 Bolivia 48 51 53 60 49 54 58 61 69 45 49 53 54 6062 Brazil 60 63 64 66 68 70 73 75 77 58 61 64 66 6763 Chile 75 77 78 79 79 85 87 88 88 72 77 82 85 8464 Colombia 66 68 72 74 72 76 78 81 83 64 68 71 75 7865 Ecuador 64 67 69 70 68 72 75 77 78 61 67 70 72 73*66 Guyana 71 71 69 71 80 81 82 79 81 74 76 75 74 75*67 Paraguay 68 69 70 71 77 79 81 81 81 63 67 68 68 6968 Peru 61 63 66 68 63 67 69 72 74 59 65 68 70 7369 Uruguay 76 78 79 81 84 86 87 88 89 78 79 83 86 8870 Venezuela 69 72 73 74 77 79 82 83 84 64 65 68 71 71

9Well-being and social indicators
TABLE 3 HDIS, PQLI, and BWI -continued
HDIS PQLI BWI’80 ’85 ’88 ’92 ’75 ’80 ’85 ’88 ’92 ’75 ’80 ’85 ’88 ’92
ASIA
71 Afghanistan 16 21 24 26 16 19 26 30 33 14 17 22 24 27*72 Bangladesh 31 34 35 37 36 39 43 44 47 34 34 36 38 4073 Burma 53 57 58 57 56 62 66 68 68 48 52 55 57 5774 Cambodia 21 29 33 36 15 25 36 41 45 13 24 35 39 42*75 China 62 65 67 70 70 73 76 78 82 65 67 67 70 7576 Cyprus 79 81 81 82 87 88 90 91 92 79 90 91 90 9377 Hong Kong 76 79 81 82 84 87 90 91 91 75 82 85 87 87*78 India 40 44 46 48 44 49 53 56 59 39 44 50 52 5679 Indonesia 52 56 59 64 55 62 66 70 74 46 53 59 64 6680 Iran 48 49 53 58 52 58 61 64 70 50 54 57 60 6881 Iraq 52 54 57 60 57 62 64 66 70 52 60 61 61 6382 Israel 81 84 85 86 87 89 91 92 92 81 85 87 90 9183 Japan 87 88 89 90 92 94 94 95 95 92 93 95 95 9684 Jordan 60 64 66 68 65 70 74 77 80 61 72 78 77 7385 North Korea 70 72 75 76 78 81 84 86 87 72 77 79 81 82**86 South Korea 73 77 79 80 80 83 86 87 88 74 81 88 87 8887 Kuwait 64 68 70 72 74 77 81 82 84 72 77 81 83 7688 Laos 32 36 41 43 33 38 42 50 53 27 34 37 44 4589 Malaysia 63 66 69 71 72 76 79 81 83 64 69 72 75 7790 Mongolia 69 69 69 71 74 78 79 77 79 76 81 82 80 7891 Nepal 27 30 32 34 32 35 38 40 45 27 31 35 38 4392 Oman 32 35 44 49 37 42 46 61 66 28 35 43 56 6593 Pakistan 33 38 38 42 38 41 47 48 52 32 35 39 41 4494 Philippines 65 69 70 72 72 74 77 79 80 68 71 74 77 7995 Saudi Arabia 40 54 57 62 43 50 64 67 75 38 45 59 61 6996 Singapore 69 71 74 76 81 84 86 88 90 73 77 82 83 8597 Sri Lanka 71 73 75 76 76 81 83 84 86 69 73 78 81 8398 Syria 52 56 59 61 58 64 68 71 73 54 60 66 67 6799 Thailand 64 67 68 72 73 77 79 82 85 61 65 67 69 72100 Turkey 56 61 63 66 58 64 70 72 77 51 57 63 66 71101 Un. Ar. Em. 58 62 63 66 68 72 75 75 77 59 65 71 71 76102 Vietnam 59 66 68 67 53 71 78 79 79 50 64 69 70 68103 North Yemen1 24 32 31 37 28 33 43 41 49 22 26 36 37 44104 South Yemen 28 29 35 33 37 38 45 30 32 33 39EUROPE
105 Albania 68 72 74 75 75 78 82 84 85 68 75 79 82 83

10 Nick van der Lijn
TABLE 3 HDIS, PQLI, and BWI -continued
HDIS PQLI BWI’80 ’85 ’88 ’92 ’75 ’80 ’85 ’88 ’92 ’75 ’80 ’85 ’88 ’92
106 Austria 83 85 87 88 89 91 92 93 93 90 91 94 94 95107 Belgium 82 84 86 88 90 91 92 93 93 89 91 93 95 95108 Bulgaria 79 77 78 78 87 89 88 88 88 88 88 91 85 84109 Czechoslovakia 80 80 81 82 89 89 89 90 91 84 89 88 88 88110 Denmark 85 86 86 87 92 92 93 93 93 89 94 95 95 95111 Finland 83 86 86 87 91 92 93 93 93 90 93 95 95 95112 France 85 88 88 89 91 93 94 93 94 89 91 94 93 95113 East Germany 80 82 82 91 91 91 92 89 88 88 88114 West Germany2 83 85 86 88 90 91 92 93 93 89 92 94 95 95115 Greece 78 81 82 83 86 88 91 92 92 84 86 91 93 94*116 Hungary 79 81 81 81 87 88 88 89 89 81 83 84 85 87117 Ireland 81 83 83 85 89 91 92 92 93 89 91 93 94 95118 Italy 80 83 84 84 89 91 93 93 93 84 86 88 88 89119 Netherlands 84 86 88 89 92 93 94 94 94 91 93 95 95 96120 Norway 86 88 89 90 93 93 94 94 94 91 93 95 94 96121 Poland 79 80 81 81 88 89 89 90 90 84 86 86 88 89122 Portugal 70 74 75 77 78 83 86 87 88 72 73 78 80 86123 Romania 77 79 77 78 85 87 88 87 87 80 83 87 90 86124 Soviet Union3 77 77 78 80 86 85 86 87 88 88 88 89 90 90125 Spain 79 81 82 84 88 91 92 93 94 85 90 94 95 95126 Sweden 86 87 88 90 93 93 94 94 95 89 92 92 93 95127 Switzerland 85 87 88 90 92 93 94 94 95 86 90 93 93 94128 Un. Kingdom 86 87 87 88 90 92 92 93 93 89 90 91 90 92129 Yugoslavia 72 76 78 81 83 86 87 80 83 85 86OCEANIA
130 Australia 85 87 88 89 91 92 93 93 94 86 87 90 90 91131 Fiji 69 71 73 73 78 81 83 85 85 75 79 76 76 79132 New Zealand 83 85 86 87 90 91 92 93 93 88 89 90 90 93133 Papua NGuin. 36 40 42 48 46 51 56 58 65 38 41 45 47 52
Note. For a number of countries, the most recent figure for gross secondary school enrolmentpublished in UNESCO,Statistical Yearbook1994, refers to the end of the 1980s or to 1990 or1991. An asterisk denotes that the figure for gross secondary school enrolment used to calculateBWI for 1992 refers to either 1988 or 1989. In some cases, the figure for 1988 is obtained byextrapolation (see the appendix). A double asterisk means that the extrapolated figure for 1988 isused to calculate BWI for 1992. 1. The figures for 1992 refer to Yemen. 2. The figures for 1992refer to Germany. 3. The figures for 1992 refer to the Russian Federation.

11Well-being and social indicators
HDIS, PQLI, and BWI are given for 133 countries for 1980, 1985, 1988, and 1992, while
PQLI and BWI are also given for 1975.
III. Some trends and comparisons for various groups of countries
Summary statistics for HDIS, PQLI, and BWI, as well as averages of purchasing power
adjusted real GDP per capita are given per continent in Table 4 and for various groups of
countries in Table 6, while some comparisons of trends and achievements are presented in
Tables 5 and 7. The achievements are given both as the increase of HDIS, PQLI, and BWI
in absolute numbers and as the reduction in shortfall. The reduction in shortfall from a
desired value or target as a measure of achievement is proposed in HDR 1990. It is equal
to the change of the value of the index over time as a percentage of the difference between
the maximum value and the value of the index at the beginning of the period concerned.
Thus, when PQLI increases from 50 to 60, the reduction in shortfall is 20%, and when
BWI increases from 80 to 90, it equals 50% (the maximum value of HDIS, PQLI, and BWI
being 100). The reduction in shortfall is considered to be a good measure of achievement
because it brings out more clearly than other measures the difficulty of the tasks
accomplished, as it is acknowledged that an increase in the absolute number of, for
instance, a well-being index is more difficult to achieve when the index is close to the
maximum. Moreover, the shortfall measure of human progress emphasises the magnitude
of the tasks that still lie ahaid (HDR 1990, p.14).
From Table 5 it can be seen that although the increase in absolute figures for Africa was
almost as much as it was for Asia, and higher than for all the other continents, the African
countries experienced the smallest reduction in shortfall. While the countries of the other
continents on average managed to reduce the gap to the maximum attainable level of PQLI
and BWI from 1975-1992 with 30-35%, the average reduction in shortfall of the African
countries was only about 20%. The relatively high increase in absolute figures of the Asian
countries can be considered to be the kind of catch-up effect expected for countries with
a relatively low level of basic well-being: the reduction in shortfall is about equal to the
average reduction in shortfall for the other continents. The European countries show to
have experienced a relatively favourable progress of secondary school enrolment. BWI
increased relatively rapidly and is in 1992 almost equal to PQLI (see Table 4), reflecting
the fact that secondary school attainment can by now be regarded as a basic need in
Europe (for the other continents, BWI is still substantially lower than PQLI).
12 Nick van der Lijn
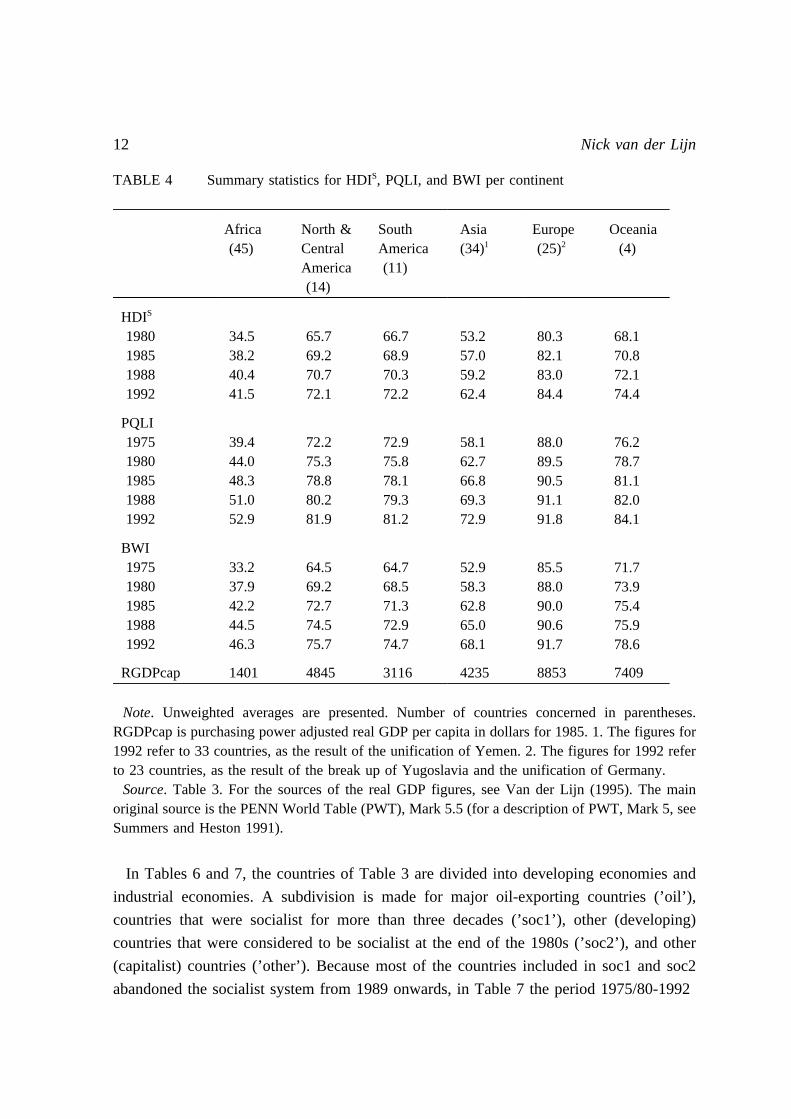
TABLE 4 Summary statistics for HDIS, PQLI, and BWI per continent
Africa(45)
North &CentralAmerica(14)
SouthAmerica(11)
Asia(34)1
Europe(25)2
Oceania(4)
HDIS
1980198519881992
34.538.240.441.5
65.769.270.772.1
66.768.970.372.2
53.257.059.262.4
80.382.183.084.4
68.170.872.174.4
PQLI19751980198519881992
39.444.048.351.052.9
72.275.378.880.281.9
72.975.878.179.381.2
58.162.766.869.372.9
88.089.590.591.191.8
76.278.781.182.084.1
BWI19751980198519881992
33.237.942.244.546.3
64.569.272.774.575.7
64.768.571.372.974.7
52.958.362.865.068.1
85.588.090.090.691.7
71.773.975.475.978.6
RGDPcap 1401 4845 3116 4235 8853 7409
Note. Unweighted averages are presented. Number of countries concerned in parentheses.RGDPcap is purchasing power adjusted real GDP per capita in dollars for 1985. 1. The figures for1992 refer to 33 countries, as the result of the unification of Yemen. 2. The figures for 1992 referto 23 countries, as the result of the break up of Yugoslavia and the unification of Germany.
Source. Table 3. For the sources of the real GDP figures, see Van der Lijn (1995). The mainoriginal source is the PENN World Table (PWT), Mark 5.5 (for a description of PWT, Mark 5, seeSummers and Heston 1991).
In Tables 6 and 7, the countries of Table 3 are divided into developing economies and
industrial economies. A subdivision is made for major oil-exporting countries (’oil’),
countries that were socialist for more than three decades (’soc1’), other (developing)
countries that were considered to be socialist at the end of the 1980s (’soc2’), and other
(capitalist) countries (’other’). Because most of the countries included in soc1 and soc2
abandoned the socialist system from 1989 onwards, in Table 7 the period 1975/80-1992

13Well-being and social indicators
TABLE 5 Increase of HDIS, PQLI, and BWI per continent in absolute numbers and measuredas the reduction in shortfall
Africa(45)
North &CentralAmerica(14)
SouthAmerica(11)
Asia(33)3
Europe(23)3
Oceania(4)
ABSOLUTE NUMBERS1
HDIS, 1980-92PQLI, 1980-92BWI, 1980-92
7.08.98.4
6.46.66.5
5.55.46.2
8.59.49.0
3.72.13.5
6.35.44.7
PQLI, 1975-92BWI, 1975-92
13.513.1
9.711.2
8.310.0
14.014.5
3.66.1
7.96.9
RED. IN SHORTFALL2
HDIS, 1980-92PQLI, 1980-92BWI, 1980-92
111614
192721
172220
182622
192030
202518
PQLI, 1975-92BWI, 1975-92
2220
3532
3128
3431
3142
3324
Note. Calculated from Table 4; see note at Table 4. 1. Increase in absolute numbers. 2. Reductionin shortfall in percentages. The reduction in shortfall (from the maximum value) is equal to thechange of the value of the index over time as a percentage of the difference between the maximumvalue and the value of the index at the beginning of the period concerned. 3. For reasons ofcomparability, all figures for Asia are excluding South Yemen and for Europe excluding EastGermany and Yugoslavia.
is subdivided into 1975/80-1988 and 1988-1992. Hence, inspection of the figures for 1988-
1992 for soc1 and soc2 gives an impression of the achievements of the postsocialist
countries after a few years of transition to a market economy.
A number of observations can be made. First, the achievements of the developing
economies on PQLI are, when measured as the reduction in shortfall, comparable to the
achievements of the industrial economies. On HDIS and BWI, however, the achievements
of the developing economies are relatively less favourable. Second, the average values of
the respective basic well-being indices are quite high for the developing economies
included in soc1. In fact, they are even higher than the average values for both North &
Central America and South America. Moreover, the reduction in shortfall from 1975-1988
for these countries was 15% higher than for the developing economies included in ’other’
14 Nick van der Lijn
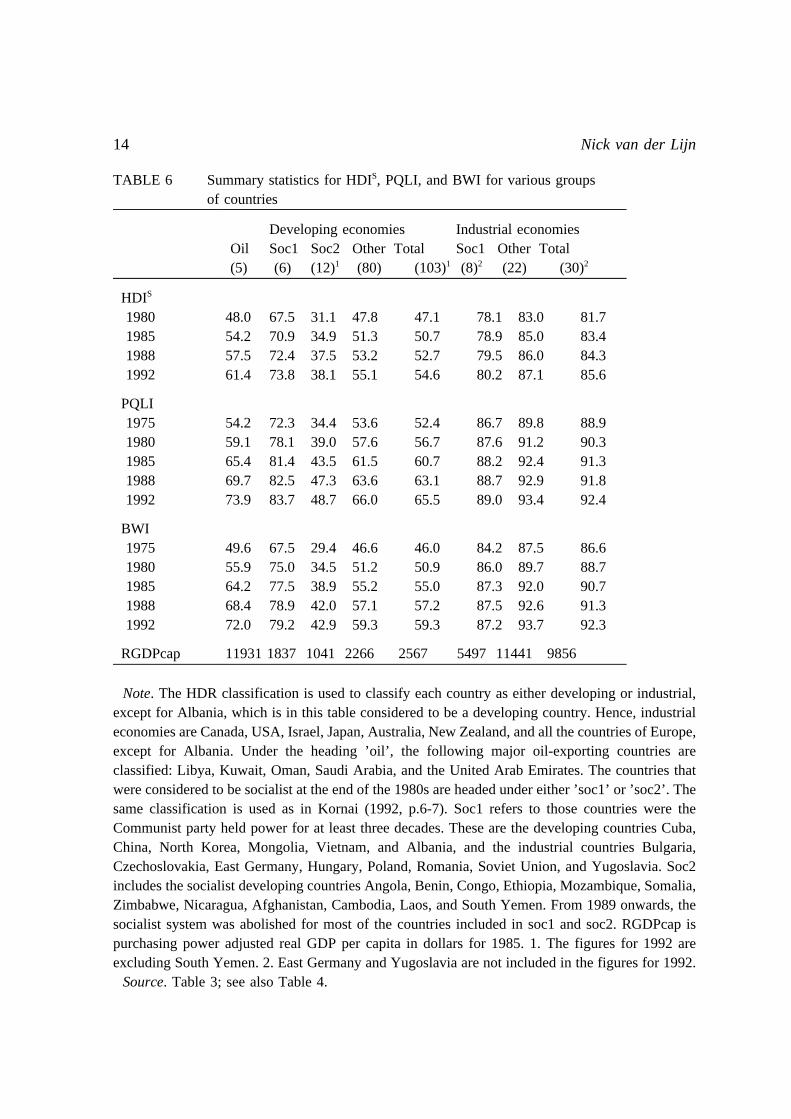
TABLE 6 Summary statistics for HDIS, PQLI, and BWI for various groupsof countries
Developing economies Industrial economiesOil Soc1 Soc2 Other Total Soc1 Other Total(5) (6) (12)1 (80) (103)1 (8)2 (22) (30)2
HDIS
1980198519881992
48.0 67.5 31.1 47.8 47.1 78.1 83.0 81.754.2 70.9 34.9 51.3 50.7 78.9 85.0 83.457.5 72.4 37.5 53.2 52.7 79.5 86.0 84.361.4 73.8 38.1 55.1 54.6 80.2 87.1 85.6
PQLI19751980198519881992
54.2 72.3 34.4 53.6 52.4 86.7 89.8 88.959.1 78.1 39.0 57.6 56.7 87.6 91.2 90.365.4 81.4 43.5 61.5 60.7 88.2 92.4 91.369.7 82.5 47.3 63.6 63.1 88.7 92.9 91.873.9 83.7 48.7 66.0 65.5 89.0 93.4 92.4
BWI19751980198519881992
49.6 67.5 29.4 46.6 46.0 84.2 87.5 86.655.9 75.0 34.5 51.2 50.9 86.0 89.7 88.764.2 77.5 38.9 55.2 55.0 87.3 92.0 90.768.4 78.9 42.0 57.1 57.2 87.5 92.6 91.372.0 79.2 42.9 59.3 59.3 87.2 93.7 92.3
RGDPcap 11931 1837 1041 2266 2567 5497 11441 9856
Note. The HDR classification is used to classify each country as either developing or industrial,except for Albania, which is in this table considered to be a developing country. Hence, industrialeconomies are Canada, USA, Israel, Japan, Australia, New Zealand, and all the countries of Europe,except for Albania. Under the heading ’oil’, the following major oil-exporting countries areclassified: Libya, Kuwait, Oman, Saudi Arabia, and the United Arab Emirates. The countries thatwere considered to be socialist at the end of the 1980s are headed under either ’soc1’ or ’soc2’. Thesame classification is used as in Kornai (1992, p.6-7). Soc1 refers to those countries were theCommunist party held power for at least three decades. These are the developing countries Cuba,China, North Korea, Mongolia, Vietnam, and Albania, and the industrial countries Bulgaria,Czechoslovakia, East Germany, Hungary, Poland, Romania, Soviet Union, and Yugoslavia. Soc2includes the socialist developing countries Angola, Benin, Congo, Ethiopia, Mozambique, Somalia,Zimbabwe, Nicaragua, Afghanistan, Cambodia, Laos, and South Yemen. From 1989 onwards, thesocialist system was abolished for most of the countries included in soc1 and soc2. RGDPcap ispurchasing power adjusted real GDP per capita in dollars for 1985. 1. The figures for 1992 areexcluding South Yemen. 2. East Germany and Yugoslavia are not included in the figures for 1992.
Source. Table 3; see also Table 4.

15Well-being and social indicators
TABLE 7 Increase of HDIS, PQLI, and BWI for various groups of countries inabsolute figures and measured as a reduction in shortfall
Developing economies Industrial economiesOil Soc1 Soc2 Other Total Soc1 Other Total(5) (6) (12)3,4 (80) (103)4 (8)5 (22) (30)5
ABSOLUTE NUMBERS1
PQLI, 1975-88BWI, 1975-88
15.5 10.2 12.9 10.0 10.7 2.0 3.1 2.918.8 11.4 12.6 10.5 11.2 3.3 5.1 4.7
HDIS, 1980-88PQLI, 1980-88BWI, 1980-88
9.5 4.9 6.4 5.5 5.6 1.4 3.0 2.610.6 4.4 8.3 6.0 6.4 1.1 1.7 1.512.5 3.9 7.5 5.9 6.3 1.5 2.9 2.6
HDIS, 1988-92PQLI, 1988-92BWI, 1988-92
3.9 1.4 0.3 1.9 1.7 0.9 1.1 1.04.2 1.2 1.2 2.4 2.2 0.5 0.5 0.53.6 0.3 0.6 2.2 1.9 -0.5 1.1 0.7
RED. IN SHORTFALL2
PQLI, 1975-88BWI, 1975-88
34 37 20 22 22 15 30 2637 35 18 20 21 21 41 35
HDIS, 1980-88PQLI, 1980-88BWI, 1980-88
18 15 9 10 11 6 18 1426 20 14 14 15 9 19 1528 16 11 12 13 11 28 23
HDIS, 1988-92PQLI, 1988-92BWI, 1988-92
9 5 0 4 4 4 8 614 7 2 7 6 4 7 611 1 1 5 4 -4 15 8
Note. Calculated from Table 6; see note at Table 6. 1. Increase in absolute numbers. 2. Reductionin shortfall in percentages (see note at Table 5). 3. Part of the countries included in soc2 becamesocialist in 1975 or later (the latest was Zimbabwe in 1980). 4. Figures for 1988-1992 are excludingSouth Yemen. 5. Figures for 1988-92 are excluding East Germany and Yugoslavia.
and was also higher than the reduction in shortfall for the American continents. From 1988-
1992 the achievements on HDIS and PQLI were about the same, on BWI they were worse.

16 Nick van der Lijn
Third, the indices for the industrial socialist countries are somewhat lower than those for
the capitalist industrial countries. However, considering the relatively low GDP per capita
levels in the socialist countries, they can be regarded as rather high.9 The achievements
since 1975, on the other hand, present a somewhat different picture. On each index,
measured in either absolute terms or as the reduction in shortfall, the socialist industrial
countries scored worse than the capitalist industrial countries. The achievements of the
postsocialist countries from 1988-1992 seem to lag behind the other industrial countries in
the same proportion as from 1975-1988, although on BWI the gap has grown relatively
rapidly.10 Fourth, the developing economies included in soc2 have, on average, very low
values for HDIS, PQLI, and BWI. The relatively rapid increase in absolute figures can, just
like for the Asian countries (see above), be considered as a catch-up effect. The reduction
in shortfall is about the same as for the other developing economies. From 1988-1992,
however, the countries included in soc2 scored relatively negatively. Finally, it can be seen
that the five major oil-exporting countries included in ’oil’, experienced a relatively rapid
improvement on all three indices, both measured in terms of an increase in absolute
numbers and as the reduction in shortfall. It seems that the relatively high per capita
incomes of those countries have led, after some time, to a better provision of basic needs.
IV. Conclusion
In this paper, three well-being indices (HDIS, PQLI, and BWI) are constructed for a
number of years for 133 countries. It is argued that Sen’s functioning’s approach to well-
being provides a firm theoretical basis for the use of the social indicators making up these
indices for the measurement and assessment of (basic) well-being. The method used to
construct HDIS, PQLI, and BWI ensures that they are comparable not only between
9 A more formal analysis of the impact of the economic system on basic well-being ispresented in Van der Lijn (1995). In that paper, regression estimates are given for several modelscontaining HDIS, PQLI, and BWI as dependent variables and the economic system, the level ofpolitical democracy, and the level of economic development as the principal explanatory variables.See Stuart (1984) and Burkett (1985) for earlier studies on the systemic impact on PQLI.
10 Ellman (1994) stressed that data on capabilities are a very useful source of information aboutwelfare for the economies in transition. He analyzed developments in mortality and morbidity forRussia for 1988-1993 and concluded that the health situation had deteriorated significantly. Thedeterioration started under late perestroika and accelerated since the collapse of the Soviet Unionlate 1991.

17Well-being and social indicators
countries for a certain year, but also over time. Apart from using these indices for
comparisons of development progress for individual or various groups of countries, as is
briefly done in section III, their availability might contribute to empirical analysis
concerning the relationship between well-being and those factors, like economic
development, that are considered to be related to or influencing well-being. In section III,
the achievements of various groups of countries are compared in terms of the increase in
absolute numbers of HDIS, PQLI, and BWI, and in terms of the reduction in shortfall from
the maximum level. Two of the observations made in this section are repeated here. First,
the average reduction in shortfall of the African countries from 1975-1992 was about 20%,
while the countries of the other continents on average experienced a reduction in shortfall
of 30-35%. Second, the average values of the basic well-being indices for the socialist
countries included in soc1 are relatively high. Moreover, from 1975-1988, the developing
economies included in soc1 did relatively well. The achievements from 1975-1988 of the
socialist industrial countries as compared to the capitalist industrial countries, however, are
much less favourable. On each index, measured either in absolute terms or as the reduction
in shortfall, the socialist industrial countries scored much worse. From 1988-1992, the
developments of the (mainly) postsocialist countries relative to other developing or
industrial countries are either comparable to, or show a worsening of, the relative
achievements from 1975-1988.

18 Nick van der Lijn
Appendix
In collecting the data for each indicator it was tried, on the one hand, to make use of
only one (main) source for a certain year or, even better, for several years. It may be
expected that, in general, using one source for a particular indicator for a certain year
improves the comparability of the data. On the other hand, it was aimed to obtain
consistent time series. It turned out that these two goals were sometimes incompatible.
Considering that different sources sometimes give different figures, and, hence, that it is
unclear which figure most adequately reflects the existing situation, it was sought to
balance the virtue of using one source against the virtue of consistent time series for every
indicator. In one case it was not the apparent inconsistency of the data, but the differing
methodology underlying the data that led to the use of another source. It is well-known
that, until recently, official infant mortality figures for the former Soviet Union were not
based on the WHO methodology. Estimates aiming to adjust for this difference in
methodology are used. Moreover, both the life expectancy at birth and the adult literacy
figures reported in the official Soviet statistical yearbooks are lower than those reported
in World Bank and UNDP publications, respectively. In both cases, the official Soviet data
are taken.11
The data in the yearbooks and other publications used to construct the data set are
usually derived from many sources and inevitably cover a wide range of data reliability.
Mostly, the data are official government data received by the responsible United Nations
system agencies or other international organizations. For cases in which there are no
reliable official figures, estimates by either the responsible agency, UNDP, or the World
11 Using World Bank figures for the Soviet Union for both life expectancy at birth and infantmortality, and United Nations figures for literacy, would lead to somewhat higher values for HDIS,PQLI, and BWI, as can be seen in Table A1 below.
TABLE A1 Comparison of HDIS, PQLI, and BWI for the Soviet Union reported inTable 3 with the values obtained by using World Bank and UN figures
HDIS PQLI BWI’80 ’85 ’88 ’75 ’80 ’85 ’88 ’75 ’80 ’85 ’88
Table 3Based on World Bank/UN figures
77 77 78 86 85 86 87 88 88 89 9080 79 79 87 88 88 88 89 90 91 91

19Well-being and social indicators
Bank are published, often based on field information or comparable country data. Detailed
information on the sources and methods of calculation is given below.
(1) Life expectancy at birth data for 1975, 1980, and 1985 are taken from Barro and Lee
(1994), for 1988 from World Bank,World Development Report1990 (WDR), and for 1992
from UNDP, Human Development Report1994 (HDR), with the following exceptions.12
Data for 1975, 1980, and 1985 for Angola, Libya, Cuba, Burma (Myanmar), Laos,
Mongolia, North Korea, Vietnam, South Yemen, Albania, Bulgaria, Czechoslovakia, East
Germany, and Romania come from WDR, various years. The figure for 1985 for Iran as
well as the figures for 1975 and 1980 for Afghanistan are taken from WDR. For 1985 and
1988 the data for Afghanistan are calculated from United Nations,Statistical Yearbook,
various years (UNSY), and from HDR, various years. Data for 1975, 1980, and 1985 for
Guinea are calculated from UNSY, various years. The figure for 1985 for East Germany
is taken from UNSY 1990/91. For the Soviet Union, the figure for 1975 comes from
Naselenie 1988 (p.493), and the data for 1980, 1985, and 1988 come from Narkhoz 1990
(p.94). The figures for Cambodia are calculated from UNSY, various years, and HDR
1990. The figures for 1988 for Botswana, Liberia, Madagascar, and Zimbabwe from WDR
1990 strongly differ from their time trends; considering the time trends and using additional
data from WDR, for 1987, and from HDR, for 1987 and 1990, the corrected figures used
are 59, 54, 54, and 59, respectively.
Life expectancy at age 1 is constructed from the data for life expectancy at birth and
infant mortality. The following formula was applied:
LE(0) = Infm * AVG + (1-Infm) * LE(1), or
LE(1) = [LE(0) - (Infm * AVG)] / (1-Infm),
where LE(0) is life expectancy at birth, LE(1) is life expectancy at age 1, Infm is the
number of deaths of infants under one year of age divided by the total number of live
births, and AVG is the average time infants live who die in their first year of life. The
’rule of thumb’ among demographers is that AVG is about a quarter of a year in countries
with high infant mortality, and about half a year for countries with low infant mortality
(personal communication). In the calculation, AVG was considered to be 0.25 for countries
with an infant mortality rate of 100 per thousand live births or more, 0.5 for countries with
12 The commonly used definition of life expectancy at birth is "the number of years a newborninfant would live if prevailing patterns of mortality at the time of its birth were to stay the samethroughout its life" (see, for example, WDR 1990, p.x, and HDR 1994, p.221).

20 Nick van der Lijn
an infant mortality rate of 10 per thousand live births or less, and in between 0.25 and 0.5
for countries with infant mortality rates in between 10 and 100 per thousand live births (for
example, for Infm=0.028, AVG=0.45; for Infm=0.046, AVG=0.40; etc.).
(2) Infant mortality data (number of deaths of infants under one year of age per thousand
live births) for 1970 are taken from World Bank,World Bank Atlas1985 (WBA), and for
1975, 1980, and 1985 come from Barro and Lee (1994), with the following exceptions. All
data, except for 1970, for Angola, Guinea, Libya, Cuba, Laos, Mongolia, North Korea,
Vietnam, South Yemen, Albania, Bulgaria, Czechoslovakia, East Germany, and Romania
come from WDR, various years. The figure for 1975 is, for all of these countries except
for Laos, Bulgaria, Czechoslovakia, and East Germany, obtained by averaging the figures
reported for 1970 and 1980. For Bulgaria the figure for 1975 is a weighted average of the
figures for 1970 and 1977; for Laos the figures for 1975 and 1980 are weighted averages
of the figures for 1970 and 1982 (from WBA); for Guinea the figure for 1985 is a
weighted average of the figures for 1980 and 1986. The data for the Soviet Union are taken
from Ksenefontova (1994, Table 20.4).13 Data for Cambodia for 1985 and 1988 are
calculated from UNSY. For 1975, the figure is considered to be equal to the maximum
value (230 deaths per thousand live births); the figure for 1980 is the average of the figures
for 1975 and 1985. For Afghanistan, the figure for 1975 is the average of the figures for
1970 and 1980 (from WDR), while the figures for 1985 and 1988 are the weighted
averages of the figures for 1980 and 1991 (taken from HDR 1991). For Burma (Myanmar),
the figure for 1980 comes from UNSY. Figures for 1985 and 1988 are weighted averages
of this figure and the figure for 1990 (also from UNSY); the figure for 1975 is the average
of the figures for 1970 and 1980.
For 1988, the data are taken from WDR 1990. However, for a number of countries, the
figure for 1988 in WDR either strongly differs from its time trend, or is mentioned to be
non-available. Inspecting additional information from WDR, for 1986, and from UNSY and
HDR, for various years, led to the use of other sources for part of the countries concerned.
Hence, data for 1988 for Botswana, Burundi, Congo, Gambia, Guinea Bissau, Senegal,
Swaziland, Zimbabwe, Guyana, and Cyprus come from UNSY, while the figures for Cuba,
Jamaica, Trinidad and Tobago, Sri Lanka, Albania, and Fiji are obtained by averaging the
figures for 1985 and 1991 (as published in HDR 1991).
13 Official Soviet infant mortality data are not based on the WHO methodology. The estimatesdiscussed in Ksenefontova (1994) are (upward) adjusted figures based on the WHO methodology.In particular, for 1975 the estimate proposed by Anderson and Silver is used, while for the otheryears the estimates by Ksenefontova are taken.

21Well-being and social indicators
Infant mortality data for 1992 for developing countries come from HDR 1994 and for
industrial countries from WDR 1994 (classification according to HDR). The figure for
Czechoslovakia is the weighted average of the figures reported for the Czech and Slovak
Republic.
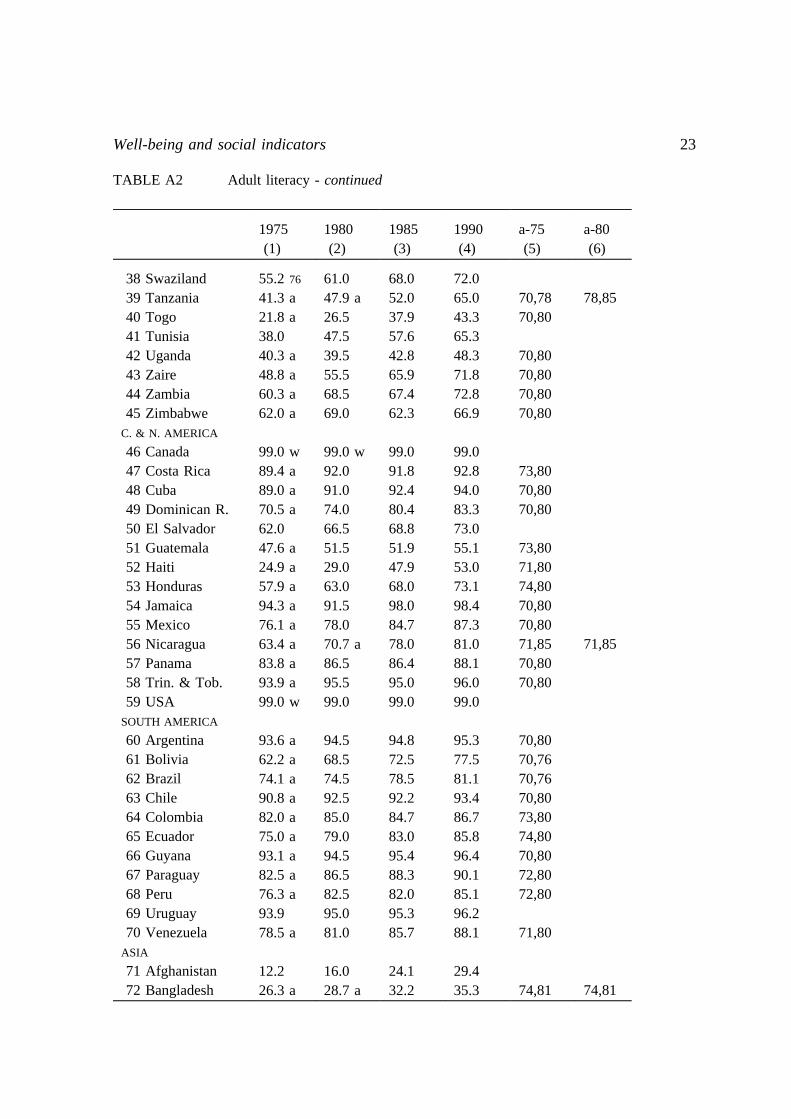
(3) Adult literacy is the percentage of the population of 15 years of age or more who
can, with understanding, both read and write a short simple statement on everyday life.
Data for 1975, 1980, 1985, and 1990, their sources, and the method of calculation are
given in Table A2. Data for 1988 are constructed by taking the weighted average of the
data for 1985 and 1990.14 Data for 1992 are taken from HDR 1994. As in HDR, the
maximum value for adult literacy is taken to be 99.0%. Data for 1990 in HDR, UNSY, and
WDR are almost the same, except for the data for Eastern European countries in HDR and
UNSY being somewhat lower than the figures reported in WDR (especially for Albania and
Bulgaria). For the other years, different sources often report different figures. In
constructing the literacy data set, the data published in HDR served as the starting point.
The next step was to add data (mostly referring to other years) from other UN sources.
Finally, some figures were taken from WDR and Kurian (1979).
(4) Gross enrolment in secondary education is the total number of people enrolled in
secondary education as a percentage of the number of (secondary) school-age children. If
reported figures exceed hundred percent, the figure is rounded off to 100. For 1975, 1980,
and 1985 the data come from Barro and Lee (1994), while for 1988, 1992, and for other
years the data come from UNESCO (mainly 1993 and 1994). Exceptions are described
below. All data for Cuba, Laos, Mongolia, Vietnam, South Yemen, Albania, Bulgaria,
Czechoslovakia, East Germany, Romania, and the Soviet Union come from UNESCO,
various years. Also taken from UNESCO are figures for Angola (for 1980 and 1985),
Guinea (1975 and 1980), Ivory Coast (1975 and 1980), Liberia (1985, this figure refers to
1984), Venezuela (1980 and 1985), Guyana (1985), Afghanistan (1980), Burma (Myanmar;
1985), Austria (1980 and 1985), West Germany (1975, 1980, and 1985)15,
14 Figure for 1988 = 0.4 * [figure for 1985] + 0.6 * [figure for 1990].
15 The figures reported for West Germany in Barro and Lee (1994), especially for 1975 and1980, seem to be far too low.

22 Nick van der Lijn
TABLE A2 Literacy: percentage of adult population considered to be literate
1975(1)
1980(2)
1985(3)
1990(4)
a-75(5)
a-80(6)
AFRICA
1 Algeria2 Angola3 Benin4 Botswana5 Burkina Faso6 Burundi7 Cameroon8 Central Afr.R.9 Chad
10 Congo11 Egypt12 Ethiopia13 Gabon14 Gambia15 Ghana16 Guinea17 Guinea Bissau18 Ivory Coast19 Kenya20 Lesotho21 Liberia22 Libya23 Madagascar24 Malawi25 Mali26 Mauritania27 Mauritius28 Morocco29 Mozambique30 Niger31 Nigeria32 Rwanda33 Senegal34 Sierra Leone35 Somalia36 South Africa37 Sudan
33.3 a19.8 a16.3 a49.9 a8.8
22.0 a39.8 a18.216.3 a46.0 a37.7 a19.5 a43.3 a15.0 w39.5 a19.3 a15.3 a23.5 a40.8 a65.5 a21.3 a42.4 a55.8 a33.3 a9.2 a
17.4 76
73.5 a25.0 a24.5 a7.0 a
29.5 a35.9 a17.3 a18.5 a4.6 a
75.8 a21.5 a
42.027.516.9 a61.011.524.049.033.521.557.042.034.7 a53.520.548.024.519.029.049.569.530.051.061.536.513.522.5 a79.029.527.010.034.0 d50.022.524.06.1 d
81.026.0
48.635.718.770.014.542.148.031.523.051.744.650.056.120.352.816.830.248.765.072.632.356.576.941.722.727.583.141.727.621.542.745.432.113.316.985.024.4
57.441.723.473.618.250.054.137.729.856.648.466.060.727.260.324.036.553.869.078.039.563.880.247.032.034.086.049.532.928.450.750.238.320.724.170.027.1
71,8070,8070,7971,80
70,8070,76
70,8070,8070,7670,8570,80
70,8070,8070,7970,8070,8070,8074,8073,8070,8070,8070,76
70,8071,8070,8070,8070,8070,7870,8070,8070,8070,8070,80
79,85
70,85
76,85
23Well-being and social indicators
TABLE A2 Adult literacy - continued
1975(1)
1980(2)
1985(3)
1990(4)
a-75(5)
a-80(6)
38 Swaziland39 Tanzania40 Togo41 Tunisia42 Uganda43 Zaire44 Zambia45 Zimbabwe
C. & N. AMERICA
46 Canada47 Costa Rica48 Cuba49 Dominican R.50 El Salvador51 Guatemala52 Haiti53 Honduras54 Jamaica55 Mexico56 Nicaragua57 Panama58 Trin. & Tob.59 USA
SOUTH AMERICA
60 Argentina61 Bolivia62 Brazil63 Chile64 Colombia65 Ecuador66 Guyana67 Paraguay68 Peru69 Uruguay70 Venezuela
ASIA
71 Afghanistan72 Bangladesh
55.2 76
41.3 a21.8 a38.040.3 a48.8 a60.3 a62.0 a
99.0 w89.4 a89.0 a70.5 a62.047.6 a24.9 a57.9 a94.3 a76.1 a63.4 a83.8 a93.9 a99.0 w
93.6 a62.2 a74.1 a90.8 a82.0 a75.0 a93.1 a82.5 a76.3 a93.978.5 a
12.226.3 a
61.047.9 a26.547.539.555.568.569.0
99.0 w92.091.074.066.551.529.063.091.578.070.7 a86.595.599.0
94.568.574.592.585.079.094.586.582.595.081.0
16.028.7 a
68.052.037.957.642.865.967.462.3
99.091.892.480.468.851.947.968.098.084.778.086.495.099.0
94.872.578.592.284.783.095.488.382.095.385.7
24.132.2
72.065.043.365.348.371.872.866.9
99.092.894.083.373.055.153.073.198.487.381.088.196.099.0
95.377.581.193.486.785.896.490.185.196.288.1
29.435.3
70,7870,80
70,8070,8070,8070,80
73,8070,8070,80
73,8071,8074,8070,8070,8071,8570,8070,80
70,8070,7670,7670,8073,8074,8070,8072,8072,80
71,80
74,81
78,85
71,85
74,81

24 Nick van der Lijn
TABLE A2 Adult literacy - continued
1975(1)
1980(2)
1985(3)
1990(4)
a-75(5)
a-80(6)
73 Burma74 Cambodia75 China76 Cyprus77 Hong Kong78 India79 Indonesia80 Iran81 Iraq82 Israel83 Japan84 Jordan85 North Korea86 South Korea87 Kuwait88 Laos89 Malaysia90 Mongolia91 Nepal92 Oman93 Pakistan94 Philippines95 Saudi Arabia96 Singapore97 Sri Lanka98 Syria99 Thailand
100 Turkey101 Un. Arab Em.102 Vietnam103 North Yemen104 South YemenEUROPE
105 Albania106 Austria107 Belgium108 Bulgaria109 Czechoslov.
73.0 a25.5 b62.3 a89.0 76
80.9 a36.9 a63.4 a35.3 a42.0 a90.0 a99.0 w64.2 a90.0 77
89.8 a59.638.0 a65.0 a85.0 a19.226.6 b21.5 a83.0 a16.3 a74.0 a81.5 a46.8 a83.3 a60.3 d53.565.0 77
10.5 a26.0 a
70.0 77
99.0 w99.0 w93.3 a99.0 77
78.027.2 b65.089.585.540.572.042.550.093.599.070.090.0 a92.063.043.570.089.520.4 a28.3 b23.083.3 e23.579.086.553.588.067.556.8 a72.3 a13.032.0
75.6 a99.0 w99.094.599.0 a
78.028.868.292.7 a88.044.171.847.752.495.099.074.290.094.770.650.074.091.022.430.031.087.757.983.086.759.190.776.060.084.432.4 c32.4 c
85.099.099.093.099.0
80.635.273.394.090.048.277.054.059.795.899.080.196.096.373.054.078.493.025.635.034.889.762.488.088.464.593.080.755.087.638.5 c38.5 c
85.099.099.093.099.0
73,80
60,80
71,8071,8071,8070,7670,8072,80
70,76
70,80
70,8070,8070,80
72,7770,8070,8070,8071,8070,8070,80
70,8070,80
70,80
80,87
77,85
75,81
75,8577,85
77,85
77,85

25Well-being and social indicators
TABLE A2 Adult literacy - continued
1975(1)
1980(2)
1985(3)
1990(4)
a-75(5)
a-80(6)
110 Denmark111 Finland112 France113 E. Germany114 W. Germany115 Greece116 Hungary117 Ireland118 Italy119 Netherlands120 Norway121 Poland122 Portugal123 Romania124 Soviet Union125 Spain126 Sweden127 Switzerland128 Un. Kingdom129 YugoslaviaOCEANIA
130 Australia131 Fiji132 New Zealand133 Papua NGuin.
99.0 w99.0 w99.0 w99.0 77
99.0 w86.2 a98.3 a98.0 w94.6 a99.0 w99.0 w98.4 a76.3 a94.8 a98.0 a92.499.0 w99.0 w99.0 w85.1 a
99.0 w79.0 76
99.0 w35.2 a
99.0 w99.0 w99.099.0 f99.0 w88.598.598.0 w95.599.0 w99.0 w98.580.595.598.0 g93.599.0 w99.0 w99.0 w87.0
99.0 w82.599.0 w39.0
99.099.099.099.0 f99.093.099.099.097.099.099.098.085.096.098.0 g95.099.099.099.092.0
99.085.5 e99.046.7
99.099.099.099.0 f99.093.299.099.097.199.099.098.085.096.098.0 89
95.499.099.099.092.7
99.087.099.052.0
71,8070,80
71,80
70,7870,8070,8070,89
71,80
71,80
Note. For some countries, the figure in column (1) does not refer to 1975. This is indicated byadding the year where the figure does refer to. a. This figure is a (weighted) average of the figuresfor the years given in column (5), for 1975, or column (6), for 1980. For example, the figure for1975 for Algeria is equal to 5/9*[the figure for 1971] + 4/9*[the figure for 1980]. b. No reliabledata are available for 1975 and 1980 for Oman and Cambodia. Estimates are obtained by assumingthat the ratio of literacy in 1975 and 1980 in Oman and Cambodia, respectively, to the mean ofliteracy in all other countries in 1975 and 1980 was equal to the observed ratio in 1985. c. Thesefigures refer to Yemen as a whole.
Sources. Figures for 1970, 1985, and 1990 come from UNDP,Human Development Report,various years; figures for 1980 are the unweighted averages of male and female literacy, aspublished in UNICEF,The State of the World’s Children1985; figures for other years are fromUnited Nations,Statistical Yearbook, various years (UNSY; when the figures for a certain year were

26 Nick van der Lijn
not the same in various Statistical Yearbooks, the figure published in the most recent edition wasselected). Exceptions (for 1970 only): the data for Guinea Bissau, Lesotho, Malawi, Mauritius,South Africa, Tanzania, USA, Laos, Mongolia, and South Yemen come from UNICEF, forEthiopia, Trinidad and Tobago, Argentina, Guyana, South Korea, Philippines, Singapore, andThailand the data come from UNSY, and data for Mexico, Brazil (also for 1976), Pakistan (for1977), and Poland come from UNESCO,Statistical Yearbook, various years. Data in column (1)for North Korea, Vietnam, Albania, Czechoslovakia, and East Germany are taken from Kurian(1979). The figure for China for 1960 comes from WDR. d. Taken from UNESCO. e. Taken fromUNSY. f. The figures for East Germany for 1980, 1985, and 1990 are based on the assumption thatliteracy in these years was at least at the level of the mid-1970s. g. The figure for 1989 for theSoviet Union is taken from Narkhoz 1990 and is equal to the figure for 1970 reported in HDR1993. It is assumed that literacy was at a constant level in the period 1970-1989. UNICEF reports98.5 for 1980, while HDR gives 99.0 for both 1985 and 1990. w. Taken from World Bank,WorldDevelopment Report, various years.
Switzerland (1985), and Australia (1975, 1980, and 1985).16 The figures for Angola (for
1975), Congo (1980), Madagascar (1980), Libya (1980 and 1985), Cambodia (1975), and
South Korea (1988) come from WDR. The figures for 1985 for Gabon and Cambodia, and
for 1988 for Cambodia come from UNICEF (the figures are referring to 1983-86, for 1985,
and 1986-89, for 1988). The figures for 1988 for Zaire, Ecuador and Hong Kong refer to
1987, for Dominican Republic this figure refers to 1986.
For a number of countries the figure for 1988 is calculated by taking the (weighted)
average of figures for other years. This is the case for (relevant years in parentheses):
Benin (85,89), Gambia (87,91), Mali (87,89), Mozambique (87,90), South Africa (86,89),
Sudan (86,90), Guatemala (87,91), Honduras (86,91), Laos (87,89), Sri Lanka (87,89), and
Portugal (87,89). For 1980 this is the case for Chad (76 [from UNICEF],85), Cambodia
(75,85), and Switzerland (75,85), and for 1985 for Madagascar (84,87) and South Africa
(80,86). For some countries it was not possible to use interpolation to estimate missing
data. Estimates for 1988 for Congo, Gabon, Liberia, Libya, and Somalia are obtained by
assuming that gross secondary school enrolment for each respective country increased by
the same percentage as the average increase from 1985 to 1988 of all other countries
(except for North Korea). The same assumption is made for 1985 for Congo (increase in
16 The Barro and Lee (1994) data on gross secondary school enrollment are mainly fromUNESCO. For some countries, UNESCO 1993 reports substantially other figures than earlieryearbooks. For Venezuela, Austria and Australia the revised figures are taken. In earlier yearbooks,the figure for Austria for 1975 is equal to the figure for 1980. Hence, the (revised) figure for 1975is assumed to be equal to the figure for 1980 in UNESCO 1993. For Venezuela, the figure for 1975is, as in earlier yearbooks, taken to be equal to the figure for 1985 in UNESCO 1993.
27Well-being and social indicators
percent from 1980 to 1985 is the same as the average increase in percent of 131 other
countries), and for 1975 for Libya and North Korea (decrease in percent from 1980 to 1975
is the same as the average decrease in percent of 131 other countries). The figure for 1992
for Yemen is calculated as the weighted average of the figures reported for North Yemen
(for 1990) and South Yemen (1989).
For North Korea no reliable data are available at all. The figures for average years of
schooling (indicator 5) are used as a proxy for gross secondary school enrolment. The ratio
of gross secondary school enrolment in North Korea to the mean value in all other
countries was set equal to the ratio of average years of schooling in North Korea to the
mean of average years of schooling in all other countries. The constructed figures for 1975,
1980, 1985 and 1988 are 56, 66, 66, and 66, respectively. Comparing these figures with
data for other state socialist countries, it seems that they probably underestimate the true
figures for North Korean gross secondary school enrolment.
(5) Average years of schooling refers to the average schooling years in the total
population over age 25. Data for 1980 come from HDR 1991, for 1990 from HDR 1993,
and for 1992 from HDR 1994. The figures for 1985 and 1988 are calculated as a weighted
average of the figures reported for 1980 and 1990.17 In HDR 1993, no figure is published
for 1990 for former Yugoslavia. The figure for 1985 is taken from Barro and Lee (1994).
For 1988 it is assumed that the average years of schooling in Yugoslavia increased from
1985 to 1988 with the same percentage as the average increase in all other countries from
1985 to 1988. For East Germany, no figures are published in HDR. They are estimated to
be equal to the simple average of the figures for the other European members of the
CMEA (Bulgaria, Czechoslovakia, Hungary, Poland, Romania, and the Soviet Union).
References
Barro, Robert, and Lee, Jong-Wha. Data set on floppies, Harvard University, 1994. For
some information on the data set and how to obtain it, see R. Barro and X. Sala-i-Martin,
Economic Growth, chapter 10, New York: McGraw-Hill, 1995.
Baster, in J. Hilhorst and M. Klatter, eds.,Social Development in the Third World - Level
of Living Indicators and Social Planning, The Hague: Institute of Social Studies &
London: Croom Helm, 1985.
17 Figure for 1985 = 0.5 * [figure for 1980] + 0.5 * [figure for 1990]; figure for 1988 = 0.2 *[figure for 1980] + 0.8 * [figure for 1990].

28 Nick van der Lijn
Burkett, John. "Systemic Influences on the Physical Quality of Life: A Bayesian Analysis
of Cross-Sectional Data."Journal of Comparative Economics9, 2:145-163, 1985.
Clavijo, Sergio. "Variations on the Basic Needs Yardstick: An Application to Colombia."
World Development20, 8:1219-1223, 1992.
Drewnowski, Jan.On Measuring and Planning the Quality of Live, The Hague: Mouton,
published for the Institute of Social Studies, 1974.
Ellman, Michael. "The increase in death and disease under ’katastroika’."Cambridge
Journal of Economics18, 329-355, 1994.
Horvat, Branko. "Welfare of the common man in various countries."World Development
2, 7:29-39, July 1974.
Kornai, Janos.The Socialist System - The Political Economy of Communism, Oxford:
Oxford University Press, 1992.
Ksenefontova, Natalia. "Trends in Infant Mortality in the USSR," in W. Lutz, S.
Scherbov, and A. Volkov, eds.,Demographic Trends and Patterns in the Soviet Union
before 1991, London and New York: Routledge, 1994.
Kurian, G.The book of World Rankings, New York: Facts of File, 1979.
Morris, Morris D. Measuring the Condition of the World’s Poor, New York: Pergamon,
published for the Overseas Development Council, 1979.
Narkhoz.Narodnoe Khozyaistvo SSSR. Moscow: Goskomstat SSSR, various years.
Naselenie.Naselenie SSSR 1988. Moscow: Goskomstat SSSR.
Newman, Barbara, and Thomson, Randall. "Economic Growth and Social Development:
A Longitudinal Analysis of Causal Priority."World Development17, 4:461-471, 1989.
Organization for Economic Co-operation and Development.Measuring Social Well-Being:
A Progress Report on the Development of Social Indicators, Paris: OECD, 1976.
Organization for Economic Co-operation and Development.The OECD List of Social
Indicators, Paris: OECD, 1982.
Organization for Economic Co-operation and Development.Living Conditions in OECD
Countries: A Compendium of Social Indicators, Paris: OECD, 1986.
Sen, Amartya.Choice, Welfare and Measurement, Oxford: Basil Blackwell, 1982.
Sen, Amartya.Commodities and Capabilities, Hennipman Lectures in Economics, Vol.
7, Amsterdam: North-Holland, 1985.
Sen, Amartya.The Standard of Living, The Tanner Lectures, Cambridge: Cambridge
University Press, 1987.
Stuart, Edward. "The PQLI as a Measure of Comparative Economic Performance."ACES
Bulletin (now: Comparative Economic Studies), 43-53, Winter 1984.

29Well-being and social indicators
Summers, Robert, and Heston, Alan. "Improved International Comparisons of Real
Product and Its Composition, 1950-1980."Review of Income and Wealth30, 2:207-262,
June 1984.
Summers, Robert, and Heston, Alan. "A New Set of International Comparisons of Real
Product and Price Levels Estimates for 130 Countries, 1950-1985."Review of Income
and Wealth34, 1:1-25, March 1988.
Summers, Robert, and Heston, Alan. "The Penn World Table (Mark 5): An Expanded Set
of International Comparisons, 1950-1988."Quarterly Journal of Economics, 327-368,
May 1991.
UNDP. Human Development Report, various years.
UNESCO.Statistical Yearbook, various years.
UNICEF. The State of the World’s Children, various years.
United Nations.Report on the International Definition and Measurement of Levels of
Living, New York: UN, 1954.
United Nations.Statistical Yearbook, various years.
Van der Lijn, Nick. "Well-being, democracy, and the economic system: an empirical
analysis." Mimeo,Tilburg University, 1995.
World Bank.World Bank Atlas, various years.
World Bank.World Development Report, various years.