Embed Size (px)
Citation preview
Decision Aiding
Mean utility in the assurance region model
Eduardo Conde *
Facultad de Matem�aaticas, Universidad de Sevilla C/ Tarfia s/n, 41012 Sevilla, Spain
Received 1 October 1999; accepted 8 June 2001
Abstract
This paper addresses the problem of ranking a finite set of alternatives through a linear utility with coefficients
randomly distributed. In order to model relative importance of the different criteria, assurance regions on weights are
used. A closed formula for the expected utility of each alternative is obtained under uniformity assumptions, and as a
consequence, different ranking methods are proposed. � 2002 Elsevier Science B.V. All rights reserved.
Keywords: Multicriteria analysis; Ranking; Random convex combinations; Assurance regions
1. Introduction
Making decisions when one or several random effects modify the consequences derived of suchdecisions is not an easy task. The problem falls into the field of stochastic programming (see [3,18]and references therein) and multicriteria decision making (MCDM) [4,15,19] and has countless prac-tical applications. However, in spite of its great interest, given a set of alternatives no choice of thebest alternative could be made without controversy. The lack of unquestionable behaviour rules insuch decision making situations is one of the reasons that motivate the widespread literature about thetopic.
One of the simplest problems in the area is the subject of this paper, a problem that can be written asfollows:
ðPÞmax hx; xis:t: x 2 X ;
where x ¼ ðx0;x1; . . . ;xnÞ is a random vector in Rnþ1, h�; �i denotes the usual inner product andX ¼ fa1; . . . ; amg � Rnþ1 is a finite subset of alternatives. In (P) each vector of weights x providesa complete ranking of the alternatives. However, it is not clear which is the most representativeranking.
European Journal of Operational Research 140 (2002) 93–103
www.elsevier.com/locate/dsw
*Fax: +34-954622800.
E-mail address: [email protected] (E. Conde).
0377-2217/02/$ - see front matter � 2002 Elsevier Science B.V. All rights reserved.
PII: S0377-2217 (01 )00220-X
If we had a closed formula for the probabilities
P ðx : hx; a� ajiÞP 0 8j ¼ 1; . . . ;m; ð1Þwe can select as the most preferred alternatives those a� 2 X maximizing (1), see e.g. [11].
However, in most cases there is not a closed formula for (1) thus it must be calculated through numericalintegration. For instance, if x is uniformly distributed over a bounded polyhedron, the probabilities (1)could be computed through the calculus of the volumes of general polyhedral, which is in general a heavytask [8].
To avoid these difficulties, some methodologies instead of (1) consider as most preferred any alternativea� such that
hx; a� ajiP 0 8j ¼ 1; . . . ;m ð2Þ
for some x. For example, in some models of data envelopment analysis (DEA) [1,5–7] the set of attributesfh0; h1; . . . ; hng is classified into two subsets, known as inputs and outputs, and propose a linear pro-gramming problem to check (2).
Hence, in (2) a best-case analysis is used, which implies that one cannot distinguish between two al-ternatives satisfying (2) even if one of them is better than the other, say, 99 out of 100 times.
Some authors [10,14] also find, as a drawback of this method, the absence of common weights for all thealternatives and derive procedures for overcoming this obstacle. In this paper, we will also obtain commonweights but, instead of using a procedure based on the best case, the expected value of each alternative iscalculated when a reasonable set of linear utilities is assumed.
To do this we use assurance regions, first proposed by Thompson et al. [16,17] in DEA, as a way tocontrol the relative importance of each criterion. These regions are polyhedral cones determined by lowerand upper bounds on the quotients of weights as follows:
06 aix0 6xi 6 bix0; i ¼ 1; . . . ; n; ðARabÞ
where 06 ai < bi for all i ¼ 1; . . . ; n.The remaining of the paper is structured as follows. Section 2 is devoted to obtain closed-form formulae
for the expectation and standard deviation of the utility function under uniformity assumptions. In Section3, a practical decision problem from the literature is revisited. A section of conclusions and an Appendix A,with the proofs of the results, end the paper.
2. Main results
In this section, the mean and variance of the utility of an arbitrary alternative, a, are determined. Thevector of weights, x, will be assumed to belong to the assurance region (ARab). As usual, a normalizationcondition on x, which guarantees the finiteness of the expected utility, is considered. Of course, there existmany ways to attain this goal. In what follows we assume that a linear normalization condition is given,namely, the vector x belongs to Wp, given by the intersection
Wp ¼ fx : hx; pi ¼ 1g\
fx : 06 aix0 6xi 6 bix0; i ¼ 1; . . . ; ng; ð3Þ
where p is any arbitrary nonnegative (nþ 1)-vector, such that Wp is compact, and we further assume that xis uniformly distributed over Wp.
The following proposition is a technical result stated by Charnes et al. in [5], and provides us the nec-essary tools to obtain closed-form formulae for the expectation and for the variance–covariance matrix ofthe random vector x.
94 E. Conde / European Journal of Operational Research 140 (2002) 93–103

Proposition 2.1. The assurance region (ARab) defines a pointed cone with the following set of vectors asgenerators:
xq ¼ 1;xq1; . . . ;x
qn
� �0; q ¼ 1; . . . ; 2n;
where for each subset Iq � f1; . . . ; ng of indices
xqi ¼ bi; i 2 Iq;
xqi ¼ ai; i 2 f1; . . . ; ng n Iq:
From Proposition 2.1 it is easy to see that a necessary and sufficient condition to guarantee the com-pactness of Wp is that
p0 þXni¼1
aipi > 0: ð4Þ
Let P be the set of permutations of f1; . . . ; ng and let r be one of these permutations. We denote by W rp
the n-simplex, included in Wp, whose vertices are the nþ 1 columns of the matrix Arp;
Arp ¼ cr
0
1a
� �; cr
1
1a þ ðbr1
ar1Þer1
� �; . . . ; cr
n1
a þPn
i¼1 ðbri ariÞeri
� �� �; ð5Þ
where eq; q ¼ 1; . . . ; n, are the canonical vectors of Rn; a is the transpose of ða1; . . . ; anÞ and
cri ¼ cr
i ðpÞ ¼1Pn
l¼1 alpl þPi
l¼0 ðbri ariÞpri
; i ¼ 0; 1; . . . ; n; ð6Þ
for each permutation r of P. Here, we have considered r0 ¼ 0; a0 ¼ 0 and b0 ¼ 1, which will simplifyforthcoming expressions.
Note that the columns of Arp are generators of (ARab), given in Proposition 2.1, normalized according to
hx; pi ¼ 1 and condition (4).
Proposition 2.2. The family of simplices fW rp : r 2 Pg is a partition of Wp.
This decomposition of Wp into a partition of simplices allows us to obtain a closed-form formulae for themean utility using the expression that Haines [11] proposes to the random convex combinations of thevertices of a simplex.
Theorem 2.1. One has
Epðhx; aiÞ ¼ 1Pr02P
Qni¼0 cr0
i
Xr2P
Yni¼0
cri
!Xni¼0
ari
Pk<i c
rk þ bri
Pnk¼i c
rk
nþ 1ari
" #: ð7Þ
Observation 2.1. The expression (7) of Theorem 2.1 takes a particularly simple form for Wp1 , where
p1 ¼ ð1; 0; . . . ; 0|fflfflfflffl{zfflfflfflffl}ðnÞ
Þ:
E. Conde / European Journal of Operational Research 140 (2002) 93–103 95

Indeed, in this case, cri ¼ 1 for all r 2 P and i ¼ 0; . . . ; n, what leads us, to the expression
Ep1ðhx; aiÞ ¼ 1
n!
Xr2P
Xni¼0
iari þ ðn iþ 1Þbri
nþ 1ari :
The average analysis of the utility of different alternatives should only be kept in mind in a practicalapplication if the variation of such values are relatively small (see [13]). In order to give a closed-formformulae for the variance of hx; ai for a given alternative, we also follow the results of Haines [11] that givesthis variance when x is uniformly distributed on a simplex. Let W r
p be this simplex, the variance–covariancematrix of x is
varðxÞ ¼ 1
ðnþ 1Þðnþ 2Þ Arp
� �I�
1
nþ 1J�Ar
p
� �T; ð8Þ
where J is a ðnþ 1Þ � ðnþ 1Þ matrix of ones and Arp is given in (5). From the probabilities P ðx 2 W r
p Þ givenin (A.12) and Theorem 2.1 we have the following:
Theorem 2.2. Let x be a random vector uniformly distributed over Wp, a 2 Rnþ1. Then
varpðhx; aiÞ ¼ 1Pr2P
Qni¼0 cr
i
Xr2P
Yni¼0
cri
!vðr; aÞ; ð9Þ
where
vðr; aÞ ¼ 1
ðnþ 1Þðnþ 2Þ aTAr
p I�
1
nþ 1J�ArT
p aþXni¼0
ari
Pk<i c
rk þ bri
Pnk¼i c
rk
nþ 1ari
Epðhx; aiÞ
!2
:
Using the expected utilities it is possible to rank any finite set of alternatives but the variance can alsohelp us to find good alternatives. For example, we can use an interval order � (see [9]) by matching eachalternative with a range of representative values of its utility or cost as follows:
a ! Epðhx; aiÞh
lffiffiffiffiffiffiffiffiffiffiffiffiffiffiffiffiffiffiffiffiffiffiffiffivarpðhx; aiÞ
p;Epðhx; aiÞ þ l
ffiffiffiffiffiffiffiffiffiffiffiffiffiffiffiffiffiffiffiffiffiffiffiffivarpðhx; aiÞ
p i; ð10Þ
where l is a free parameter that expresses the risk tendency of the decision maker. For the interval order analternative a is less preferred than other one b if and only if
Epðhx; aiÞ þ lffiffiffiffiffiffiffiffiffiffiffiffiffiffiffiffiffiffiffiffiffiffiffiffivarpðhx; aiÞ
p< Epðhx; biÞ l
ffiffiffiffiffiffiffiffiffiffiffiffiffiffiffiffiffiffiffiffiffiffiffiffivarpðhx; biÞ
p:
The width of the interval (10) as a function of the alternative a, that is
qðaÞ ¼ 2lffiffiffiffiffiffiffiffiffiffiffiffiffiffiffiffiffiffiffiffiffiffiffiffivarpðhx; aiÞ
pð11Þ
is what Fishburn calls the vagueness function and, in general, provokes the intransitiveness of the relation�.
3. Example
We consider a real-world decision problem from the literature, stated by Thompson et al. [17], whoevaluated in 1984 six feasible sites for locating a high-energy physics lab in Texas. The comparative siteanalysis was made by applying DEA, including project cost (h1), user time delay (h2) and environmental
96 E. Conde / European Journal of Operational Research 140 (2002) 93–103
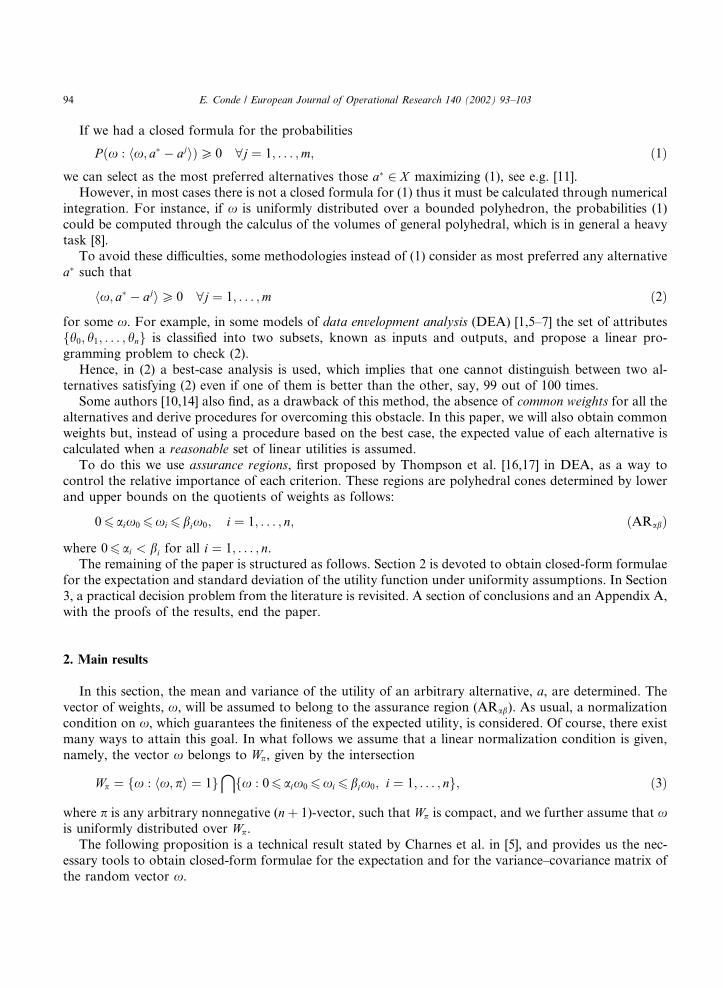
impact (h3) data. An assurance region was built and arguments were shown in [17] to bound the weights.Summarizing the evaluation process of the three characteristics on each site, they proposed Table 1 whereh1 was given in million 1984 dollars and h2, h3 were evaluated according to comparative indices proposed bythe authors (here, we have used the initial environmental index divided by 10 as it is indicated in Table 5,page 44 of [17]). All three valuations were considered as inputs or costs in an assurance region DEAanalysis ([16]) with the following constraints on the weights:
3:6x0 6x1 6 6:5x0; 0:104x0 6x2 6 0:939x0: ð12ÞBy Proposition 2.1 one has as generators of the cone (ARab) the four vectors
1
3:6
0:104
2664
3775;
1
3:6
0:939
2664
3775;
1
6:5
0:104
2664
3775;
1
6:5
0:939
2664
3775: ð13Þ
These vectors will be normalized by taking p ¼ ð1; 1; 1Þ, that is, we assume a uniform distribution of theweights in Wp.
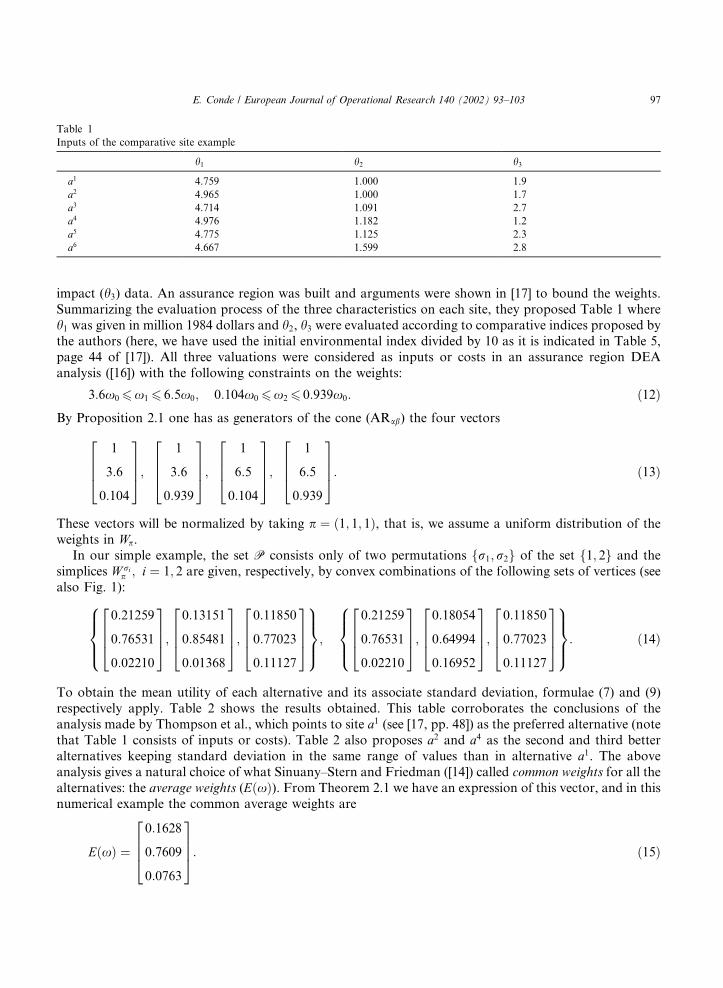
In our simple example, the set P consists only of two permutations fr1;r2g of the set f1; 2g and thesimplices W ri
p ; i ¼ 1; 2 are given, respectively, by convex combinations of the following sets of vertices (seealso Fig. 1):
0:21259
0:76531
0:02210
2664
3775;
0:13151
0:85481
0:01368
2664
3775;
0:11850
0:77023
0:11127
2664
3775
8>><>>:
9>>=>>;;
0:21259
0:76531
0:02210
2664
3775;
0:18054
0:64994
0:16952
2664
3775;
0:11850
0:77023
0:11127
2664
3775
8>><>>:
9>>=>>;: ð14Þ
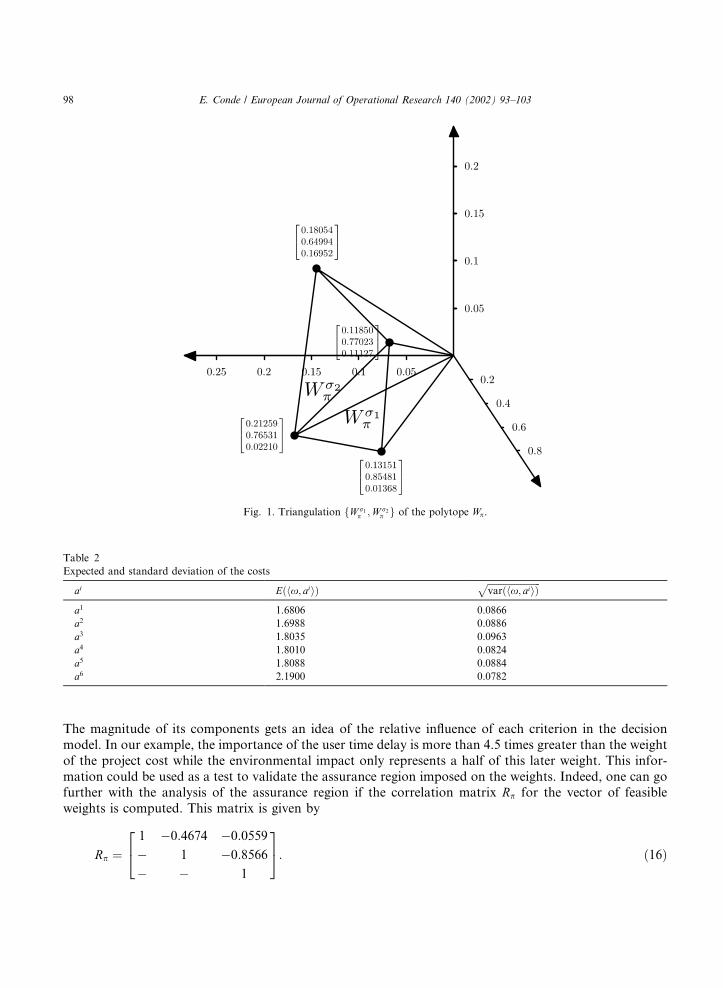
To obtain the mean utility of each alternative and its associate standard deviation, formulae (7) and (9)respectively apply. Table 2 shows the results obtained. This table corroborates the conclusions of theanalysis made by Thompson et al., which points to site a1 (see [17, pp. 48]) as the preferred alternative (notethat Table 1 consists of inputs or costs). Table 2 also proposes a2 and a4 as the second and third betteralternatives keeping standard deviation in the same range of values than in alternative a1. The aboveanalysis gives a natural choice of what Sinuany–Stern and Friedman ([14]) called common weights for all thealternatives: the average weights (EðxÞ). From Theorem 2.1 we have an expression of this vector, and in thisnumerical example the common average weights are
EðxÞ ¼
0:1628
0:7609
0:0763
2664
3775: ð15Þ
Table 1
Inputs of the comparative site example
h1 h2 h3
a1 4.759 1.000 1.9
a2 4.965 1.000 1.7
a3 4.714 1.091 2.7
a4 4.976 1.182 1.2
a5 4.775 1.125 2.3
a6 4.667 1.599 2.8
E. Conde / European Journal of Operational Research 140 (2002) 93–103 97
The magnitude of its components gets an idea of the relative influence of each criterion in the decisionmodel. In our example, the importance of the user time delay is more than 4.5 times greater than the weightof the project cost while the environmental impact only represents a half of this later weight. This infor-mation could be used as a test to validate the assurance region imposed on the weights. Indeed, one can gofurther with the analysis of the assurance region if the correlation matrix Rp for the vector of feasibleweights is computed. This matrix is given by
Rp ¼1 0:4674 0:0559
1 0:8566
1
24
35: ð16Þ
Fig. 1. Triangulation fW r1p ;W r2
p g of the polytope Wp.
Table 2
Expected and standard deviation of the costs
ai Eðhx; aiiÞffiffiffiffiffiffiffiffiffiffiffiffiffiffiffiffiffiffiffiffiffiffiffiffivarðhx; aiiÞ
pa1 1.6806 0.0866
a2 1.6988 0.0886
a3 1.8035 0.0963
a4 1.8010 0.0824
a5 1.8088 0.0884
a6 2.1900 0.0782
98 E. Conde / European Journal of Operational Research 140 (2002) 93–103
The analysis of Rp can help to detect the opposite character of the three criteria: the negative linearcorrelations between each pair of weights, indicate that an increase of one of the weights motivates thedecreasing of the remaining of weights. Particular attention must be paid to the strong linear depen-dence existing between the weights of the user time delay and the environmental impact. On other hand,the weights associated with the project cost and to the environmental impact seem to be practicallyuncorrelated.
4. Concluding remarks
In this paper a decision making model with random linear utilities is presented. The vector ofweights is assumed to be uniformly distributed in an assurance region. By triangulating the polyhedralcone defined by the assurance region, it is possible to determine closed-form formulae for the values ofthe mean and variance of the utility of each alternative, yielding (at a very low computational cost)meaningful indicators. This is illustrated by means of an example taken from the literature. As aconsequence, the set of alternatives can be either completely ranked through a pure average analysis ofthe utility or partially ranked using existing approaches which combine average and standard deviationof the utility.
Acknowledgements
The author acknowledge the referee for making helpful suggestions on an earlier version of this paper.This research has been supported by Grant PB96-1416-C02-02 of DGES, Spain.
Appendix A. Proofs of theorems and propositions
A.1. Proof of Proposition 2.2
Let us first show the result for the particular case Wp1 ,
Wp1 ¼ fx : hx; p1i ¼ 1g\
fx : 06 aix0 6xi 6 bix0; i ¼ 1; . . . ; ng; ðA:1Þ
where
p1 ¼ ð1; 0; . . . ; 0|fflfflfflffl{zfflfflfflffl}ðnÞ
Þ:
For this region, cri ¼ 1 for i ¼ 0; 1; . . . ; n (see expression (6)).
It is obvious thatS
r2P Wrp1 � Wp1 , so let x be a vector of Wp1 (x0 ¼ 1), and suppose without loss of
generality that
06xn an
bn an6
xn 1 an 1
bn 1 an 1
6 � � � 6 x2 a2
b2 a2
6x1 a1
b1 a1
6 1: ðA:2Þ
E. Conde / European Journal of Operational Research 140 (2002) 93–103 99

Let r ¼ ðr1; r2; . . . ; rnÞ ¼ ð1; 2; . . . ; nÞ. The following identity can be written:
x1 a1
x2 a2
:::
xn 1 an 1
xn an
2666666664
3777777775¼ ~kk1
b1 a1
0:::00
2666666664
3777777775þ ~kk2
b1 a1
b2 a2
:::00
2666666664
3777777775þ � � � þ ~kkn
b1 a1
b2 a2
:::
bn 1 an 1
bn an
2666666664
3777777775
ðA:3Þ
with
~kki ¼xri ari
bri ari
xriþ1 ariþ1
briþ1 ariþ1
¼ xi ai
bi ai xiþ1 aiþ1
biþ1 aiþ1
; ðA:4Þ
where ~kki 2 ½0; 1�, i ¼ 1; . . . ; n 1, and
~kkn ¼xn an
bn an2 ½0; 1�:
It can be easily verified that
Xni¼1
~kki ¼x1 a1
b1 a1
6 1:
Hence Eq. (A.3) is equivalent to
x ¼
1x1
:::
xn 1
xn
2666666664
3777777775¼ k0
1a1
:::
an 1
an
2666666664
3777777775þ k1
1b1
:::
an 1
an
2666666664
3777777775þ � � � þ kn 1
1b1
:::
bn 1
an
2666666664
3777777775þ kn
1b1
:::
bn 1
bn
2666666664
3777777775; ðA:5Þ
where
k0 ¼ 1 Xni¼1
~kki; ki ¼ ~kki; i ¼ 1; . . . ; n; ðA:6Þ
that is x 2 W rp1 .
To end the proof it is easy to see that the interior of two different simplices W rp1 and W r0
p1 have emptyintersection. Indeed the permutations r and r0 induce two different rankings of the fractions
xi ai
bi ai; i ¼ 1; . . . ; n:
Hence, if x 2 W rp1 \ W r0
p1 at least one pair of consecutive fractions in each ranking must be equal, that is
xri ari
bri ari
¼ xriþ1 ariþ1
briþ1 ariþ1
;xr0
i0 ar0
i0
br0i0 ar0
i0
¼xr0
i0þ1 ar0
i0þ1
br0i0þ1
ar0i0þ1
for some i; i0 in 1; 2; . . . ; n 1. Hence, by (A.4) and (A.6), x is not an interior point of none of the twosimplices.
100 E. Conde / European Journal of Operational Research 140 (2002) 93–103

Let us now show the result for a general Wp (see (3)). First, as before,S
r2P W rp � Wp, so let x be a
vector in Wp. Observe that, x0 6¼ 0, since else as aix0 6xi 6 bix0, one would have x ¼ 0 and hencex 62 Wp.
By (A.1), ð1=x0Þx 2 Wp1 and using the first part of this proof, there exists r 2 P such thatð1=x0Þx 2 W r
p1 , then
1
x0
x ¼ Arp1k $ x ¼ Ar
pkp ðA:7Þ
for some k ¼ ðk0; k1; . . . ; knÞ, ki 2 ½0; 1� for all i, k0 þ � � � þ kn ¼ 1 and kpi ¼ x0kiðcr
i Þ 1 P 0 for i ¼ 0; 1; . . . ; n.
By construction, ðcri Þ
1is the inner product of p and the (iþ 1)th column of Ar
p1 so,
Xni¼0
kpi ¼ x0hAr
p1k; pi ¼ x0
1
x0
x; p
% &¼ hx; pi ¼ 1:
Hence, x 2 W rp , that is
Wp ¼[r2P
W rp :
Finally, using (A.7) and a similar reasoning to that of the first part of the proof, one can easily deduce thatfW r
p ; r 2 Pg is a partition of Wp. �
A.2. Proof of Theorem 2.1
From Proposition 2.2 we can write
Epðhx; aiÞ ¼Xr2P
P ðx 2 W rp ÞE
hx; aix 2 W r
p
(((() *
: ðA:8Þ
Since W rp is an n-simplex we know [12] that its volume volðW r
p Þ is given by
volðW rp Þ ¼
1
n!Ar
p
(( ((; ðA:9Þ
where Arp is defined in (5).
From (A.9) we have that
volðW rp Þ ¼
1
n!
Yni¼0
cri bri
+� ari
,�: ðA:10Þ
Proposition 2.2 and the uniformity of the random vector x over Wp imply that
P ðx 2 W rp Þ ¼
Qni¼0 cr
i bri ari
+ ,� �Pr02P
Qni¼0 cr
i bri ari
+ ,� � ¼ Qni¼0 cr
i bi aið Þ� �P
r02PQn
i¼0 cri bi aið Þ½ � : ðA:11Þ
Then,
P ðx 2 W rp Þ ¼
Qni¼0 cr
iPr02P
Qni¼0 cr
i: ðA:12Þ
E. Conde / European Journal of Operational Research 140 (2002) 93–103 101
Finally from [11] we know that
Ehx; ai
x 2 W rp
(((() *
¼ 1
nþ 1ða0; a1; . . . ; anÞAr
p
1
1
:
:
:
1
2666666666664
3777777777775
¼ 1
nþ 1ða0; a1; . . . ; anÞ
cr0 cr
1 . . . crn
a a þ ðbr1 ar1
Þer1 . . . a þPn
i¼1 ðbri ariÞeri
" #1
1
:
:
:
1
2666666666664
3777777777775
¼Xni¼0
ari
Pk<i c
rk þ bri
Pnk¼i c
rk
nþ 1ari : � ðA:13Þ
A.3. Proof of Theorem 2.2
For any random variables X ; Y , if EðX 2Þ exists, then
varðX Þ ¼ E varX
Y
(((() *� �
þ var EX
Y
(((() *� �
ðA:14Þ
(see, for example, Theorem 8.8.2 of [2]).As x is distributed on a compact set, it is clear, for each a, that hx; ai2 is bounded, so Eðhx; ai2Þ exists.Hence, by (A.14)
var hx; aið Þ ¼Xr2P
P x 2 W rp
+ ,var
hx; aix 2 W r
p
(((( !
þXr2P
P x 2 W rp
+ ,E
hx; aix 2 W r
p
(((( !
Ep hx; aið Þ!2
:
Using expressions (8), (A.11), (A.13) one has the closed-form formulae of the variance (9). �
References
[1] R.D. Banker, A. Charnes, W.W. Cooper, Some models for estimating technical and scale inefficiencies in data envelopment
analysis, Management Science 30 (9) (1987) 1078–1092.
[2] R. Bartoszy�nnski, M. Niewiadomska-Bugaj, Probability and Statistical Inference. Series in Probability and Statistics, Wiley, New
York, 1996.
[3] J.R. Birge, F. Louveaux, Introduction to Stochastic Programming, Springer, New York, 1997.
102 E. Conde / European Journal of Operational Research 140 (2002) 93–103
[4] V. Changkong, Y.Y. Haimes, Multiobjective Decision Making: Theory and Methodology, North-Holland, Amsterdam, 1983.
[5] A. Charnes, W.W. Cooper, Z.M. Huang, D.B. Sun, Relations between half-space and finitely generated cones in polyhedral cone-
ratio models, International Journal of System Science 22 (11) (1991) 2057–2077.
[6] A. Charnes, W.W. Cooper, E. Rhodes, Measuring the efficiency of decision making units, European Journal of Operational
Research 2 (1978) 429–444.
[7] A. Charnes, W.W. Cooper, Q.L. Wei, Z.M. Huang, Cone-ratio data envelopment analysis and multiobjective programming,
International Journal of System Science 20 (1989) 1099–1118.
[8] M.E. Dyer, A.M. Frieze, On the complexity of computing the volume of a polyhedron, SIAM Journal on Computing 17 (5) (1988)
967–974.
[9] P.C. Fishburn, Utility Theory for Decision Making, Wiley, New York, 1970.
[10] J.A. Ganley, S.A. Cubbin, Public Sector Efficiency Measurement: Applications of Data Envelopment Analysis, North-Holland,
Amsterdam, 1992.
[11] L.M. Haines, A statistical approach to the analytic hierarchy process with interval judgements. (1) Distributions on feasible
regions, European Journal of Operational Research 110 (1998) 112–125.
[12] M.G. Kendall, A Course in the Geometry of n Dimensions, Griffin, London, 1961.
[13] A. Pr�eecopa, Stochastic Programming, Kluwer Academic Publishers, Dordrecht, 1995.
[14] Z. Sinuany-Stern, L. Friedman, DEA and the discriminant analysis of ratios for ranking units, European Journal of Operational
Research 111 (1998) 470–478.
[15] R.E. Steuer, Multiple Criteria Optimization, Wiley, New York, 1985.
[16] R.G. Thompson, P.S. Dharmapala, E.J. Gatewood, S. Macy, R.M. Thrall, DEA/assurance region SBDC efficiency and unique
projections, Operations Research 44 (1996) 533–543.
[17] R.G. Thompson, F.D. Singleton, R.M. Thrall, B.A. Smith, Comparative site evaluations for locating a high-energy physics lab in
Texas, Interfaces 16 (1986) 35–49.
[18] R.J.-B. Wets, Stochastic programming, in: G.L. Nemhauser, A.H.G. Rinnooy Kan, M.J. Todd (Eds.), Handbooks in Operations
Research and Management Science, vol. 1, North-Holland, Amsterdam, 1989, pp. 573–630 (Chapter 8).
[19] P.L. Yu, Multiple Criteria Decision Making: Concepts, Techniques and Extensions, Plenum Press, New York, 1985.
E. Conde / European Journal of Operational Research 140 (2002) 93–103 103