Embed Size (px)
Citation preview

A General Software Readability Model Jonathan Dorn December 18, 2012
1

Software Maintenance Costs
Maintenance The Rest 0%
100% So#ware Costs
• Maintenance may cost up to 9x all other development costs.
2 R.C. Seacord, D. Plakosh, and G.A. Lewis. Modernizing Legacy Systems: SoKware Technologies, Engineering Process and Business PracNces. Addison-‐Wesley Longman Publishing Co. Inc., Boston, MA, USA, 2003.

Reading and Maintenance
3 * D. R. Raymond, “Reading source code,” in Conference of the Centre for Advanced Studies on Collabora5ve Research, 1991.
“A central acNvity in soKware maintenance is reading.”*

Reading and Maintenance
4 * D. R. Raymond, “Reading source code,” in Conference of the Centre for Advanced Studies on Collabora5ve Research, 1991.
“A central acNvity in soKware maintenance is reading.”*

readability, n. The ease with which a text may be scanned or read; the quality in a book, etc., of being easy to understand and enjoyable to read.
www.oed.com 5

Making Code More Readable • Programming languages • Literate Programming (e.g. CWEB) [Knuth 1984] • Python [Van Rossum 1996]
• Development Process • Readability development phase [Elshoff & Marcohy 1982] • Readability review phase [Knight & Myers 1993] • Readability team [Haneef 1998]
6

Is It Working?
• 90% in survey desire readability metric. • 3rd most requested metric.
7 R.P.L. Buse and T. Zimmermann, “InformaNon needs for soKware development analyNcs,” in InternaNonal Conference on SoKware Engineering, 2012.

Parallels: English Readability • Flesch-‐Kincaid Grade Level
• Government mandated • Military manuals: 9th grade DOD MIL-‐M-‐28784B • Insurance policies: 10th grade C.R.S 10-‐16-‐107.3 (1)(a)
8

Flesch-‐Kincaid Grade Level
• Simple surface-‐level features (syllables, words, sentences).
• Weights calculated using regression analysis.
9
0.39
�total words
total sentences
�+ 11.8
�total syllables
total words
�− 15.59

Flesch-‐Kincaid Grade Level
• Simple surface-‐level features (syllables, words, sentences).
• Weights calculated using regression analysis.
10
0.39
�total words
total sentences
�+ 11.8
�total syllables
total words
�− 15.59

Flesch-‐Kincaid Grade Level
• Simple surface-‐level features (syllables, words, sentences).
• Weights calculated using regression analysis.
11
0.39
�total words
total sentences
�+ 11.8
�total syllables
total words
�− 15.59

Learning a Readability Metric
12
Regression Metric
f = β1x1 + β0
✔✖ ✔
✔/✖?

Source Code Readability • Buse & Weimer 2008 • 25 surface features (max line length, average whitespace, etc.)
• Posneh, et al. 2011 13
8.87−0.033(Halstead volume)+0.4(total lines)−1.5(token entropy)

Problem solved?
14

Code Examples
15

16
Code Examples

1 5 Humans
Example Readability
17
Readability RaNng

1 5 Buse Metric Humans
Metric Mismatch
18
Readability RaNng

What happened?
19

What Happened? Model • Character features only. • Missing: • Structural paherns. • Line-‐to-‐line variaNon. • SpaNal layout. • Syntax highlighNng.
Ground Truth • Small survey • 120 parNcipants.
• Similar backgrounds • All UVa students.
• One programming language • Java.
• Short code samples • 4 – 13 lines.
20

General Readability Metric 1. New model. • Buse baseline features • AddiNonal visual features
2. Ground truth from a large human study. 3. Combine and evaluate.
21

General Readability Metric 1. New model. • Buse baseline features • AddiGonal visual features
2. Ground truth from a large human study. 3. Combine and evaluate
22

Visual Structural Features
23

Visual Structural Features • Line-‐to-‐line periodic structure • E.g. indentaNon.
• How can we measure periodicity?
24

Fourier Series • Idea: periodic funcNons can be wrihen as the sum of a series of sines.
25
∞�
n=−∞cn (cos(nx) + i sin(nx))

Discrete Fourier Transforms • The Discrete Fourier Transform (DFT) computes the coefficients.
• Bandwidth: the range of important coefficients.
• Common in signal processing. 26
Frequency
Amplitude
−50 0 500
300

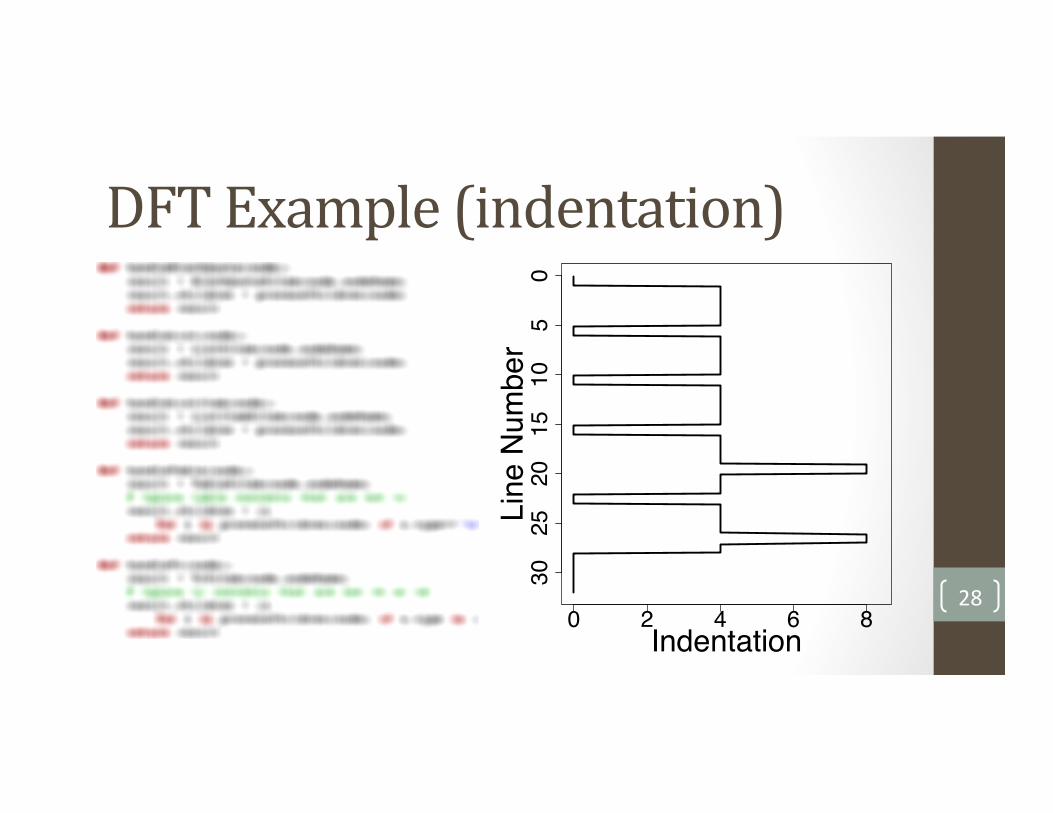
Visual Structural Features • Sample at each line.
• Take DFT of samples.
• Record bandwidth. 27
0 2 4 6 8
3025
2015
105
0
Indentation
Line
Num
ber
DFT Example (indentation)
28

0 2 4 6 8
3025
2015
105
0
Indentation
Line
Num
ber
DFT Example (indentation)
29 050
100
150
Frequency
Amplitude
−128 0 128

050
100
150
Frequency
Amplitude
−128 0 128
DFT Example (indentation)
30 0 2 4 6 8
3025
2015
105
0
Indentation
Line
Num
ber

0 2 4 6 8
3025
2015
105
0
Indentation
Line
Num
ber
DFT Example (indentation)
31 050
100
150
Frequency
Amplitude
−128 0 128

Spatial Layout Features
32

Spatial Layout Features • FracNon of screen occupied by each color. • Count area highlighted with each color. • Record raNos between colors.
• Paherns of color. • Construct matrix of 0s (whitespace) and 1s (highlighted text). • Compute 2D DFT of matrix. • Record average bandwidth in X and Y dimensions.
33

DFT Example (comments)
34

DFT Example (comments)
35
X
YAm
plitude

DFT Example (comments)
36
X
YAm
plitude

Alignment Features • IdenNfy 3+ lines with same token/token or token/whitespace transiNons.
• Record number and length of matches.
37

Linguistic Features • Average dicNonary words in idenNfiers • Underscore-‐separated words • CamelCase • Prefix and suffix
38

General Readability Metric 1. New model. • Buse baseline features • AddiNonal visual features
2. Ground truth from a large human study. 3. Combine and evaluate.
39

Ground-‐Truth Survey • Similar backgrounds (all UVa students).
• Single programming language (Java).
• Short code samples (4 – 13 lines).
40

Ground-‐Truth Survey • Similar backgrounds (all UVa students).
• Single programming language (Java).
• Short code samples (4 – 13 lines).
41

Ground-‐Truth Survey • Similar backgrounds (all UVa students). • Diverse backgrounds: • Udacity students: beginners, professionals learning Python • reddit users: forum on programming
• Single programming language (Java).
• Short code samples (4 – 13 lines). 42

Ground-‐Truth Survey • Diverse backgrounds: Udacity students, reddit users.
• Single programming language (Java).
• Short code samples (4 – 13 lines).
43

Ground-‐Truth Survey • Diverse backgrounds: Udacity students, reddit users.
• Single programming language (Java). • MulNple languages: Java, Python, CUDA.
• Short code samples (4 – 13 lines).
44

Ground-‐Truth Survey • Diverse backgrounds: Udacity students, reddit users.
• MulNple languages: Java, Python, CUDA.
• Short code samples (4 – 13 lines).
45

Ground-‐Truth Survey • Diverse backgrounds: Udacity students, reddit users.
• MulNple languages: Java, Python, CUDA.
• Short code samples (4 – 13 lines). • Three code sample lengths: 10, 30, and 50 lines.
46

Code Samples • Top-‐ten most recently updated projects in SourceForge.
• 360 total code samples. • 120 samples from each language. • 120 samples of each length.
• Survey takers rated 20 randomly selected samples. • Syntax pre-‐highlighted on server. 47

Survey Summary • Over 76,000 individual raNngs (6x larger). • Over 2,600 completed surveys (21x larger).
48
Category Median (yrs) > 1 year > 5 years > 10 years
Overall 8 2598 1972 1242
Java 2 1896 646 247
Python 1 1655 253 59
CUDA 0 181 8 2
School 3 2118 522 28
Industry 3 1808 1091 655

Survey Summary • Over 76,000 individual raNngs (6x larger). • Over 2,600 completed surveys (21x larger).
49
Category Median (yrs) > 1 year > 5 years > 10 years
Overall 8 2598 1972 1242
Java 2 1896 646 247
Python 1 1655 253 59
CUDA 0 181 8 2
School 3 2118 522 28
Industry 3 1808 1091 655

Survey Summary • Over 76,000 individual raNngs (6x larger). • Over 2,600 completed surveys (21x larger).
50
Category Median (yrs) > 1 year > 5 years > 10 years
Overall 8 2598 1972 1242
Java 2 1896 646 247
Python 1 1655 253 59
CUDA 0 181 8 2
School 3 2118 522 28
Industry 3 1808 1091 655

Survey Summary • Over 76,000 individual raNngs (6x larger). • Over 2,600 completed surveys (21x larger).
51
Category Median (yrs) > 1 year > 5 years > 10 years
Overall 8 2598 1972 1242
Java 2 1896 646 247
Python 1 1655 253 59
CUDA 0 181 8 2
School 3 2118 522 28
Industry 3 1808 1091 655

General Readability Metric 1. New model. • Buse baseline features • AddiNonal visual features
2. Ground truth from a large human study. 3. Combine and evaluate.
52

1 5 New Metric Humans
Example Readability
53
Readability RaNng
Buse Metric

Annotators (sorted)
Cor
rela
tion
0 4600−10
1
avg: 0.512median: 0.551our metric: 0.724
Buse metric: 0.309
Annotator Agreement • Spearman correlaNon: Agreement on ordering
54
Score Meaning +1 Perfect agreement 0 No relaNonship -‐1 Perfect disagreement

Impact of New Features • How much improvement is due to our new features? • Re-‐train Buse metric with our survey results. • Compare our metric (old + new features) to Buse metric (old features only) 55

Impact of New Features • Compute f-‐measure:
56
Predicted ✔ ✖
Actual
✔ TP FN ✖ FP TN
f = 2 · precision · recall
precision + recall
precision =TP
TP + FP
recall =TP
TP + FN

Head-‐to-‐Head F-‐Measure
• MulN-‐language • 5% improvement
• Single-‐language • 16-‐26% improvement
57
Our MetricRetrained Buse Metric
F−m
easu
re0.
51
CUDA Python StudentJava Industry All

Predictors of Readability All Languages, All Lengths
Category DescripGon +/-‐
Syntax Line Length -‐
Syntax Long lines -‐
Visual Operator area -‐
Structural 1D DFT of syntax -‐
Visual 2D DFT of comments +
Visual String area to keyword area
+
Alignment Min alignment length +
5+ Years Industry Experience Category DescripGon +/-‐
Syntax Long lines -‐
Syntax Whitespace -‐
Visual Comment area +
Structural 1D DFT of whitespace -‐
58

Predictors of Readability All Languages, All Lengths
Category DescripGon +/-‐
Syntax Line Length -‐
Syntax Long lines -‐
Visual Operator area -‐
Structural 1D DFT of syntax -‐
Visual 2D DFT of comments +
Visual String area to keyword area
+
Alignment Min alignment length +
5+ Years Industry Experience Category DescripGon +/-‐
Syntax Long lines -‐
Syntax Whitespace -‐
Visual Comment area +
Structural 1D DFT of whitespace -‐
59

Predictors of Readability Java
Category DescripGon +/-‐
Structural 1D DFT of whitespace
-‐
Syntax Long lines -‐
Syntax Lines between idenNfiers
-‐
Syntax Keywords +
Structural 1D DFT of syntax -‐
Python Category DescripGon +/-‐
Syntax IdenNfiers -‐
LinguisNc IdenNfier components -‐
Visual Operator area to keyword area
-‐
Structural Operator to idenNfier tokens
+
Structural 1D DFT of syntax -‐
60

Conclusion • Visual and spaGal features can significantly improve the accuracy of readability metrics. • Different features are more predicNve for different languages.
• Largest human study of readability raNngs to date. • Survey data is available online.
61

Questions?
62