Embed Size (px)
Citation preview
Maximum Likelihood Network Topology Identification
Mark CoatesMcGill University
Robert Nowak Rui CastroRice University
DYNAMICS May 5th,2003
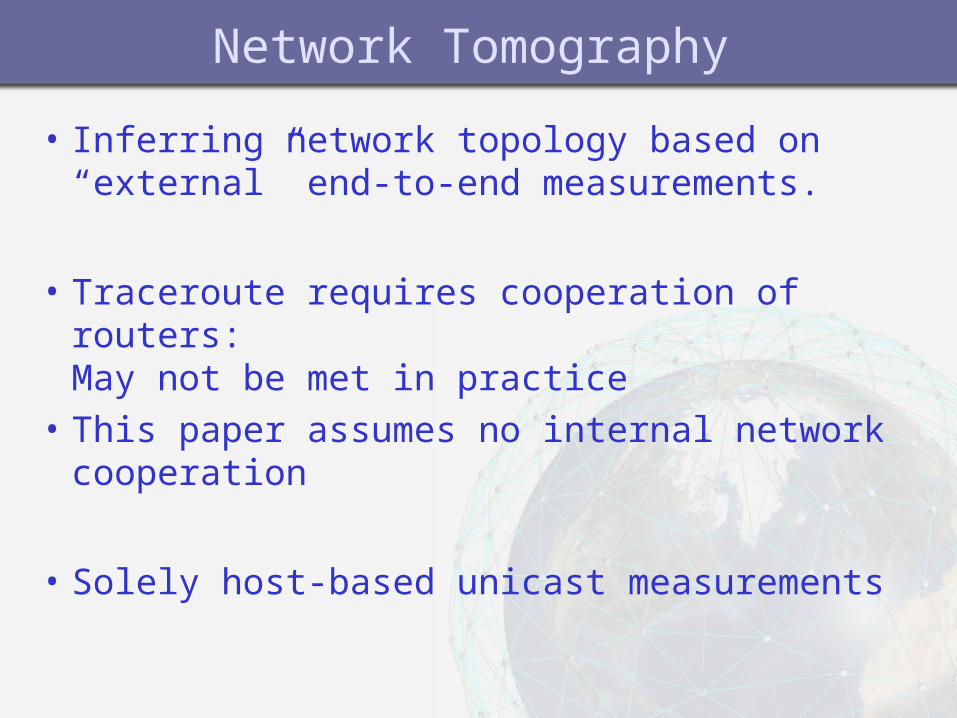
Network Tomography
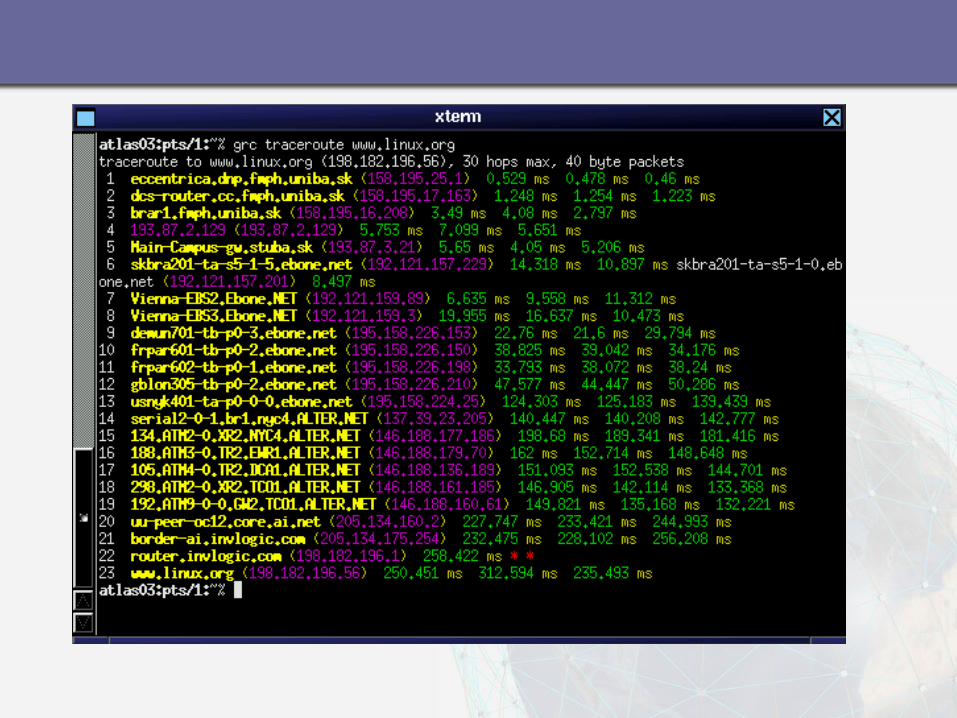
• Inferring network topology based on “external” end-to-end measurements.
• Traceroute requires cooperation of routers:May not be met in practice
• This paper assumes no internal network cooperation
• Solely host-based unicast measurements
How does it work?
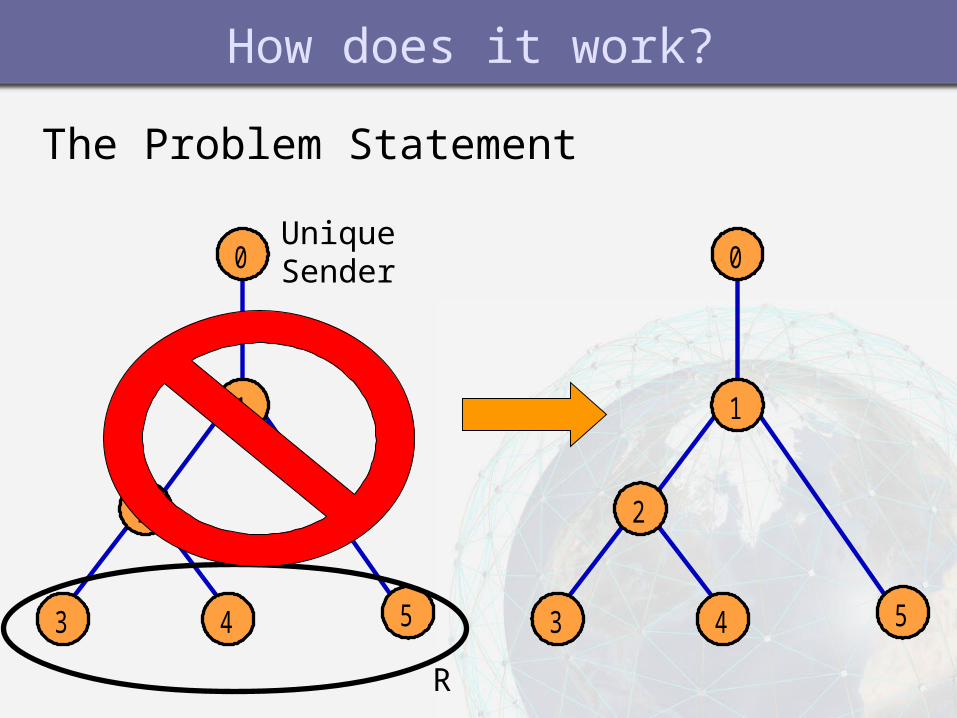
The Problem Statement
0
1
2
53 4
0
1
2
53 4
R
Unique Sender
How does it work?
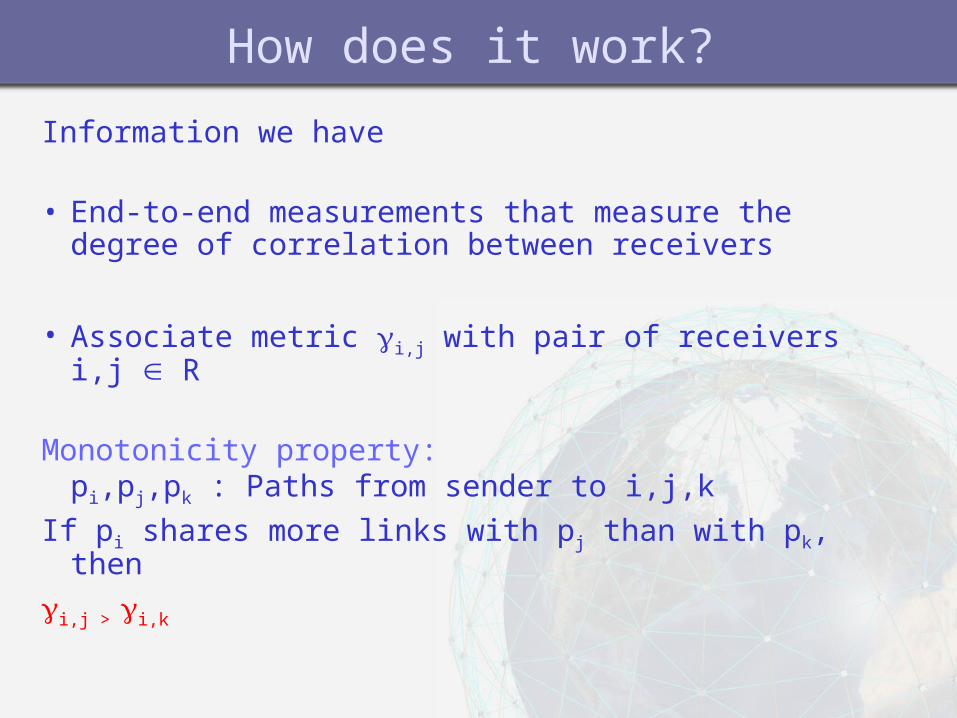
Information we have
• End-to-end measurements that measure the degree of correlation between receivers
• Associate metric i,j with pair of receivers i,j R
Monotonicity property: pi,pj,pk : Paths from sender to i,j,k
If pi shares more links with pj than with pk, then
i,j > i,k
An example
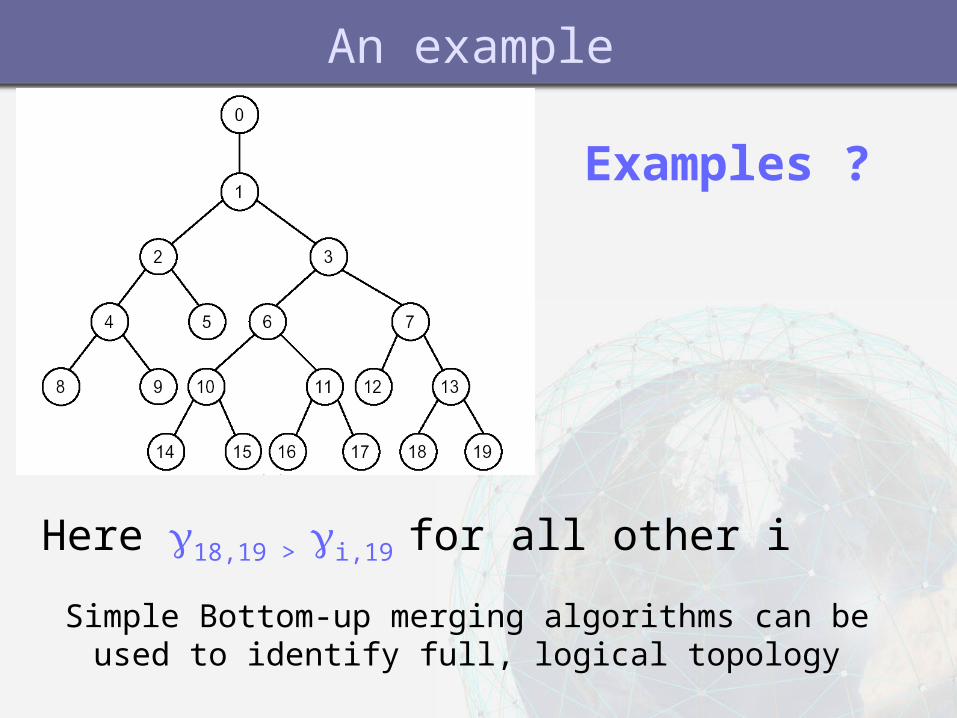
Here 18,19 > i,19 for all other i
Examples ?
Simple Bottom-up merging algorithms can be used to identify full, logical topology
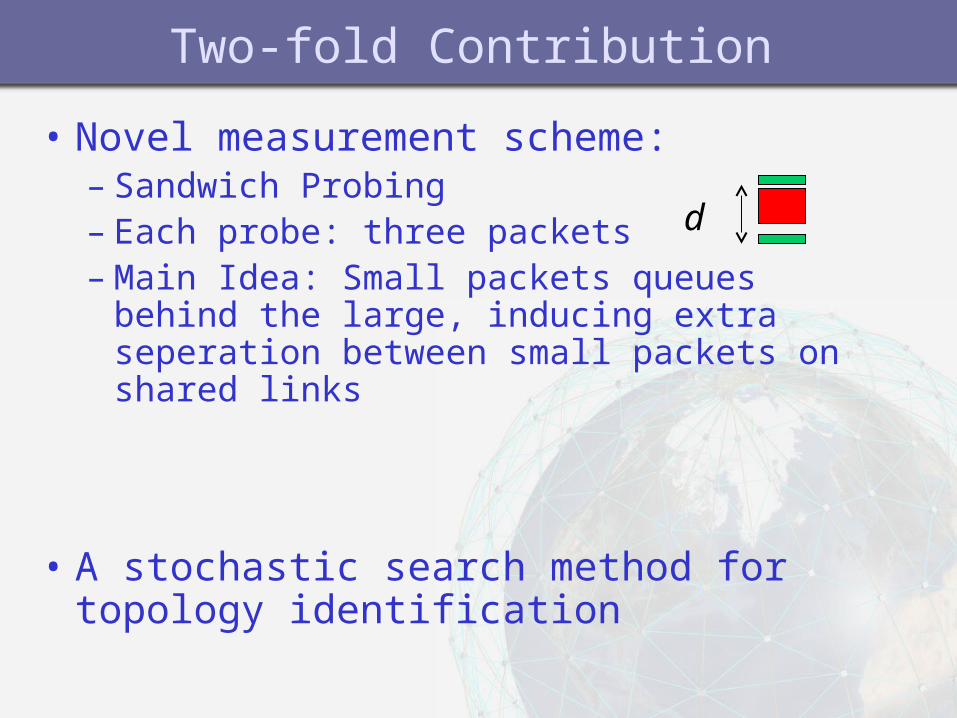
Two-fold Contribution
• Novel measurement scheme: – Sandwich Probing– Each probe: three packets– Main Idea: Small packets queues behind the
large, inducing extra seperation between small packets on shared links
• A stochastic search method for topology identification
d
0
1
2
53 4
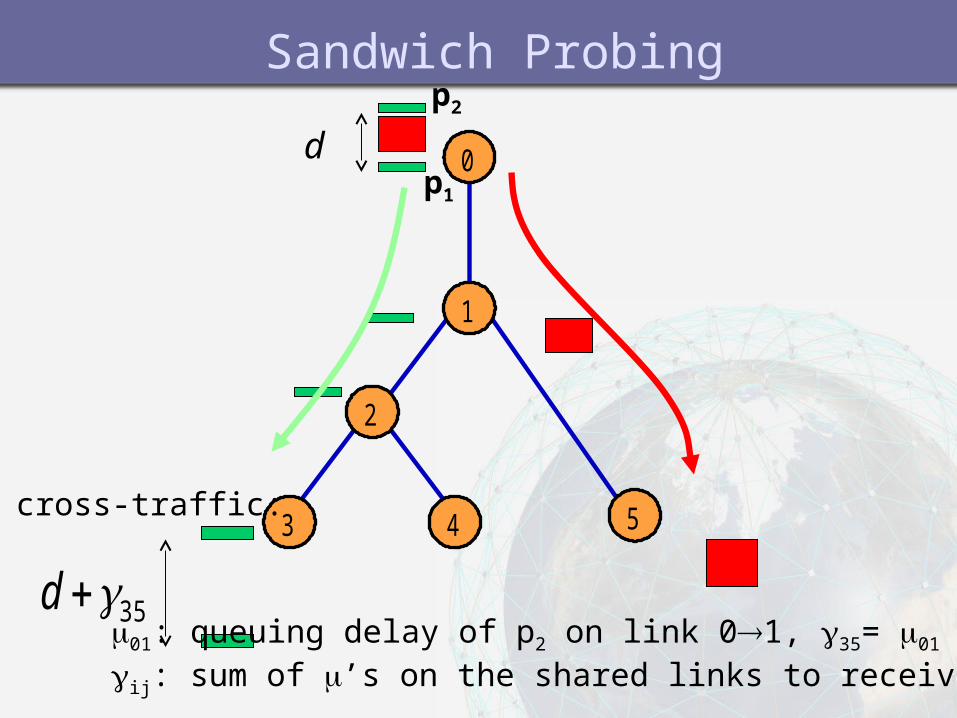
Sandwich Probing
35d
d
01: queuing delay of p2 on link 01, 35= 01
ij: sum of ’s on the shared links to receiver i and j
no cross-traffic:
p1
p2
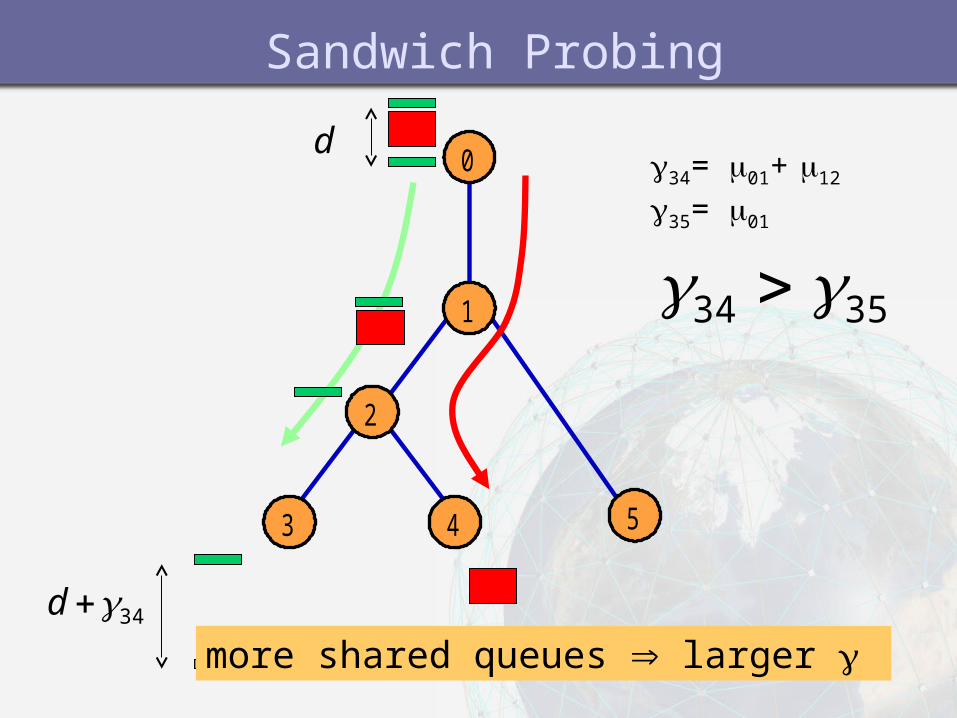
34d
0
1
2
53 4
more shared queues larger
3534
d34= 01+ 12
35= 01
Sandwich Probing
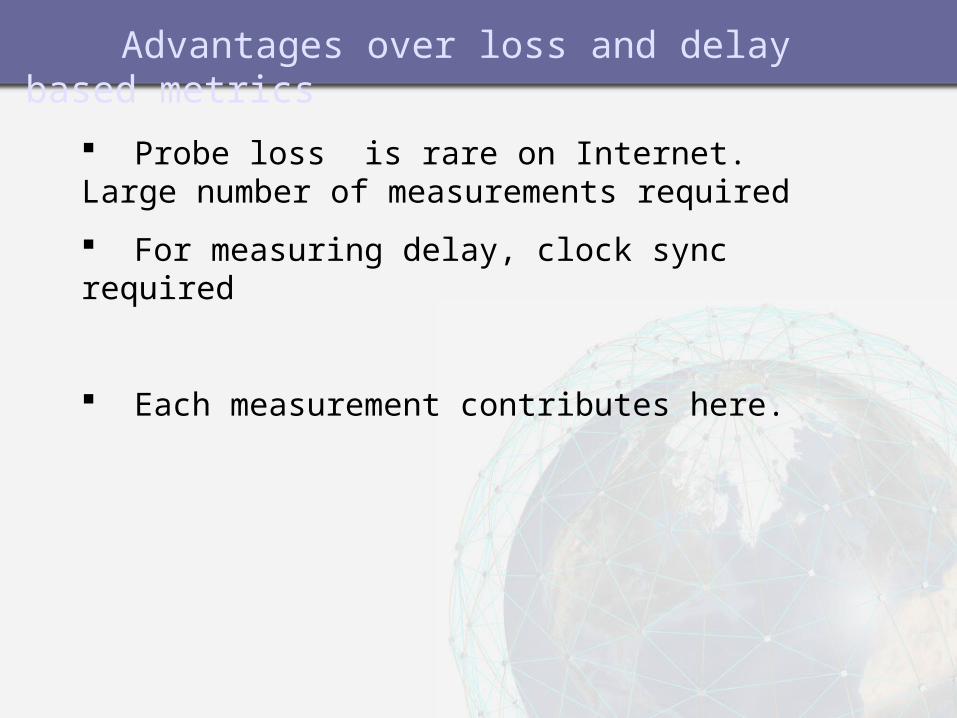
Advantages over loss and delay based metrics
Probe loss is rare on Internet. Large number of measurements required
For measuring delay, clock sync required
Each measurement contributes here.
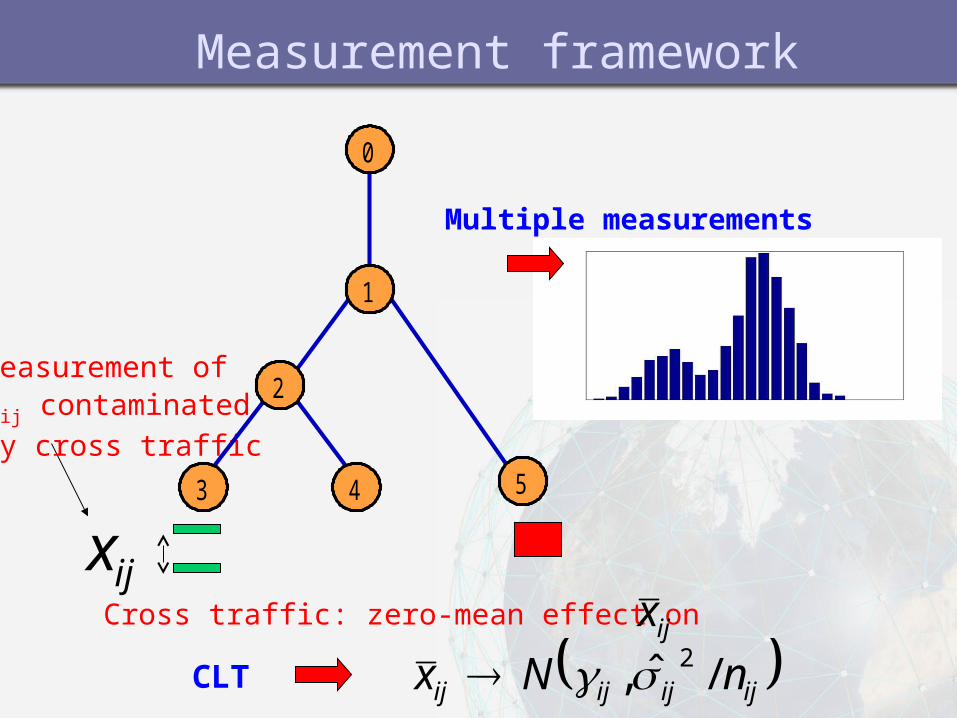
Measurement framework
ijx
Measurement ofij contaminated
by cross traffic
Multiple measurements
ijijijij nNx /ˆ, 2CLT
0
1
2
53 4
Cross traffic: zero-mean effect on ijx
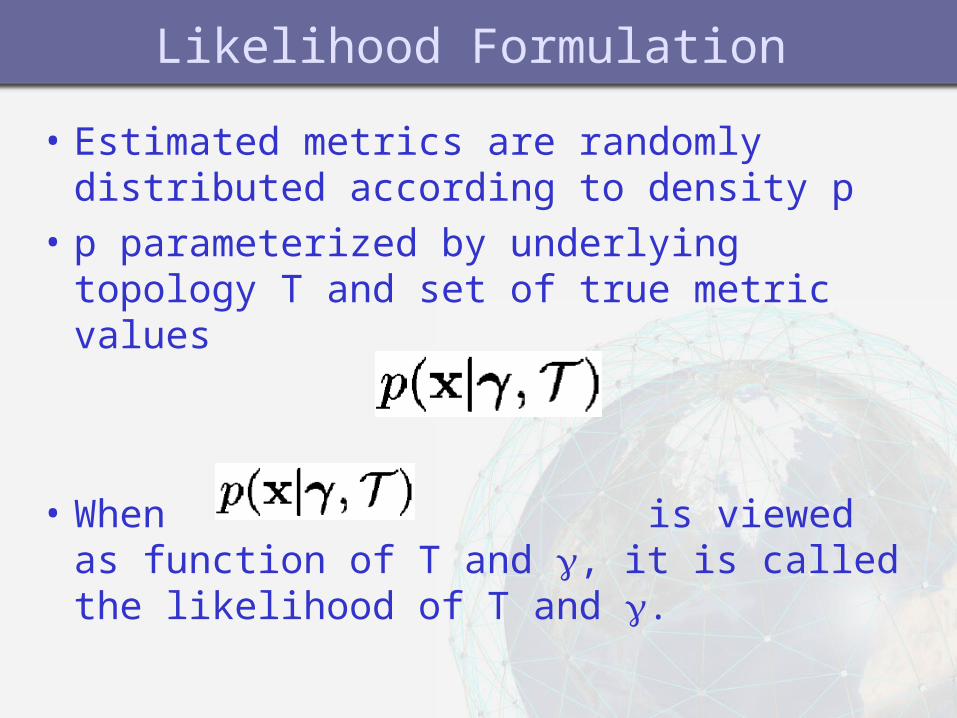
Likelihood Formulation
• Estimated metrics are randomly distributed according to density p
• p parameterized by underlying topology T and set of true metric values
• When is viewed as function of T and , it is called the likelihood of T and .
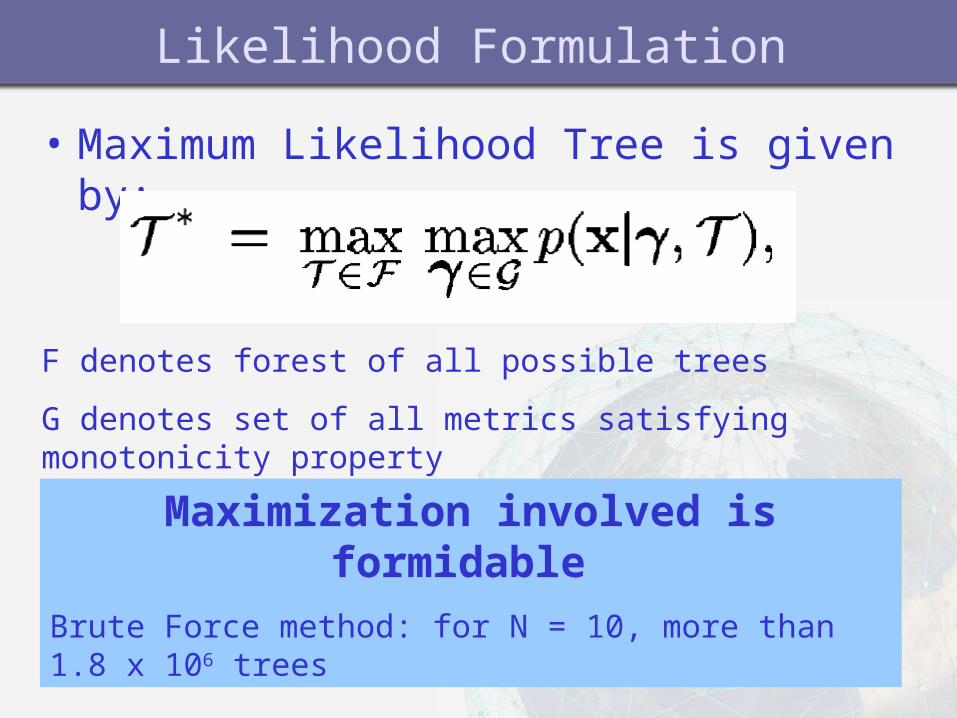
Likelihood Formulation
• Maximum Likelihood Tree is given by:
F denotes forest of all possible trees
G denotes set of all metrics satisfying monotonicity property
Maximization involved is formidable
Brute Force method: for N = 10, more than 1.8 x 10⁶ trees
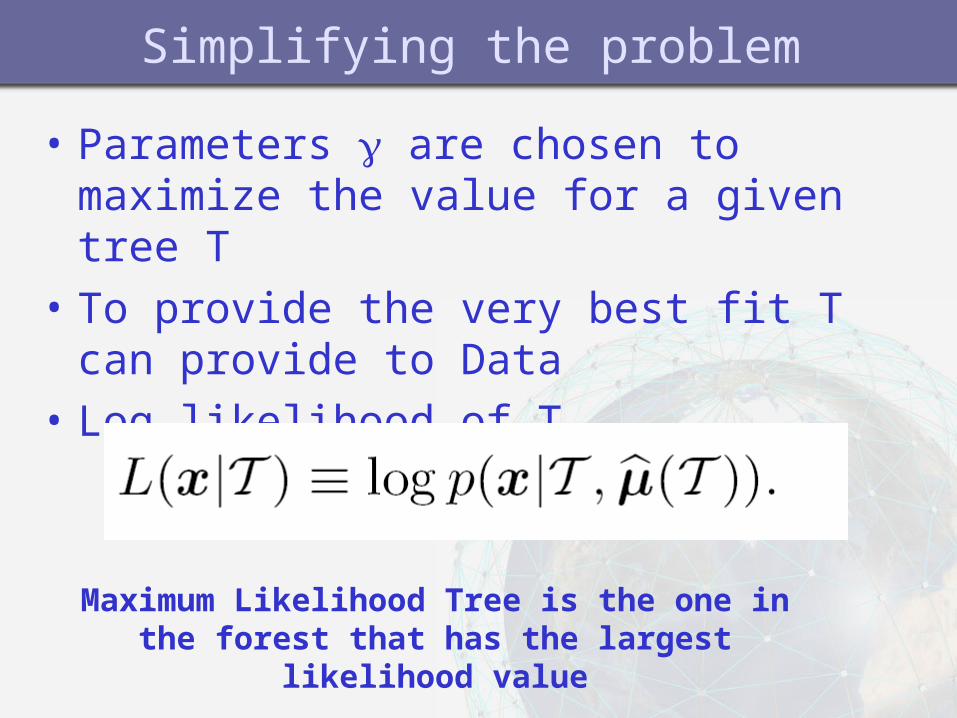
Simplifying the problem
• Parameters are chosen to maximize the value for a given tree T
• To provide the very best fit T can provide to Data
• Log likelihood of T
Maximum Likelihood Tree is the one in the forest that has the largest likelihood value
Stochastic Search
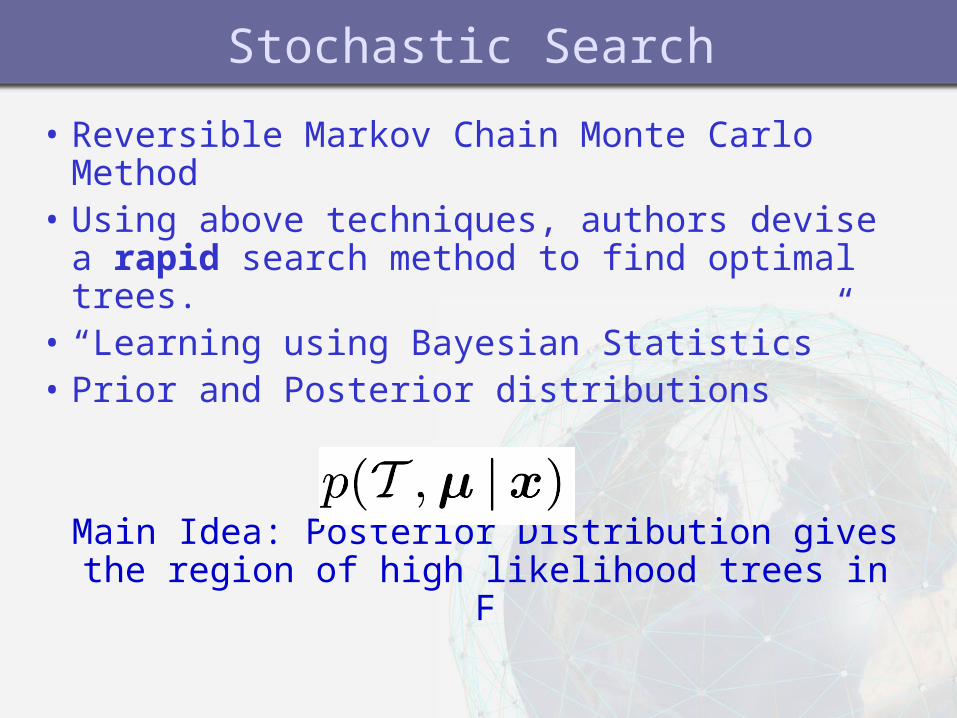
• Reversible Markov Chain Monte Carlo Method
• Using above techniques, authors devise a rapid search method to find optimal trees.
• “Learning using Bayesian Statistics”• Prior and Posterior distributions
Main Idea: Posterior Distribution gives the region of high likelihood trees in F
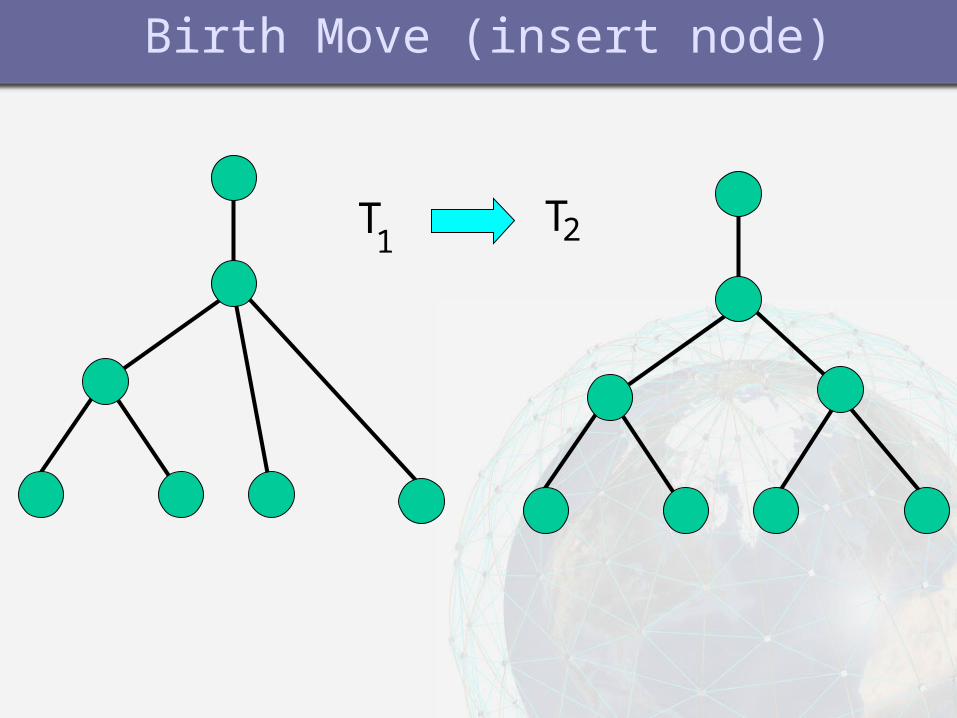
Birth Move (insert node)
T1
T2
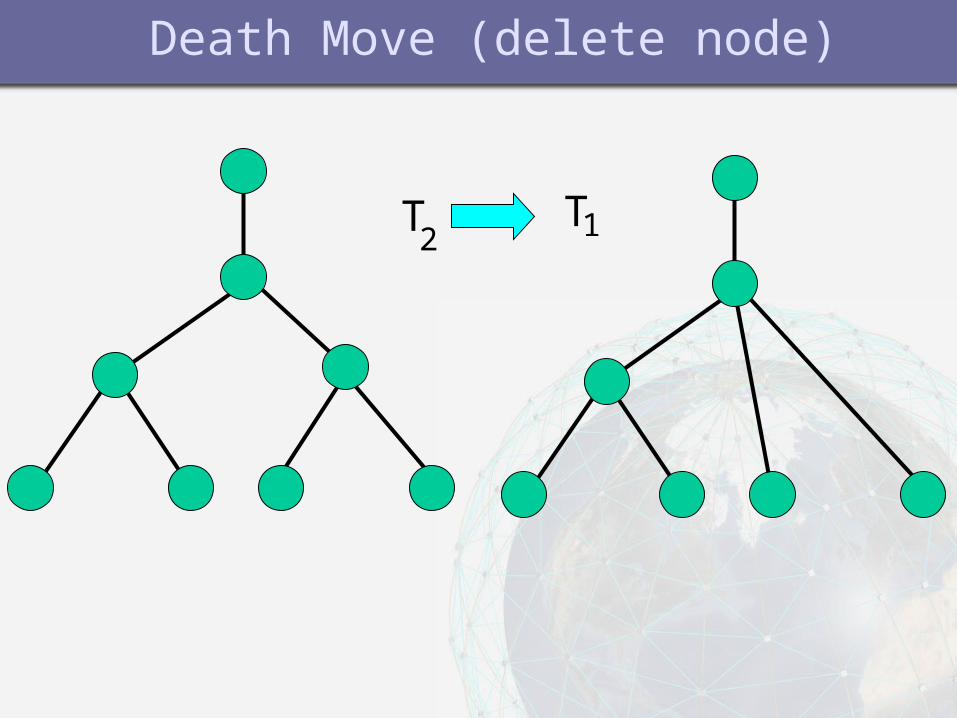
Death Move (delete node)
T2
T1
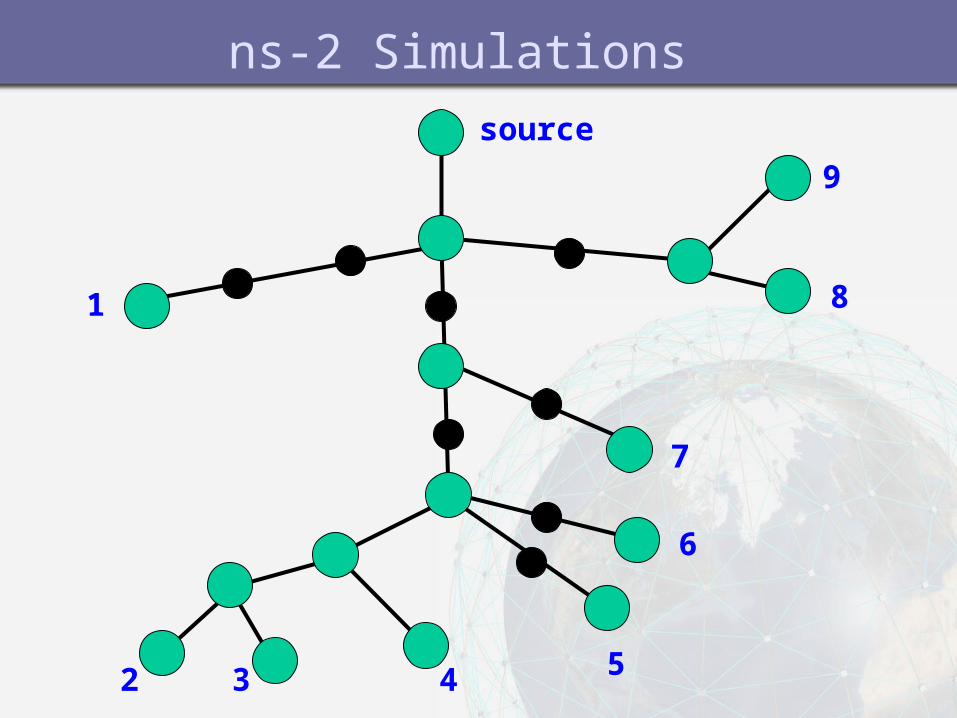
ns-2 Simulations
source
1
2 3 4 5
6
7
8
9

20
40
60
80
100
4000 6000 8000
Simulation results% Correct
Number of Probes
DBT
MPLT
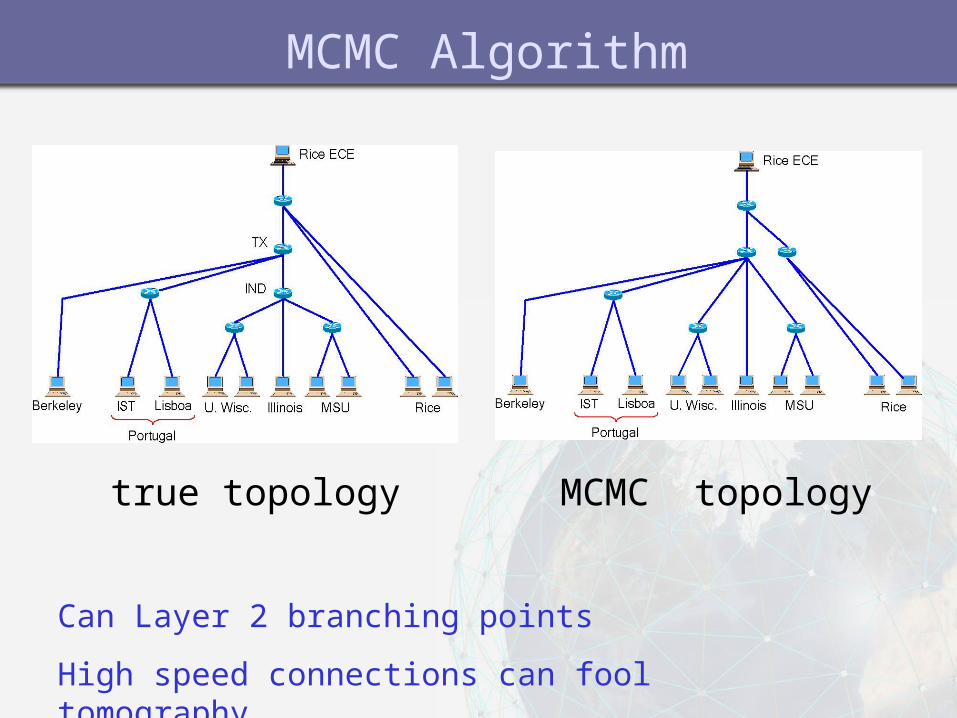
MCMC Algorithm
true topology MCMC topology
Can Layer 2 branching points
High speed connections can fool tomography
Summary
• Delay-based measurement, no need for clock synchronization
• MCMC algorithm to explore forest and identify maximum (penalized) likelihood tree