Embed Size (px)
Citation preview
Network Tomography from Multiple Senders
Rob Nowak
Thursday, January 15, 2004
In collaboration with
Mark Coates and Michael Rabbat
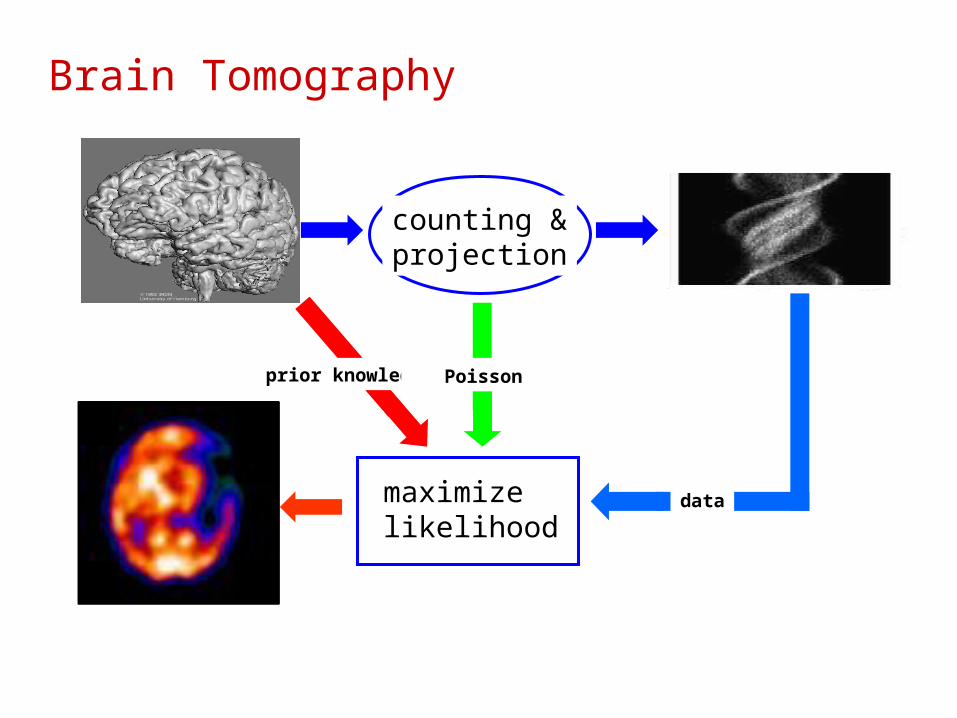
Brain Tomography
unknown object
statistical model
measurements
Maximumlikelihood estimate
maximizelikelihood
physics
data
prior knowledge
counting &projection
Poisson
unknown object
statistical model
measurements
Maximumlikelihood estimate
maximizelikelihood
physics
data
prior knowledge
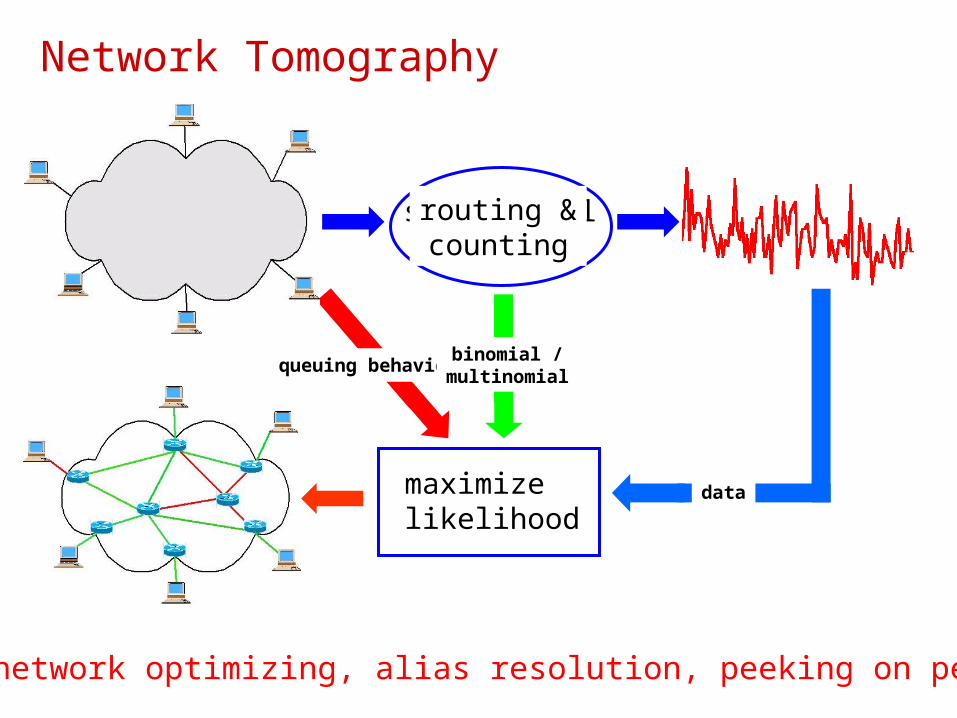
Network Tomography
queuing behavior
routing &counting
binomial /multinomial
Why ? network optimizing, alias resolution, peeking on peering

y = packet losses or delays measured at the edge
A = routing matrix (graph)
= packet loss probabilities or queuing delays for each link
= randomness inherent traffic measurements
),|(),( AypAl likelihood function
Ay
Network Tomography (Y. Vardi, D. Towsley, N. Duffield)
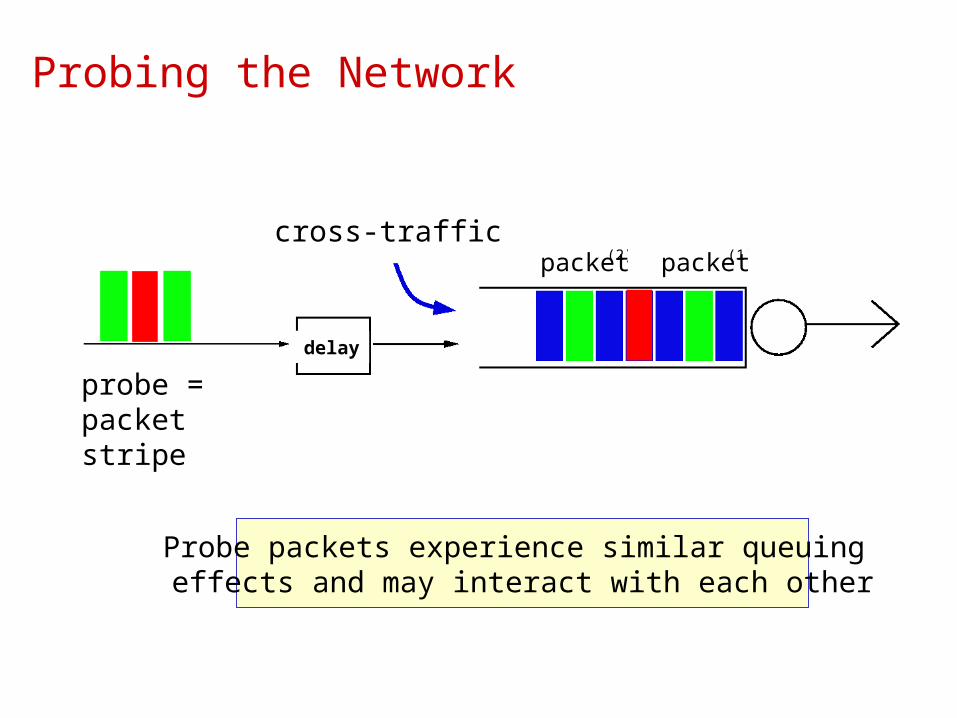
Probe packets experience similar queuing effects and may interact with each other
Probing the Network
probe =packet stripe
cross-traffic(2)packet (1)packet
delay

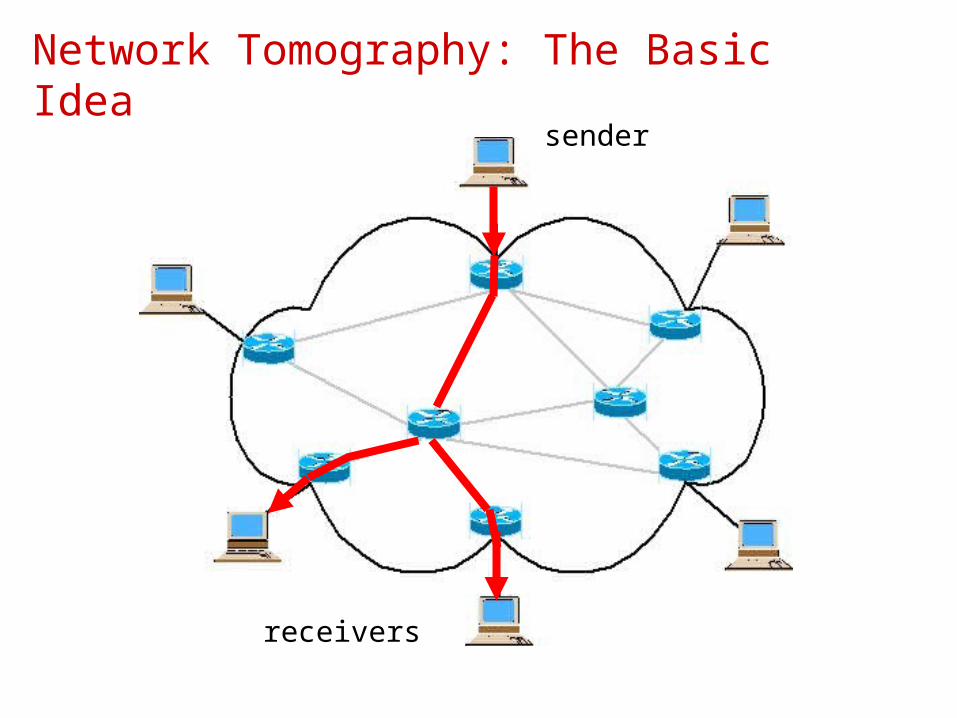
Network Tomography: The Basic Ideasender
receivers
Network Tomography: The Basic Ideasender
receivers

Logical Topology
Measure end-to-end (from sender to receiver) losses/delays
Infer logical topology & link-level loss/delay characteristics
receivers
sender
receivers

Single Sender Active Probing
Tree-Structured Logical TopologyA
1 2 3
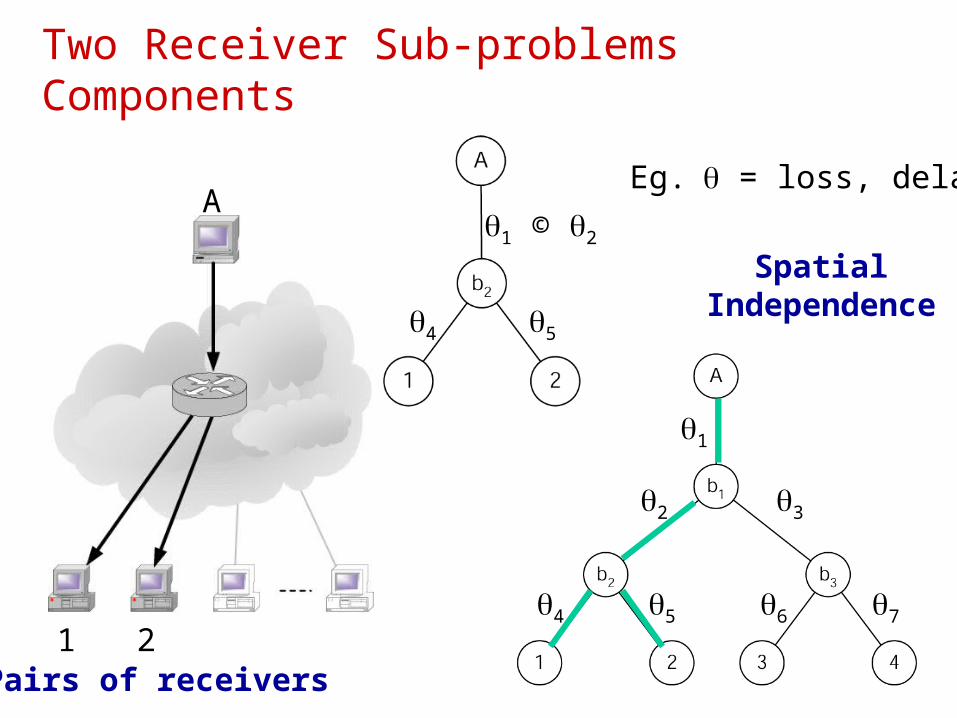
Two Receiver Sub-problems Components
1
2
4 5
3
76
4 5
1 © 2
Pairs of receivers
SpatialIndependence
Eg. = loss, delayA
1 2
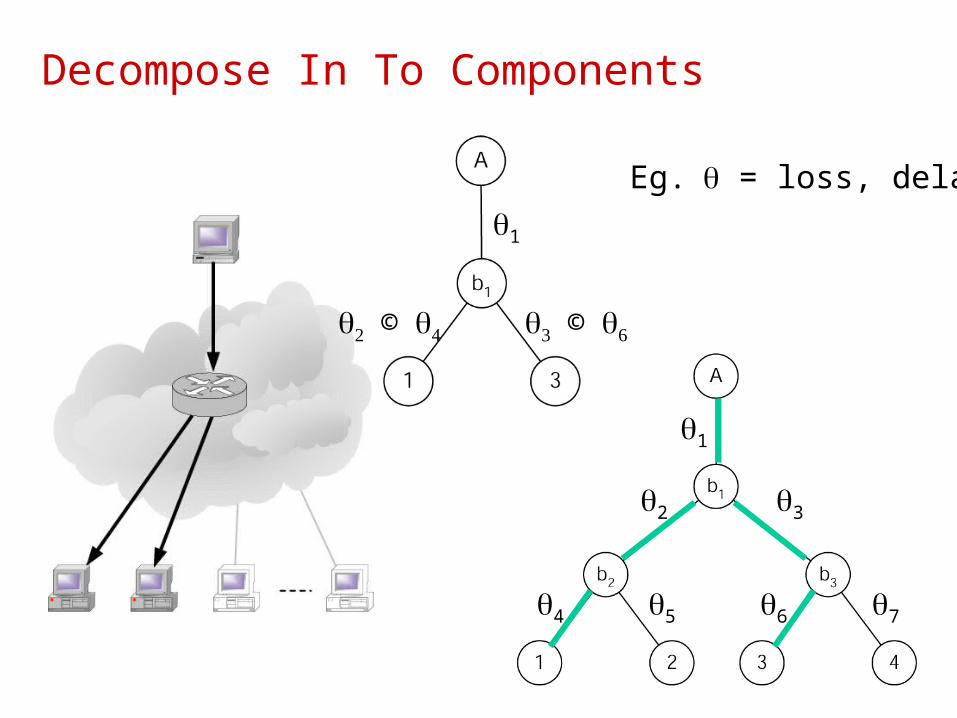
Decompose In To Components
1
2
4 5
3
76
©
1
©
Eg. = loss, delay

Decompose In To Components
1
2
4 5
3
76
© ©
1
Eg. = loss, delay
And so on…

Back-to-Back Packet Probes
A
1 2
Similar experience
Independent experiences
(Keshav, ’91) (Carter & Crovella, ’96)
Repeat and average
4 5
1 © 2
Independence of behavior onunshared links allows us to separate performance effects(e.g., loss, delay) on shared andunshared portions of paths
Duffield et al., ’99, Coates & Nowak, ’00, Byers et al., ’00
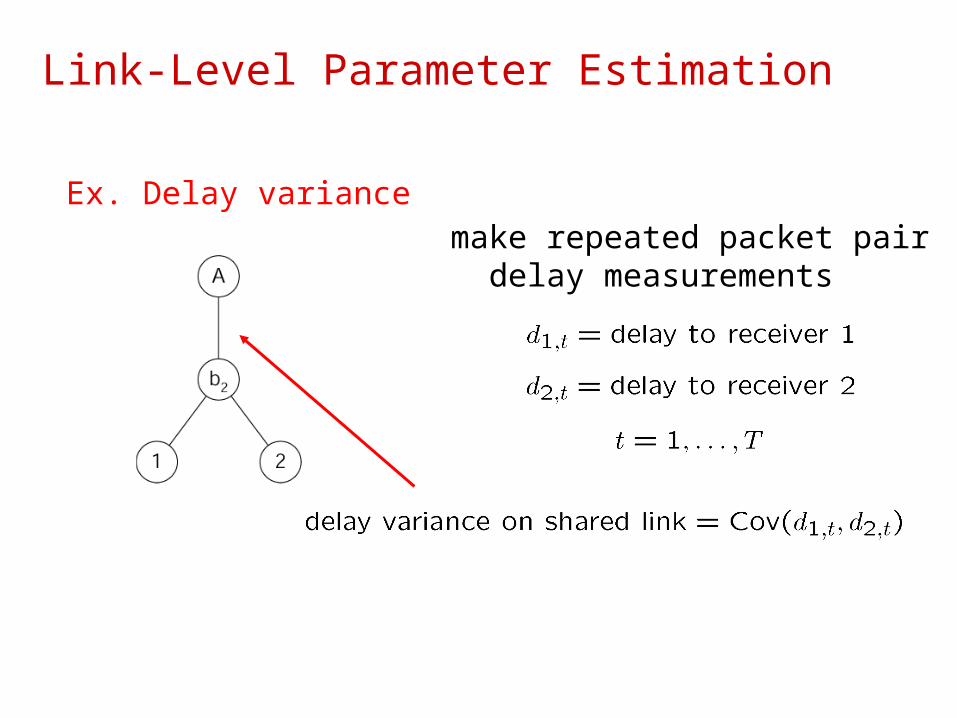
Link-Level Parameter Estimation
Ex. Delay variance make repeated packet pair delay measurements

Topology Identification
“Correlation” in packet-pairs measurements reveals topology
Stronger correlation more shared links
Group pairs of most correlated nodes first, building tree from bottom (receivers) to top (sender)
A
1 2 3
Ratnasamy & McCanne, ’99, Duffield et al., ’02, Coates et al., ‘02
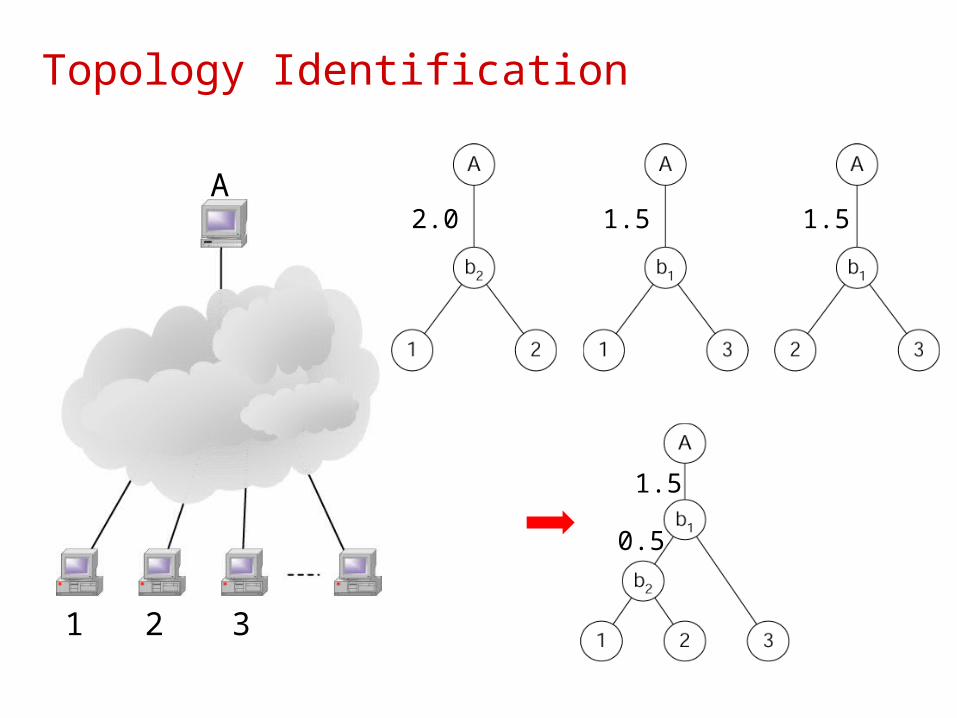
Topology Identification
A
1 2 3
2.0 1.5 1.5
1.5
0.5

Reconstruct The Larger Network
1.5
0.5
1.0 2.5
1.0
2.0
1.0 2.5 1.5
1.5
1.0 3.0 1.0
1.5
• Link-level characteristics (loss, delay) estimation• Network topology identification
Tightly coupled problems

Measure From Multiple SendersA
1 2 3 …
…B

Multiple Sender Tomography
More topological informationMutual information,Improved estimates
(Bu et al., 2002)
(Rabbat et al., 2002)

Multiple Sender Decomposition
1-by-2Component ?
i
j k

Branching & Joining Points
1-by-2Component
2-by-1Componentandi
j k
a b
c

Example Decomposition
1.0
0.25
2.0
0.75
1.0
1.25
2.25
1.5
1.25
2.0 2.5
2.25
3.0 2.75
1.0 3.0
2.25
2.25 3.5
1.5
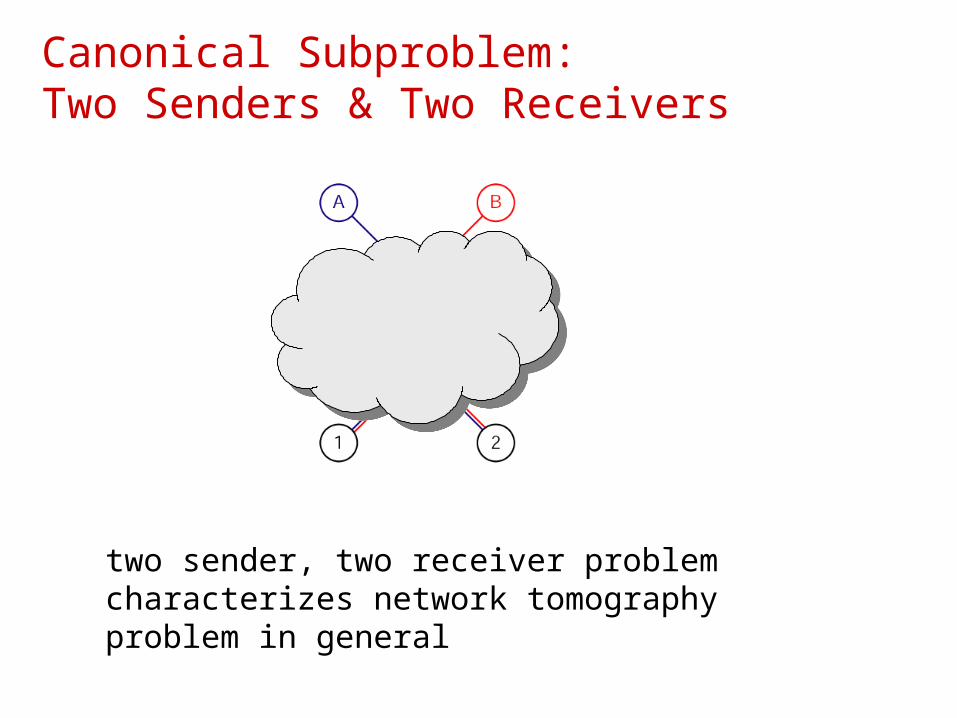
Canonical Subproblem: Two Senders & Two Receivers
two sender, two receiver problem characterizes network tomography problem in general

Two Sender, One Receiver Probing
? ?
?
A
1
B
Similar experiences?
Independent experiences
… not analogous to single sender probingIdentifying joining points from probe data is very difficult

Shared and Non-Shared Topologies
5 Links2 Internal Nodes
8 Links4 Internal Nodes
1 2
3
4 5
1
4
6
2
78
5
3 1
4
6
2
7 8
5
3 1
4
6
2
7
8
5
3
Natural dichotomy according to “model order”
Shared topology Non-Shared topology
• most relevant for purposes of performance characterization• easily discernable from end-to-end probes
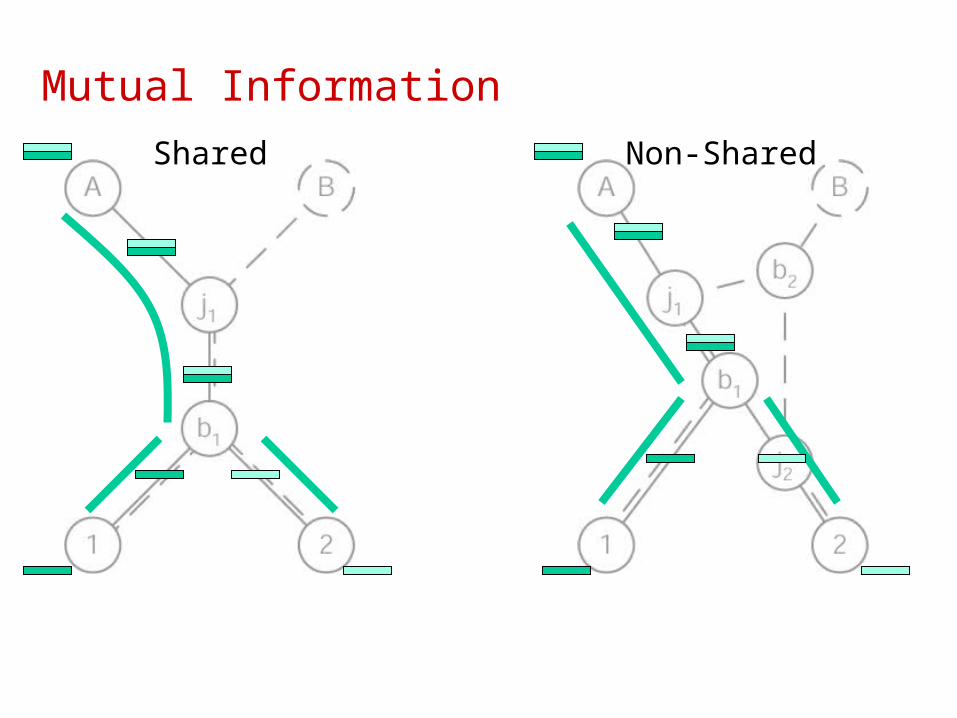
Mutual Information
Shared Non-Shared

Mutual Information
Same branching point Shared component links
Different branching points No shared component links
Average Estimates!
Shared Non-Shared
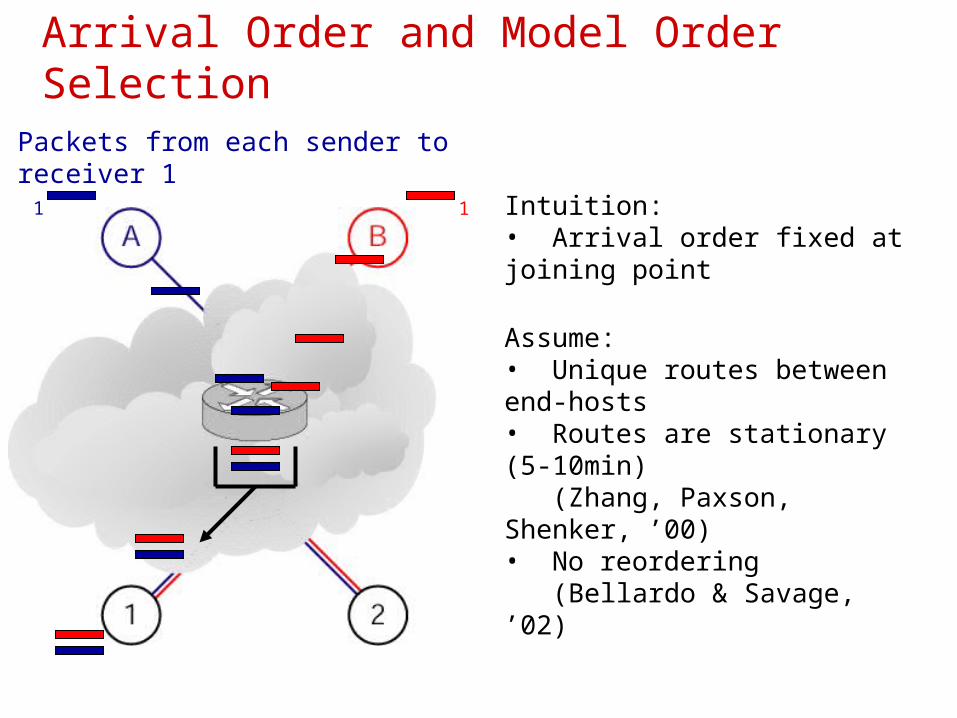
Arrival Order and Model Order Selection
1 1 Intuition:• Arrival order fixed at joining point
Assume:• Unique routes between end-hosts• Routes are stationary (5-10min) (Zhang, Paxson, Shenker, ’00)• No reordering (Bellardo & Savage, ’02)
Packets from each sender to receiver 1
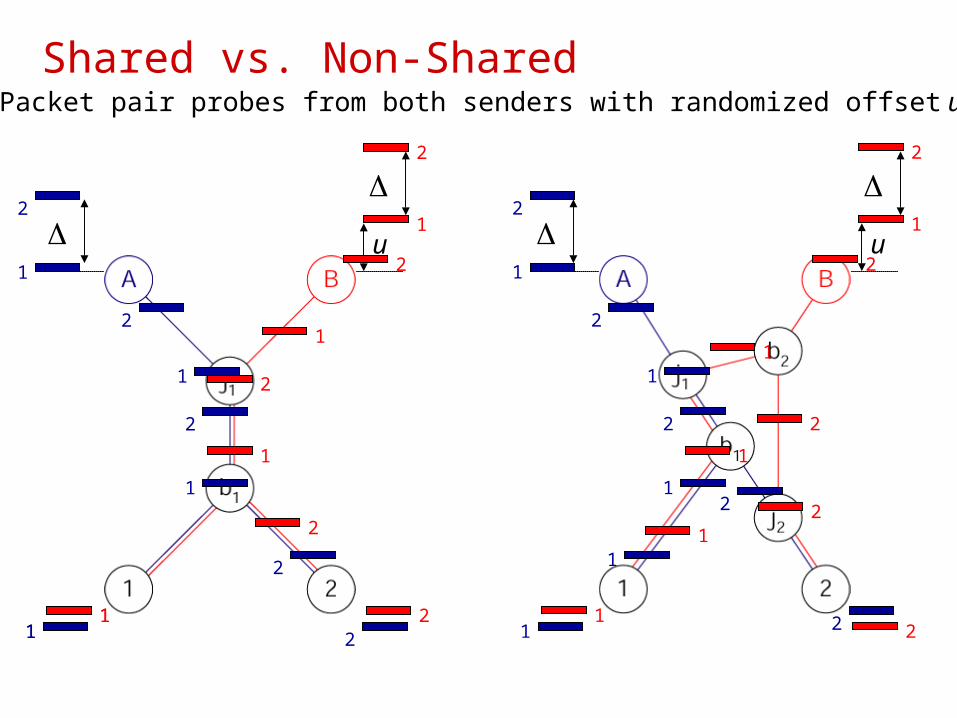
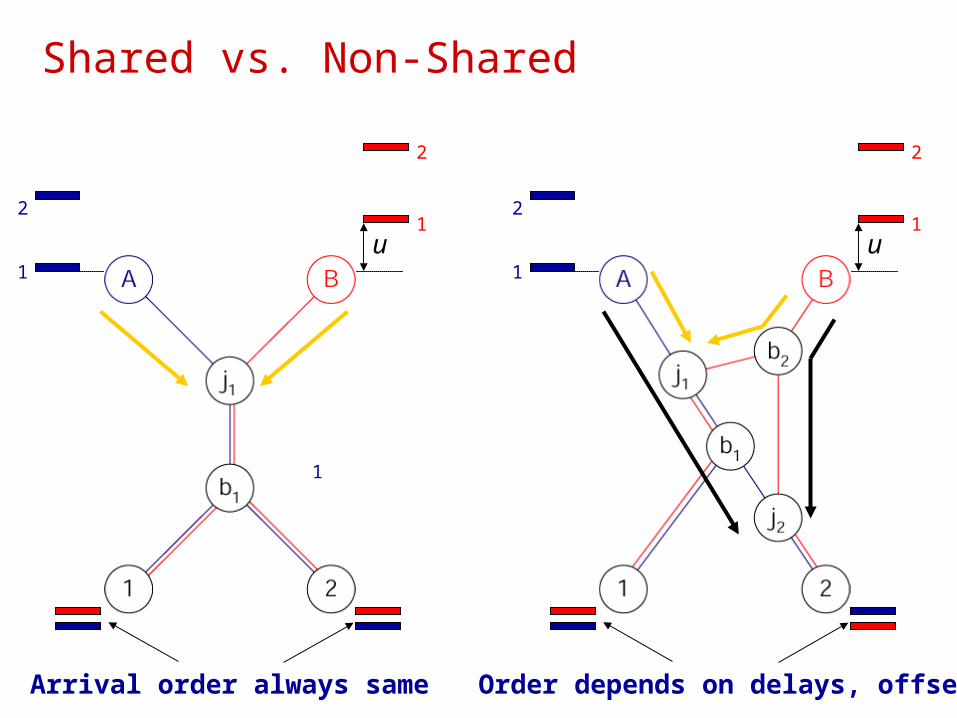
Shared vs. Non-Shared
1
2
1
2
u
1 21 21
2
1
2
1
2
1
2
1
21
2
Packet pair probes from both senders with randomized offset u
1
1
2
2
121 2
12
1
2
1
2
1
2
1
2
1
2u
Shared vs. Non-Shared
Arrival order always same
1
1
2
2
1
u1
1
2
2
u
Order depends on delays, offset
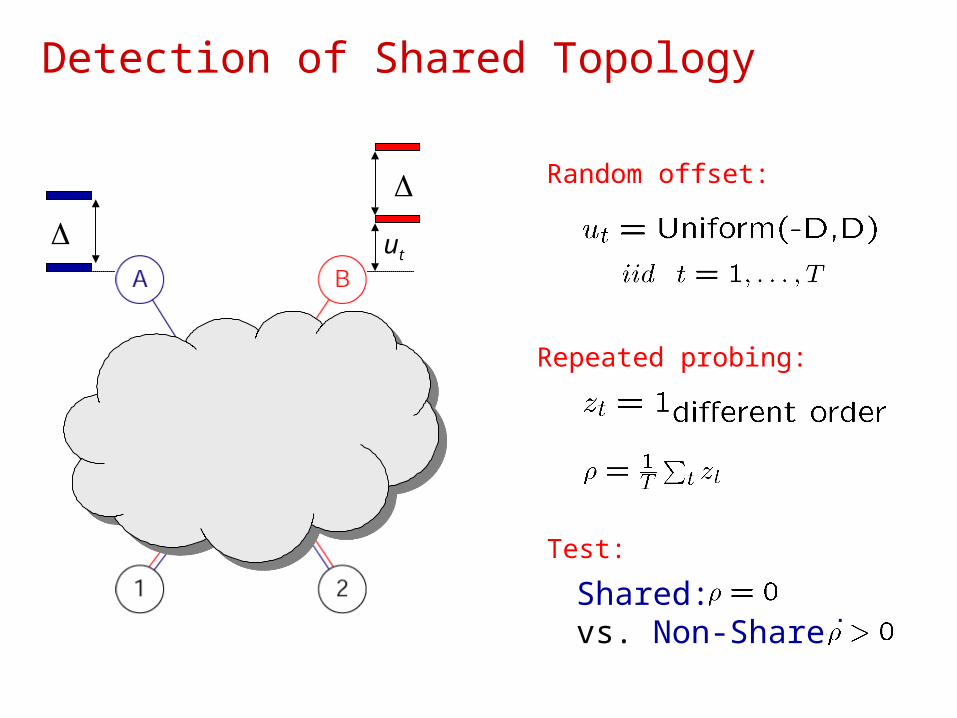
Detection of Shared Topology
ut
Shared: vs. Non-Shared:
Repeated probing:
Test:
Random offset:

1.1
B.2
1.1
1.2
A.1
1.2
A.2
B.1
u
• Transmit many probes to receiver 1• Probability of different arrival order because of cross-traffic,
• Repeat to other receiver, • Original measurements give
Detection in Presence of Cross-Traffic
Shared: vs. Non-Shared:
Delays are variable:• cross-traffic• processing delays

Arrival Order Based Topology ID
Rice LAN

Joint Performance & Topology Estimation
1
2
u
Performance Assessment• Link-level parameters 1, 2, …• Packet-pair measurements
1
21
21
2
Topology Characterization• Different arrival order probabilities , 1, 2
• Arrival order measurements

Decision-Theoretic Framework
HS:
HN:Two branching, joining points unrestricted N 2 unrestricted N 2 [0,1]3
Unique joining point 2536 S 2 1=2= S 2 [0,1]1
1
2
3
4
5
6
1
2 3
4

Characterize Topology & Performance
Generalized Likelihood Ratio Test:

Wilks Saves The Day
Generalized Likelihood Ratio Test:
Wilks’ Theorem (’38):
Under HS:
(N ! 1)

Asymptotic Results
100 probes 1000 probes

ROC Curve1000 probes
Loss Only
Arrival Order Only
Arrival Order and Loss

Number of Probes Used
1000
500
200
100
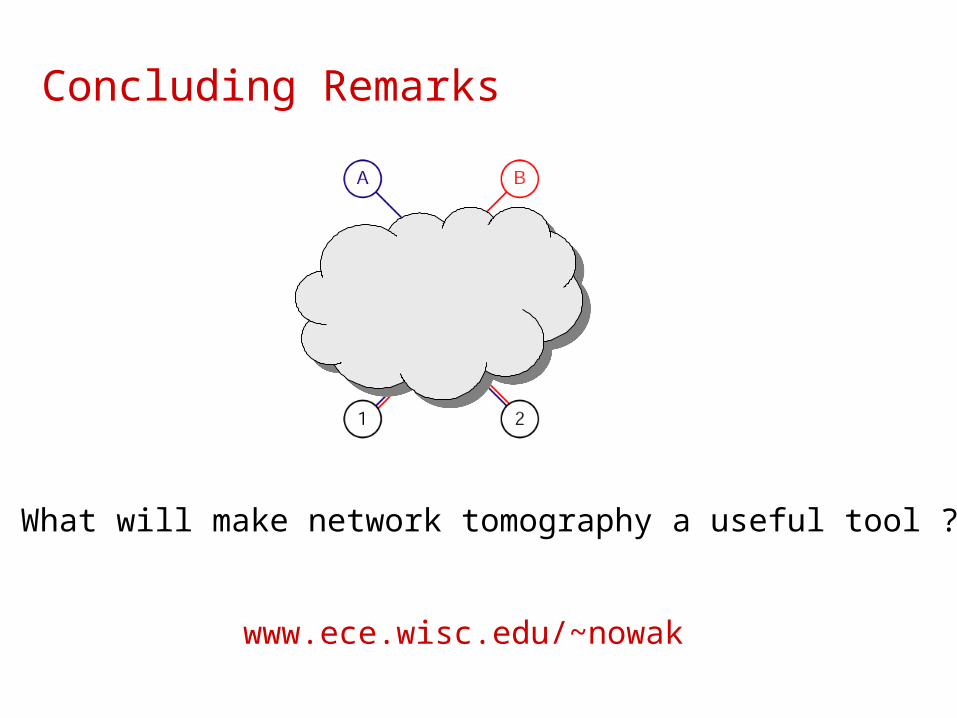
Concluding Remarks
What will make network tomography a useful tool ?
www.ece.wisc.edu/~nowak