Embed Size (px)
Citation preview

Materiali e MetodiMaterials and Methods
6205_226_AIRTUM_2017.indd 205 26/04/17 10.36
Epidemiol Prev 2017; 41 (2) suppl1. doi: 10.19191/EP17.2S1.P001.017 206 Ulteriori dati disponibili sul sito: www.registri-tumori.it
I TUMORI IN ITALIA RAPPORTO AIRTUM 2016 SOPRAVVIVENZA
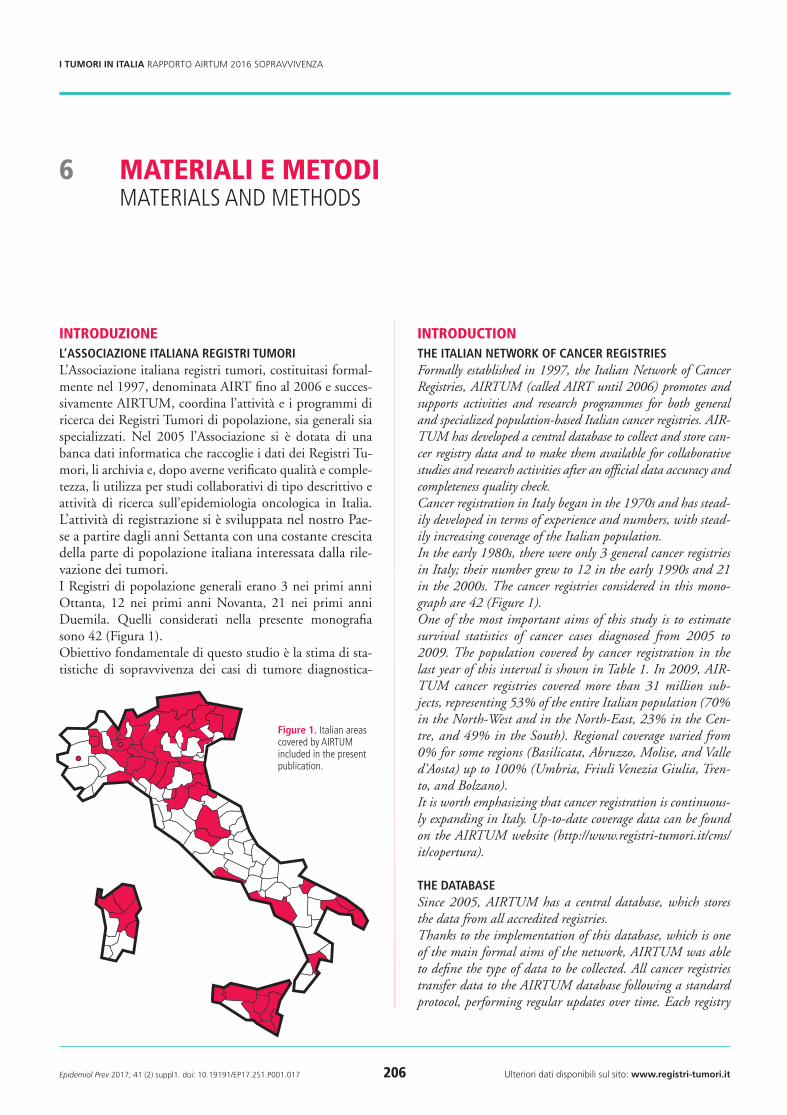
introduzioneL’AssociAzione itALiAnA registri tumoriL’Associazione italiana registri tumori, costituitasi formal-mente nel 1997, denominata AIRT fino al 2006 e succes-sivamente AIRTUM, coordina l’attività e i programmi di ricerca dei Registri Tumori di popolazione, sia generali sia specializzati. Nel 2005 l’Associazione si è dotata di una banca dati informatica che raccoglie i dati dei Registri Tu-mori, li archivia e, dopo averne verificato qualità e comple-tezza, li utilizza per studi collaborativi di tipo descrittivo e attività di ricerca sull’epidemiologia oncologica in Italia. L’attività di registrazione si è sviluppata nel nostro Pae-se a partire dagli anni Settanta con una costante crescita della parte di popolazione italiana interessata dalla rile-vazione dei tumori. I Registri di popolazione generali erano 3 nei primi anni Ottanta, 12 nei primi anni Novanta, 21 nei primi anni Duemila. Quelli considerati nella presente monografia sono 42 (Figura 1).Obiettivo fondamentale di questo studio è la stima di sta-tistiche di sopravvivenza dei casi di tumore diagnostica-
introductionthe itALiAn network of cAncer registriesFormally established in 1997, the Italian Network of Cancer Registries, AIRTUM (called AIRT until 2006) promotes and supports activities and research programmes for both general and specialized population-based Italian cancer registries. AIR-TUM has developed a central database to collect and store can-cer registry data and to make them available for collaborative studies and research activities after an official data accuracy and completeness quality check.Cancer registration in Italy began in the 1970s and has stead-ily developed in terms of experience and numbers, with stead-ily increasing coverage of the Italian population.In the early 1980s, there were only 3 general cancer registries in Italy; their number grew to 12 in the early 1990s and 21 in the 2000s. The cancer registries considered in this mono-graph are 42 (Figure 1).One of the most important aims of this study is to estimate survival statistics of cancer cases diagnosed from 2005 to 2009. The population covered by cancer registration in the last year of this interval is shown in Table 1. In 2009, AIR-TUM cancer registries covered more than 31 million sub-jects, representing 53% of the entire Italian population (70% in the North-West and in the North-East, 23% in the Cen-tre, and 49% in the South). Regional coverage varied from 0% for some regions (Basilicata, Abruzzo, Molise, and Valle d’Aosta) up to 100% (Umbria, Friuli Venezia Giulia, Tren-to, and Bolzano). It is worth emphasizing that cancer registration is continuous-ly expanding in Italy. Up-to-date coverage data can be found on the AIRTUM website (http://www.registri-tumori.it/cms/it/copertura).
the dAtAbAseSince 2005, AIRTUM has a central database, which stores the data from all accredited registries. Thanks to the implementation of this database, which is one of the main formal aims of the network, AIRTUM was able to define the type of data to be collected. All cancer registries transfer data to the AIRTUM database following a standard protocol, performing regular updates over time. Each registry
Materiali e MetodiMaterials and Methods
6
figure 1. italian areas covered by airtUM included in the present publication.
205_226_AIRTUM_2017.indd 206 26/04/17 10.36

Epidemiol Prev 2017; 41 (2) suppl1. doi: 10.19191/EP17.2S1.P001.017 207 Ulteriori dati disponibili sul sito: www.registri-tumori.it
I TUMORI IN ITALIA RAPPORTO AIRTUM 2016 SOPRAVVIVENZA materiali e metodi
ti negli anni 2005-2009. Nell’ultimo anno di questo in-tervallo la copertura della popolazione dalla registrazione dei tumori è mostrata in Tabella 1. Nel 2009 i Registri ac-creditati dall’AIRTUM monitoravano oltre 31.000.000 di italiani, pari al 53% della popolazione residente, con per-centuali che variavano da un’area all’altra del Paese (70% nel Nord-Ovest e nel Nord-Est, 23% nel Centro e 49% al Sud). La copertura regionale variava dallo 0% per alcune Regioni (Basilicata, Abruzzo, Molise e Valle d’Aosta), fino al 100% (Umbria, Friuli Venezia Giulia e le province auto-nome di Trento e Bolzano). E’ necessario sottolineare che la registrazione dei tumori si è ulteriormente ampliata rispetto alla situazione rappresenta-ta in questa pubblicazione. Dati aggiornati sulla copertura della registrazione in Italia sono consultabili sul sito dell’AI-RTUM (http://www.registri-tumori.it/cms/it/copertura).
LA bAncA dAtiDal 2005 l’AIRTUM ha costituito formalmente una banca dati con lo scopo di raccogliere unitariamente le informa-zioni prodotte dai singoli Registri accreditati.Grazie alla realizzazione della banca dati, che rientra tra gli obiettivi statutari dell’Associazione, l’AIRTUM ha potu-to formalizzare la tipologia dei dati raccolti. Tutti i Registri Tumori trasferiscono infatti alla banca dati le informazioni secondo un tracciato record standard, assicurandone anche il continuo aggiornamento. I singoli Registri possono in-viare nuovi dati e integrare i dati già presenti, incluso l’ag-giornamento del follow-up e dello stato in vita. Ogni Regi-stro tumori che contribuisce alla banca dati rimane titolare dei propri dati: per utilizzare tali dati in studi collaborativi è necessaria una specifica autorizzazione da parte dei diret-tori dei singoli RegistriLa banca dati AIRTUM si è dotata di un proprio protocol-lo operativo (http://www.registri-tumori.it/cms/files/2010.pdf ) al quale si rimanda per una descrizione dettagliata dei criteri di inclusione in banca dati, della tipologia e delle modalità dei controlli e dei tracciati record.
definizionidAti richiestiLe analisi di sopravvivenza hanno riguardato i casi di tu-more rilevati dai Registri Tumori italiani nelle persone di 15 o più anni di età, diagnosticati dal 1994 al 2011. A tutti i Registri Tumori partecipanti è stato richiesto l’aggiorna-mento dello stato in vita al 31.12.2013. Per il solo Registro di Salerno l’aggiornamento dello stato in vita è stato dispo-nibile fino al 31.12.2012. I campi oggetto di analisi sono stati: data di nascita, genere, data di incidenza, topografia ICD-O-3, morfologia ICD-O-3, stato in vita, data di ul-timo stato in vita e modalità di diagnosi (o base diagnosi).
can send new data or update old records with new variables, including follow-up for vital status. Each registry is the owner of its own data, so specific approval from registries is required for collaborative studies involving cancer registry data. The network has a specific protocol, with a description of in-cluding criteria, data format, and checks (for detailed infor-mation see http://www.registri-tumori.it/cms/files/2010.pdf ).
definitionsdAtASurvival analysis included data from each cancer registry for all tumours in cancer patients aged from fifteen upward, di-agnosed from 1994 to 2011. Follow-up for death to the end of 2013 was required for all cancer registries. For the Salerno cancer registry, follow-up for death was available up to the end
region italian population
2009
residents in areas covered by general cancer registries
n. n. %
Piemonte 4,356,322 1,240,201 28.5
Valle d’aosta 126,369 - -
lombardia 9,545,515 8,853,959 92.8
liguria 1,577,301 862,829 54.7
north-west 15,605,507 10,956,989 70.2
trentino-alto adige 1,009,440 1,009,440 100.0
Veneto 4,834,776 2,333,374 48.3
Friuli-Venezia Giulia 1,221,392 1,221,392 100.0
emilia-romagna 4,277,139 3,315,834 77.5
north-eAst 11,342,747 7,880,040 69.5
toscana 3,641,389 1,203,911 33.1
Umbria 875,261 875,261 100.0
Marche 1,536,302 - -
lazio 5,401,837 531,494 9.8
centre 11,454,789 2,610,666 22.8
abruzzo 1,306,029 - -
Molise 316,955 - -
Campania 5,750,382 2,250,319 39.1
Puglia 4,043,827 2,173,958 53.8
Basilicata 583,556 - -
Calabria 1,970,780 361,683 18.4
sicilia 4,990,588 4,544,034 91.1
sardegna 1,642,583 694,803 42.3
south 20,604,700 10,024,797 48.7
totAL 59,007,743 31,472,492 53.3
table 1. distribution of the italian resident population overall and in areas co-vered by general cancer registries (airtUM), by region and geographical area. italy, 2009.
205_226_AIRTUM_2017.indd 207 26/04/17 10.37

Epidemiol Prev 2017; 41 (2) suppl1. doi: 10.19191/EP17.2S1.P001.017 208 Ulteriori dati disponibili sul sito: www.registri-tumori.it
I TUMORI IN ITALIA RAPPORTO AIRTUM 2016 SOPRAVVIVENZA materiali e metodi
pool dei registri tuMoriPer garantire la massima rappresentatività geografica, l’o-mogeneità interna della casistica analizzata e la produzione delle stime di sopravvivenza più aggiornate in base ai dati disponibili, sono stati costituiti quattro raggruppamenti (Pool) della casistica complessivamente reclutata: Pool della coorte. A questa analisi hanno contribuito 42 Registri Tumori con disponibilità di dati di incidenza dal 2005 al 2009;Pool del trend temporale. Ha riguardato i casi inciden-ti negli anni dal 1994 al 2011. Sono stati selezionati i dati di 17 Registri che avevano disponibilità di dati almeno nel periodo 1996-2009;Pool della sopravvivenza condizionata. Ha considerato i casi incidenti negli anni dal 2000 al 2010. I 24 Registri coinvolti sono stati quelli con disponibilità di dati almeno nel periodo 2002-2008;Pool della speranza di vita. Ha selezionato i casi inciden-ti negli anni 1994-2010. I Registri Tumori dovevano avere disponibilità di dati almeno nel periodo dal 1996 al 2008. Pertanto, oltre ai dati dei 17 Registri inclusi nel pool del trend temporale, questa selezione ha consentito di conside-rare anche la lunga serie temporale di dati del Registro di Fi-renze, aggiornata al 2008 come ultimo anno di incidenza.La Tabella 2 riporta l’entità della casistica, distinta secondo il tipo di analisi, e gli anni di incidenza considerati per cia-scun Registro Tumori. Alle pagine 212-18 di questo capi-tolo sono illustrate le analisi effettuate su ciascuno di que-sti raggruppamenti.Rispetto al precedente avente per oggetto la sopravviven-za,1 l’attuale rapporto AIRTUM è caratterizzato da una maggior numerosità della casistica analizzata e una miglio-re rappresentatività geografica: i Registri generali indagati nell’analisi di coorte 2005-2009 sono passati da 29 a 42 (in particolare quelli attivi nel meridione da 8 a 14), i Registri generali indagati nell’analisi del trend da 11 a 17.
sedi tuMoralicLAssificAzioneLa definizione della sede anatomica, della morfologia tu-morale e del comportamento è avvenuta tramite l’utilizzo della terza edizione della International Classification of Di-seases for Oncology (ICD-O-3) pubblicata nel 2000.2 I cri-teri adottati per la definizione delle sedi tumorali, corri-spondenti a quelli della monografia AIRTUM 2011, sono riportati nella Tabella 3.
criteri di seLezioneSono stati inclusi nell’analisi tutti i tumori primitivi ma-ligni, ad eccezione dei carcinomi cutanei. Vengono quin-di considerati eleggibili per uno stesso soggetto anche i tu-
of 2012. The following items were used in the analysis: date of birth, gender, date of diagnosis, cancer topography and mor-phology (according to the ICD-O-3 classification), vital sta-tus, date of last ascertainment of vital status and basis of di-agnosis.
pools of cancer registriesIn order to maximize the use of descriptive data and provide data consistency and the most up-to-date survival estimates, four different groups (pools) of cancer registries were defined according to type of analysis:Cohort pool. Cases diagnosed from 2005 to 2009 from 42 cancer registries were included in this analysis;Time trend pool. Incident cases from 1994 to 2011 were re-cruited. Data from 17 cancer registries, which had – at least – data from 1996 to 2009, were selected;Conditional survival pool. For this analysis, we considered cases diagnosed from 2000 to 2010; 24 cancer registries hav-ing data at least from 2002 to 2008 were included;Life expectancy pool. Cases diagnosed from 1994 to 2010 were selected. Cancer registries had to have – at least – data from 1996 to 2008. Therefore, in addition to data from 17 registries in the time trend pool, this selection made it possible to consider the long-term series of data from the Florence cancer registry, updated to 2008 as last incidence year.In Table 2, we provide details on each type of analysis and in-cidence years by cancer registry.Compared with the previous AIRTUM publication on surviv-al,1 both cohort size and geographic coverage have grown: the number of general cancer registries included in 2005-2009 co-hort studies increased from 29 to 42 (registries from southern Italy, in particular, increased from 8 to 14), while registries included in the time trend analysis increased from 11 to 17.
cancer sitescLAssificAtionTopography, morphology, and tumour behaviour are defined according to the third edition of the International Classifica-tion of Diseases for Oncology (ICD-O-3), published in 2000.2 The criteria adopted for defining the cancer sites, the same as in the 2011 AIRTUM monograph, are shown in Table 3.
dAtA seLectionAll primary malignant tumours were included in the analysis, except non-melanomatous skin carcinomas. Thus multiple pri-maries were considered eligible for the analysis, in contrast with previous AIRTUM and EUROCARE protocols.3-4 Cancers no-tified by death certificate only or by autopsy only (i.e., with date of diagnosis equal to date of death) were excluded. All other cas-es identified very close to the date of death were included in the data analysis, including patients with autopsy made after clin-
continua a pagina 211 continued on page 211
205_226_AIRTUM_2017.indd 208 26/04/17 10.37

Epidemiol Prev 2017; 41 (2) suppl1. doi: 10.19191/EP17.2S1.P001.017 209 Ulteriori dati disponibili sul sito: www.registri-tumori.it
I TUMORI IN ITALIA RAPPORTO AIRTUM 2016 SOPRAVVIVENZA materiali e metodi
cancer registry years of incidence
analysis
cohort conditionAL trend Life eXPectAncY
no
rth
-wes
t
Bergamo 2007-2009 19,677 - - -
Biella-Vercelli 1995-2010 11,156 14,964 21,284 21,284
Brescia 2000-2008 26,894 58,662 - -
Como 2005-2009 17,611 - - -
Cremona 2005-2009 12,393 - - -
Genova 2000-2009 34,044 69,180 - -
lodi 2005-2009 7,272 - - -
Mantova 2000-2010 13,366 27,908 - -
Milano 2000-2009 46,888 93,717 - -
Milano 1 2007-2009 27,115 - - -
Monza e Brianza 2007-2009 15,371 - - -
Pavia 2005-2009 18,663 - - -
Piacenza 2006-2009 8,591 - - -
sondrio 2005-2009 5,660 12,148 - -
torino 1994-2011 31,185 67,300 106,575 100,398
Varese 1994-2011 26,502 56,787 88,078 82,633
no
rth
-eA
st
alto adige 1995-2010 13,355 28,490 39,469 39,469
Ferrara 1994-2011 15,393 32,455 49,612 46,753
Friuli Venezia Giulia 1995-2010 44,395 95,946 136,765 136,765
Modena 1994-2011 23,165 48,708 74,396 69,906
Parma 1994-2011 15,814 33,906 52,975 49,763
reggio emilia 1996-2011 15,890 34,065 47,264 44,123
romagna 1994-2011 43,924 82,137 127,817 119,735
trento 1995-2010 13,517 29,319 41,433 41,433
Veneto 1994-2009 73,920 145,690 202,916 202,916
cen
tre Firenze Prato 1994-2008 31,989 70,959 - 114,853
latina 1994-2011 13,493 27,194 40,027 37,305
Umbria 1994-2011 28,887 61,356 96,406 90,460
sou
th
Barletta 2006-2009 7,175 - - -
Brindisi 2006-2008 6,038 - - -
Catania-Messina-enna 2005-2009 45,218 - - -
Catanzaro 2005-2009 7,677 - - -
lecce 2005-2008 16,845 - - -
napoli 1996-2011 17,357 23,755 32,352 29,902
nuoro 2005-2009 5,597 - - -
Palermo 2005-2009 28,646 - - -
ragusa-Caltanissetta 1994-2011 10,939 15,312 22,973 21,616
salerno 1996-2009 23,864 46,014 - -
sassari 1994-2011 12,118 25,850 39,570 36,855
siracusa 2000-2010 9,074 19,100 - -
taranto 2006-2009 11,959 - - -
trapani 2002-2009 9,559 15,108 - -
totAL 868,196 1,236,030 1,219,912 1,286,169
table 2. Cancer cases (ages 15+), by type of analysis, and incidence years by cancer registry.
205_226_AIRTUM_2017.indd 209 26/04/17 10.37

Epidemiol Prev 2017; 41 (2) suppl1. doi: 10.19191/EP17.2S1.P001.017 210 Ulteriori dati disponibili sul sito: www.registri-tumori.it
I TUMORI IN ITALIA RAPPORTO AIRTUM 2016 SOPRAVVIVENZA materiali e metodi
table 3. tumour sites considered in the present report according to iCd-o-3 topography, morphology, and behaviour.
Major site cancer site topography Morphology behaviour
heAd And neck
tongue C019-C029 8000-9044, 9060-9133, 9150-9581 3
Mouth C030-C069 8000-9044, 9060-9133, 9150-9581 3
oropharynx C090-C109 8000-9044, 9060-9133, 9150-9581 3
nasopharynx C110-C119 8000-9044, 9060-9133, 9150-9581 3
hypopharynx C129-C139 8000-9044, 9060-9133, 9150-9581 3
Pharynx, nos C140-C148 8000-9044, 9060-9133, 9150-9581 3
nasal cavity etc. C300-C319 8000-9044, 9060-9133, 9150-9581 3
larynx C320-C329 8000-9044, 9060-9133, 9150-9581 3
salivary gland C079-C089 8000-9044, 9060-9133, 9150-9581 3
oesophagus C150-C159 8000-9044, 9060-9133, 9150-9581 3
stomach C160-C169 8000-9044, 9060-9133, 9150-9581 3
small intestine C170-C179 8000-9044, 9060-9133, 9150-9581 3
coLon And rectum
Colon C180-C189 8000-9044, 9060-9133, 9150-9581 3
rectum C199-C218 8000-9044, 9060-9133, 9150-9581 3
liver C220-C221 8000-9044, 9060-9133, 9150-9581 3
Gallbladder and extrahepatic bile ducts C239-C249 8000-9044, 9060-9133, 9150-9581 3
Pancreas C250-C259 8000-9044, 9060-9133, 9150-9581 3
lung C339-C349 8000-9044, 9060-9133, 9150-9581 3
Bone C400-C419 8000-9044, 9060-9133, 9150-9581 3
skin melanoma C440-C449 8720-8780 3
Mesothelioma C000-C750 9050-9053 3
Kaposi sarcoma C000-C809 9140 3
soft tissue C470-C479, C490-C499 8000-9044, 9060-9133, 9150-9581 3
Breast C500-C509 8000-9044, 9060-9133, 9150-9581 3
Cervix uteri C530-C539 8000-9044, 9060-9133, 9150-9581 3
Corpus uteri C540-C549 8000-9044, 9060-9133, 9150-9581 3
ovary C569 8000-9044, 9060-9133, 9150-9581 3
Prostate C619 8000-9044, 9060-9133, 9150-9581 3
testis C620-C629 8000-9044, 9060-9133, 9150-9581 3
Kidney C649 8000-9044, 9060-9133, 9150-9581 3
other urinary system C659-C669, C680-C689 8000-9044, 9060-9133, 9150-9581 3
Urinary bladder C670-C679 8000-9044, 9060-9133, 9150-9581 3
C670-C679 8000-8010, 8120-8131 0-2
Brain and Cns C700-C729 8000-9044, 9060-9133, 9150-9581 3
Choroid melanoma C690-C699 8720-8780 3
thyroid C739 8000-9044, 9060-9133, 9150-9581 3
hodgkin lymphoma C000-C809 9650-9667 3
non hodgkin lymphoma C000-C419, C422-C423, C440-C809 9823, 9827 3
C000-C809 9590-9596, 9670-9729 3
Myeloma C000-C809 9731-9732, 9734-9734 3
ALL LeukAemiAs
acute lymphocytic leukaemia C000-C809 9826, 9835-9837 3
C420-C421, C424 9827 3
Chronic lymphocytic leukaemia C420-C421, C424 9823 3
acute myeloid leukaemia C000-C809 9840, 9861, 9866-9874, 9891-9920, 9931 3
Chronic myeloid leukaemia C000-C809 9863, 9875-9876, 9945-9946 3
leukaemia, nos C000-C809 9733, 9742, 9800-9820, 9832-9834, 9860, 9930 3
205_226_AIRTUM_2017.indd 210 26/04/17 10.37

Epidemiol Prev 2017; 41 (2) suppl1. doi: 10.19191/EP17.2S1.P001.017 211 Ulteriori dati disponibili sul sito: www.registri-tumori.it
I TUMORI IN ITALIA RAPPORTO AIRTUM 2016 SOPRAVVIVENZA materiali e metodi
mori successivi al primo.3,4 Sono stati invece esclusi i casi notificati dal solo certificato di decesso (DCO, Death Cer-tificate Only – base di diagnosi 0) o autopsia (con diagnosi coincidente con la data di decesso). Gli altri casi identifica-ti in vicinanza della data di morte sono stati inclusi com-presa, quindi, quella parte di casistica su base autoptica per la quale è stato riconosciuto un precedente momento di diagnosi clinica. La sopravvivenza è stata calcolata per tutti i soggetti adulti di età uguale o superiore a 15 anni. L’inclusione dei tumori multipli nell’analisi comporta che un singolo paziente potrà essere conteggiato più volte sia in differenti analisi, in ragione della presenza di differenti tumori primitivi per lo stesso soggetto, sia all’interno della stessa analisi, quando questa raggruppi più sedi distinte o l’insieme di tutte le sedi oncologiche. La scelta effettuata in quest’ultimo caso è coerente con i criteri di inclusione del-lo studio. Va tuttavia sottolineato che questa impostazio-ne costituisce una variazione rispetto al concetto di soprav-vivenza basata sul paziente; quest’ultima comporta infatti l’inclusione di un solo evento diagnostico, generalmente il primo, per il medesimo soggetto.4
cAsi PArticoLAriIn considerazione dell’eterogeneità nella classificazione e nel-la registrazione del comportamento dei tumori della vescica e delle note problematiche che ne derivano,5 le analisi pre-sentate per questa sede includono anche i papillomi e carci-nomi a cellule transizionali a comportamento non maligno della vescica (morfologie ICD-O-3: 8000-8010 e 8120-8131). Eventuali neoplasie non maligne papillari della vesci-ca codificate non correttamente nell’ambito dei papillomi a cellule squamose (8050-8052) sono state ricondotte al grup-po più idoneo (8120-8131) e pertanto incluse nell’analisi. I tumori a comportamento benigno e incerto del sistema nervoso centrale e/o in sede intracranica e che sono regi-strati in modo eterogeneo nel tempo e nello spazio dai Re-gistri Tumori italiani, sono stati esclusi dall’analisi.
mortALità deLLA PoPoLAzione generALePer il calcolo delle statistiche presentate in questa monogra-fia è necessario stimare la sopravvivenza attesa di un grup-po della popolazione generale comparabile con i casi per età, sesso, tempo di calendario e provincia di residenza. Le stime della sopravvivenza attesa sono basate sulle tavole delle pro-babilità annuali di morte della popolazione generale rese di-sponibili dall’ISTAT (http://www.demo.istat.it).
MetodiindicAtori di soPrAvvivenzALe statistiche di sopravvivenza hanno l’obiettivo di misurare la probabilità di vivere dei pazienti dopo una diagnosi di tu-
ical diagnosis. Survival was computed for all patients aged 15 or more. The inclusion of multiple tumours in the analysis implies that each single patient may be counted several times and in dif-ferent analyses, because of the presence of different primaries for the same patient, and also within the same analysis, when grouping different or all cancer sites. The choice made in the latter case is consistent with the inclusion criteria. However, it should be noted that this approach represents a variation on the idea of patient-based survival, which includes only a sin-gle primary, usually the first, for each subject.4
AdditionAL criteriAThere are several issues related to the current use of differ-ent practices for coding behaviour of urinary bladder can-cer,5 therefore the present publication includes non-malignant bladder transitional cell papillomas and carcinomas (ICD-O-3 morphologies: 8000-8010 plus 8120-8131). Papillary non-malignant bladder neoplasms miscoded into spindle cell papillomas (8050-8052) were revised and coded according to the most appropriate category (8120-8131) and included in the analysis.Since intra-cranial and/or central nervous system cancers with benign or uncertain behaviour are registered in different ways, both temporally and spatially, they were excluded.
generAL PoPuLAtion mortALitYTo calculate the statistics presented in this monograph, an es-timate of the expected survival of a general population group comparable with cases by age, sex, calendar time, and prov-ince of residence is required. Expected survival estimates are based on the tables of the annual probabilities of death in the general population made available by ISTAT (http://www.demo.istat.it).
MethodssurvivAL indicAtorsSurvival statistics are intended to measure the probability of patients to live after a diagnosis of cancer. In this study, we pre-sent survival estimates at the population level, i.e., relevant to the survival of all cancer cases detected in a population living in areas covered by the Italian cancer registries, unlike the sur-vival estimates of cancer cases enrolled in clinical trials involv-ing patients with selected and often not representative charac-teristics.6To measure survival after a cancer diagnosis it is necessary to consider that a cancer patient may die because of cancer or other causes of death (competing risks). Usually, reports show the survival probability after a diagnosis of cancer by elimi-nating the distortion arising from the chance of dying from
continua da pagina 208 continued from page 208
205_226_AIRTUM_2017.indd 211 26/04/17 10.37

Epidemiol Prev 2017; 41 (2) suppl1. doi: 10.19191/EP17.2S1.P001.017 212 Ulteriori dati disponibili sul sito: www.registri-tumori.it
I TUMORI IN ITALIA RAPPORTO AIRTUM 2016 SOPRAVVIVENZA materiali e metodi
more. Diversamente dalle stime di sopravvivenza dei malati di tumore arruolati in studi clinici riguardanti pazienti con caratteristiche selezionate e spesso non rappresentative della totalità dei casi, in questa monografia presentiamo stime di sopravvivenza a livello di popolazione che riguardano la so-pravvivenza di tutti i casi di tumore rilevati nella popolazio-ne residente nelle aree coperte dai Registri Tumori italiani.6Per misurare la sopravvivenza dopo una diagnosi di tumo-re è necessario considerare che un paziente affetto da tu-more può morire a causa del tumore o per altre cause di morte (cause competitive). In genere si riporta la proba-bilità di sopravvivere dopo una diagnosi di tumore elimi-nando la distorsione derivante dalla possibilità di morire per altre cause. Tale statistica, indicata come sopravviven-za netta, è una stima ideale quando lo scopo è confrontare la sopravvivenza dopo una diagnosi di tumore tra popola-zioni o periodi temporali perché esclude che le differenze eventualmente riscontrate possano essere attribuite a va-riazioni del rischio di morire per cause diverse dal cancro. Tuttavia, pazienti e clinici sono maggiormente interessati a conoscere le chance reali di sopravvivenza dopo una dia-gnosi di tumore e più in dettaglio la probabilità di morire a causa del tumore, la probabilità di morire per altre cause e la probabilità di restare in vita. Un altro tipo di statistica, indicata come probabilità reale (in inglese crude probabili-ty) di morte, stima queste probabilità. Diversamente dalla sopravvivenza netta, la probabilità reale di morte è calcola-ta in modo da tener conto del fatto che la morte per altre cause impedisce di morire a causa del tumore.7 Tale azio-ne competitiva delle altre cause di morte determina una ri-duzione del numero di morti attribuibili al cancro e conse-guentemente della probabilità di morire per questa causa. La probabilità reale di morte è perciò una misura adatta a livello individuale per le valutazioni prognostiche e a livel-lo di popolazione per indicazioni sull’allocazione di risorse in cui è necessario considerare che la morte per altre cause può precludere di sperimentare i benefici di un interven-to sul cancro.6
PooL deLLA coorte (42 registri tumori)Con i casi inclusi in questo pool (anni di diagnosi 2005-2009) sono state calcolate la sopravvivenza netta standar-dizzata per età e la probabilità reale di morte a 5 anni dalla diagnosi. La sopravvivenza netta è stata calcolata applican-do il metodo di Pohar Perme. Questo metodo stima la so-pravvivenza netta pesando ciascuna osservazione per l’in-verso della sua sopravvivenza attesa.8 In questo studio le stime della sopravvivenza attesa sono basate sulle tavole di mortalità ISTAT specifiche per provincia in cui opera il Registro, stratificate per età, sesso e anno di calendario.Il calcolo dello stimatore di Pohar Perme, originariamen-
other causes. This statistic, called net survival, is an ideal esti-mate when the purpose is to compare survival after a diagnosis of cancer among populations or time periods, because it pre-vents any possible differences from being attributed to chang-es in the risk of dying from causes other than cancer. Howev-er, patients and clinicians are more interested in knowing the real chances of survival after a diagnosis of cancer and, more in detail, the probability of dying from cancer, the probability of dying from other causes, and the probability of staying alive. Another type of statistic, called crude probability of death, esti-mates these probabilities. Unlike net survival, the crude prob-ability of death is calculated to take account of the fact that death from other causes prevents patients from dying from can-cer.7 The competitive action of other causes of death leads to a reduction in the number of deaths from cancer and conse-quently in the probability of dying from this cause. Therefore, crude probability of death represents at the individual level an appropriate measure for prognostic assessment and at popula-tion level may provide clues for resource allocation, which re-quires consideration of the fact that death from other causes may preclude from experiencing the benefits of an interven-tion on cancer.6
cohort PooL (42 cAncer registries)With the cases included in this pool (years of diagnosis 2005-2009), we estimated age-standardized 5-year net survival and 5-year crude probability of death. Net survival was calculated by applying the Pohar Perme method. This method estimates net survival by weighing each observation by the inverse of its expected survival.8 In this study, the expected survival esti-mates are based on the life tables provided by the Italian Insti-tute of Statistics (ISTAT) for each province where a cancer reg-istry operates, stratified by age, sex, and calendar year.The calculation of the Pohar Perme estimator, originally de-veloped for continuous survival times, was later adapted to the actuarial approach, in which the estimate is made by dividing survival time into intervals. This approach, implemented in the strs STATA function, was used for the estimates shown in this monograph.9 For computation, the interval width of one month was specified.When survival estimates are compared between groups, we have to consider that the Pohar Perme method does not take into account the different distribution by age at diagnosis of cases in each group. Therefore, net survival was age-standardized by using weights of the International Cancer Survival Standard (ICSS) referring to five age classes.10
In the previous AIRTUM monograph on Italian cancer sur-vival, published in 2011, net survival was estimated by the Ederer II method.1,11 Therefore, the use of the Pohar Perme method is an innovation introduced after significant progress in the understanding and estimation of net survival in re-
205_226_AIRTUM_2017.indd 212 26/04/17 10.37

Epidemiol Prev 2017; 41 (2) suppl1. doi: 10.19191/EP17.2S1.P001.017 213 Ulteriori dati disponibili sul sito: www.registri-tumori.it
I TUMORI IN ITALIA RAPPORTO AIRTUM 2016 SOPRAVVIVENZA materiali e metodi
te sviluppato per tempi di sopravvivenza continui, è stato successivamente adattato all’approccio attuariale in cui la stima è effettuata dividendo il tempo di osservazione in in-tervalli. Tale metodo, implementato nella funzione strs di STATA, è stato utilizzato per le stime presentate in questa monografia.9 Per il calcolo si è specificata un’ampiezza di intervallo pari a 1 mese. In caso di confronto delle stime di sopravvivenza tra grup-pi è necessario considerare che il metodo di Pohar Perme non tiene conto della diversa distribuzione per età alla dia-gnosi dei casi in ciascun gruppo. Pertanto, la sopravviven-za netta è stata standardizzata per età con i pesi dell’Inter-national Cancer Survival Standard (ICSS) riferiti a cinque classi di età.10 Nella precedente monografia AIRTUM dedicata alla so-pravvivenza dei malati oncologici in Italia, pubblicata nel 2011, la sopravvivenza netta è stata stimata adoperando il metodo di Ederer II.1,11 L’uso del metodo di Pohar Perme è quindi una innovazione introdotta in seguito all’impor-tante progresso nella comprensione e nella stima della so-pravvivenza netta di questi ultimi anni.12 Si può riassicura-re sull’impatto pratico di tale innovazione poiché, dopo la standardizzazione per età, le stime della sopravvivenza a 5 anni ottenute con il metodo di Pohar Perme si discostano in modo trascurabile da quelle ottenute con il metodo di Ederer II13,14 Per questo è possibile comparare validamen-te le stime standardizzate di sopravvivenza ottenute con il metodo di Pohar Perme con quelle ottenute con il meto-do di Ederer II riportate in altre pubblicazioni.15 In que-sta esperienza la differenza media tra le stime ottenute con i due metodi, calcolata su tutte le sedi esaminate, è risultata uguale a 0,08% con un minimo e un massimo compresi tra -0,55% e 0,55%. Inoltre, per completare la documentazio-ne, le tabelle disponibili online come materiale supplemen-tare della monografia includono anche le stime di sopravvi-venza ottenute con il metodo di Ederer II. Sulla base della suddivisione del territorio italiano in ripar-tizioni geografiche adoperata dall’ISTAT sono stati definiti i seguenti accorpamenti di Registri: Nord-Ovest, Nord-Est, Centro e Sud (Tabella 2). La sopravvivenza netta standar-dizzata a 5 anni è stata calcolata per ciascuna di queste aree.Stime della sopravvivenza netta standardizzata a 5 anni dal-la diagnosi sono state ottenute per 11 regioni italiane in cui la popolazione interessata dalla registrazione dei tumori su-pera il 40% del totale. Per il Piemonte e la Toscana la re-gistrazione è inferiore (rispettivamente 29% e 33%) e ri-guarda prevalentemente la popolazione residente in centri urbani. Le stime di sopravvivenza di Piemonte e Toscana sono perciò meno rappresentative della sopravvivenza di tutti i casi di tumore diagnosticati nella popolazione rispet-to alle stime delle altre 11 regioni dove la registrazione dei
cent years.12 We can be reassured as to the practical impact of this innovation because after age-standardization differences between 5-year survival estimates obtained using the Pohar Perme and Ederer II methods are negligible.13,14 Therefore, we can validly compare the Pohar Perme standardized sur-vival estimates with the Ederer II estimates in other publica-tions.15 In this experience, the average difference between the estimates obtained by the two methods, on all examined can-cer sites, was 0.08%, ranging from -0.55% to 0.55%. In ad-dition, for the sake of documentation, tables available as on-line supplements of the monograph include Ederer II survival.According to the ISTAT partition of the Italian country into geographical areas, cancer registries have been gathered as fol-lows: North-West, North-East, Centre, and South (Table 2). Standardized net 5-year survival was calculated for each of these areas.Estimates of standardized net 5-year survival after diagnosis were also computed for 11 Italian regions where the popula-tion covered by cancer registration exceeds 40% of the total. In Piedmont and Tuscany the proportion is lower, respectively 29% and 33%, and cancer registration mainly concerns the population living in large urban centres. As a result, surviv-al estimates of Piedmont and Tuscany are less representative of the survival of all cancer cases diagnosed in the population compared to the estimates of the other 11 regions where cancer registration is more widespread. Thus, as they need to be con-sidered more cautiously, the estimates of Piedmont and Tusca-ny have been labelled with an “*” in the funnel plots (cancer-specific data sheets, pp. 70-191). In Lazio, the cancer registry of Latina is active, and in Calabria the cancer registry of Cat-anzaro is active. Data of these two registries were not used for the regional estimates, as the regional coverage of cancer regis-tration is still low (Table 1). As a result, data from 40 cancer registries are included in this analysis. Net survival of cancer cases diagnosed in the 13 regions spec-ified above was compared using a funnel plot as a graphical tool.16 In this graph, net survival is on the y-axis and the pre-cision of the estimate on the x-axis. Since the precision of the estimate, computed as the inverse of the net survival variance, has poorly interpreTable values, we preferred to show on the x-axis only “Low” at the left end and “High” at the right end, to indicate the growing sense of precision from the left to the right side of the plot.The funnel plot shows the following: the set of regional esti-mates forming a scatter plot, a solid horizontal line as refer-ence value of the regional estimates taken as the average of the individual values and four control lines to indicate how much the reference value may randomly vary depending on the pre-cision of its estimation. The control lines have a funnel shape, wider in the left part of the graph and progressively narrow-ing toward the right side. This aspect emphasizes the greater
205_226_AIRTUM_2017.indd 213 26/04/17 10.37

Epidemiol Prev 2017; 41 (2) suppl1. doi: 10.19191/EP17.2S1.P001.017 214 Ulteriori dati disponibili sul sito: www.registri-tumori.it
I TUMORI IN ITALIA RAPPORTO AIRTUM 2016 SOPRAVVIVENZA materiali e metodi
tumori è più diffusa. Dovendo, perciò, essere considerate con maggiore cautela, le stime relative a Piemonte e Tosca-na sono state contrassegnate con un asterisco (*) nei fun-nel plot riportati nelle schede specifiche per tumore (pp. 70-191). I dati dei Registri Tumori di Latina e Catanzaro non sono stati utilizzati per le stime regionali di Lazio e Ca-labria in quanto la copertura regionale della registrazione è ancora bassa (Tabella 1). Pertanto in questa analisi sono stati inclusi i dati di 40 Registri Tumori .La sopravvivenza netta dei casi di tumore diagnosticati nel-le 13 regioni sopra specificate è stata confrontata utilizzan-do il funnel plot come strumento di rappresentazione.16 In questo grafico la sopravvivenza netta è sull’asse delle ordinate e la precisione di tale stima sull’asse delle ascis-se. Poiché la precisione della stima, calcolata come inver-so della varianza della sopravvivenza netta, assume valori scarsamente interpretabili si è preferito riportare sull’asse delle ascisse solo l’indicazione «Low» all’estremo sinistro e «High» all’estremo destro per indicare il senso crescen-te della precisione procedendo nel grafico da sinistra ver-so destra. Nel funnel plot sono indicati: tutte le stime re-gionali come in un diagramma di dispersione, una linea orizzontale di riferimento in corrispondenza della soprav-vivenza media calcolata dall’insieme delle stime regionali e quattro linee di controllo per indicare di quanto il valo-re di riferimento può variare casualmente in funzione del-la precisione con cui è stimato. Le linee di controllo hanno una forma a imbuto essendo più larghe nella parte sinistra del grafico e progressivamente più strette verso la parte de-stra. Questo aspetto sottolinea la maggiore variabilità del-le stime meno precise riportate nella parte sinistra e la mi-nore variabilità di quelle più precise riportate a destra. Una stima che appare all’esterno delle linee di controllo più di-stanti dalla linea orizzontale (linee rosse nei grafici) differi-sce dal valore di riferimento con una probabilità superiore al 99,8%. Una stima all’esterno delle linee di controllo più vicine alla linea orizzontale (linee blu nei grafici) differisce dal valore di riferimento con una probabilità superiore al 95%. In questo modo è possibile rilevare insieme lo scosta-mento di un’osservazione dal parametro di riferimento e la plausibilità che lo scostamento dipenda dalla variabilità ca-suale della stima. Nel funnel plot le regioni sono individua-te da una sigla di 3 lettere, seguita da un asterisco nel caso di Piemonte e Toscana. Questo grafico è preferibile a una rappresentazione delle differenze con un diagramma a barre orizzontali, comune-mente indicato come caterpillar plot. Infatti, in quest’ulti-mo grafico un intervallo di confidenza è tracciato per ogni singola stima incoraggiando il confronto di ciascuna di esse con il valore di riferimento senza tener conto del problema dei confronti multipli. Il funnel plot, al contrario, conside-
variability of less precise estimates shown on the left side and the lower variability of more precise estimates on the right side. An estimate that appears outside the most distant control lines (red lines in the graph) from the horizontal line differs from the reference value with a probability higher than 99.8%. The estimates outside the control lines closer to the horizontal line (blue lines in the graph) differ from the reference value with a probability higher than 95%. This makes it possible to detect both the deviation of an observation from the refer-ence value and the plausibility that the deviation depends on the random variation of the estimate. In the funnel plot, re-gions are identified by a 3-letter code, followed by an asterisk for Piedmont and Tuscany. This graph is preferable to representing differences with a hor-izontal bar graph, commonly referred to as a caterpillar plot, since the latter shows a confidence interval for each estimate encouraging the comparison of each with the reference value, without taking into account the problem of multiple compar-isons. Instead, the funnel plot only considers the variability of the reference value and shows how only this value can vary within progressively wider limits as long as the precision of its measurement decreases. This approach directs toward a bet-ter assessment of whether the value of a single estimate, in this case the survival estimate of a particular region, significantly differs from a reference value. In addition, the horizontal bar diagram furthers an erroneous interpretation of lack of differ-ences between two estimates whose confidence intervals over-lap and, ordering the values from lowest to highest, spuriously attributes a rank to individual observations.16-19
The crude probability of death from cancer, given the chance of dying from other causes, can be computed from the all-cause survival probability and the cancer-specific mortality rate.20-
21 Specific methods have been developed to estimate crude probability of death from cancer, in the presence of other caus-es, without the use of cause of death information.22-23 In this monograph, such an approach has been used by applying a flexible parametric model. This model fits to data the mor-tality of cancer cases in excess to mortality of a reference pop-ulation computed from rates in the above-mentioned ISTAT mortality tables. Restricted cubic splines have been used to model the logarithm of time with 5 degrees of freedom, the age at diagnosis with 4 degrees of freedom and 2 more degrees of freedom to modify the effect of this variable during the follow-up time (time-dependent effect).24 After adapting this model to data for each cancer site and, where appropriate, each gen-der, we obtained the crude probabilities of dying from cancer and other causes estimated by the model, specific for age and time from diagnosis. It must be emphasized that, by increasing age at diagnosis, the competitive effect of other causes of death in reducing the actual chance of dying from cancer becomes progressively more evident. Therefore, it is important to assess
205_226_AIRTUM_2017.indd 214 26/04/17 10.37

Epidemiol Prev 2017; 41 (2) suppl1. doi: 10.19191/EP17.2S1.P001.017 215 Ulteriori dati disponibili sul sito: www.registri-tumori.it
I TUMORI IN ITALIA RAPPORTO AIRTUM 2016 SOPRAVVIVENZA materiali e metodi
ra solo la variabilità del valore di riferimento e mostra come solo questo valore può variare entro limiti progressivamen-te più ampi al ridursi della precisione con cui è misurato. Tale approccio indirizza a valutare più correttamente se il valore di una singola stima, in questo caso la stima di so-pravvivenza di una particolare regione, si discosta signifi-cativamente o meno da un valore di riferimento. Inoltre, il diagramma a barre orizzontali favorisce l’erronea interpre-tazione di assenza di differenze tra due stime i cui interval-li di confidenza si sovrappongono e, ordinando i valori dal più basso al più alto, attribuisce erroneamente un rango alle singole osservazioni.16-19
La probabilità reale di morte per cancro, tenuto conto del-la possibilità di morire per altre cause, può essere calcolata a partire dalla probabilità di sopravvivere per tutte le cause e dal tasso di mortalità specifico per il cancro.20-21 Metodi specifici sono stati sviluppati per stimare la probabilità re-ale di morte per il cancro, in presenza di altre cause, sen-za fare uso dell’informazione sulla causa di morte.22-23 In questa monografia si è usato un approccio di questo tipo applicando un modello parametrico flessibile. Questo mo-dello adatta ai dati la mortalità dei casi di tumore in ecces-so rispetto alla mortalità di una popolazione di riferimen-to calcolata in base ai tassi nelle sopra menzionate tavole di mortalità dell’ISTAT. Con spline cubiche ristrette si è mo-dellato il logaritmo del tempo di osservazione con 5 gradi di libertà, l’età alla diagnosi con 4 gradi di libertà e 2 gra-di di libertà per la modifica dell’effetto di questa variabile durante il tempo di osservazione (effetto tempo-dipenden-te).24 Dopo aver adattato questo modello ai dati per ogni tipo di tumore e, nelle sedi distinte per genere, per cia-scun genere, si sono ottenute le probabilità reali di morire per cancro e per le altre cause stimate dal modello, specifi-che per età e tempo dalla diagnosi. E’ necessario considera-re che, all’aumentare dell’età alla diagnosi dei casi, diventa progressivamente più evidente l’effetto competitivo delle altre cause di morte nel ridurre la probabilità reale di mo-rire a causa del tumore. Per questo è importante valutare insieme la probabilità reale di morte per il cancro e per le altre cause al variare dell’età alla diagnosi dei casi. Rispetto ad altri metodi il modello applicato ha il vantaggio di po-ter studiare tale relazione in dettaglio. Si è quindi rappre-sentato in un grafico l’andamento della probabilità reale di morte per il cancro e per le altre cause stimate dal modello a 5 anni dalla diagnosi rispetto all’età dei casi. Il riferimen-to temporale a 5 anni dalla diagnosi è stato scelto essendo il più diffuso indicatore prognostico a breve termine.
PooL deL trend temPorALe (17 registri tumori)La sopravvivenza netta standardizzata a 5 e 10 anni dalla diagnosi è stata calcolata per i trienni 1994-1996, 1997-
jointly how the crude probabilities of death from cancer and other causes vary according to age of cases at diagnosis. Com-pared to other methods, the applied model has the advantage of being able to study this relationship in detail. Therefore, a graph was prepared, showing the trend of 5-year crude prob-abilities of death from cancer and from other causes, estimat-ed by the model, with respect to the age of cases. Five-year time reference was chosen, as it is the most widely used short-term prognostic indicator.
time trend PooL (17 cAncer registries)Five-, and ten-year age-standardized net survival were com-puted for the following three-year periods: 1994-1996, 1997-1999, 2000-2002, 2003-2005, 2006-2008, and 2009-2011. We selected cases diagnosed in each three-year period and computed net survival by applying the cohort approach when it was possible to follow cases for the entire time of ob-servation.25 Since for the most recent three-year periods cases cannot be followed for 5 or 10 years from diagnosis, a predic-tion of net survival at 5 or 10 years was obtained using a hy-brid approach.26 Figure 2 shows an example of the hybrid ap-proach calculation of 10-year net survival for cases diagnosed in 2006-2008 and followed up until the end of 2013.From the figure, we see that the survival experience of cases diagnosed in 2006-2008, followed up to 5-7 years after di-agnosis, and the survival experience of cases diagnosed from 2001 to 2005 to complete the observation time up to 10 years after diagnosis both contribute to the survival estimate. How-ever, the cases diagnosed before 2006 contribute to estimation only from some time after diagnosis (left truncation) in a time window from 2011 to 2013.As further examples, let us consider cases diagnosed in 2003-2005 and 2009-2011. The former are followed for 8-10 years and the latter for 2-4 years until 2013. To complete the calcu-lation of survival 10 years after diagnosis, we use the survival experience of cases diagnosed in 2001 and 2002 for the for-mer, and the survival experience of cases diagnosed from 2001 to 2008 for the latter. However, cases diagnosed in recent years contribute to the estimation only with the experience included in the observation window between 2011 and 2013.Several studies showed that, by applying this technique of computation, we obtain good predictions of the survival measured later, when the follow-up has been completed.27-28 In the graph showed in the cancer-specific data sheets (pp. 70-191, survival estimates are connected by a solid line when computed with the cohort approach, by a dashed line when computed with the hybrid approach. The former are based on the follow-up of cases until 5 or 10 years from diagnosis, while the latter are predictions of 5- and 10-year net survival whose precise value will be measured in the future, when that number of years from diagnosis has elapsed.
205_226_AIRTUM_2017.indd 215 26/04/17 10.37

Epidemiol Prev 2017; 41 (2) suppl1. doi: 10.19191/EP17.2S1.P001.017 216 Ulteriori dati disponibili sul sito: www.registri-tumori.it
I TUMORI IN ITALIA RAPPORTO AIRTUM 2016 SOPRAVVIVENZA materiali e metodi
1999, 2000-2002, 2003-2005, 2006-2008 e 2009-2011. Abbiamo selezionato i casi incidenti in ciascun triennio e calcolato la sopravvivenza netta a 5 e 10 anni applican-do l’approccio di coorte quando è stato possibile osserva-re i casi fino a 5 e 10 anni dalla diagnosi. 25. Poiché per i trienni più recenti i casi non possono essere seguiti fino a 5 o 10 anni, una previsione della sopravvivenza netta a 5 o 10 anni è stata ottenuta applicando l’approccio ibrido.26 Per illustrare l’applicazione dell’approccio ibrido, la Figu-ra 2 mostra la modalità di calcolo della sopravvivenza net-ta a 10 anni per i casi diagnosticati nel triennio 2006-2008 e seguiti fino alla fine del 2013. Dalla figura si può osser-vare che contribuiscono al calcolo l’esperienza di sopravvi-venza dei casi diagnosticati nel triennio 2006-2008, seguiti fino a 5-7 anni dalla diagnosi, e l’esperienza di sopravvi-venza dei casi diagnosticati dal 2001 al 2005 per comple-tare l’osservazione fino a 10 anni dalla diagnosi. Tuttavia, i casi diagnosticati prima del 2006 contribuiscono alla sti-ma solo dopo un certo tempo dalla diagnosi (troncamen-to a sinistra) nella finestra di osservazione compresa tra il 2011 e il 2013. Come ulteriori esempi, si possono conside-rare i casi diagnosticati nel triennio 2003-2005 e nel trien-nio 2009-2011. I primi sono seguiti per 8-10 anni e i se-condi per 2-4 anni fino al 2013. Per completare il calcolo della sopravvivenza a 10 anni dalla diagnosi si utilizza per i primi l’esperienza di sopravvivenza dei casi diagnosticati nel 2001 e 2002, per i secondi l’esperienza di sopravviven-za dei casi diagnosticati dal 2001 al 2008. Tuttavia, i casi diagnosticati in questi anni contribuiscono alla stima solo con l’esperienza compresa nella finestra di osservazione tra il 2011 e il 2013.Diversi studi hanno dimostrato che con questa modalità di stima si ottiene una buona previsione della probabilità di sopravvivenza misurata in seguito quando il tempo di os-servazione sarà completato.27-28 Nel grafico presentato nel-le schede specifiche per tumore ( pp. 70-191) le stime di sopravvivenza calcolate con l’approccio di coorte sono col-legate da una linea continua per indicare che esse si basano sull’osservazione dei casi fino a 5 o a 10 anni dalla diagnosi, mentre le stime di sopravvivenza calcolate applicando l’ap-proccio ibrido sono collegate da una linea tratteggiata per indicare che esse sono previsioni della sopravvivenza a 5 o a 10 anni il cui valore preciso potrà essere determinato in futuro quando questi anni dalla diagnosi saranno trascorsi.
PooL deLLA soPrAvvivenzA condizionAtA(24 registri tumori)La sopravvivenza netta condizionata CSx,y rappresenta la probabilità di una coorte di pazienti, che è già sopravvissu-ta x anni dopo la diagnosi, di sopravvivere ulteriori y anni. Si può calcolare con la semplice formula:29
conditionAL survivAL PooL (24 cAncer registries) Considering a cohort of patients, their conditional survival is the probability of surviving y years, given that the patients al-ready survived x years. A simple formula for conditional sur-vival is:29
Conditional survival was age-standardized with the ICCS weights as mentioned above.
Life eXPectAncY PooL (18 cAncer registries)Another overall measure of survival is average survival, or life expectancy. In particular, the comparison between the life ex-pectancy of the general population and that of cancer patients is useful to understand what a cancer diagnosis entails in terms of reduction in life expectancy at the individual level and to quan-tify the cancer burden at the population level. In a cohort of cancer patients, the calculation of life expectancy requires a full all-cause survival curve of cancer patients, that is, survival un-til everyone has died, and this makes it necessary to follow cas-es for a very long time after diagnosis. A recent methodological study demonstrated that reliable estimates of life expectancy can be obtained even with a limited follow-up, breaking up mor-tality from all causes into excess mortality due to cancer and ex-pected mortality in the general population free of the disease un-
foLLow-uP YeArs
2006
2007
2008
2009
2010
2011
2012
2013
YeA
rs o
f d
iAg
no
sis
2001 5 6 7 8 9 10
2002 4 5 6 7 8 9 10
2003 3 4 5 6 7 8 9 10
2004 2 3 4 5 6 7 8 9
2005 1 2 3 4 5 6 7 8
2006 0 1 2 3 4 5 6 7
2007 0 1 2 3 4 5 6
2008 0 1 2 3 4 5
2009 0 1 2 3 4
2010 0 1 2 3
2011 0 1 2
figure 2. application of a hybrid approach for deriving 10-year survival for pa-tients diagnosed from 2006 through 2008 and followed up to the end of 2013.
205_226_AIRTUM_2017.indd 216 26/04/17 10.37

Epidemiol Prev 2017; 41 (2) suppl1. doi: 10.19191/EP17.2S1.P001.017 217 Ulteriori dati disponibili sul sito: www.registri-tumori.it
I TUMORI IN ITALIA RAPPORTO AIRTUM 2016 SOPRAVVIVENZA materiali e metodi
La sopravvivenza condizionata viene standardizzata per età, secondo la stessa modalità descritta precedentemen-te, per consentire un più agevole confronto per ripartizio-ne geografica.
PooL deLLA sPerAnzA di vitA (18 registri tumori)Un’altra misura complessiva della sopravvivenza è la so-pravvivenza media o speranza di vita. In particolare il con-fronto tra la speranza di vita della popolazione generale e quella dei pazienti affetti da un tumore è utile per com-prendere cosa comporti una diagnosi di cancro in termi-ni di riduzione dell’aspettativa di vita a livello individuale e per quantificare il cancer burden a livello di popolazione. In una coorte di pazienti neoplastici il calcolo della speran-za di vita richiede la stima della curva di sopravvivenza per tutte le cause dopo aver osservato tutti i soggetti dalla dia-gnosi fino alla morte e questo rende necessario seguire i casi per un tempo molto lungo. Un recente studio metodolo-gico ha dimostrato la possibilità di ottenere stime affidabili della speranza di vita anche con un periodo di osservazione dei casi più limitato scomponendo la mortalità per tutte le cause nella mortalità in eccesso dovuta al tumore e mortali-tà attesa della popolazione generale libera della malattia in studio.30 Il metodo si avvale del fatto che dopo alcuni anni dalla diagnosi la mortalità in eccesso rappresenta una par-te relativamente piccola della mortalità per tutte le cause e che per tempi di osservazione più lunghi la mortalità attesa diventa il determinante nettamente prevalente della mor-talità per tutte le cause. La mortalità attesa è ottenuta dalle tavole di mortalità della popolazione generale e la estrapo-lazione può esser fatta sulla base di assunti concernenti la mortalità futura della popolazione generale. Il metodo si basa sull’uso di un modello parametrico fles-sibile che adatta ai dati il tasso di mortalità in eccesso dei casi di tumore e il tasso di mortalità atteso della popola-zione generale. Il modello consente di ottenere delle sti-me della mortalità in eccesso e di estrapolarle oltre il tem-po disponibile di osservazione dei casi. La mortalità attesa è ottenuta dalle citate tavole di mortalità dell’ISTAT. Il tas-so di mortalità atteso è attribuito a ciascun caso per ogni anno di osservazione dalla data di diagnosi alla data di fine dello studio. Pertanto, nel calcolo della mortalità attesa, il metodo tiene conto dell’invecchiamento e della variazio-ne dei tassi tra anni di calendario. Al momento della pre-parazione di questo contributo l’ISTAT rende disponibi-li tavole di mortalità, stratificate per provincia, sesso, età e anno di calendario, fino al 2013. Per estrapolare la morta-lità attesa oltre tale data è stata chiesta e ottenuta dallo stes-
der study.30 The method relies on the fact that a few years after diagnosis excess mortality is a relatively small part of mortality from all causes, so expected mortality dominates for long-term follow-up. Expected mortality is obtained from the mortality rates of the general population and extrapolation can be car-ried out on the basis of assumptions concerning future popula-tion mortality rates.The method is based on the use of a flexible parametric model that fits the excess mortality rate of cancer cases and the expect-ed mortality rate of the general population. The model allows us to estimate excess mortality and extrapolate it beyond the available follow-up time. Expected mortality is obtained from the above-mentioned ISTAT mortality tables. Expected mor-tality rates are matched to the individual in each given fol-low-up time from the time of diagnosis to the end of the study. Therefore, in the calculation of life expectancy, the method takes aging and changing rates over calendar years into ac-count. At the time of this contribution, ISTAT makes avail-able mortality tables, stratified by province, gender, age, and calendar year, until 2013. To extrapolate the expected mortal-ity beyond that date, predictions of expected mortality rates up to 2065, stratified by region, sex, age and calendar year, were sought and obtained from the same Institute.31 Expected mor-tality rates until 2065 were attributed to individual cases as previously described, i.e., taking aging and changing of rates over calendar years into account. This method of extrapola-tion of the expected mortality seemed preferable to the assump-tion that the population rates will stay the same from 2013 onwards.32
Aiming to produce the most up-to-date estimates of life expec-tancy, we used a hybrid approach in the analysis.33-34 Thus, we considered the survival experience of cases diagnosed in the years 2006-2010 from the date of diagnosis and the survival experience of cases diagnosed from 1994 to 2005 only from the beginning of 2009, so that, for each follow-up time, 5-year in-formation on incident cases is available. The Florence cancer registry contributed to this analysis with incident cases in three years, from 2006 to 2008 (Table 2). For the data of this reg-istry, we considered the survival experience of cases diagnosed from 1994 to 2005, but only from the beginning of 2011, so that, for each follow-up time, 3-year information on incident cases is available. All cases were followed until the earlier date between the date of death, 31 December 2013, and the end of 15 years of follow-up after diagnosis. For each cancer site and, where appropriate, for each gender, we fit a flexible para-metric model. The model uses restricted cubic splines to fit the logarithm of the follow-up time with 8 degrees of freedom, the age at diagnosis with 4 degrees of freedom and an additional 2 degrees to model the time-dependent effect of this variable. Estimates of life expectancy refer to cases 40 or more year-old at diagnosis to reduce the time period in which we need to ex-
205_226_AIRTUM_2017.indd 217 26/04/17 10.37

Epidemiol Prev 2017; 41 (2) suppl1. doi: 10.19191/EP17.2S1.P001.017 218 Ulteriori dati disponibili sul sito: www.registri-tumori.it
I TUMORI IN ITALIA RAPPORTO AIRTUM 2016 SOPRAVVIVENZA materiali e metodi
so Istituto la elaborazione di previsioni della mortalità atte-sa fino al 2065, stratificate per regione, sesso, età e anno di calendario.31I tassi di mortalità della popolazione generale previsti fino al 2065 sono stati attribuiti ai singoli casi con la stessa modalità sopra descritta, tenendo conto della va-riazione dei tassi a causa dell’invecchiamento e del cambia-mento degli anni di calendario. Tale modalità di estrapola-zione della mortalità attesa è sembrata preferibile a quella di considerare che la mortalità della popolazione restasse la stessa dal 2013 in poi.32
Con l’intento di produrre le stime più aggiornate della speranza di vita l’analisi ha utilizzato un approccio ibri-do.33,34 E’ stata perciò considerata l’esperienza di soprav-vivenza dei casi diagnosticati negli anni dal 2006 al 2010 a partire dalla data di diagnosi e l’esperienza di sopravviven-za dei casi diagnosticati dal 1994 al 2005, ma solo a parti-re dall’inizio del 2009 in modo tale che, per ogni tempo di osservazione, sia disponibile l’informazione dei casi inci-denti in 5 anni. Il Registro di Firenze ha potuto contribui-re a questa analisi con i casi incidenti in tre anni, dal 2006 al 2008 (Tabella 2). Per i dati di questo Registro si è con-siderata l’esperienza di sopravvivenza dei casi diagnostica-ti dal 1994 al 2005 a partire dall’inizio del 2011 in modo tale che, per ogni tempo di osservazione, sia disponibi-le l’informazione dei casi incidenti in tre anni. Tutti i casi sono stati seguiti fino alla prima tra la data del decesso, il 31 dicembre 2013 e la conclusione di 15 anni di osserva-zione dalla diagnosi. Per ciascuna sede di tumore e, nelle sedi con distinzione di genere, per ciascun genere è stato adattato un modello parametrico flessibile. Si è modellato con spline cubiche ristrette il logaritmo del tempo di os-servazione con 8 gradi di libertà, l’età alla diagnosi con 4 gradi di libertà e ulteriori 2 gradi per l’effetto tempo-di-pendente di questa variabile. Per ridurre il periodo di tem-po in cui è necessario estrapolare il tasso in eccesso dopo i 15 anni di follow-up disponibili e migliorare le previsioni ottenute dal modello, le stime della speranza di vita han-no riguardato i casi con 40 o più anni alla diagnosi, ad ec-cezione dei tumori del testicolo in cui si sono considerati i casi con 30 o più anni poiché una parte rilevante di casi interessa i giovani adulti.
stime PuntuALi, errori stAndArd e intervALLi di confidenzAIn questa monografia la sopravvivenza netta è stata stima-ta con il metodo di Pohar Perme utilizzando l’approccio attuariale. In base a questo approccio il tempo di osserva-zione è diviso in intervalli e si calcola per ciascuno di que-sti una stima della sopravvivenza netta intervallo-specifica. Nell’approccio di coorte la sopravvivenza netta per l’inter-vallo i è data da:9
trapolate the excess rate after 15 years of available follow-up and, thus, improving the forecasts of the model. However, for testis cancer we considered cases 30 or more year-old because young adults are a significant proportion of cases.
Point estimAtes, stAndArd errors And confidence intervALIn this monograph, net survival was estimated by the Pohar Perme method using the actuarial approach. According to this approach the follow-up time is divided into intervals and for each of these an interval-specific estimate is calculated. In the cohort approach, net survival for interval i is given by:9
where and are indicators of death and censoring of the subject j in the interval i, is the expected mortality rate of the subject j in the interval i, is the cumulative expected survival at mid-point of the interval, , , and are the sum of at-risk subjects at the beginning of the interval, of the dead and censored subjects over the interval i, weighted by the inverse of their expected survival, i.e.:
In the period and hybrid approach, interval-specific net sur-vival is given by:35
where is the width of the time interval i, and is the sum of time-at-risk of each individual in the interval i weighted for the inverse of their expected survival, i.e.:
Then, net survival at time t is computed as the product of in-terval-specific estimates until t :
In the cohort approach, the standard error of net survival at the end of the interval t is estimated by:13
205_226_AIRTUM_2017.indd 218 26/04/17 10.37

Epidemiol Prev 2017; 41 (2) suppl1. doi: 10.19191/EP17.2S1.P001.017 219 Ulteriori dati disponibili sul sito: www.registri-tumori.it
I TUMORI IN ITALIA RAPPORTO AIRTUM 2016 SOPRAVVIVENZA materiali e metodi
dove e sono rispettivamente l’indicatore della mor-te e della censura del soggetto j nell’intervallo i, è il tas-so di mortalità atteso del soggetto j nell’intervallo i, è la sopravvivenza cumulativa attesa alla metà dell’interval-lo, , , e corrispondono alla somma dei soggetti a rischio all’inizio dell’intervallo, morti e censurati nel cor-so dell’intervallo i, pesati per l’inverso della loro sopravvi-venza attesa, i.e.:
Nell’approccio di periodo e nell’approccio ibrido la soprav-vivenza netta per l’intervallo i è data da35
dove è l’ampiezza temporale dell’intervallo i e è la somma del tempo a rischio di ciascun individuo nell’inter-vallo i pesato per l’inverso della sua sopravvivenza attesa, i.e.:
La sopravvivenza netta al tempo t è quindi calcolata dal prodotto delle stime intervallo-specifiche fino a t:
Nell’approccio di coorte l’errore standard della sopravvi-venza netta alla fine dell’intervallo t è stimato da:13
Nell’approccio di periodo e ibrido la formula dell’errore standard è:35
the period and hybrid approach, the standard error is:35
Age-standardized net survival at time t is the weighted aver-age of age-specific survival computed in 5 age groups:
where are weights, summing up to 1, specific for cancer and age groups as defined in the International Cancer Sur-vival Standard (ICSS).10 Age-standardized estimates are not presented when one or more age-specific estimates cannot be computed due to early censoring or lack of cases. Minor adjust-ments were introduced, however, for mesothelioma (Table 4).The standard error of age-standardized net survival is calcu-lated by the formula:36
For regional survival estimates shown in the funnel plots, the standard error is computed by:
where is net survival at time t of the pool of regional estimates.19 The inverse of the squared standard error corre-sponds to the precision of the estimate.Following the previous definition of conditional standardized net survival, standard error is estimated by:1,37
Confidence intervals were calculated after a complementary log-log transformation. Therefore, they are always within the 0-100% range.
205_226_AIRTUM_2017.indd 219 26/04/17 10.37

Epidemiol Prev 2017; 41 (2) suppl1. doi: 10.19191/EP17.2S1.P001.017 220 Ulteriori dati disponibili sul sito: www.registri-tumori.it
I TUMORI IN ITALIA RAPPORTO AIRTUM 2016 SOPRAVVIVENZA materiali e metodi
La sopravvivenza netta standardizzata per età a un tempo t è calcolata dalla sopravvivenza dei casi aggregati in 5 clas-si di età:
dove sono i pesi specifici per neoplasia e classe di età come definiti dall’International Cancer Survival Standard (ICSS).10 Non sono presentate stime di sopravvivenza standardizzata nel caso in cui precedenti censure o man-canza di casi non consentano di stimare la sopravvivenza netta in una o più classi di età. Nel caso del mesotelioma è stato definito una nuova classe di età 15-54 anni, in so-stituzione delle classi 15-44 e 45-54, numericamente più esigue, mantenendone inalterato il peso complessivo (Ta-bella 4). L’errore standard della sopravvivenza netta standardizzata per età è calcolato con la formula:36
Per le stime regionali della sopravvivenza netta, rappresen-tate nei funnel plot, l’errore standard è calcolato da:
dove è la sopravvivenza netta al tempo t del pool delle stime regionali.19 L’inverso del quadrato dell’errore standard esprime il grado di precisione della stima regio-nale.L’errore standard della sopravvivenza netta condizionata standardizzata, precedentemente definita, è stimato da:1,37
Thorough description of methods and formulae applied for crude probability of death and life expectancy estimation are in Lambert and coll.23 and Andersson and coll.30
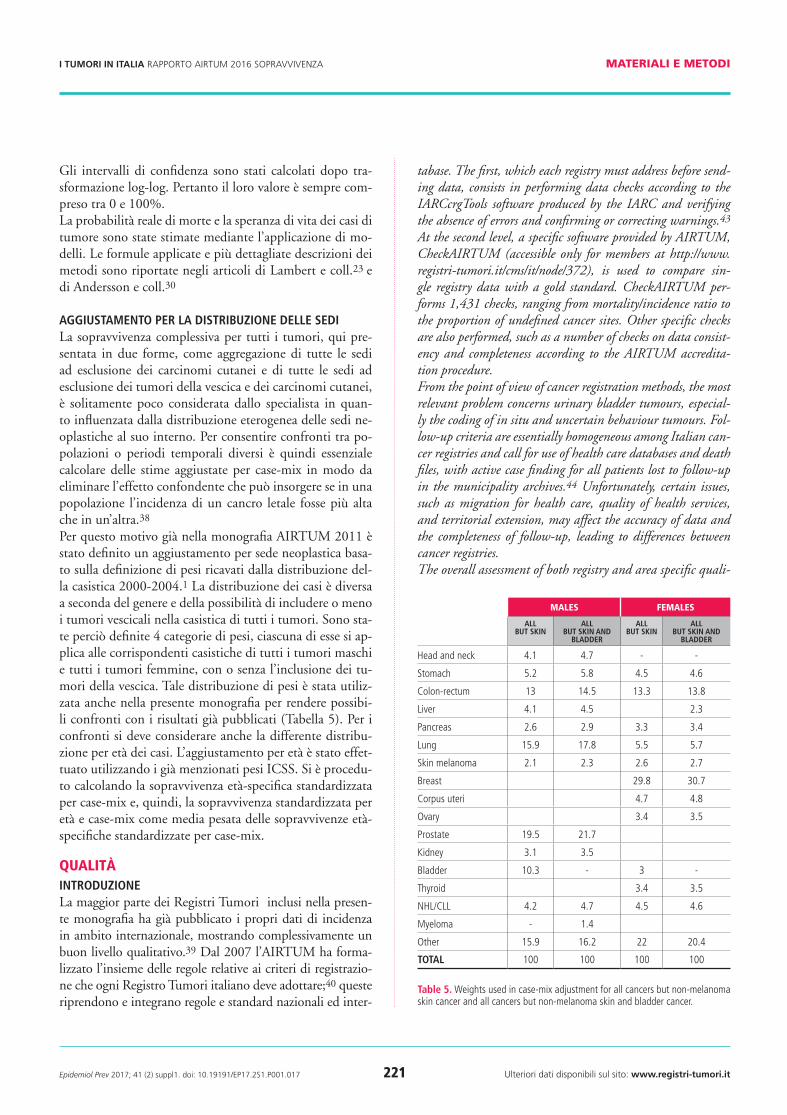
Adjusting for cAse-miXAll-site cancer survival, here reported in two different ways, as all-site except skin carcinomas and all-site except skin carcino-mas and bladder cancer, is usually not considered by specialists because it is strongly influenced by case-mix. To compare all-cancer survival among different populations and over time, it is essential to eliminate the confounding effect of the differing case-mix that may exist if the incidence of highly lethal cancer is higher in one country than in another.38 Therefore, in the previous 2011 AIRTUM monograph we already defined a cancer-site adjustment based on the use of weights derived from the cancer site distribution of the cas-es diagnosed in 2000-2004.1 The distribution of cases is dif-ferent depending on gender and the inclusion of bladder can-cer in the all-site cases. Therefore, 4 categories of weights were defined, each of them applying to the specific all-site cancer groups, males or females, with or without bladder cancer. For the sake of comparability with previous results, we used the same case-mix distribution in this monograph (Table 5). For comparisons, age-adjustment using ICSS weights was also car-ried out. We first computed the age-specific survival adjusted for case-mix, then the case-mix and age-standardized surviv-al as weighted average of the age-specific case-mix-standard-ized survivals.
QualityintroductionMost cancer registries contributing to this monograph have al-ready published their incidence data in international reports, showing an overall good quality of data.39 Since 2007, AIR-TUM has formalized a set of rules concerning the registration criteria that each Italian cancer registry should adopt;40 these rules incorporate well-established national and international guidelines and standards.41-42 Nevertheless, a series of qual-ity checks were planned to ensure systematic verification of the cancer registration and follow-up procedures adopted by each cancer registry. There are two levels of control in AIRTUM’s centralized da-
standard age groups Weights cancer sites
1 15-44, 45-54, 55-64, 65-75, 75+ 0.07, 0.12, 0.23, 0.29, 0.29 all (except those included in standard 1*, 2, 3, 4)
1* 15-54, 55-64, 65-75, 75+ 0.19, 0.23, 0.29, 0.29 mesothelioma
2 15-44, 45-54, 55-64, 65-75, 75+ 0.28, 0.17, 0.21, 0.20, 0.14 melanoma, cervix uteri, brain and Cns, thyroid
3 15-44, 45-54, 55-64, 65-75, 75+ 0.60, 0.10, 0.10, 0.10, 0.10 testis, hodgkin lymphoma, acute lymphocytic leukaemia
4 15-54, 55-64, 65-74, 75-84, 85+ 0.19, 0.23, 0.29, 0.23, 0.06 prostate
table 4. standard weights used to calculate age-standardized net survival. Modified standard weights are denoted by *.
205_226_AIRTUM_2017.indd 220 26/04/17 10.37
Epidemiol Prev 2017; 41 (2) suppl1. doi: 10.19191/EP17.2S1.P001.017 221 Ulteriori dati disponibili sul sito: www.registri-tumori.it
I TUMORI IN ITALIA RAPPORTO AIRTUM 2016 SOPRAVVIVENZA materiali e metodi
Gli intervalli di confidenza sono stati calcolati dopo tra-sformazione log-log. Pertanto il loro valore è sempre com-preso tra 0 e 100%.La probabilità reale di morte e la speranza di vita dei casi di tumore sono state stimate mediante l’applicazione di mo-delli. Le formule applicate e più dettagliate descrizioni dei metodi sono riportate negli articoli di Lambert e coll.23 e di Andersson e coll.30
AggiustAmento Per LA distribuzione deLLe sediLa sopravvivenza complessiva per tutti i tumori, qui pre-sentata in due forme, come aggregazione di tutte le sedi ad esclusione dei carcinomi cutanei e di tutte le sedi ad esclusione dei tumori della vescica e dei carcinomi cutanei, è solitamente poco considerata dallo specialista in quan-to influenzata dalla distribuzione eterogenea delle sedi ne-oplastiche al suo interno. Per consentire confronti tra po-polazioni o periodi temporali diversi è quindi essenziale calcolare delle stime aggiustate per case-mix in modo da eliminare l’effetto confondente che può insorgere se in una popolazione l’incidenza di un cancro letale fosse più alta che in un’altra.38
Per questo motivo già nella monografia AIRTUM 2011 è stato definito un aggiustamento per sede neoplastica basa-to sulla definizione di pesi ricavati dalla distribuzione del-la casistica 2000-2004.1 La distribuzione dei casi è diversa a seconda del genere e della possibilità di includere o meno i tumori vescicali nella casistica di tutti i tumori. Sono sta-te perciò definite 4 categorie di pesi, ciascuna di esse si ap-plica alle corrispondenti casistiche di tutti i tumori maschi e tutti i tumori femmine, con o senza l’inclusione dei tu-mori della vescica. Tale distribuzione di pesi è stata utiliz-zata anche nella presente monografia per rendere possibi-li confronti con i risultati già pubblicati (Tabella 5). Per i confronti si deve considerare anche la differente distribu-zione per età dei casi. L’aggiustamento per età è stato effet-tuato utilizzando i già menzionati pesi ICSS. Si è procedu-to calcolando la sopravvivenza età-specifica standardizzata per case-mix e, quindi, la sopravvivenza standardizzata per età e case-mix come media pesata delle sopravvivenze età-specifiche standardizzate per case-mix.
QualitàintroduzioneLa maggior parte dei Registri Tumori inclusi nella presen-te monografia ha già pubblicato i propri dati di incidenza in ambito internazionale, mostrando complessivamente un buon livello qualitativo.39 Dal 2007 l’AIRTUM ha forma-lizzato l’insieme delle regole relative ai criteri di registrazio-ne che ogni Registro Tumori italiano deve adottare;40 queste riprendono e integrano regole e standard nazionali ed inter-
tabase. The first, which each registry must address before send-ing data, consists in performing data checks according to the IARCcrgTools software produced by the IARC and verifying the absence of errors and confirming or correcting warnings.43 At the second level, a specific software provided by AIRTUM, CheckAIRTUM (accessible only for members at http://www.registri-tumori.it/cms/it/node/372), is used to compare sin-gle registry data with a gold standard. CheckAIRTUM per-forms 1,431 checks, ranging from mortality/incidence ratio to the proportion of undefined cancer sites. Other specific checks are also performed, such as a number of checks on data consist-ency and completeness according to the AIRTUM accredita-tion procedure. From the point of view of cancer registration methods, the most relevant problem concerns urinary bladder tumours, especial-ly the coding of in situ and uncertain behaviour tumours. Fol-low-up criteria are essentially homogeneous among Italian can-cer registries and call for use of health care databases and death files, with active case finding for all patients lost to follow-up in the municipality archives.44 Unfortunately, certain issues, such as migration for health care, quality of health services, and territorial extension, may affect the accuracy of data and the completeness of follow-up, leading to differences between cancer registries.The overall assessment of both registry and area specific quali-
Males feMales
ALL but skin
ALL but skin And
bLAdder
ALL but skin
ALL but skin And
bLAdder
head and neck 4.1 4.7 - -
stomach 5.2 5.8 4.5 4.6
Colon-rectum 13 14.5 13.3 13.8
liver 4.1 4.5 2.3
Pancreas 2.6 2.9 3.3 3.4
lung 15.9 17.8 5.5 5.7
skin melanoma 2.1 2.3 2.6 2.7
Breast 29.8 30.7
Corpus uteri 4.7 4.8
ovary 3.4 3.5
Prostate 19.5 21.7
Kidney 3.1 3.5
Bladder 10.3 - 3 -
thyroid 3.4 3.5
nhl/Cll 4.2 4.7 4.5 4.6
Myeloma - 1.4
other 15.9 16.2 22 20.4
totAL 100 100 100 100
table 5. Weights used in case-mix adjustment for all cancers but non-melanoma skin cancer and all cancers but non-melanoma skin and bladder cancer.
205_226_AIRTUM_2017.indd 221 26/04/17 10.37
Epidemiol Prev 2017; 41 (2) suppl1. doi: 10.19191/EP17.2S1.P001.017 222 Ulteriori dati disponibili sul sito: www.registri-tumori.it
I TUMORI IN ITALIA RAPPORTO AIRTUM 2016 SOPRAVVIVENZA materiali e metodi
nazionali oramai consolidati.41,42 Tuttavia una serie di con-trolli sono stati pianificati per consentire una verifica ancora più sistematica dei criteri di registrazione e follow-up adot-tati dai diversi Registri Tumori. I dati di incidenza destina-ti alla banca dati sono sottoposti al protocollo operativo che impone due ordini di controllo. Il primo, precedente l’invio dei dati, è a opera del singolo Registro che è tenuto ad effet-tuare i controlli previsti dal programma IARCcrgTools pro-dotto da IARC, verificando l’assenza di errori e certificando che altri avvisi segnalati siano stati verificati e confermati.43 Il secondo avviene a livello della banca dati che provvede a eseguire nuovamente i controlli previsti da IARCcrgTools. Vengono inoltre condotte le verifiche previste da uno speci-fico software prodotto dall’AIRTUM, CheckAIRTUM (ac-cessibile solo per i soci al link http://www.registri-tumori.it/cms/it/node/372), che controlla eventuali difformità dei dati aggregati rispetto a un dato atteso sulla base di un gold standard rappresentato dalla casistica della banca dati, even-tualmente corretto per area geografica. Vengono effettuati complessivamente 1.431 controlli che vanno dal rapporto mortalità/incidenza alla proporzione delle sedi non defini-te. Vengono infine effettuati controlli di congruenza e com-pletezza delle variabili presenti nel tracciato record. I dati di ogni Registro sono quindi stati sottoposti ad alcune verifi-che di qualità previste per la procedura di accreditamento all’AIRTUM.Dal punto di vista delle tecniche di registrazione va ribadi-to che le difformità più rilevanti riguardano la registrazione dei tumori vescicali, specie nella valutazione dei tumori in situ e incerti. La modalità di effettuazione del follow-up è invece sostanzialmente omogenea tra i Registri Tumori ita-liani essendo effettuata tramite le basi dati sanitarie dispo-nibili e le schede di decesso, con ricerca attiva dei casi non rintracciabili presso le anagrafi comunali.44 Fattori come la migrazione sanitaria, l’informatizzazione di fonti sanitarie o anagrafiche, la qualità dell’offerta sanitaria, nonché l’e-stensione del territorio, possono tuttavia influenzare l’ac-curatezza del dato registrato nonché la completezza del fol-low-up, producendo alcune differenze tra Registri Tumori.La valutazione complessiva degli indicatori, per Registro e per area geografica, ha giustificato la decisione di includere tutti i Registri Tumori presenti nella banca dati AIRTUM nell’analisi di sopravvivenza di coorte 2005-2009.
indicAtori di quALitàdco e conferme microscopicheUn tradizionale indicatore di accuratezza e completezza della registrazione è la percentuale di casi individuati solo median-te il certificato di morte (DCO). I DCO possono in parte sottendere un fenomeno di perdita sistematica di casi (in ge-nere a cattiva prognosi, che decedono prima di poter gene-
ty indicators justified the decision to include all Italian cancer registries in the AIRTUM database for at least the cohort sur-vival analysis for the years 2005-2009.
quALitY indicAtorsdco and microscopic verificationsA common indicator for cancer registration accuracy and com-pleteness is the proportion of cases known by death certificate only (DCO). The proportion of DCO cases may indicate some systematic loss of cases (in general those with a bad prognosis, which cause death before they can generate other information in the system) and it may lead to overestimate survival, since DCO cases are not included in the survival analysis.A good indicator of the quality of the documentation availa-ble to the registry is the proportion of microscopic verifications (MV), which should be high. Table 8 shows DCO and MV percentages by site and geographic area.Both the percentage of DCO and microscopically verified cas-es are within an overall threshold of acceptability. In particu-lar, with the exception of a number of sites which by definition group together ill-defined tumours, there are no DCO percent-age values that deserve special attention. For some sites, such as liver and biliary tract, pancreas, brain, and eye, the pro-portion of microscopic verifications is lower, since clinical di-agnostic practice is oriented towards other non-invasive tech-niques in the absence of surgery. Thus, the table must be read comparing the geographic areas by specific cancer site.
other checksTable 9 reports the same indicators by cancer registry for all sites except skin cancer, for the period 2005-2009. The percentage of cases lost to follow-up before 5 years ranges from 0% to 3.4% (overall 0.9%). The percentage of ill-defined sites varies from 1.2% to 3.2% (overall 2.2%). Reported mortality/incidence (M/I) ratio ranges from 46.8% to 56.4%.Other indicators were also calculated, such as the percent-age of deaths within one year for cancers with good progno-sis (breast, thyroid, Hodgkin lymphoma, melanoma, corpus uteri) and the percentage of patients alive after more than 5 years from diagnosis for cancers with poor prognosis (oesopha-gus, liver, biliary tract, pancreas, mesothelioma). The values of both these indicators were adequately small and homogeneous.
continua a pagina 225
205_226_AIRTUM_2017.indd 222 26/04/17 10.37

Epidemiol Prev 2017; 41 (2) suppl1. doi: 10.19191/EP17.2S1.P001.017 223 Ulteriori dati disponibili sul sito: www.registri-tumori.it
materiali e metodiI TUMORI IN ITALIA RAPPORTO AIRTUM 2016 SOPRAVVIVENZA
dco Mv
n-w n-e centre south PooL n-w n-e centre south PooL
lip 0.0 0.3 0.0 0.6 0.3 96.9 98.9 98.2 96.4 97.6
tongue 0.5 0.3 0.0 0.9 0.5 94.9 97.7 93.1 93.1 95.3
Mouth 0.4 0.5 0.7 1.2 0.6 95.6 97.8 91.8 93.9 95.7
salivary glands 0.6 1.1 1.7 0.7 0.9 94.2 93.6 89.0 90.1 92.5
oropharynx 0.3 0.4 0.0 1.2 0.5 96.0 97.3 93.6 90.1 95.4
nasopharynx 0.2 0.3 0.0 0.2 0.2 92.3 94.1 91.2 93.0 92.9
hypopharynx 0.3 0.4 1.4 0.4 0.4 95.4 95.2 97.2 93.3 95.1
Pharynx nos 1.1 1.0 3.4 8.9 3.0 87.7 96.0 72.4 75.8 87.2
oesophagus 1.0 0.5 2.7 2.1 1.1 87.0 89.3 84.4 80.1 86.6
stomach 1.5 1.1 1.3 3.0 1.6 90.4 92.3 89.9 87.4 90.3
small intestine 0.6 0.6 0.4 2.1 0.9 91.0 93.8 92.0 86.1 90.9
Colon 0.8 0.5 0.8 1.6 0.9 93.6 94.8 93.4 90.6 93.3
rectum 0.5 0.2 0.5 0.5 0.4 94.9 95.5 94.3 93.3 94.6
liver 2.8 1.8 2.5 5.0 3.1 42.6 39.9 51.3 29.0 38.6
Biliary tract 1.8 0.9 1.8 2.5 1.8 60.1 59.0 59.0 54.4 57.9
Pancreas 2.8 1.4 2.6 3.9 2.6 48.2 46.0 44.0 41.2 45.6
nasal Cavity 0.4 0.3 0.9 0.8 0.5 93.9 97.5 89.7 90.1 93.8
larynx 0.6 0.5 1.1 1.6 0.9 95.1 97.5 93.3 93.5 95.2
lung 1.6 1.0 1.7 2.7 1.7 71.5 75.2 76.7 70.6 72.8
other thoracic 3.8 2.5 2.5 4.4 3.6 57.3 65.5 66.4 59.2 60.4
Bone 1.6 2.2 2.2 4.4 2.6 85.0 88.8 85.8 75.8 83.4
skin melanoma 0.1 0.1 0.2 0.1 0.1 99.0 99.5 97.0 98.1 98.8
Mesothelioma 0.1 0.0 0.0 0.0 0.1 95.7 88.3 94.4 99.5 94.3
Kaposi sarcoma 0.0 0.7 0.0 0.4 0.3 94.8 96.8 94.2 93.3 94.6
soft tissue 0.6 0.3 0.5 0.5 0.5 93.8 95.6 89.2 93.3 93.8
Breast 0.6 0.4 0.4 1.1 0.6 95.8 98.0 96.9 94.3 96.2
Cervix uteri 0.3 0.3 0.2 0.1 0.2 95.8 98.5 95.7 95.6 96.4
Corpus uteri 0.2 0.2 0.1 0.2 0.2 96.4 97.7 95.8 96.0 96.6
Uterus nos 14.5 5.9 16.4 14.9 11.4 53.7 79.9 44.3 48.6 61.6
ovary 1.4 0.6 0.9 2.1 1.3 86.2 88.1 84.7 81.9 85.4
other females organs 1.7 2.0 1.5 1.2 1.7 89.4 88.8 89.8 89.6 89.3
Penis 0.0 0.0 0.0 0.3 0.1 96.5 98.9 100.0 94.7 96.8
Prostate 0.7 0.6 0.8 2.0 0.9 92.5 94.2 92.7 88.9 92.3
testis 0.1 0.0 0.3 0.1 0.1 95.0 98.2 91.4 93.1 95.0
other male organs 2.1 0.0 0.0 2.1 1.3 80.2 92.8 92.3 91.5 87.1
Kidney etc. 0.8 0.4 1.1 1.2 0.8 84.1 84.0 86.3 81.3 83.8
Urinary bladder 0.5 0.3 0.4 0.8 0.5 94.2 95.7 89.7 92.1 93.6
eye, non melanoma 2.5 4.8 3.7 3.8 3.6 36.1 51.0 44.4 32.6 39.5
Brain and Cns 1.9 0.8 1.6 3.9 2.1 64.3 59.5 58.7 55.3 59.8
thyroid 0.2 0.1 0.0 0.2 0.1 96.1 98.5 94.6 93.8 95.9
other endocrine 3.2 4.3 0.0 3.2 3.3 71.1 73.7 70.6 69.4 71.2
hodgkin lymphoma 0.0 0.1 0.2 0.1 0.1 99.1 99.0 91.5 99.1 98.4
non-hodgkin lymphoma 0.3 0.2 0.4 0.6 0.4 97.6 95.9 91.2 95.5 96.0
Myeloma 0.8 0.7 1.1 1.5 1.0 89.5 92.0 80.6 86.1 88.5
all 0.5 0.3 3.5 0.0 0.5 98.4 96.4 75.3 99.7 96.5
Cll 0.6 0.7 2.0 0.1 0.6 92.6 96.2 78.8 98.5 94.1
aMl 0.2 0.4 1.3 0.5 0.4 96.5 96.0 79.6 98.6 95.4
CMl 0.2 0.9 1.0 0.4 0.5 95.6 96.3 88.1 99.1 96.3
other CMPd and Mds 0.7 1.3 1.8 0.2 0.8 90.5 95.3 72.5 97.2 92.1
leukaemia nos 6.3 5.6 5.2 11.9 8.0 81.9 76.5 56.1 52.8 67.1
Miscellaneous 2.0 7.2 7.1 16.3 7.1 39.9 83.3 55.6 53.7 52.0
ill defined/metastases 7.7 5.0 7.9 9.7 7.3 44.4 53.1 42.0 40.0 46.1
eye, melanoma 0.0 0.0 0.0 0.6 0.1 71.5 57.0 83.0 65.2 66.1all but skin, non melanoma 1.1 0.7 1.1 1.9 1.2 85.8 87.5 85.7 82.8 85.6
table 6. Percentage of dCo and microscopically verified cases (MV) for cases diagnosed from 2005 through 2009 for the north-east (n-e), north-West (n-W), Centre, south of italy, and pool of airtUM cancer registries.
205_226_AIRTUM_2017.indd 223 26/04/17 10.37

Epidemiol Prev 2017; 41 (2) suppl1. doi: 10.19191/EP17.2S1.P001.017 224 Ulteriori dati disponibili sul sito: www.registri-tumori.it
I TUMORI IN ITALIA RAPPORTO AIRTUM 2016 SOPRAVVIVENZA materiali e metodi
registry records (n)
dco (%)
Mv (%)
M/i (%)
lost <5 years (%)
ill defined (%)
dead <1 year (%)
alive>5 years (%)
1 Bergamo 19,677 1.0 86.9 50.5 0.4 1.9 6.3 10.7
2 Biella-Vercelli 11,156 1.4 85.3 54.2 1.0 2.3 7.9 5.7
3 Brescia 26,894 1.5 75.1 51.9 0.4 2.4 5.6 9.7
4 Como 17,611 1.0 88.2 51.4 0.6 2.0 5.9 6.2
5 Cremona 12,393 0.9 84.8 54.8 0.2 1.9 6.4 8.0
6 Genova 34,044 1.2 84.7 56.0 0.0 2.3 6.1 4.3
7 lodi 7,272 0.8 83.7 54.4 0.7 1.9 6.9 9.3
8 Mantova 13,366 1.3 87.9 52.3 0.5 1.6 5.0 5.1
9 Milano 46,888 1.1 87.7 50.5 2.3 1.9 6.1 9.3
10 Milano 1 27,115 0.9 90.0 46.8 0.2 1.3 5.0 12.2
11 Monza e Brianza 15,371 1.1 86.7 47.4 0.7 1.8 5.5 6.4
12 Pavia 18,663 0.8 82.1 56.4 1.0 2.4 6.9 8.6
13 Piacenza 8,591 1.1 84.5 52.8 2.7 2.6 5.0 7.2
14 sondrio 5,660 0.3 85.5 55.2 0.4 2.7 5.8 7.9
15 torino 31,185 1.3 88.8 51.7 1.8 1.8 5.9 8.3
16 Varese 26,502 0.8 87.7 51.2 0.6 2.3 6.2 7.5
17 alto adige 13,355 1.0 90.7 50.0 0.0 2.0 5.7 6.7
18 Ferrara 15,393 0.9 85.9 54.4 0.8 2.2 5.8 5.5
19 Friuli Venezia Giulia 44,395 0.6 88.8 53.6 0.4 2.9 6.4 4.7
20 Modena 23,165 0.3 90.4 48.2 1.4 2.2 4.2 5.5
21 Parma 15,814 0.3 89.2 54.6 1.2 2.2 5.3 8.4
22 reggio emilia 15,890 0.3 87.7 51.1 0.9 2.1 5.2 5.6
23 romagna 43,924 1.1 86.9 50.8 0.1 2.3 5.1 5.1
24 trento 13,517 0.8 88.8 53.7 0.7 3.2 7.0 7.2
25 Veneto 73,920 0.9 87.3 51.0 0.4 2.3 5.4 7.5
26 Firenze Prato 31,989 0.9 82.5 51.9 1.4 2.4 5.1 7.2
27 latina 13,493 1.3 82.3 51.3 3.2 2.3 4.0 7.3
28 Umbria 28,887 1.3 90.8 54.4 0.3 1.2 6.0 6.5
29 Barletta 7,175 1.5 83.4 51.8 0.9 1.9 5.7 6.7
30 Brindisi 6,038 1.9 84.3 52.8 2.0 1.7 5.5 5.8
31 Catania-Messina-enna 45,218 1.4 82.8 51.8 1.8 2.1 5.2 4.8
32 Catanzaro 7,677 1.0 84.3 51.2 0.6 2.3 5.6 7.3
33 lecce 16,845 2.1 83.3 54.5 1.8 1.4 5.4 7.2
34 napoli 17,357 1.1 85.2 53.9 1.1 2.2 4.5 10.4
35 nuoro 5,597 1.1 83.5 53.5 0.0 1.4 5.4 7.4
36 Palermo 28,646 2.7 80.5 54.9 0.2 2.3 5.7 8.7
37 ragusa-Caltanissetta 10,939 2.1 82.2 54.6 0.4 2.5 5.4 6.0
38 salerno 23,864 2.5 80.7 51.3 3.4 2.0 6.4 6.8
39 sassari 12,118 2.8 85.2 54.5 0.0 2.6 6.8 6.5
40 siracusa 9,074 2.3 81.6 55.3 2.1 2.2 6.4 8.0
41 taranto 11,959 1.7 86.1 51.8 2.0 2.6 4.6 7.0
42 trapani 9,559 1.1 82.6 56.1 0.2 2.9 6.6 4.8
totAL 868,196 1.2 85.8 52.2 0.9 2.2 5.7 7.3
table 7. Quality indexes by cancer registry for cases diagnosed from 2005 through 2009.
205_226_AIRTUM_2017.indd 224 26/04/17 10.37

Epidemiol Prev 2017; 41 (2) suppl1. doi: 10.19191/EP17.2S1.P001.017 225 Ulteriori dati disponibili sul sito: www.registri-tumori.it
I TUMORI IN ITALIA RAPPORTO AIRTUM 2016 SOPRAVVIVENZA materiali e metodi
rare altre informazioni all’interno del sistema), che può plau-sibilmente portare a una sovrastima della sopravvivenza in quanto la casistica DCO viene esclusa dall’analisi.Un buon indicatore della qualità della documentazione a disposizione dei Registri è invece dato dalla proporzione di verifiche microscopiche (MV) che è bene mostri valori ele-vati. In Tabella 8 sono elencate le percentuali di casi DCO e MV per sede e ripartizione geografica.Si osserva come sia le percentuali di casi DCO sia le per-centuali di casi con verifica microscopica si mantengono per la totalità dei casi all’interno di una soglia complessi-va d’accettabilità, essendo per i DCO ben al di sotto del 5% (minimo 0,7% per il Centro Italia, massimo 1,9% per il Sud Italia) e per le verifiche microscopiche superio-re all’80% (minimo 82,8% per il Sud Italia, massimo 87,5 per il Nord-Est). In particolare, ad esclusione di alcune sedi che raccolgono per definizione neoplasie mal definite, non si osservano valori della proporzione di casi DCO degni di particolare attenzione. Per alcune sedi quali fegato e vie bi-liari, pancreas, encefalo e occhio, la proporzione di verifi-che microscopiche è più bassa (generalmente inferiore al 60%) poiché in assenza d’intervento chirurgico la pratica clinica diagnostica si è orientata verso altre tecniche non invasive. In generale, quindi, la tabella dovrà essere letta confrontando le ripartizioni geografiche per sede specifi-ca del tumore.
Altri controlliIn Tabella 9 vengono mostrati gli stessi indicatori per cia-scuno dei 42 Registri Tumori, riferiti al totale delle sedi a esclusione dei carcinomi della cute nel periodo 2005-2009. La percentuale di casi persi al follow-up prima di 5 anni varia da 0% al 3,4% (valore globale 0,9%). La percentua-le di casi in sede mal definita è compresa tra 1,2% e 3,2% (globale 2,2%) e il valore del rapporto mortalità/inciden-za (M/I) è compreso tra 46,8% e 56,4% (globale 52,2%).Sono inoltre stati calcolati indicatori quali la percen-tuale di decessi entro l’anno per diagnosi a buona pro-gnosi (mammella, tiroide, linfoma di Hodgkin, mela-noma, corpo uterino) e la percentuale dei sopravviventi oltre 5 anni dalla diagnosi per i tumori a cattiva progno-si (esofago, fegato, vie biliari, pancreas, mesotelioma). Entrambi questi indicatori sono risultati adeguatamente contenuti e omogenei.
bibliografia/ references1. airtUM Working Group. italian cancer figures, report 2011: survival of cancer pa-
tients in italy. epidemiol Prev 2011;35(5-6 suppl 3):1-200.2. Fritz a, Percy C, Jack a, shanmugaratman K, sobin l, Parkin dM, Whelan s, (eds). in-
ternational classification of disease for oncology. third edition, World health orga-nization, Geneva 2000.
3. Brenner h, hakulinen t. Patients with previous cancer should not be excluded in in-ternational comparative cancer survival studies. int J Cancer 2007;121:2274-78.
4. rosso s, de angelis r, Ciccolallo l, et al. Multiple tumours in survival estimates. eur J Cancer 2009;45:1080-94.
5. Patriarca s, Gafà l, Ferretti s, et al. Coding criteria of bladder cancer: effects on esti-mating survival. epidemiol Prev 2001;25(3 suppl):42-7.
6. Mariotto aB, noone aM, howlader nh, Cho h, Keel Ge, Garshell J, Woloshin s, and schwartz lM. Cancer survival: an overview of Measures, Uses, and interpretation. J natl Cancer inst Monogr 2014; 2014(49):145-86.
7. tsiatis a. Competing risks. 2nd ed. Wiley. P. armitage and t. Colton, 2005. Pp. 1025-35.
8. Perme MP, stare J, estève J. on estimation in relative survival. Biometrics 2012;68(1):113-20.
9. dickman PW, Coviello e. estimating and modelling relative survival. the stata Journal 2015;15:186–215.
10. Corazziari i, Quinn M, Capocaccia r. standard cancer patient population for age standardising survival ratios. eur J Cancer 2004;40(15):2307-16.
11. ederer F, heise h. instructions to iBM 650 programmers in processing survival com-putations. Methodological note no. 10, end results evaluation section, national Cancer institute, Bethesda Md, 1959.
12. danieli, C., l. remontet, n. Bossard, l. roche, and a. Belot. estimating net survival: the importance of allowing for informative censoring. stat Med 2012;31(8):775-786.
13. seppä K, hakulinen t, Pokhrel a. Choosing the net survival method for cancer survi-val estimation. eur J Cancer. 2015 Jun;51(9):1123-29.
14. lambert PC, dickman PW, rutherford MJ. Comparison of different approaches to estimating age standardized net survival. BMC Med res Methodol. 2015;15:64.
15. dickman PW, lambert PC, Coviello e, rutherford MJ. estimating net survival in po-pulation-based cancer studies. int J Cancer 2013;133:519-21.
16. Quaresma M, Coleman MP, rachet B. Funnel plots for population-based cancer sur-vival: principles, methods and applications. stat Med 2014; 33(6):1070-80.
17. Mohammed Ma, deeks JJ. in the context of performance monitoring, the caterpil-lar plot should be mothballed in favor of the funnel plot. ann thorac surg 2008; 86(1):348
18. spiegelhalter dJ. Funnel plots for comparing institutional performance. statistics in Medicine 2005;24:1185-202.
19. spiegelhalter dJ, sherlaw-Johnson C, Bardsley M, Blunt i, Wood C, Grigg o. statisti-cal methods for healthcare regulation: rating, screening and surveillance. J r statist soc a 2012;175, Part 1, pp. 1-47.
20. Coviello V, Boggess M. Cumulative incidence estimation in the presence of compe-ting risks. the stata Journal 2004;4:103-12.
21. Putter h, Fiocco M, Geskus rB. tutorial in biostatistics: competing risks and multi-state models. stat Med 2007; 26:2389-430.
22. Cronin Ka, Feuer eJ. Cumulative cause-specific mortality for cancer patients in the pre-sence of other causes: a crude analogue of relative survival. stat Med 2000;19:1729-40.
23. lambert PC, dickman PW, nelson CP, royston P. estimating the crude probability of death due to cancer and other causes using relative survival models. stat Med 2010; 29: 885-95.
24. royston P, lambert PC. Flexible parametric survival analysis using stata: Beyond Cox model. stata Press, 2011.
25. Brenner, h., and o. Gefeller. an alternative approach to monitoring cancer patient survival. Cancer 1996;78:2004-10.
26. Brenner, h., and B. rachet. hybrid analysis for up-to-date long-term survival ra-tes in cancer registries with delayed recording of incident cases. eur J Cancer 2004;40(16):2494-501.
27. talback M, stenbeck M, rosén M. Up-to-date long-term survival of cancer patients: an evaluation of period analysis on swedish Cancer registry data. eur J Cancer 2004;40:1361-72.
28. talback M, dickman PW. Predicting the survival of cancer patients recently dia-gnosed in sweden and an evaluation of predictions published in 2004. acta oncol 2012;51:17-27.
29. skuladottir h, olsen Jh. Conditional survival of patients with the four major histo-logic subgroups of lung cancer in denmark. J Clin oncol 2003; 21(16):3035-40.
continua da pagina 222
205_226_AIRTUM_2017.indd 225 26/04/17 10.37

Epidemiol Prev 2017; 41 (2) suppl1. doi: 10.19191/EP17.2S1.P001.017 226 Ulteriori dati disponibili sul sito: www.registri-tumori.it
I TUMORI IN ITALIA RAPPORTO AIRTUM 2016 SOPRAVVIVENZA
30. andersson tMl, dickman PW, eloranta s, lambe M, lambert PC. estimating the loss in expectation of life due to cancer using flexible parametric survival models. stati-stics in Medicine 2013;32:5286-300.
31. istituto nazionale di statistica. il futuro demografico del Paese: previsioni regionali della popolazione residente al 2065. http://www.istat.it/it/archivio/48875, 2011.
32. andersson tM, dickman PW, eloranta s, sjövall a, lambe M5,6, lambert PC. the loss in expectation of life after colon cancer: a population-based study. BMC Can-cer 2015;15:412-21.
33. Baade Pd, Youlden dr, andersson tM-l, Youl Ph, Kimlin MG, aitken JF, Biggar rJ. estimating the change in life expectancy after a diagnosis of cancer among the australian population. BMJ open 2015;5:e006740. doi:10.1136/bmjo-pen-2014-006740.
34. Capocaccia r, Gatta G, dal Maso l. life expectancy of colon, breast, and testicular cancer patients: an analysis of Us_seer population-based data. annals of onco-logy 2015; 26:1263-68.
35. Coviello e, dickman PW, seppä K, Pokhrel a. estimating net survival using a life ta-ble approach. the stata Journal 2015;15:173-18.
36. de angelis r, Francisci s, Baili P, Marchesi F, roazzi P, Belot a, Crocetti e, Pury P, Knijn a, Coleman M, Capocaccia r; eUroCare Working Group. the eUroCare-4 database on cancer survival in europe: data standardisation, quality control and methods of statistical analysis. eur J Cancer 2009;45(6):909-30.
37. rossi s, Baili P, Capocaccia r, Caldora M, Carrani e, Minicozzi P, Pierannunzio d, santaquilani M, trama a, allemani C, Belot a, Buzzoni C, lorez M, de angelis r; eU-roCare-5 Working Group. the eUroCare-5 study on cancer survival in europe 1999-2007: database, quality checks and statistical analysis methods. eur J Cancer 2015; 51: 2104-19.
38. Verdecchia a, Baili P, Quaglia a, Kunkler i, Ciampichini r, Berrino F, et al. Patient sur-vival for all cancers combined as indicator of cancer control in europe. eur J Public health 2008;18:527-32.
39. Bray F, Kohler B, Ferlay J. data comparability and quality in: Forman d, Bray F, Brew-ster dh, Gombe Mbalawa C, Kohler B, Piñeros M, steliarova-Foucher e, swamina-than r, Ferlay J (eds). Cancer incidence in Five Continents, Vol. X. iarC sci Publ. 2014;164:89-106.
40. Ferretti s. Giacomin a. Gruppo di lavoro airtUM (eds). Manuale di tecniche di re-gistrazione dei tumori. inferenze, Milano, 2007.
41. Jensen oM, Parkin dM, Maclennan r, Muir Cs, skeet rG (eds). Cancer registration Principles and Methods. iarC scientific Publication no 95, lyon, 1991.
42. tyczynski Je, démaret e, Parkin dM. standards and Guidelines for Cancer registra-tion in europe. iarC technical Publication no. 40, lyon, 2003.
43. Ferlay J, Burkhard C, Whelan s, Parkin dM. Check and conversion programs for can-cer registries (iarC/iaCr tools for Cancer registries). iarC technical report no. 42. lyon, 2005.
44. Ferretti s, Federico M, Contiero P, stracci F. Comparability issues of survival data. epidemiol Prev 2001; 25(3 suppl):37-41.
205_226_AIRTUM_2017.indd 226 26/04/17 10.37