Embed Size (px)
Citation preview

Material Substitutes to Address Marine Plastic Pollution and
Support a Circular Economy: Issues and Options for Trade Policymakers
U N I T E D N AT I O N S C O N F E R E N C E O N T R A D E A N D D E V E L O P M E N T
ii
UNCTAD/DITC/TED/INF/2021/5
© 2021, United Nations Conference on Trade and Development
The designations employed and the presentation of material on any map in this work do not imply the expression of any opinion whatsoever on the part of the United Nations concerning the legal status of any country, territory, city or area or of its authorities, or concerning the delimitation of its frontiers or boundaries.
This publication has not been formally edited.

iiiISSUES AND OPTIONS FOR TRADE POLICYMAKERS
Contents
Acknowledgements .............................................................................................................................. vAcronyms and abbreviations ............................................................................................................... v
Executive summary ................................................................................................... vi
1. INTRODUCTION .................................................................................................. 1
2. CATEGORIZATION OF PLASTIC SUBSTITUTES .......................................................... 3
3. PLASTIC ALTERNATIVES AND SUBSTITUTES: EVALUATING RELATIVE MERITS AND DRAWBACKS .................................................................................................... 5
a) Impacts on natural environment and human, animal and plant health upon disposal ..................... 6b) Durability and functionality for desired end-uses ............................................................................ 8c) Environmental and social impacts of production and economic feasibility ...................................... 8d) Sustainable development opportunities for developing countries ................................................. 10
4. PRELIMINARY ASSESSMENT OF MARKET AND TRADE-RELATED TRENDS ............... 114.1. Evaluation of global markets and trade for JACKS fibres ......................................................... 114.2. Evaluation of trade flows in cellulose and synthetic polymer-based packaging material ....... 134.3. Evaluation of trade flows of a bio-based polymer – PLA .......................................................... 16
5. TRADE POLICY MEASURES AFFECTING ALTERNATIVE PLASTICS AND NON-PLASTIC SUBSTITUTES ................................................................................................... 20
5.1. Import tariffs on JACKS fibres and derived goods .................................................................... 205.2. Import tariffs on packaging material of conventional polymers, paper and cellulosic and PLA ... 215.3. Non-tariff measures affecting non-plastic substitutes ............................................................. 21
6. TRADE POLICY INITIATIVES TO SUPPORT PLASTIC SUBSTITUTES: FROM EARLY HARVESTS TO A LONG-TERM GAME PLAN ........................................................... 23
6.1. Options for liberalization ............................................................................................................. 236.1.1. Unilateral trade policy action ................................................................................................. 236.1.2. Trade agreements to fast-track liberalization of environmental goods and services ................ 246.1.3. Multilateral agreement on environmental goods under the WTO ............................................ 25
6.2. Other trade-related measures .................................................................................................... 266.2.1. Greater clarity and visibility of conventional plastic substitutes within the Harmonized System ..266.2.2. Trade and investment-related initiatives on plastics recovery, recycling and compositing ....... 266.2.3. Attracting foreign investment for plastic substitutes ............................................................... 286.2.4. Technical and technology co-operation, assistance and capacity building measures ............. 28
7. CONCLUSION AND RESEARCH GAPS .................................................................. 29
ANNEX ................................................................................................................. 33
References .......................................................................................................................................... 31Endnotes ............................................................................................................................................. 44
iv MATERIAL SUBSTITUTES TO ADDRESS MARINE PLASTIC POLLUTION AND SUPPORT A CIRCULAR ECONOMY:
FiguresFigure 1. Conventional polymers and illustrative list of potential substitutes .................................................... 4Figure 2. Biodegradable and non-biodegradable polymers with examples ..................................................... 5Figure 3. World JACKS production, 2007–2017 ........................................................................................... 11Figure 4. Top ten global exporters of HS 392310, 2015–2019 ..................................................................... 14Figure 5. Top ten global importers of HS 392310, 2015–2019 ..................................................................... 14Figure 6. Top ten global exporters of HS 392321, 2015–2019 ..................................................................... 15Figure 7. Top ten global importers of HS 392321, 2015–2019 ..................................................................... 15Figure 8. Top ten global exporters of HS 392329, 2015–2019 ..................................................................... 16Figure 9. Top ten global importers of HS 392329, 2015–2019 ..................................................................... 16Figure 10. Top ten global exporters of HS 4819, 2015–2019 ......................................................................... 17Figure 11. Top ten global importers of HS 4819, 2015–2019 ......................................................................... 17
TablesTable 1. Illustrative definitions of degradation, biodegradation and compostable ........................................... 5Table 2. Global substitution potential of plastic in 2040 for six plastic subcategories ..................................... 9Table 3. Top producers, exporters and importers of JACKS fibres ............................................................. 12Table 4. Top ten global exporters of HS 390770 polylactic acid in primary forms, 2015–2019 ........................18Table 5. Top ten global importers of HS 390770 polylactic acid in primary forms, 2015–2019 ..................... 18
Table A1. Plant-based materials, polymer(s), plant source and common uses: biodegradable and composting properties .............................................................................................................. 33
Table A2. Animal-based materials, polymer(s), animal source and common uses: qualitative biodegradable and composting properties ............................................................................... 34
Table A3. Starch-based polymers, biomass source and common uses: biodegradable and composting properties .............................................................................................................. 34
Table A4. Starch-based polymers, biomass source and common uses: qualitative assessment of worst-case biodegradable and composting properties .............................................................. 35
Table A5. Qualitative indicators of sustainability for the production of textiles and other products from biomass sources, from harvesting to the manufacturer ..................................................... 35
Table A6. Qualitative indicators of sustainability for the production of textiles and other products from biomass sources during manufacture ................................................................. 36
Table A7. Qualitative indicators of sustainability for the production of textiles and other products from biomass sources during use and at the end-of-life ........................................................... 36
Table A8. Bound and applied MFN tariffs (per cent) on jacks fibres and select manufactured goods in key markets ............................................................................................................... 37
Table A9. Bound and average of applied MFN tariffs in key markets ............................................................. 38Table A10. ASEAN and nonASEAN FTAs/RTAs with positive list for services sectors ..................................... 39Table A11. ASEAN and nonASEAN FTAs/RTAs with negative list for services sectors .................................... 39Table A12. Assessing the uptake and integration of circular economy in the European Union FTAs ................. 40Table A13. Summary of countries that have announced imminent action on plastic bags and
Styrofoam products .................................................................................................................. 43
BoxesBox 1. Biodegradability and composting standards ................................................................................... 6Box 2. Case examples of production and use of natural materials and bio-based
polymers to replace conventional polymers .............................................................................................. 7
vISSUES AND OPTIONS FOR TRADE POLICYMAKERS
Acronyms and abbreviationsAPEC Asia-Pacific Economic CooperationASEAN Association of Southeast Asian NationsASTM ASTM International (former American Society for Testing and Materials)DIN Deutsches Institut für NormungEEP environmentally preferable productEGA environmental goods agreementFAO Food and Agriculture Organization of the United NationsFTA free trade agreementGATS general agreement on trade in servicesGATT general agreement on tariffs and trade GHG greenhouse gasGSP Generalized System of PreferencesGSTP Global System of Trade PreferencesHFJU Intergovernmental Group on Jute, Kenaf and Allied FibresHS Harmonized SystemISO International Organization for StandardizationITC International Trade CentreJACKS jute, abaca, coir, kenaf and sisalLDC least developed countryLDPE low-density polyethyleneMFN most favoured nationOECD Organization for Economic Cooperation and DevelopmentPBAT poly (butylene adipate-co-terephthalate)PHA polyhydroxyalkanoatesPLA polylactic acidREACH registration, evaluation, authorisation and restriction of chemicalsRTA regional trade agreementSDG sustainable development goalSNIS Swiss Network of International StudiesSPS sanitary and phytosanitary measuresTiSA Trade in Services AgreementUNCTAD United Nations Conference on Trade and DevelopmentUNEP United Nations Environment ProgrammeVAT value added taxWCO World Customs Organization WTO World Trade Organization
AcknowledgementsThe United Nations Conference on Trade and Development (UNCTAD) is grateful to Mahesh Sugathan, Senior Policy Adviser at the Forum on Trade, Environment and the SDGs (TESS) and a lead consultant at the Graduate Institute of International and Development Studies’ Global Governance Centre. Sugathan’s research for this paper occurred in the context of a wider project entitled “Transforming the Global Plastics Economy”, implemented in partnership with UNCTAD, which has received support from The Pew Charitable Trusts and the Swiss Network of International Studies (SNIS).
The research was conducted under the guidance and with inputs by David Vivas Eugui, Legal Officer; Henrique Pacini, Economic Affairs Officer; and Claudia Contreras Economic Affairs Officer all at the UNCTAD Secretariat. The author would like to acknowledge the comments and inputs from Carolyn Deere Birkbeck from the Graduate Institute of International Studies and Kate Williams, Kevin He, Margaret Murphy and Sarah Baulch from The Pew Charitable Trusts. Desktop formatting was done by Rafe Dent, UNCTAD
16 September 2021
vi MATERIAL SUBSTITUTES TO ADDRESS MARINE PLASTIC POLLUTION AND SUPPORT A CIRCULAR ECONOMY:
Executive summary
The growing challenge of plastic waste worldwide, including its impact on vulnerable marine and terrestrial eco-systems, has spurred the quest for viable alternatives to replace plastic as part of a range of solutions to deal with the crisis. This is challenging given some of the inherent flexibility, versatility and low production costs of plastics. Techno-economic factors and evaluation of health and environmental including overall life-cycle impacts will determine whether substitution of plastic would be preferable to other solutions (such as better waste collection and disposal). Particularly problematic plastic pollution sources such as single-use plastic bags and other items are areas where substitution would be highly desirable.
Substitutes for plastic can be broadly categorized into two. Traditional materials are based on naturally occurring polymers of plant and animal origin as well as non-renewable mineral substances found in nature. On the other hand, bio-based polymers are derived from natural polymers, but undergo extensive physical, chemical and abiotic transformations. Many bio-based polymers are only compostable under specific industrial composting conditions and, for this reason, are not a solution in places where such facilities are few or non-existent, particularly in developing countries. Developing countries could, therefore, explore various traditional materials where they may already enjoy inherent production and export-related advantages as substitutes for plastic. Many natural fibres and value-added products, particularly jute, abaca, coir, kenaf and sisal (JACKS fibres), for example, are produced and exported by several developing countries thereby benefiting smallholder farmers. Others include widespread traditional materials that are biodegradable such as bamboo and cotton as well as mineral-based ones such as glass and aluminum that can be easily recycled.
Trade policy initiatives such as lowering tariffs and non-tariff barriers for plastic substitutes such as JACKS fibres could provide incentives for scaling-up their production and deployment. Import tariffs on value-added products are often high in many large developing countries, and hence lowering them could encourage greater South–South trade in plastic substitutes. Such market access initiatives could be pursued unilaterally, bilaterally, regionally, plurilaterally as well as multilaterally under the World Trade Organization (WTO) through liberalization initiatives including as part of a broader environmental goods liberalization package such as an Environmental Goods Agreement (EGA). At the same time, given that many developing countries are also major exporters of conventional plastic materials, consideration should be given to economic and livelihood impacts in these sectors. Addressing fossil-fuel subsidies that keep prices of plastic low would also help in the uptake of substitutes.
Other trade-related supportive initiatives for the scale-up and diffusion of environmental-friendly plastic substitutes include: (i) reviewing and amending the Harmonised System (HS) to enable their greater visibility; (ii) pursuing trade and investment initiatives related to end-of-life management and disposal of both conventional plastics as well as substitutes; (iii) attracting foreign investment in the plastic substitutes sector particularly in developing countries; and (iv) pursuing technical and technology co-operation, assistance and capacity building measures to build supply-side capacities and introducing appropriate regulatory frameworks. All these measures are essential building blocks in the creation of a circular economy.
1ISSUES AND OPTIONS FOR TRADE POLICYMAKERS
1. INTRODUCTION
Plastics are ubiquitous in modern life. They are used in a vast diversity of products, ranging from consumer durables such as televisions, toys and clothes, to construction materials, vehicles, clothing and packaging for food and beverages (Barrowclough and Birkbeck, 2020). In addition to health end-uses, such as protective clothing against infectious viruses and for various single-use medical devices, plastics are deployed for a range of environmental end-uses, including the use of plastic sheets to prevent soil erosion or leaching of chemicals from waste sites. Plastics are also used to preserve food, helping to reduce food-waste, and they can help reduce fuel consumption over long distances when used as lightweight materials for vehicles or transportation containers (OECD, 2018). In many markets, plastics have displaced traditional materials such as metal, wood, concrete paper, natural fibres and glass due to their versatility and useful properties, including high strength-to-weight ratio, high malleability into a diversity of shapes, impermeability to liquids, insulation properties and resistance to physical and chemical degradation and, critically, their relatively low cost (OECD, 2018).
However, the negative environmental impact of plastic pollution, especially in the world’s oceans, is widely recognized and acknowledged. To date, the focus of efforts to reduce plastic pollution has been largely on minimizing marine pollution as well as on ‘end of life’ disposal and clean-up solutions. There is, however, growing recognition of the need to focus on upstream part of the plastics life cycle, including measures to reduce production and use of conventional polymers.
The United Nations Sustainable Development Goals (SDGs), 2015 provide a broader mandate for efforts to tackle plastics pollution (United Nations, 2015). SDG 12 calls for efforts to “ensure sustainable production and consumption.” SDG Target 12.4 sets the goal by 2020 to “...achieve the environmentally sound management of chemicals and all wastes throughout their life cycle, in accordance with agreed international frameworks, and significantly reduce their release to air, water and soil in order to minimize their adverse impacts on human health and the environment…” This target continues to be relevant today. SDG Target 12.5 sets the goal by 2030 to “...substantially reduce waste generation through prevention, reduction, recycling and reuse.” In addition, SDG 14 calls upon countries
to “conserve and sustainably use the oceans, seas and marine resources” for sustainable development. SDG Target 14.1 aims by 2025 to “... prevent and significantly reduce marine pollution of all kinds, in particular from land-based activities, including marine debris and nutrient pollution…”
Some attention was paid to the plastics pollution aspect as part of the 2017 Declaration of the United Nations Ocean Conference Our Ocean, Our Future: Call for Action (UNGA, 2017). The Declaration makes reference to the need to address consumption patterns and their impact on marine pollution, including mentioning plastics and micro-plastics. Among others, it also called on countries to: (i) “promote waste prevention and minimization, develop sustainable consumption and production patterns, adopt the 3Rs – reduce, reuse and recycle – including through incentivizing market-based solutions to reduce waste and its generation, improving mechanisms for environmentally-sound waste management, disposal and recycling, and developing substitutes such as reusable or recyclable products, or products biodegradable under natural conditions; and (ii) Implement long-term and robust strategies to reduce the use of plastics and micro plastics, particularly plastic bags and single use plastic.”
Recognizing both the advantages of plastics as well as the negative environmental impacts linked to the production, use and disposal of plastics, two essential questions to ask are:
a. is the use of plastics for a particular application useful, justified and appropriate?
b. is the use of plastic for a particular application useful and convenient, but inappropriate?
Plastic substitutes are best developed in cases where the answer is affirmative in the case of (b) (UNEP, 2017).
This paper explores options that exist to promote plastic substitutes along with the issues, challenges and considerations that policymakers are likely to face, particularly from a trade and sustainable development perspective. Section II provides a categorization of the plastic substitutes. Section III explores conceptual and definitional issues, particularly around the concept of biodegradability, and sets out some key criteria that could be used to evaluate the merits and demerits of various types of plastic substitutes. Section IV provides a preliminary assessment of market and trade-related trends in selected examples of plastic substitutes
2 MATERIAL SUBSTITUTES TO ADDRESS MARINE PLASTIC POLLUTION AND SUPPORT A CIRCULAR ECONOMY:
with an emphasis on natural fibres of export interest
to developing countries. Section V examines some
of the main tariff and non-tariff measures affecting
market access for select plastic substitutes. Section
VI explores what could be some short, medium, and
long-term trade policy initiatives that could be pursued
to support the scale-up of plastic substitutes, as well as some additional considerations for policymakers as catalysts for trade-led action. Section VII concludes the discussion with some observations and also identifies a few knowledge gaps that might need to be addressed in future so as to constructively inform policymaking initiatives on plastic substitutes.
3ISSUES AND OPTIONS FOR TRADE POLICYMAKERS
2. CATEGORIZATION OF PLASTIC SUBSTITUTES
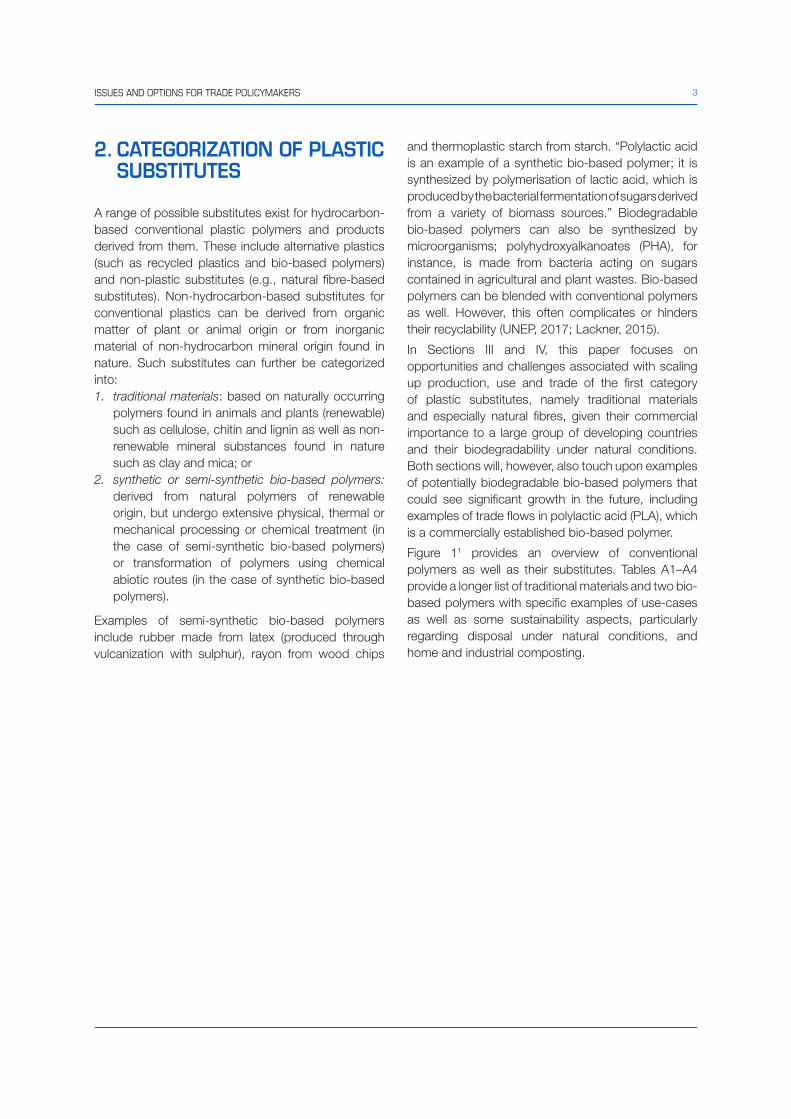
A range of possible substitutes exist for hydrocarbon-based conventional plastic polymers and products derived from them. These include alternative plastics (such as recycled plastics and bio-based polymers) and non-plastic substitutes (e.g., natural fibre-based substitutes). Non-hydrocarbon-based substitutes for conventional plastics can be derived from organic matter of plant or animal origin or from inorganic material of non-hydrocarbon mineral origin found in nature. Such substitutes can further be categorized into: 1. traditional materials: based on naturally occurring
polymers found in animals and plants (renewable) such as cellulose, chitin and lignin as well as non-renewable mineral substances found in nature such as clay and mica; or
2. synthetic or semi-synthetic bio-based polymers: derived from natural polymers of renewable origin, but undergo extensive physical, thermal or mechanical processing or chemical treatment (in the case of semi-synthetic bio-based polymers) or transformation of polymers using chemical abiotic routes (in the case of synthetic bio-based polymers).
Examples of semi-synthetic bio-based polymers include rubber made from latex (produced through vulcanization with sulphur), rayon from wood chips
and thermoplastic starch from starch. “Polylactic acid is an example of a synthetic bio-based polymer; it is synthesized by polymerisation of lactic acid, which is produced by the bacterial fermentation of sugars derived from a variety of biomass sources.” Biodegradable bio-based polymers can also be synthesized by microorganisms; polyhydroxyalkanoates (PHA), for instance, is made from bacteria acting on sugars contained in agricultural and plant wastes. Bio-based polymers can be blended with conventional polymers as well. However, this often complicates or hinders their recyclability (UNEP, 2017; Lackner, 2015).
In Sections III and IV, this paper focuses on opportunities and challenges associated with scaling up production, use and trade of the first category of plastic substitutes, namely traditional materials and especially natural fibres, given their commercial importance to a large group of developing countries and their biodegradability under natural conditions. Both sections will, however, also touch upon examples of potentially biodegradable bio-based polymers that could see significant growth in the future, including examples of trade flows in polylactic acid (PLA), which is a commercially established bio-based polymer.
Figure 11 provides an overview of conventional polymers as well as their substitutes. Tables A1–A4 provide a longer list of traditional materials and two bio-based polymers with specific examples of use-cases as well as some sustainability aspects, particularly regarding disposal under natural conditions, and home and industrial composting.
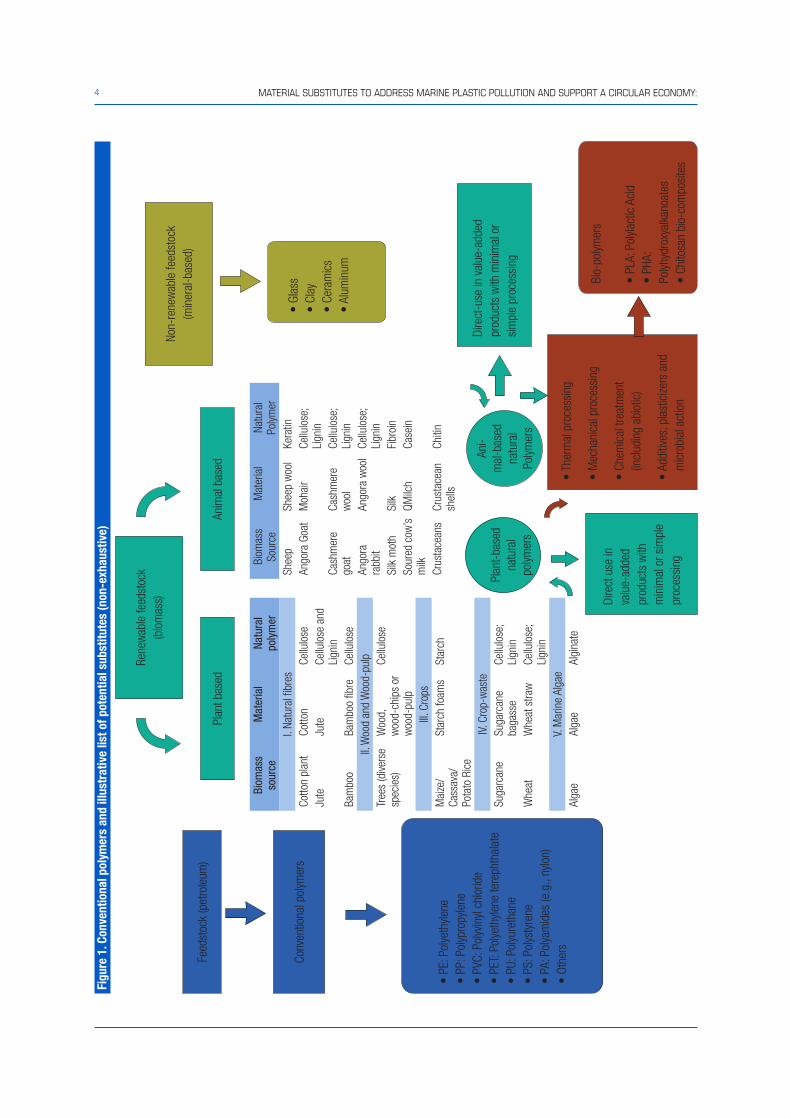
4 MATERIAL SUBSTITUTES TO ADDRESS MARINE PLASTIC POLLUTION AND SUPPORT A CIRCULAR ECONOMY:
Feed
stoc
k (p
etro
leum
)
Rene
wab
le fe
edst
ock
(bio
mas
s)
Plan
t bas
edAn
imal
bas
ed
Dire
ct-u
se in
val
ue-a
dded
pr
oduc
ts w
ith m
inim
al o
r si
mpl
e pr
oces
sing
Dire
ct u
se in
va
lue-
adde
d pr
oduc
ts w
ith
min
imal
or s
impl
e pr
oces
sing
Conv
entio
nal p
olym
ers
Non-
rene
wab
le fe
edst
ock
(min
eral
-bas
ed)
• Th
erm
al p
roce
ssin
g
• M
echa
nica
l pro
cess
ing
• Ch
emic
al tr
eatm
ent
(in
clud
ing
abio
tic)
• Ad
ditiv
es, p
last
icize
rs a
nd
mic
robi
al a
ctio
n
• PE
: Pol
yeth
ylene
• PP
: Pol
ypro
pyle
ne•
PVC:
Pol
yvin
yl ch
lorid
e•
PET:
Pol
yeth
ylene
tere
phth
alat
e•
PU: P
olyu
reth
ane
• PS
: Pol
ysty
rene
• PA
: Pol
yam
ides
(e.g
., ny
lon)
• Ot
hers
• Gl
ass
• Cl
ay•
Cera
mic
s•
Alum
inum
Bio-
polym
ers
• PL
A: P
olyla
ctic
Aci
d •
PHA:
Po
lyhyd
roxy
alka
noat
es•
Chito
san
bio-
com
posi
tes
Ani-
mal
-bas
ed
natu
ral
Polym
ers
Plan
t-ba
sed
natu
ral
polym
ers
Figu
re 1
. Con
vent
iona
l pol
ymer
s an
d ill
ustr
ativ
e lis
t of p
oten
tial s
ubst
itute
s (n
on-e
xhau
stiv
e)
Biom
ass
sour
ceM
ater
ial
Natu
ral
poly
mer
I. Na
tura
l fibr
esCo
tton
plan
tCo
tton
Cellu
lose
Jute
Jute
Cellu
lose
and
Li
gnin
Bam
boo
Bam
boo
fibre
Cellu
lose
II. W
ood
and
Woo
d-pu
lpTr
ees
(dive
rse
spec
ies)
Woo
d,
woo
d-ch
ips
or
woo
d-pu
lp
Cellu
lose
III. C
rops
Mai
ze/
Cass
ava/
Pota
to R
ice
Star
ch fo
ams
Star
ch
IV. C
rop-
was
teSu
garc
ane
Suga
rcan
e ba
gass
eCe
llulo
se;
Lign
inW
heat
Whe
at s
traw
Cellu
lose
; Li
gnin
V. M
arin
e Al
gae
Alga
eAl
gae
Algi
nate
Biom
ass
Sour
ceM
ater
ial
Natu
ral
Polym
erSh
eep
Shee
p w
ool
Kera
tinAn
gora
Goa
tM
ohai
rCe
llulo
se;
Lign
inCa
shm
ere
goat
Cash
mer
e w
ool
Cellu
lose
; Li
gnin
Ango
ra
rabb
itAn
gora
woo
lCe
llulo
se;
Lign
inSi
lk m
oth
Silk
Fibr
oin
Sour
ed c
ow’s
m
ilkQM
ilch
Case
in
Crus
tace
ans
Crus
tace
an
shel
lsCh
itin
5ISSUES AND OPTIONS FOR TRADE POLICYMAKERS
3. PLASTIC ALTERNATIVES AND SUBSTITUTES: EVALUATING RELATIVE MERITS AND DRAWBACKS
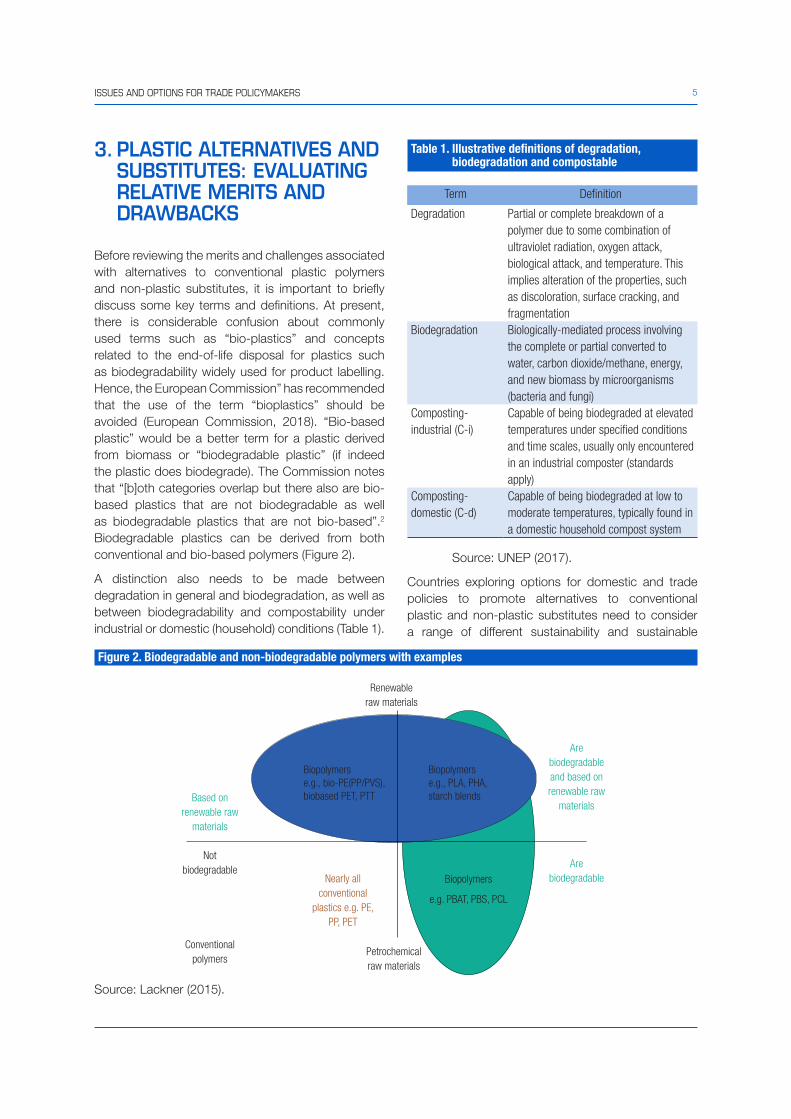
Before reviewing the merits and challenges associated with alternatives to conventional plastic polymers and non-plastic substitutes, it is important to briefly discuss some key terms and definitions. At present, there is considerable confusion about commonly used terms such as “bio-plastics” and concepts related to the end-of-life disposal for plastics such as biodegradability widely used for product labelling. Hence, the European Commission” has recommended that the use of the term “bioplastics” should be avoided (European Commission, 2018). “Bio-based plastic” would be a better term for a plastic derived from biomass or “biodegradable plastic” (if indeed the plastic does biodegrade). The Commission notes that “[b]oth categories overlap but there also are bio-based plastics that are not biodegradable as well as biodegradable plastics that are not bio-based”.2 Biodegradable plastics can be derived from both conventional and bio-based polymers (Figure 2).
A distinction also needs to be made between degradation in general and biodegradation, as well as between biodegradability and compostability under industrial or domestic (household) conditions (Table 1).
Table 1. Illustrative definitions of degradation, biodegradation and compostable
Term Definition
Degradation Partial or complete breakdown of a polymer due to some combination of ultraviolet radiation, oxygen attack, biological attack, and temperature. This implies alteration of the properties, such as discoloration, surface cracking, and fragmentation
Biodegradation Biologically-mediated process involving the complete or partial converted to water, carbon dioxide/methane, energy, and new biomass by microorganisms (bacteria and fungi)
Composting-industrial (C-i)
Capable of being biodegraded at elevated temperatures under specified conditions and time scales, usually only encountered in an industrial composter (standards apply)
Composting-domestic (C-d)
Capable of being biodegraded at low to moderate temperatures, typically found in a domestic household compost system
Source: UNEP (2017).
Countries exploring options for domestic and trade policies to promote alternatives to conventional plastic and non-plastic substitutes need to consider a range of different sustainability and sustainable
Figure 2. Biodegradable and non-biodegradable polymers with examples
Source: Lackner (2015).
Biopolymers
e.g. PBAT, PBS, PCL
Biopolymers Biopolymerse.g., bio-PE(PP/PVS), e.g., PLA, PHA,biobased PET, PTT starch blendsBased on
renewable raw materials
Are biodegradable and based on renewable raw
materials
Are biodegradable
Not biodegradable
Conventional polymers
Nearly all conventional
plastics e.g. PE, PP, PET
Petrochemical raw materials
Renewableraw materials
6 MATERIAL SUBSTITUTES TO ADDRESS MARINE PLASTIC POLLUTION AND SUPPORT A CIRCULAR ECONOMY:
development-related criteria. A sample of some of the core issues to be considered include:
a) Impacts on natural environment and human, animal and plant health upon disposal
Not all substitutes for conventional plastic have the same impact on the environment when disposed of in a landfill or littered openly. From an environmental perspective, the distinction between natural biodegradation and composting that occurs only under specific conditions is critical.
Traditional materials that are transformed into products using non-hydrocarbon, natural feedstocks quite often biodegrade naturally (with differing time-frames) and, in most cases, in a benign, non-toxic manner (if no harmful additives are used). Traditional plant-based materials such as cotton, hemp, flax, jute, ramie (from China-grass), abaca (from musa textilis banana leaf-stems), pina fibre (from pineapple leaves) and sisal, for instance, each exhibit high biodegradation rates in both terrestrial as well as aquatic environments, whereas coir’s biodegradation rate in an aquatic environment is somewhat lower. The same high rate of natural biodegradability is also seen in animal-based polymers such as those found in wool, mohair and silk. All these materials also exhibit high compostability under both domestic as well as industrial composting conditions.
By contrast, bio-based polymers biodegrade only under specific conditions made available through industrial composting. Similarly, bio-based polymers (Tables A1–A4) such as PLA and PHA exhibit high rates of compostability only under industrial composting
conditions or by anaerobic digestion at the end of life (UNEP, 2017). Several national and international standards have been developed for biodegradability and compostability as illustrated in Box 1.
In addition, the use of chemical additives with toxic effects must also be considered when assessing suitability of alternative plastics, such as bio-based polymers. Such additives are used to adjust the properties and enhance performance of polymers, but can leach into the surrounding environment when disposed, with an array of negative environmental and health impacts. Many of these additives include “known endocrine disruptors that may be harmful at extremely low concentrations for marine biota, thus posing potential risks to marine ecosystems, biodiversity and food availability” (Gallo et al 2018). While it is unlikely that traditional natural fibres, such as cotton and jute used in textiles, would have such adverse effects, leaching from any added chemical additives and colorings could still be a concern.
A further environmental challenge related to bio-based polymers is that few developing countries have the closed-loop industrial composting systems required to handle bio-based polymers. The end-use versatility and potential of bio-based polymers to replace a wide range of conventional polymers certainly make them attractive for numerous applications relative to many natural materials. However, further advancements in synthetic bio-based polymers as well as the establishment of an organized collection and waste management system to deal with bio-based polymer waste, particularly in developing countries, are needed before advocating the expanded use and scale-up of their production and trade.
Box 1. Biodegradability and composting standards
ISO 17088 is an international standard that lays down specifications for compostable plastics. Others with similar requirements include EN 13432 and ASTM D6400. ASTM D6400 (United States) and EN 13432 (European Union) require 84 days for disintegration and 180 days for mineralisation. “Additional requirements include limits on heavy metals content, ecotoxicity analysis, and the level of compost quality, determined by a plant growth test. “Standards for industrial composting include DIN V 54900-1 (Germany), EN-13432 (European Union), ASTM 6400-04 (United States) and GreenPla (Japan). Several voluntary certification systems also exist worldwide with regard to compostability such as DIN CERTCO, Vinçotte and European Bioplastics (Europe), BPI (United States), JBPA (Japan) and ABA (Australia). These systems are all based on the same international standards (EN 13432, ASTM D6400, and ISO 17088) with similar requirements. Vinçotte a certification and standards agency based in Belgium also provides certification for materials being biodegradable in soil (OK SOIL) and under marine conditions (OK MARINE).
Sources: Lackner (2015); UNEP (2017).
7ISSUES AND OPTIONS FOR TRADE POLICYMAKERS
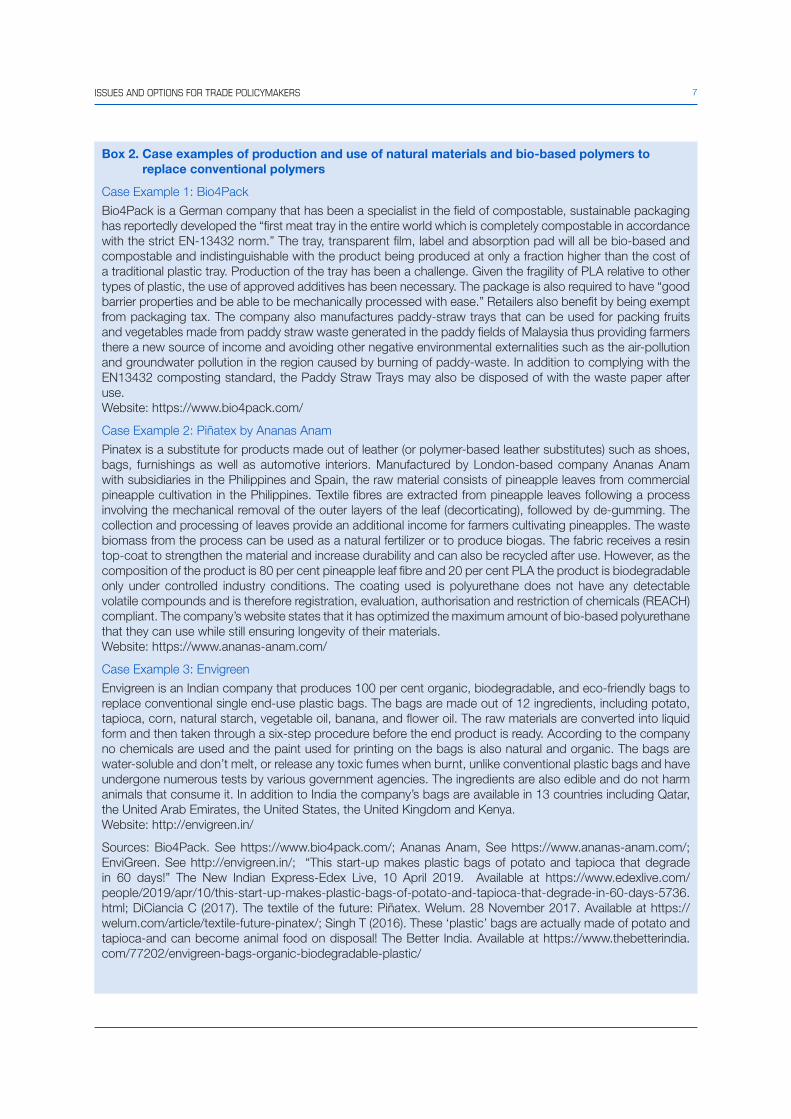
Box 2. Case examples of production and use of natural materials and bio-based polymers to replace conventional polymers
Case Example 1: Bio4Pack
Bio4Pack is a German company that has been a specialist in the field of compostable, sustainable packaging has reportedly developed the “first meat tray in the entire world which is completely compostable in accordance with the strict EN-13432 norm.” The tray, transparent film, label and absorption pad will all be bio-based and compostable and indistinguishable with the product being produced at only a fraction higher than the cost of a traditional plastic tray. Production of the tray has been a challenge. Given the fragility of PLA relative to other types of plastic, the use of approved additives has been necessary. The package is also required to have “good barrier properties and be able to be mechanically processed with ease.” Retailers also benefit by being exempt from packaging tax. The company also manufactures paddy-straw trays that can be used for packing fruits and vegetables made from paddy straw waste generated in the paddy fields of Malaysia thus providing farmers there a new source of income and avoiding other negative environmental externalities such as the air-pollution and groundwater pollution in the region caused by burning of paddy-waste. In addition to complying with the EN13432 composting standard, the Paddy Straw Trays may also be disposed of with the waste paper after use.Website: https://www.bio4pack.com/
Case Example 2: Piñatex by Ananas Anam
Pinatex is a substitute for products made out of leather (or polymer-based leather substitutes) such as shoes, bags, furnishings as well as automotive interiors. Manufactured by London-based company Ananas Anam with subsidiaries in the Philippines and Spain, the raw material consists of pineapple leaves from commercial pineapple cultivation in the Philippines. Textile fibres are extracted from pineapple leaves following a process involving the mechanical removal of the outer layers of the leaf (decorticating), followed by de-gumming. The collection and processing of leaves provide an additional income for farmers cultivating pineapples. The waste biomass from the process can be used as a natural fertilizer or to produce biogas. The fabric receives a resin top-coat to strengthen the material and increase durability and can also be recycled after use. However, as the composition of the product is 80 per cent pineapple leaf fibre and 20 per cent PLA the product is biodegradable only under controlled industry conditions. The coating used is polyurethane does not have any detectable volatile compounds and is therefore registration, evaluation, authorisation and restriction of chemicals (REACH) compliant. The company’s website states that it has optimized the maximum amount of bio-based polyurethane that they can use while still ensuring longevity of their materials.Website: https://www.ananas-anam.com/
Case Example 3: Envigreen
Envigreen is an Indian company that produces 100 per cent organic, biodegradable, and eco-friendly bags to replace conventional single end-use plastic bags. The bags are made out of 12 ingredients, including potato, tapioca, corn, natural starch, vegetable oil, banana, and flower oil. The raw materials are converted into liquid form and then taken through a six-step procedure before the end product is ready. According to the company no chemicals are used and the paint used for printing on the bags is also natural and organic. The bags are water-soluble and don’t melt, or release any toxic fumes when burnt, unlike conventional plastic bags and have undergone numerous tests by various government agencies. The ingredients are also edible and do not harm animals that consume it. In addition to India the company’s bags are available in 13 countries including Qatar, the United Arab Emirates, the United States, the United Kingdom and Kenya.Website: http://envigreen.in/
Sources: Bio4Pack. See https://www.bio4pack.com/; Ananas Anam, See https://www.ananas-anam.com/; EnviGreen. See http://envigreen.in/; “This start-up makes plastic bags of potato and tapioca that degrade in 60 days!” The New Indian Express-Edex Live, 10 April 2019. Available at https://www.edexlive.com/people/2019/apr/10/this-start-up-makes-plastic-bags-of-potato-and-tapioca-that-degrade-in-60-days-5736.html; DiCiancia C (2017). The textile of the future: Piñatex. Welum. 28 November 2017. Available at https://welum.com/article/textile-future-pinatex/; Singh T (2016). These ‘plastic’ bags are actually made of potato and tapioca-and can become animal food on disposal! The Better India. Available at https://www.thebetterindia.com/77202/envigreen-bags-organic-biodegradable-plastic/
8 MATERIAL SUBSTITUTES TO ADDRESS MARINE PLASTIC POLLUTION AND SUPPORT A CIRCULAR ECONOMY:
b) Durability and functionality for desired end-uses
Substitutes to conventional plastic will be successful where they fulfil the function and replicate some of the desirable attributes that make conventional polymers so attractive. This is a tough challenge. For instance, the versatility, ease of use, lightweight and impermeability of various types of conventional polymers to moisture, temperature and bacteria make them particularly suited for long-distance transportation of perishable products such as fresh fruits, vegetables and meat. In such cases, it may be challenging to find traditional natural materials that can readily replace conventional polymers. As an alternative, some companies are working instead to develop compostable bio-based polymers (Box 2). For certain other single-end use plastic products such as drinking straws and take-away food containers, there are a wide variety of traditional natural materials that are already being used with a key challenge being the ability to scale-up their production in a sustainable and cost-competitive manner. Bamboo can be used for drinking straws as well as food-boxes, baskets, wall coverings, window-blinds as well as woven into textiles. Palm leaves and wood are often used to create disposal plates and cutlery and glass can be used for bottling and re-used or recycled indefinitely. Agricultural waste such as pineapple leaves are being used to make consumer goods such as bags, shoes, and furnishings such as the example of Piñatex developed by the Ananas Anam company (Box 2). In addition, starch from agricultural crops can be used to make fully biodegradable (including in water) plastic bags that would be ideal for single-use purposes. This could open opportunities for developing countries to serve not only their own domestic markets, but also tap into possible export opportunities, as in the case of EnviGreen, an Indian company (Box 2). Further, it would be important to mention the diverse range of textiles and products made from natural plant fibres such as cotton and jute of which developing countries are already well-established exporters. An illustrative list of many such materials and their end-uses is provided in Tables A1--A4.
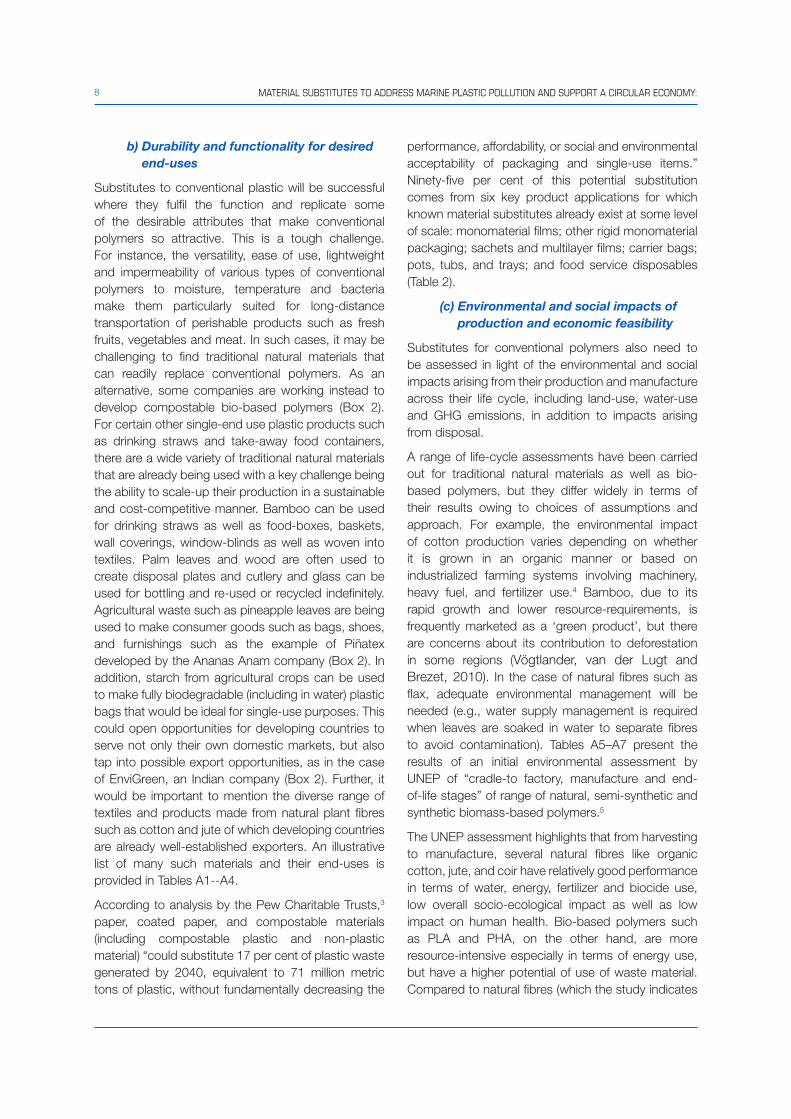
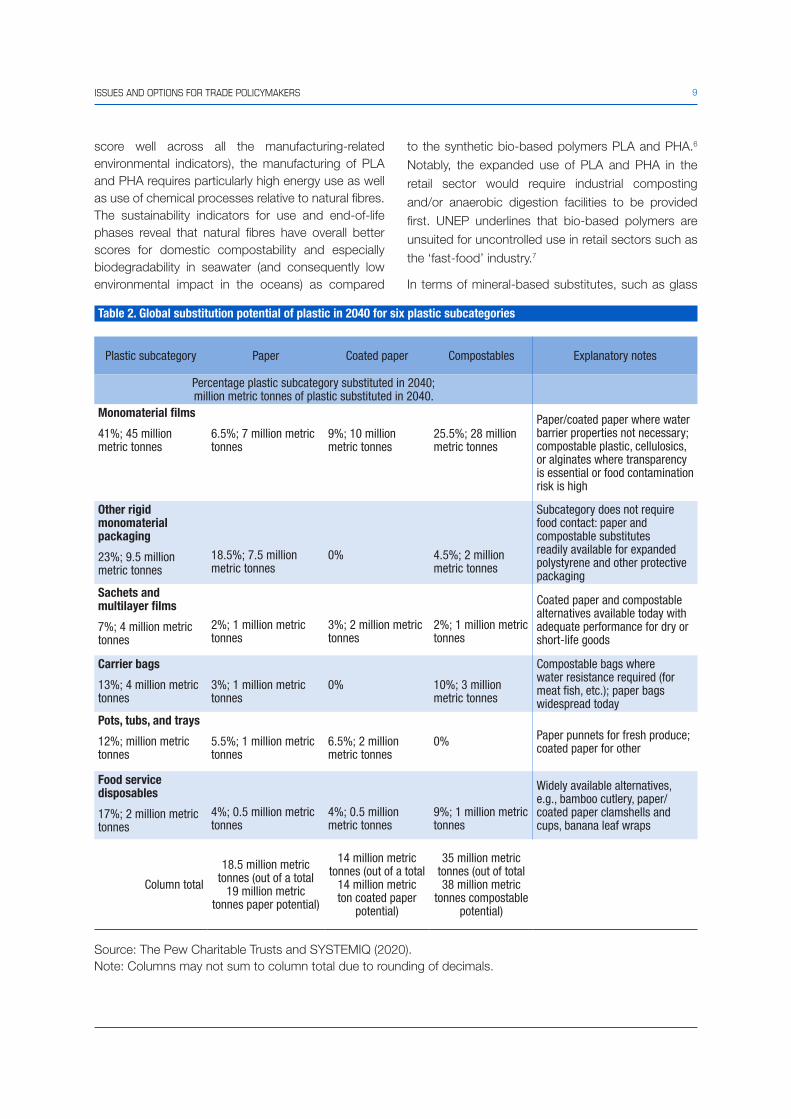
According to analysis by the Pew Charitable Trusts,3 paper, coated paper, and compostable materials (including compostable plastic and non-plastic material) “could substitute 17 per cent of plastic waste generated by 2040, equivalent to 71 million metric tons of plastic, without fundamentally decreasing the
performance, affordability, or social and environmental acceptability of packaging and single-use items.” Ninety-five per cent of this potential substitution comes from six key product applications for which known material substitutes already exist at some level of scale: monomaterial films; other rigid monomaterial packaging; sachets and multilayer films; carrier bags; pots, tubs, and trays; and food service disposables (Table 2).
(c) Environmental and social impacts of production and economic feasibility
Substitutes for conventional polymers also need to be assessed in light of the environmental and social impacts arising from their production and manufacture across their life cycle, including land-use, water-use and GHG emissions, in addition to impacts arising from disposal.
A range of life-cycle assessments have been carried out for traditional natural materials as well as bio-based polymers, but they differ widely in terms of their results owing to choices of assumptions and approach. For example, the environmental impact of cotton production varies depending on whether it is grown in an organic manner or based on industrialized farming systems involving machinery, heavy fuel, and fertilizer use.4 Bamboo, due to its rapid growth and lower resource-requirements, is frequently marketed as a ‘green product’, but there are concerns about its contribution to deforestation in some regions (Vögtlander, van der Lugt and Brezet, 2010). In the case of natural fibres such as flax, adequate environmental management will be needed (e.g., water supply management is required when leaves are soaked in water to separate fibres to avoid contamination). Tables A5–A7 present the results of an initial environmental assessment by UNEP of “cradle-to factory, manufacture and end-of-life stages” of range of natural, semi-synthetic and synthetic biomass-based polymers.5
The UNEP assessment highlights that from harvesting to manufacture, several natural fibres like organic cotton, jute, and coir have relatively good performance in terms of water, energy, fertilizer and biocide use, low overall socio-ecological impact as well as low impact on human health. Bio-based polymers such as PLA and PHA, on the other hand, are more resource-intensive especially in terms of energy use, but have a higher potential of use of waste material. Compared to natural fibres (which the study indicates
9ISSUES AND OPTIONS FOR TRADE POLICYMAKERS
score well across all the manufacturing-related environmental indicators), the manufacturing of PLA and PHA requires particularly high energy use as well as use of chemical processes relative to natural fibres. The sustainability indicators for use and end-of-life phases reveal that natural fibres have overall better scores for domestic compostability and especially biodegradability in seawater (and consequently low environmental impact in the oceans) as compared
to the synthetic bio-based polymers PLA and PHA.6 Notably, the expanded use of PLA and PHA in the retail sector would require industrial composting and/or anaerobic digestion facilities to be provided first. UNEP underlines that bio-based polymers are unsuited for uncontrolled use in retail sectors such as the ‘fast-food’ industry.7
In terms of mineral-based substitutes, such as glass
Table 2. Global substitution potential of plastic in 2040 for six plastic subcategories
Plastic subcategory Paper Coated paper Compostables Explanatory notes
Percentage plastic subcategory substituted in 2040; million metric tonnes of plastic substituted in 2040.
Monomaterial films
41%; 45 million metric tonnes
6.5%; 7 million metric tonnes
9%; 10 million metric tonnes
25.5%; 28 million metric tonnes
Paper/coated paper where water barrier properties not necessary; compostable plastic, cellulosics, or alginates where transparency is essential or food contamination risk is high
Other rigid monomaterial packaging
23%; 9.5 million metric tonnes
18.5%; 7.5 million metric tonnes
0% 4.5%; 2 million metric tonnes
Subcategory does not require food contact: paper and compostable substitutes readily available for expanded polystyrene and other protective packaging
Sachets and multilayer films
7%; 4 million metric tonnes
2%; 1 million metric tonnes
3%; 2 million metric tonnes
2%; 1 million metric tonnes
Coated paper and compostable alternatives available today with adequate performance for dry or short-life goods
Carrier bags
13%; 4 million metric tonnes
3%; 1 million metric tonnes
0% 10%; 3 million metric tonnes
Compostable bags where water resistance required (for meat fish, etc.); paper bags widespread today
Pots, tubs, and trays
12%; million metric tonnes
5.5%; 1 million metric tonnes
6.5%; 2 million metric tonnes
0% Paper punnets for fresh produce; coated paper for other
Food service disposables
17%; 2 million metric tonnes
4%; 0.5 million metric tonnes
4%; 0.5 million metric tonnes
9%; 1 million metric tonnes
Widely available alternatives, e.g., bamboo cutlery, paper/coated paper clamshells and cups, banana leaf wraps
Column total
18.5 million metric tonnes (out of a total
19 million metric tonnes paper potential)
14 million metric tonnes (out of a total
14 million metric ton coated paper
potential)
35 million metric tonnes (out of total 38 million metric
tonnes compostable potential)
Source: The Pew Charitable Trusts and SYSTEMIQ (2020). Note: Columns may not sum to column total due to rounding of decimals.
10 MATERIAL SUBSTITUTES TO ADDRESS MARINE PLASTIC POLLUTION AND SUPPORT A CIRCULAR ECONOMY:
and aluminum, which can be re-used and recycled indefinitely, these could play an important role in replacing rigid mono-material plastics as well as certain single-use items (like coffee cups). However, widespread re-use and re-cycling of glass and aluminium products require effective collection, re-use and recycling systems, which may not be present everywhere, particularly in developing countries. Further, most of the rigid mono-materials they are meant to replace are less problematic globally for the environment relative to flexible plastic, because they have higher collection and re-cycling rates. In a single-use context, glass and aluminium can also have negative trade-offs in terms of GHG emissions, recycling rates and costs compared to mono-material plastics. Costs are also an important consideration in shaping consumer decisions to switch to alternative materials. For example, aluminium cans and glass bottles are 33 per cent and 167 per cent more expensive, respectively, than a PET bottle.8 This underlines the wider point that domestic regulatory and taxation policies will be needed to can help reduce the cost-differential between conventional plastics (that often benefit from cheap fossil-fuel prices and fossil-fuel subsidies) and enable the greater uptake of non-plastic substitute materials.
To minimize land-use, water and energy-related impacts – and related food security considerations – of cultivating crops for natural fibre-based substitutes, the focus should be on using the waste materials from agricultural food crops. Using degraded or waste land for the cultivation of crops for natural fibres would also be more sustainable than land clearance. As costs decline, marine algae-based biodegradable, bio-based polymers could also potentially reduce reliance on food-crops and pressure on land-based agriculture, although a range of environmental considerations would require analysis and attention.
(d) Sustainable development opportunities for developing countries
A major consideration for policymakers seeking to promote substitutes for conventional plastic should be the potential sustainable development opportunities for developing countries. A large number of developing countries already cultivate plant-based fibres such as cotton, jute, abaca, coir, kenaf, sisal,
bamboo, hemp, milk casein and pineapple, and also manufacture wood-based packaging, such as paper and cardboard. While these products may not necessarily replace all plastics use, they ”can be used strategically, especially in areas where some of the properties of plastic are dispensable” (Barrowclough and Birkbeck, 2020). In some instances, they may also be readily available to supply the market where bans, taxes or other restrictions on single-use plastics are implemented at the national level. Sisal, for example, is produced in many least-developed countries and can thrive in drought conditions where other agricultural crops fail. However, loss of traditional market for sisal has led to declining production, along with a loss of export-earnings and income for local communities. A focus on replacing synthetic fibres with natural fibres such as sisal could present an opportunity to reverse such trends and open new markets. Agricultural crops can also yield waste material that can be used as feedstock to produce cellulose or lignin-based bio-based polymers.
Importantly, most natural materials can be domestically composted; in remote and poor communities, this also make them suitable for other beneficial purposes, such as reuse for soil conditioning.9 On the other hand, the infrastructure for recycling or safely disposing off plastic waste is well-short of what is needed in developing countries (both to cope with the plastic waste generated domestically or imported, and also waste arising from imported plastic goods). This is especially true in rural communities where mass-produced consumer goods made from plastic are increasingly available, but without corresponding collection, recycling, or safe disposal systems in place.
New innovations are emerging based on research and development (R&D), such as ongoing efforts to produce PHA with the help of methane-eating bacteria, which could lower costs of production and bring multiple benefits. However, it will be some time before such innovations are commercially available and the necessary recycling and composting eco-systems are created.
In the interim, sustainable exploitation of existing natural materials would seem to be the most appropriate source of benefits for developing countries and help in the realization of the SDGs.
11ISSUES AND OPTIONS FOR TRADE POLICYMAKERS
4. PRELIMINARY ASSESSMENT OF MARKET AND TRADE-RELATED TRENDS
This section provides an illustrative overview and preliminary assessment of market trends and trade flows for selected examples in three categories of materials:
First, it reviews a select group of natural materials: jute, abaca, coir, kenaf and sisal, commonly known as the JACKS. These are already well-established sectors and products of interest to a number of developing countries as well as potential substitutes for common synthetic fibre-based items textiles, rope, cord and packaging materials, all of which are known marine polluters.
Second, it reviews trends for conventional plastic packaging as well as alternative cellulose-based packaging materials. It compares, three HS 2017 subheadings namely boxes, cases, crates as well as sacks and bags made of polymers of ethylene as well as other plastics (HS 3923.10, HS 3923.21 and 3923.29) with trade flows for paper, paperboard and cellulose-based packaging material (found under the four-digit heading HS 4819, which in turn contain subheadings covering cartons, boxes, cases, bags and other packing containers, of paper, paperboard, cellulose wadding or webs of cellulose fibres; box files, letter trays, and similar articles, of paper or paperboard, of a kind used in offices, shops or the like).
Third, it reviews an example of a biodegradable (under specific composting conditions) bio-based polymer, namely, PLA. This bio-based polymer was selected for attention because it is already used in a number of commercial applications, including food packaging.
4.1. Evaluation of global markets and trade for JACKS fibres
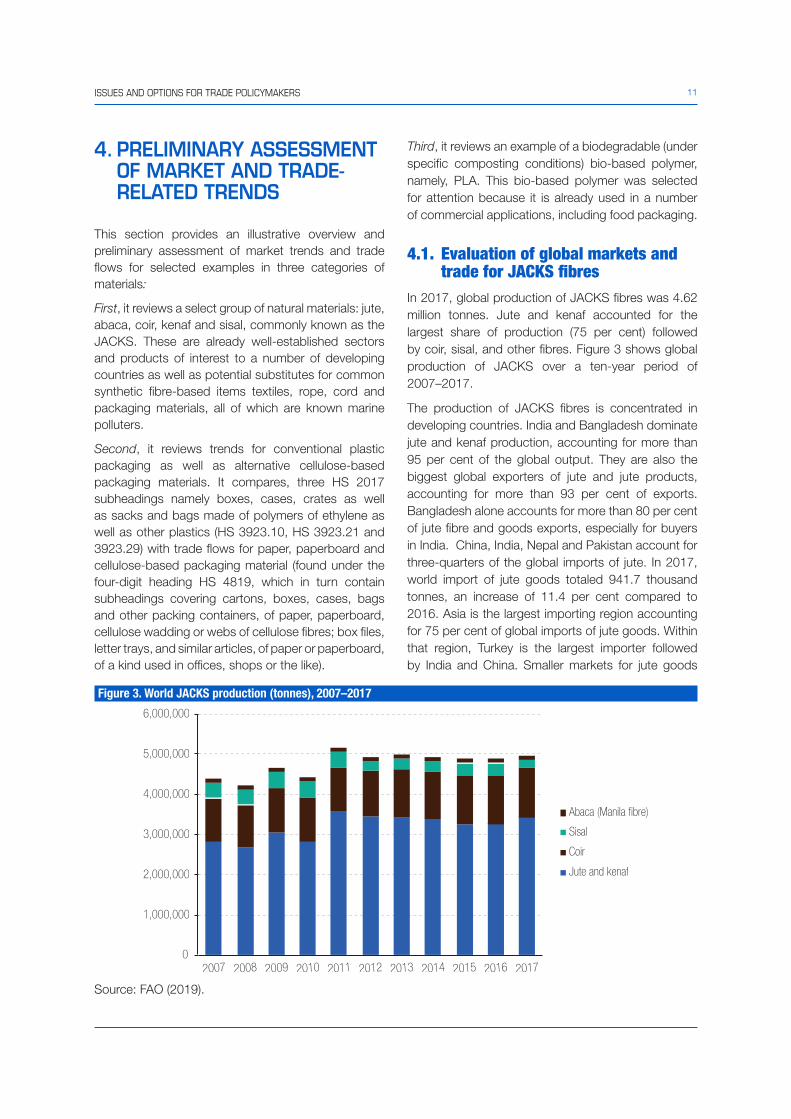
In 2017, global production of JACKS fibres was 4.62 million tonnes. Jute and kenaf accounted for the largest share of production (75 per cent) followed by coir, sisal, and other fibres. Figure 3 shows global production of JACKS over a ten-year period of 2007–2017.
The production of JACKS fibres is concentrated in developing countries. India and Bangladesh dominate jute and kenaf production, accounting for more than 95 per cent of the global output. They are also the biggest global exporters of jute and jute products, accounting for more than 93 per cent of exports. Bangladesh alone accounts for more than 80 per cent of jute fibre and goods exports, especially for buyers in India. China, India, Nepal and Pakistan account for three-quarters of the global imports of jute. In 2017, world import of jute goods totaled 941.7 thousand tonnes, an increase of 11.4 per cent compared to 2016. Asia is the largest importing region accounting for 75 per cent of global imports of jute goods. Within that region, Turkey is the largest importer followed by India and China. Smaller markets for jute goods
Figure 3. World JACKS production (tonnes), 2007–2017
Source: FAO (2019).
0
1,000,000
2,000,000
3,000,000
4,000,000
5,000,000
6,000,000
2007 2008 2009 2010 2011 2012 2013 2014 2015 2016 2017
Abaca (Manila �bre)
Sisal
Coir
Jute and kenaf
12 MATERIAL SUBSTITUTES TO ADDRESS MARINE PLASTIC POLLUTION AND SUPPORT A CIRCULAR ECONOMY:
include the European Union, Africa and North America (FAO, 2019).10
Sisal-producing countries are more diversified. Brazil leads sisal production accounting for 32 per cent of global output followed by China (29.1 per cent), United Republic of Tanzania (17.8 per cent), Kenya (10.4 per cent) and Madagascar (2.9 per cent). Wordwide, there has been an overall decline in sisal production from around 300 000 tonnes to just over 200 000 tonnes in 2017 and exports have also declined. The supply shortfalls in recent years has been caused by lower output in Brazil due to severe drought conditions. Brazil, the largest producer, is also the main exporter of sisal fibres and goods accounting for nearly 30 per cent of sisal fibre exports and nearly 50 per cent of sisal-based manufactured goods in 2017. Other exporters include Kenya and United Republic of Tanzania, which mainly provide sisal products for use in the construction industry, with the main destinations being Saudi Arabia, Nigeria, Morocco, Spain and Egypt. China remains, by far, the largest import market of sisal fibre, accounting for 48.2 per cent of global imports and the United States remains the main import market of sisal-based manufactured goods, with a share of 38.9 per cent, followed by the European Union (24.1 per cent) and Asia (15.7 per cent).11
Like jute, the production of abaca, which amounted to 84.16 thousand tonnes in 2017, is also relatively
concentrated, with most production taking place in the Philippines (85 per cent of global total) and Ecuador (12 per cent of the global total). Most of the Philippines’ production of abaca fibre (75 per cent) is destined for domestic consumption, while Ecuador exports most of its production. Abaca fibre exports have more than doubled from a little below 15,000 tonnes in 2013 to just above 30,000 tonnes in 2017, driven by increasing demand in the world market, while exports of abaca-based manufactured goods and abaca pulp have declined in overall terms since 2011.12
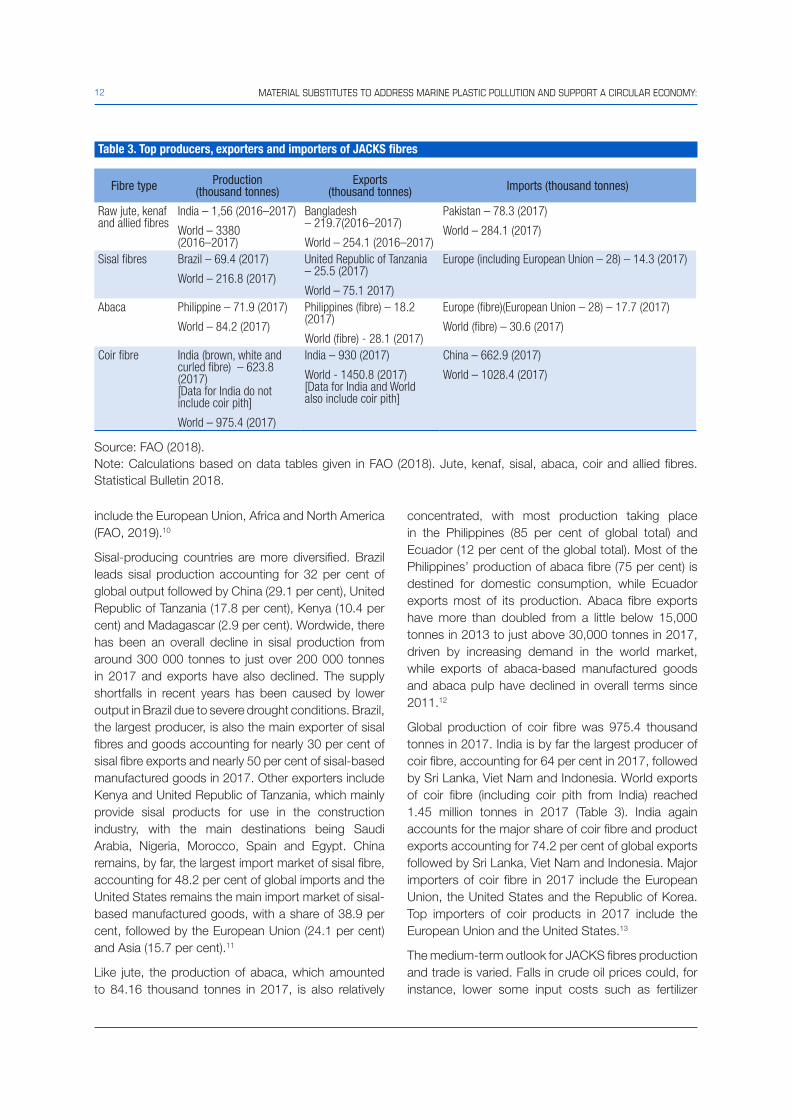
Global production of coir fibre was 975.4 thousand tonnes in 2017. India is by far the largest producer of coir fibre, accounting for 64 per cent in 2017, followed by Sri Lanka, Viet Nam and Indonesia. World exports of coir fibre (including coir pith from India) reached 1.45 million tonnes in 2017 (Table 3). India again accounts for the major share of coir fibre and product exports accounting for 74.2 per cent of global exports followed by Sri Lanka, Viet Nam and Indonesia. Major importers of coir fibre in 2017 include the European Union, the United States and the Republic of Korea. Top importers of coir products in 2017 include the European Union and the United States.13
The medium-term outlook for JACKS fibres production and trade is varied. Falls in crude oil prices could, for instance, lower some input costs such as fertilizer
Table 3. Top producers, exporters and importers of JACKS fibres
Fibre type Production (thousand tonnes)
Exports (thousand tonnes) Imports (thousand tonnes)
Raw jute, kenaf and allied fibres
India – 1,56 (2016–2017)
World – 3380 (2016–2017)
Bangladesh – 219.7(2016–2017)
World – 254.1 (2016–2017)
Pakistan – 78.3 (2017)
World – 284.1 (2017)
Sisal fibres Brazil – 69.4 (2017)
World – 216.8 (2017)
United Republic of Tanzania – 25.5 (2017)
World – 75.1 2017)
Europe (including European Union – 28) – 14.3 (2017)
Abaca Philippine – 71.9 (2017)
World – 84.2 (2017)
Philippines (fibre) – 18.2 (2017)
World (fibre) - 28.1 (2017)
Europe (fibre)(European Union – 28) – 17.7 (2017)
World (fibre) – 30.6 (2017)
Coir fibre India (brown, white and curled fibre) – 623.8 (2017) [Data for India do not include coir pith]
World – 975.4 (2017)
India – 930 (2017)
World - 1450.8 (2017) [Data for India and World also include coir pith]
China – 662.9 (2017)
World – 1028.4 (2017)
Source: FAO (2018). Note: Calculations based on data tables given in FAO (2018). Jute, kenaf, sisal, abaca, coir and allied fibres. Statistical Bulletin 2018.
13ISSUES AND OPTIONS FOR TRADE POLICYMAKERS
and transportation for JACKS production, but could also lead to price reductions in competing non-natural or synthetic fibres, particularly polypropylene. In the past, reductions in crude oil prices have led to lower demand for JACKS, except for abaca, which has remained competitive with synthetic fibres due to the superior properties of its fibre (especially for its main end-use, which is for specialty papers).14 Historically demand for JACKS has been more consistent in large producing countries, such as China and India, compared to smaller countries reliant on export markets. Increasing trade in agricultural commodity crops such as coffee, for which jute is often used as packaging material, as well as the preference of many commodity buyers (in domestic markets) for the use of jute packaging for sugar, are both major sources of demand for jute (Chang, 2013).
Looking ahead, increases in crude-oil prices, combined with the growing range of environment-related bans and regulatory measures on certain plastics, could boost demand for JACKS to grow and provide an impetus for stronger research and commercialization efforts on the use of JACKS fibres in bio-composites.15 In developing countries, for instance, efforts to discourage the use of single-use plastics, particularly plastic bags, have largely taken the form of partial or total bans, while in the developed world they have taken the form of taxes or levies on suppliers, retailers or consumers. In some cases, there have also been proactive measures to favour and reduce the costs of substitutes, such as the removal of Value Added Taxes (VAT) on biodegradable alternatives in St. Vincent and the Grenadines to lower their cost (Table A13). Despite varying degrees of success, the growing trend towards such regulations and restrictions on conventional plastics could further provide encouragement for production of packaging material based on natural fibres. National policies on agricultural production, including those for food crops, also influence planting decisions by farmers that could impact the production of JACKS. For example, in United Republic of Tanzania, inter-cropping sisal with food crops is a common occurrence (Chang, 2013).
Experience to date also underlines the importance of policies that help bridge the cost differences between available substitutes and cheap single-use plastics, such as through taxes on single-use plastics that are set at a level that provides a sufficient disincentive or through effective enforcement of measures such as bans (UNEP, 2018).
From a sustainable development perspective, policies that encourage the production of JACKS fibres could support the substitution of synthetic fibres and lead to environment and development benefits for developing countries that both produce and consume JACKS fibres. At present, production of JACKS fibres provides an important source of income for many smallholder farmers, especially in India, Bangladesh, Sri Lanka, China, Brazil, Ecuador, United Republic of Tanzania and Kenya. Further, investment in the production of value-added goods derived from JACKS products could also provide an important source of income and employment, as well as export revenues that would contribute favourably to the balance of payments of these countries. In all cases, policies to enhance production would need to be carefully developed to also reflect land-use, food security, and environmental priorities and considerations.
4.2. Evaluation of trade flows in cellulose and synthetic polymer-based packaging material
The production figures for plastics show considerable difference in size and scale compared to JACKS fibres. In 2019, the total value of plastic trade was over US$ 1 trillion (Deere Birkbeck and Sugathan, 2021). Trade in primary plastics alone had a total value of a little more than US$ 294 billion in 2019.
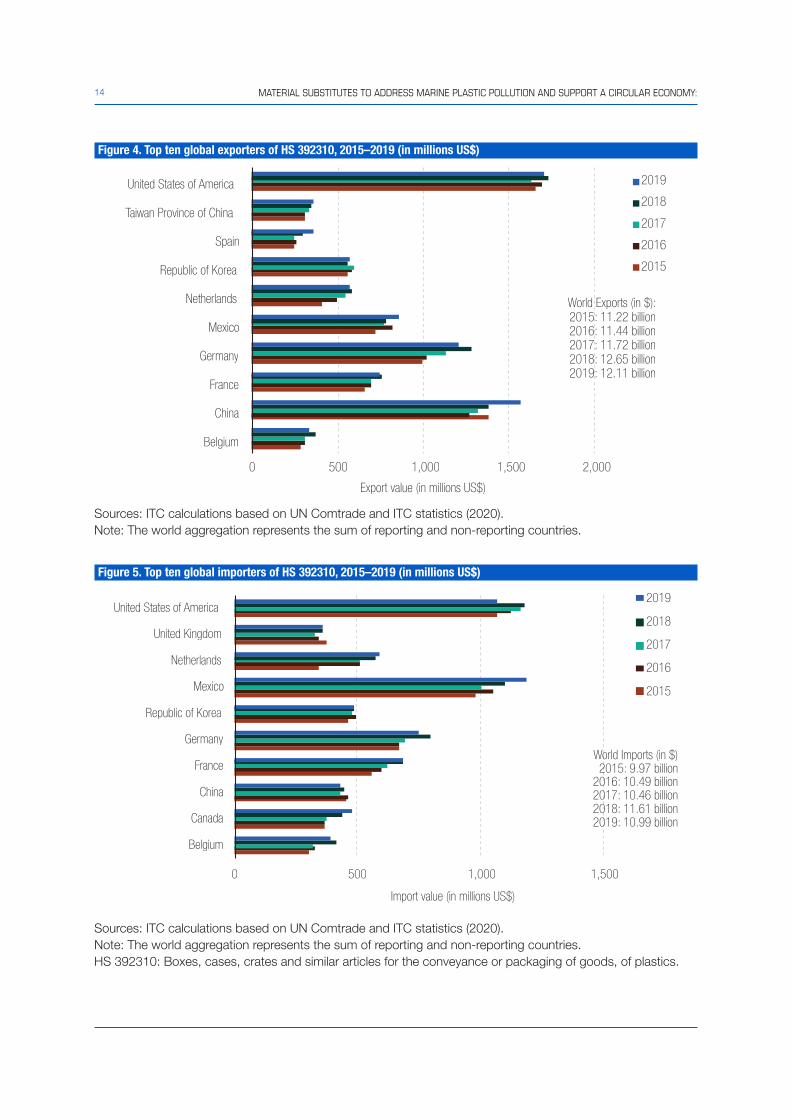
Figures 4–11 provide a comparison of trade-flow values over the period 2015–19 for an illustrative set of materials that are highly relevant for plastic packaging. Tables 4–5 show trade flows (by value) as well as the top 10 exporters and importers (based on 2019 figures) for three categories of packaging related to conventional polymers, namely: (i) Plastic boxes, cases, crates for conveyance or packaging of goods (HS 392310), (ii) Plastic sacks and bags made of ethylene polymers, and (iii) Plastic sacks and bags made of polymers other than ethylene. These trade flows are compared with trade flows in another four-digit HS heading category, namely HS 4819 (Cartons, boxes, cases, bags, and other packing containers, of paper, paperboard, cellulose wadding). This heading (HS 4819) is likely to include most types of packaging made of paperboard or other cellulosic material derived from plant materials such as starches.
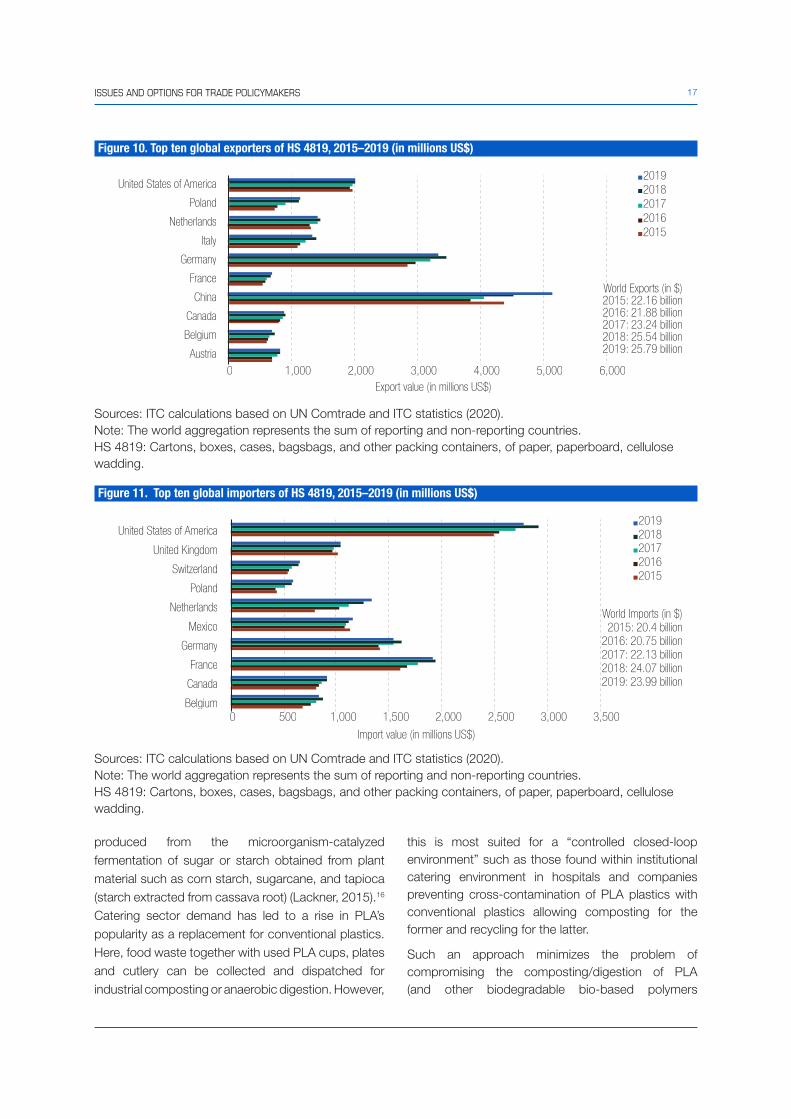
The analysis shows that the trade-flow values for packaging material of paper, paperboard and cellulose wadding are similar to the combined values
14 MATERIAL SUBSTITUTES TO ADDRESS MARINE PLASTIC POLLUTION AND SUPPORT A CIRCULAR ECONOMY:
Figure 4. Top ten global exporters of HS 392310, 2015–2019 (in millions US$)
Sources: ITC calculations based on UN Comtrade and ITC statistics (2020). Note: The world aggregation represents the sum of reporting and non-reporting countries.
Figure 5. Top ten global importers of HS 392310, 2015–2019 (in millions US$)
Sources: ITC calculations based on UN Comtrade and ITC statistics (2020). Note: The world aggregation represents the sum of reporting and non-reporting countries. HS 392310: Boxes, cases, crates and similar articles for the conveyance or packaging of goods, of plastics.
0 500 1,000 1,500 2,000
World Exports (in $):2015: 11.22 billion2016: 11.44 billion2017: 11.72 billion2018: 12.65 billion2019: 12.11 billion
Export value (in millions US$)
2019
2018
2017
2016
2015
Belgium
China
France
Germany
Mexico
Netherlands
Republic of Korea
Spain
Taiwan Province of China
United States of America
0 500 1,000 1,500
World Imports (in $)2015: 9.97 billion
2016: 10.49 billion2017: 10.46 billion2018: 11.61 billion2019: 10.99 billion
Import value (in millions US$)
2019
2018
2017
2016
2015
Belgium
Canada
China
France
Germany
Republic of Korea
Mexico
Netherlands
United Kingdom
United States of America
15ISSUES AND OPTIONS FOR TRADE POLICYMAKERS
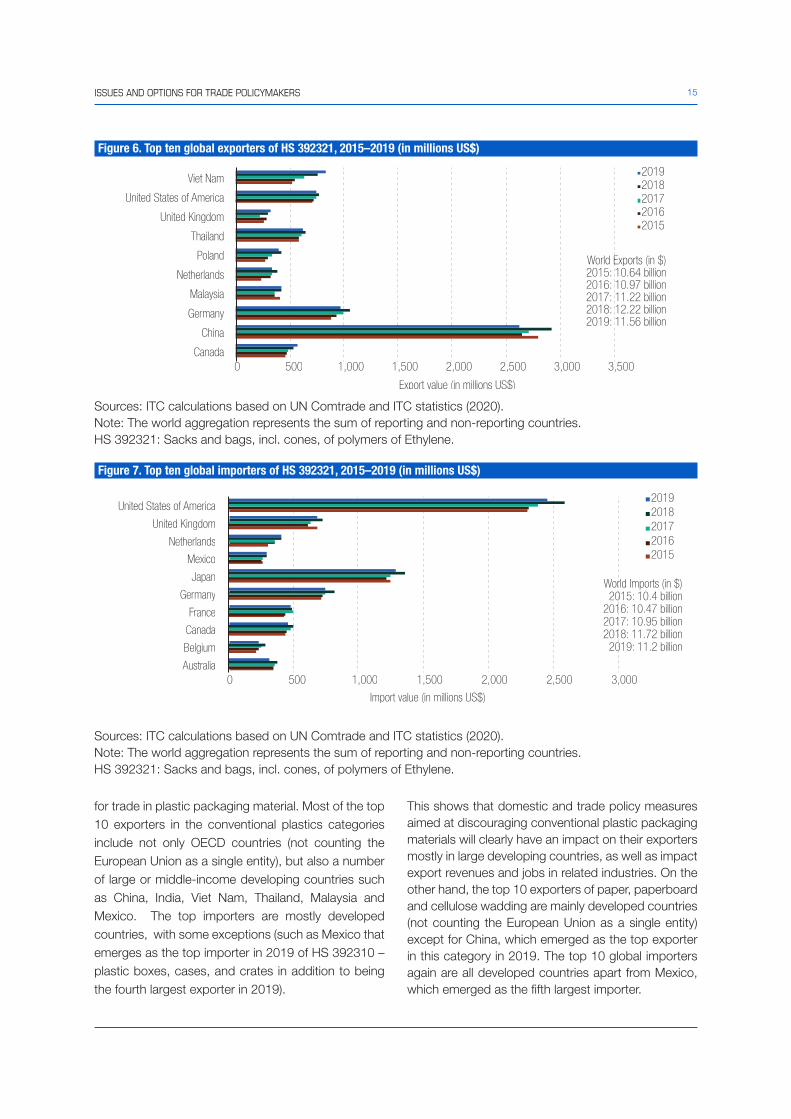
for trade in plastic packaging material. Most of the top 10 exporters in the conventional plastics categories include not only OECD countries (not counting the European Union as a single entity), but also a number of large or middle-income developing countries such as China, India, Viet Nam, Thailand, Malaysia and Mexico. The top importers are mostly developed countries, with some exceptions (such as Mexico that emerges as the top importer in 2019 of HS 392310 – plastic boxes, cases, and crates in addition to being the fourth largest exporter in 2019).
This shows that domestic and trade policy measures aimed at discouraging conventional plastic packaging materials will clearly have an impact on their exporters mostly in large developing countries, as well as impact export revenues and jobs in related industries. On the other hand, the top 10 exporters of paper, paperboard and cellulose wadding are mainly developed countries (not counting the European Union as a single entity) except for China, which emerged as the top exporter in this category in 2019. The top 10 global importers again are all developed countries apart from Mexico, which emerged as the fifth largest importer.
Figure 6. Top ten global exporters of HS 392321, 2015–2019 (in millions US$)
Sources: ITC calculations based on UN Comtrade and ITC statistics (2020). Note: The world aggregation represents the sum of reporting and non-reporting countries. HS 392321: Sacks and bags, incl. cones, of polymers of Ethylene.
Figure 7. Top ten global importers of HS 392321, 2015–2019 (in millions US$)
Sources: ITC calculations based on UN Comtrade and ITC statistics (2020). Note: The world aggregation represents the sum of reporting and non-reporting countries. HS 392321: Sacks and bags, incl. cones, of polymers of Ethylene.
0 500 1,000 1,500 2,000 2,500 3,000 3,500
Export value (in millions US$)
20192018201720162015
Canada
China
Germany
Malaysia
Netherlands
Poland
Thailand
United Kingdom
United States of America
Viet Nam
World Exports (in $)2015: 10.64 billion2016: 10.97 billion2017: 11.22 billion2018: 12.22 billion2019: 11.56 billion
0 500 1,000 1,500 2,000 2,500 3,000
Import value (in millions US$)
20192018201720162015
Australia
Belgium
Canada
France
Germany
Japan
Mexico
Netherlands
United Kingdom
United States of America
World Imports (in $)2015: 10.4 billion
2016: 10.47 billion2017: 10.95 billion2018: 11.72 billion
2019: 11.2 billion
16 MATERIAL SUBSTITUTES TO ADDRESS MARINE PLASTIC POLLUTION AND SUPPORT A CIRCULAR ECONOMY:
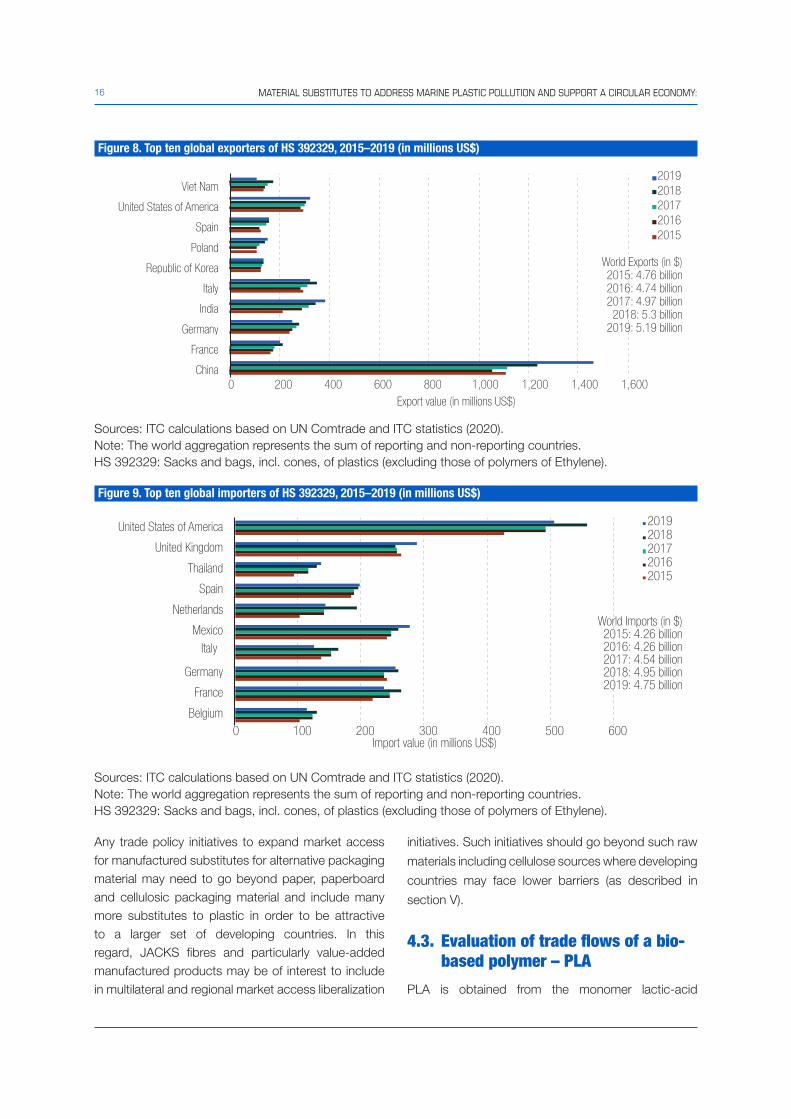
Any trade policy initiatives to expand market access for manufactured substitutes for alternative packaging material may need to go beyond paper, paperboard and cellulosic packaging material and include many more substitutes to plastic in order to be attractive to a larger set of developing countries. In this regard, JACKS fibres and particularly value-added manufactured products may be of interest to include in multilateral and regional market access liberalization
initiatives. Such initiatives should go beyond such raw
materials including cellulose sources where developing
countries may face lower barriers (as described in
section V).
4.3. Evaluation of trade flows of a bio-based polymer – PLA
PLA is obtained from the monomer lactic-acid
Figure 8. Top ten global exporters of HS 392329, 2015–2019 (in millions US$)
Sources: ITC calculations based on UN Comtrade and ITC statistics (2020). Note: The world aggregation represents the sum of reporting and non-reporting countries. HS 392329: Sacks and bags, incl. cones, of plastics (excluding those of polymers of Ethylene).
Figure 9. Top ten global importers of HS 392329, 2015–2019 (in millions US$)
Sources: ITC calculations based on UN Comtrade and ITC statistics (2020). Note: The world aggregation represents the sum of reporting and non-reporting countries. HS 392329: Sacks and bags, incl. cones, of plastics (excluding those of polymers of Ethylene).
0 200 400 600 800 1,000 1,200 1,400 1,600Export value (in millions US$)
20192018201720162015
China
France
Germany
India
Italy
Republic of Korea
Poland
Spain
United States of America
Viet Nam
World Exports (in $)2015: 4.76 billion2016: 4.74 billion2017: 4.97 billion
2018: 5.3 billion2019: 5.19 billion
0 100 200 300 400 500 600Import value (in millions US$)
20192018201720162015
Belgium
France
Germany
Italy
Mexico
Netherlands
Spain
Thailand
United Kingdom
United States of America
World Imports (in $)2015: 4.26 billion2016: 4.26 billion2017: 4.54 billion2018: 4.95 billion2019: 4.75 billion
17ISSUES AND OPTIONS FOR TRADE POLICYMAKERS
produced from the microorganism-catalyzed fermentation of sugar or starch obtained from plant material such as corn starch, sugarcane, and tapioca (starch extracted from cassava root) (Lackner, 2015).16 Catering sector demand has led to a rise in PLA’s popularity as a replacement for conventional plastics. Here, food waste together with used PLA cups, plates and cutlery can be collected and dispatched for industrial composting or anaerobic digestion. However,
this is most suited for a “controlled closed-loop environment” such as those found within institutional catering environment in hospitals and companies preventing cross-contamination of PLA plastics with conventional plastics allowing composting for the former and recycling for the latter.
Such an approach minimizes the problem of compromising the composting/digestion of PLA (and other biodegradable bio-based polymers
Figure 10. Top ten global exporters of HS 4819, 2015–2019 (in millions US$)
Sources: ITC calculations based on UN Comtrade and ITC statistics (2020). Note: The world aggregation represents the sum of reporting and non-reporting countries. HS 4819: Cartons, boxes, cases, bagsbags, and other packing containers, of paper, paperboard, cellulose wadding.
Figure 11. Top ten global importers of HS 4819, 2015–2019 (in millions US$)
Sources: ITC calculations based on UN Comtrade and ITC statistics (2020). Note: The world aggregation represents the sum of reporting and non-reporting countries. HS 4819: Cartons, boxes, cases, bagsbags, and other packing containers, of paper, paperboard, cellulose wadding.
0 1,000 2,000 3,000 4,000 5,000 6,000Export value (in millions US$)
20192018201720162015
Austria
Belgium
Canada
China
France
Germany
Italy
Netherlands
Poland
United States of America
World Exports (in $)2015: 22.16 billion2016: 21.88 billion2017: 23.24 billion2018: 25.54 billion2019: 25.79 billion
0 500 1,000 1,500 2,000 2,500 3,000 3,500
Import value (in millions US$)
20192018201720162015
Belgium
Canada
France
Germany
Mexico
Netherlands
Poland
Switzerland
United Kingdom
United States of America
World Imports (in $)2015: 20.4 billion
2016: 20.75 billion2017: 22.13 billion2018: 24.07 billion2019: 23.99 billion

18 MATERIAL SUBSTITUTES TO ADDRESS MARINE PLASTIC POLLUTION AND SUPPORT A CIRCULAR ECONOMY:
such as PHA) by conventional polymers, as well as compromising the recycling of conventional polymers by PLA. It allows the products of composting or anaerobic digestion to become the feedstock of the next generation of PLA (UNEP, 2017).
Biodegradable plastics (comprising PLA, PHA, starch blends and others) make up more than 55.5 per cent (over 1 million tonnes) of the global bioplastics production capacities in 2019. The share of PLA production capacity is about 13.9 per cent. The production of biodegradable plastics is expected to increase from about 1.17 million tonnes in 2019 to 1.33 million tonnes in 2024 especially due to PHA’s significant growth rates (European Bioplastics, 2019). Production capacity of PLA is expected to double by 2023 (ECTC, 2019). Packaging currently accounts for the major share of the global bio-PLA market (Mordor Intelligence, 2021). The global market was led by North America, which had a revenue share of 35.86 per cent in 2019. Important drivers for PLA market growth are government and private support towards PLA market development, and the increasing use of bioplastics in
food packaging. However, the fastest growing region for the PLA market, in terms of both revenue and volume is the Asia-Pacific (Inkwood Research, 2019).
Tables 4 and 5 show the top 10 exporters and importers of PLA.
Table 4 clearly shows that in 2019 the United States followed by the Netherlands were the dominant exporters of PLA in its primary form, followed by Thailand and China. The Netherlands also emerged as the largest importer followed by China as well as a few other larger developing economies such as Taiwan Province of China and Republic of Korea. The import figures also reveal the rapid growth in demand over the period 2016–19, particularly in China and some European Union countries.
Notably, given the very limited degradation of PLA at ambient temperatures in soil and domestic composting, only a further expansion of waste management and biopolymer composting facilities in developing countries provide a conducive and sustainable environment for further uptake. One
Table 4. Top ten global exporters of HS 390770 polylactic acid in primary forms, 2015–2019 (US$ thousand)
Exporters 2015 2016 2017 2018 2019
World 183,024 188,728 238,476 307,130 417,588United States of America
104,184 116,465 145,314 173,858 203,918
Netherlands 65,877 48,958 65,473 97,504 135,723Thailand 13 288 1 035 4,175 46,563Belgium 3,952 3,125 4,290 5,884 8,846Italy 92 529 1,167 2,345 2,608Switzerland 380 293 310 431 1,391France 191 43 194 151 832
Note: The world aggregation represents the sum of reporting and non-reporting countries.Sources: ITC calculations based on UN Comtrade and ITC statistics.
Table 5. Top ten global importers of HS 390770 polylactic acid in primary forms, 2015–2019 (US$ thousand)
Importers 2015 2016 2017 2018 2019
Netherlands 40,405 32,661 52,233 62,062 92,552Taiwan Province of China 30,335 36,807 41,919 53,948 50,727Belgium 5,798 6,832 4,347 6,757 21,848Republic of Korea 8,427 9,674 10,830 14,626 18,032United Kingdom 3,515 5,464 5,403 7,141 6,606
Source: ITC calculations based on UN COMTRADE and ITC statistics.Note: The world aggregation represents the sum of reporting and non-reporting countries.

19ISSUES AND OPTIONS FOR TRADE POLICYMAKERS
advantage in such a scenario is that starch-based raw-materials are also readily available in developing countries. If this involves the use of crops grown for food, then implications on food security should also be considered in any life cycle assessment, together with
the use of water, fertilizer, biocides and energy. Using agricultural waste and the products of composting or anaerobic digestion in the production of PLA and PHA would improve their environmental credentials (UNEP, 2017).

20 MATERIAL SUBSTITUTES TO ADDRESS MARINE PLASTIC POLLUTION AND SUPPORT A CIRCULAR ECONOMY:
5. TRADE POLICY MEASURES AFFECTING ALTERNATIVE PLASTICS AND NON-PLASTIC SUBSTITUTES
This section explores some of the main tariff and non-tariff barriers (NTBs) that currently affect or could affect market access for exports of non-conventional alternative plastics and non-plastic substitutes. Bound and applied most-favoured nation (MFN) tariffs for a section of developed and developing countries are examined for JACKS natural fibres and for selected examples of derived manufactured goods (with a focus on packing material and cords, ropes or twine made from JACKS fibres). Import tariffs in major markets are also analysed for conventional and cellulosic packaging material and PLA. The analysis could give some indication of where trade policy initiatives related to tariffs could provide a boost to alternative plastics and non-plastic substitutes, with a focus on natural fibres of interest to developing countries. While it is beyond the scope of this paper to exhaustively examine the various non-tariff measures affecting JACKS, cellulosic packaging and PLA, some observations based on literature review are also provided. Similarly, although the analysis does not attempt a detailed examination of tariff-elimination schedules for JACKS and other substitutes under various RTAs, it offers some observations on the implications and issues for RTAs and preferential agreements.
5.1. Import tariffs on JACKS fibres and derived goods
Table A8 provides an overview of the average applied MFN as well as bound tariffs on JACKS goods and select manufactures derived from JACKS fibres in several major markets in both developed and developing countries. The data suggest that large developing countries generally apply higher tariffs on JACKS fibres and on listed manufactured goods such as twine, cordage, sacks and bags and floor coverings. The United States market appears to be particularly attractive due to import tariffs being bound at zero for a few fibres as well as manufactures. In the European Union, there is scope for further reduction or elimination of applied MFN tariffs for value-added products such as coir-floor matting and for cords and ropes of sisal and abaca (where average applied tariffs range from 7 to 12 per cent).
On the other hand, it is also worth keeping in mind that two of the largest LDC exporters, namely Bangladesh (for jute) and United Republic of Tanzania (for sisal), already enjoy duty-free quota free access to the European Union market under the ‘Everything but Arms’ initiative. A number of other developing country exporters to certain developed country markets might also benefit from various unilateral preferential schemes (Chang, 2013). In such cases, it will be important to examine whether the benefits of such preferential access may be adversely impacted by any reduction in overall applied MFN tariffs or through reciprocal trade agreements (so called tariff erosion). Another issue is that many developing countries and LDCs have been unable to take advantage of preferential schemes “due to stringent product specific rules of origin provisions,” such as exist in the case of the European Union’s Generalised System of Preferences (GSP) and its Everything but Arms initiative (Ibid). In the case of the United States, developing countries and their producers also express concerns that the availability of preferences is uncertain over time, as “GSP treatment is suspended if imports of an eligible product from a single country exceeds a specified threshold limit” (Ibid) (which can be waived in certain cases).17
In many large developing countries, there is scope to reduce tariffs on JACKS fibres and derived goods or at least to bind them (in cases where tariffs are presently unbound and can be raised without any ceiling limits). At present, a pattern of tariff escalation is present in many developing countries, where applied tariffs for manufactured goods are higher than that those of raw fibres. Major jute fibre producing countries such as China and India are also key importers of jute fibre; in such cases, it is possible that the higher tariffs, particularly in India and in smaller producers such as Thailand, may be in place to retain the flexibility to protect domestic jute industries.18 This observation underlines that while opening up developing country markets may be desirable from the perspective of greater uptake of natural fibres, any market opening strategy will also need to respond to concerns of domestic fibre producers and manufacturers. In line with the wider interest of many developing countries in promoting South–South trade, it would be useful to explore specific options for South–South market openings for trade in JACKS fibres and derived goods (e.g., such as through UNCTAD’s Global System of Trade Preferences among developing countries).19

21ISSUES AND OPTIONS FOR TRADE POLICYMAKERS
5.2. Import tariffs on packaging material of conventional polymers, paper and cellulosic and PLA
Average applied MFN import tariffs for packaging material made from conventional polymers in major developed country markets, such as the United States and European Union, are generally below 6.5 per cent, whereas they are bound at zero for packaging made out of paper and paperboard as well as cellulosic wadding. For PLA, applied import tariffs are fairly low at 3.3 per cent in the United States (a major producer) and at zero for the European Union. Thus, overall average of applied tariffs on conventional polymer packaging is equivalent to the bound rates ranging from 1.5 to 3 per cent in the United States and 3.3 to 6.6 per cent in the European Union. This also means that applied tariffs cannot be increased on these products beyond these bound ceilings. This has implications on the extent to which these countries can use import tariffs as a trade policy tool to disincentivize conventional packaging material relative to bio-based substitutes.
Developing countries listed in Table A9 generally do not reveal a tariff preference skewed in favour of paper and cellulose-based packaging, except for Republic of Korea, which has a zero rate for both applied and bound duties for paper and cellulose-based packaging, and China, where applied tariffs for paper and cellulose-based packaging are half the rates prevailing for conventional polymer-based packaging. In Thailand and Mexico, the average applied tariffs on paper and cellulose-based packaging are higher than packaging material made of conventional polymers (such as in the case of ethylene-polymer-based packaging in Mexico). Import tariffs on PLA are generally in the same range as those applying to conventional polymer packaging except in the case of Mexico, which applies zero tariffs to PLA packaging (while still maintaining high bound tariffs at 35 per cent). Developing countries may wish to consider providing greater import tariff-based incentives to paper and paper-based packaging as well as cellulosic packaging.
5.3. Non-tariff measures affecting non-plastic substitutes
Exporters of JACKS face an array of NTBs, including “strict packaging and labelling requirements, sanitary and phytosanitary (SPS) measures, complex and
bureaucratic customs and administrative procedures and import licensing requirements on the exports of processed fibre products.”20
One challenge relates to the use of chemical products to fumigate fibres. Methyl bromide has been widely used to fumigate fibres placed in wooden crates or packed in wooden pellets. Several countries have banned or phased out the use of methyl bromide pursuant to obligations to phase-out its use under the Montreal Protocol on Substances that Deplete the Ozone Layer. The Protocol initially set deadlines for phase-out of methyl bromide by 2005 and 2015 for developed and developing countries, respectively.21 In practice, it has been difficult to find an effective low-cost alternative fumigant to deal with a large number of pests22 and its use is still permitted for phytosanitary and biosecurity purposes.23 Many countries have, however, banned its use, while others such as China and India still use it.24 This has created a lot of confusion for exporters.25 There are also a plethora of standards in importing countries that has also raised compliance costs. For example, “in Australia, sacks and woven fabrics require certification that industrially processed JACKS have originated from pest-free crops, while Japan requires additional certification for blended products depending on the specific percentage of certain JACKS in the fabric.”26 Harmonization and simplification of many of these standards could be considered. In addition, there are also numerous private standards regarding health, environment, child labour, fair wages and working hours. These are often legitimate requirements, but can raise costs for producers. Capacity building efforts as well as developing country and producer engagement in negotiations around standards will be necessary to overcome implementation-related challenges.
In the area of domestic support (subsidies) and other trade-distorting measures, JACKS fibres are not subject to reduction commitments as the major producing and exporting countries(mainly developing countries), typically do not provide any support. Natural bio-based competing products such as flax and linseed are also usually not subject to export-related support. However, support provided to conventional polymers including fossil-fuel subsidies at the upstream stage could enable price distortion in favour of conventional polymers.
Some of the biggest impacts on the use of paper and cellulosic packaging could come from evolving packaging- related requirements such as those based
22 MATERIAL SUBSTITUTES TO ADDRESS MARINE PLASTIC POLLUTION AND SUPPORT A CIRCULAR ECONOMY:
on the European Union’s Circular Economy Action Plan (European Union, 2020). The Plan prioritizes the reduction of over packaging and packaging waste. It provides an impetus to design reusable and recyclable packaging and to make packaging materials simpler. Further, the Plan also considers among others the following measures:• Mandatory plastic requirements for recycled
content;• Waste reduction measures for key products such
as packaging address intentionally added micro plastics;
• Labelling and regulatory measures on unintentionally released micro plastics; and
• Policy frameworks on the use of bio-based plastics.
In order to ensure that all packaging on the European Union market is reusable or recyclable in an economically viable way by 2030, the European Commission will review its Directive 94/62/EC27 to reinforce the mandatory essential requirements for packaging to be allowed in the European Union market and consider additional measures, with a focus on:• Reducing (over) packaging and packaging waste,
including by setting targets and other waste prevention measures;
• Driving design for re-use and recyclability of packaging, including considering restrictions on the use of some packaging materials for certain applications, in particular where alternative reusable products or systems are possible or consumer goods can be handled safely without packaging;
and• Considering reducing the complexity of packaging
materials, including the number of materials and polymers used.
As part of the initiative to harmonize separate collection systems, the European Union will also assess the feasibility of European Union-wide labelling that facilitates the correct separation of packaging waste at source and establish rules for the safe recycling of plastic materials into food contact materials other than PET (Packaging Insights, 2020). It is too early to assess the impacts of these measures on exporters of plastic substitutes including JACKS fibres and other natural materials or bio-based biodegradable polymers. However, it is clear that there will certainly be an impact given the importance of the European Union as an export market. Some of the requirements may have to be balanced against other environmental, health or safety considerations, which may continue to necessitate the use of plastics, particularly for perishable food products. However, it is becoming increasingly clear that for single-use plastics and other applications where the use of plastics may not be strictly necessary, there are good opportunities for considering substitution. This applies particularly for traditional natural materials that are sustainably produced and that can lead to economic benefits for developing countries. In order to give plastic substitutes a better edge in competing with conventional polymers, trade policy initiatives can also play an important role.
23ISSUES AND OPTIONS FOR TRADE POLICYMAKERS
6. TRADE POLICY INITIATIVES TO SUPPORT PLASTIC SUBSTITUTES: FROM EARLY HARVESTS TO A LONG-TERM GAME PLAN
Trade policy initiatives can make a positive contribution towards levelling the playing field between conventional polymers (which often benefit from fossil-fuel subsidies) and their environmental-friendly (and friendlier) substitutes. Addressing tariff and NTBs impeding the freer global flows of substitutes would lower the cost of access, and consequently the cost of deployment and environmental compliance with regulatory requirements aimed at reducing plastic waste through substitution with eco-friendly substitutes. It would also incentivize further production of such substitutes and spur the creation of green jobs, particularly in rural areas in developing countries that produce the necessary feedstock for those substitutes. At the same time, trade-related measures aimed at opening markets would also need to be accompanied by complementary flanking policies targeted at sustainable consumption and production through environmental regulation and sustainability standards, as well as strategic market opening and investments in allied goods and services (such as those related to agriculture, forestry, recycling and waste management) to achieve maximum impact (UNEP, 2018).
Trade policy initiatives to promote plastic substitutes can be pursued through several channels. Some of them, such as unilateral trade and related domestic measures, can be taken fairly immediately in the short term. Other options such as the pursuit of plurilateral, regional and bilateral agreements aimed at liberalizing environmental goods and services and involving major plastic producing and consuming nations could take longer time frame. Such agreements could build-in ‘early-harvest’ initiatives to promote plastic substitutes. A truly multilateral initiative, ideally involving all WTO members, is desirable, but will require a more long-term perspective given the challenges of multilateral negotiations that can encompass a diverse set of issues and sectors.
6.1. Options for liberalization6.1.1. Unilateral trade policy action
Unilateral trade policy action is a fairly easy step for any country provided that the measures taken are compliant with WTO rules and the country’s trade obligations. These measures can be introduced and implemented quickly. Unilateral border measures could include unilateral reduction or elimination of applied and/or bound tariffs on plastic substitutes (with bound tariff levels providing certainty on ceiling levels up to which a country may raise tariffs if need be). Countries can also introduce bindings on any tariff-levels that are unbound as well. They also have the option of raising import tariffs on conventional polymers up to permissible bound levels under their individual tariff schedule commitments under WTO. One issue of course is that many countries usually aim at ambitious elimination of import duties on all, if not most of their tariff lines, as part of commitments under various regional or bilateral trade agreements. In such cases, it may be impossible to raise those import tariffs back up again on conventional polymers without violating their obligations towards their bilateral or regional trade agreement partners.
In addition, countries can take unilateral behind the border measures that could have a trade impact, but may be permissible under WTO law if they are non-discriminatory among trade-partners (Article 1 of the GATT – “Most-Favored Nation”) and if they do not discriminate between imported and domestic “like-products” (Article III of GATT – “Non-discrimination”). Such measures could include taxes, charges or regulatory requirements. Further, countries could follow “green-procurement” policies, whereby procurement preference was granted by government entities to plastic-substitutes or to firms that used them whether produced domestically or imported. Other measures could be aimed at unilateral liberalization of environmental services sectors such as waste management and plastic recycling services (including facilities that could safely compost or recycle biodegradable bio-based polymers such as PLA and PHA) with the aim of attracting foreign investment in these sectors (in effect ‘Mode 3’-type of services trade liberalization that involves foreign investment). Complementary domestic regulatory measures would then also need to be introduced.
In the interests of promoting greater “South-South” trade in natural fibre products as well as lowering costs of access (particularly where domestic production is minimal), developing countries could also consider eliminating or at least significantly lowering their import

24 MATERIAL SUBSTITUTES TO ADDRESS MARINE PLASTIC POLLUTION AND SUPPORT A CIRCULAR ECONOMY:
tariffs from the current high levels unilaterally or by extending non-binding preferential tariff treatment to each other through UNCTAD’s Global System of Trade Preferences (GSTP). This would enable greater uptake of natural fibres such as jute and their products and give it a competitive leg-up in levelling the playing field with conventional polymers that very often benefit from upstream fossil-fuel subsidies unlike natural fibres. In 2019, developing countries highlighted the urgency of revitalizing South-South trade cooperation under the GSTP during the 31st session of the Committee of Participants in Geneva, Switzerland (UNCTAD, 2019). One option could be to call for further ratifications and the entry into force of the Sao Paulo Round among developing countries and to promote a new green round of the GSTP to foster South-South cooperation on trade in non-plastic substitutes and other environmental goods.
6.1.2. Trade agreements to fast-track liberalization of environmental goods and services
Another trade policy related initiative for the medium term would be to consider the inclusion of natural substitutes to plastics, such as traditional fibres, as environmental goods for accelerated liberalization within plurilateral, bilateral or regional trade negotiations. Such negotiations could either be stand-alone negotiations on environmental goods such as the plurilateral negotiations for an Environmental Goods Agreement (EGA) that were launched on 8 July 2014 by 18 participants27 representing 46 WTO members (including European Union member states). Once operationalized, the EGA will be an open plurilateral agreement, where its benefits are to be extended on an MFN basis to all WTO members. While the negotiations have been stalled since December 2016, owing to a lack of agreement on the final coverage of the list, as well as on a draft agreement text, it is possible that the talks may be revived once again (ICTSD, 2016). This could be an opportunity for more developing countries to participate and push for the inclusion of plastic substitutes, such as natural fibres for example, within any environmental goods list.
While the complete list of 304 products, including the 15 sensitive ones that were under consideration in 2016 (UNEP, 2018) are not yet in the public domain, an earlier list of 650 products nominated by participants for EGA negotiations has also been published by Transport and Environment, a Brussels-based non-governmental organization (Transport
and Environment, 2015). This organization analyzed the later list and highlighted products with positive as well as negative environmental effects. Among the environmentally endorsed products in that list Transport and Environment pointed towards a number of bio-based polymers such as bio-polyethylene (LDPE and PE), bio-polyethylene terephthalate (PET) as well as polyester pellets recycled from other used polyester products as environmental-endorsed products. It also includes bio-polyester fibres, building materials made of sustainable natural materials, mats and screens made of natural materials (including biodegradable vegetable materials).28 However, some of the traditional natural fibres of interest to many developing countries and LDCs such as jute, abaca, coir, kenaf and sisal have not been explicitly included in the list. A number of conventional polymer items put forward by many WTO members have been categorized under a list of ‘environmentally rejected items’ by Transport and Environment.29 Notably, the proposing WTO members have justified the inclusion of these items based on their environmental end-use applications as well as on basis of being recycled. For example, plastic geomembranes have been proposed for their soil protection and water-tightness. This also highlights the dilemma around many kinds of polymers where their environmental end-uses may be beneficial given their durability of use, though many experts and stakeholders might have different perspectives as their inclusion in the list of environmentally rejected reveals.
Bilateral and regional trade agreements (RTAs) also hold out promise for inclusion of plastic substitutes. All 164 members of the WTO are now party to at least one RTA; as of 2019, each member had on average 11 RTA partners. However, a review of bilateral trade agreements and RTAs reveals that most agreements aim to liberalize trade across the board and most, if not all, goods would be subject to low or zero duties. Broad-based liberalization across HS 6-digit tariff headings would, therefore, not only automatically capture environmental goods including many plastic substitutes, but also conventional polymers. It is revealing that of the 270 RTAs notified to the GATT or the WTO between 1956 and 2016, provisions referring to trade in environmental goods, services and technologies are found in 129 agreements: 26 refer to the promotion of trade in environmental goods and services, 101 agreements contain schedules of commitments on environmental services, and only two contain an agreed list of duty-free environmental goods (UNEP, 2018). These include the New Zealand-Taiwan

25ISSUES AND OPTIONS FOR TRADE POLICYMAKERS
Province of China FTA (ANZTEC), which includes a separate annex listing environmental goods, where tariffs were to be eliminated immediately upon entry into force of the agreement.30 The ANZTEC annex list does not include any specific substitutes to plastic, but it does contain provisions on addressing non-tariff measures and further “encourage the application of good regulatory principles to the design of any future standards and regulations relating to environmental goods and services, including transparency, proportionality, a preference for least trade-distorting measures, and the use of internationally agreed standards.”31 These kind of provisions as well as a number of other provisions included in numerous other RTAs that relate to technical co-operation and capacity building as well as provisions on not weakening or failing to enforce existing environmental laws and in certain RTAs, pledges to achieve high levels of environmental protection, often accompanied by a pledge to strengthen the relevant laws over time could also be relevant and useful templates for other future agreements where plastic substitutes may be included. Thus, substitutes to plastics should be promoted not just through trade liberalization efforts, but placing them in a broader context where the strengthening of overall environmental laws facilitate their deployment.
A number of references have been made, for example, that are relevant to sustainable production and consumption and the circular economy in many of the FTAs signed by the European Union and may also have implications for the promotion of plastic substitutes. A listing of such agreements is provided in Table A12.
Another regional initiative (albeit voluntary), and the only one covering environmental goods specifically, is the Vladivostok APEC Agreement on environmental goods. The agreement was concluded by 21 Asia-Pacific Economic Co-operation (APEC) economies in Vladivostok on 9 September 2012 whereby they agreed to voluntarily reduce applied tariffs on 54 product categories or HS six-digit subheadings containing environmental goods to no more than 5 per cent.32 The list of products, however, only contains one example of a natural plastic alternative, namely ‘Other Assembled Flooring Panels, Multilayer, of Bamboo’.33
6.1.3. Multilateral agreement on environmental goods under the WTO
Ideally, a multilateral agreement on environmental
goods concluded within the WTO framework could be an excellent opportunity for inclusion of plastic substitutes. While a plurilateral agreement could offer the same benefits once extended on an MFN-basis, non-participation in plurilateral negotiations by many developing countries and LDCs may lead to the risk of exclusion of such products. Multilateral negotiations, on the other hand, may take longer to conclude given the diversity of interests among the larger WTO membership on the coverage and level of ambition of environmental goods liberalization. The challenges would be even greater if such talks were part of a ‘single-undertaking’ round of negotiations that comprised many other issues and sectors unrelated to environmental goods. A single-undertaking that has so far been the model adopted by WTO members allows for cross-linkages and ‘give and take’ between various negotiating agendas such as agriculture, industrial goods, services, and rules. However, they also increase the risk that a successful outcome of environmental goods is dependent on the outcome in other negotiating arenas as well.
This is well illustrated by the stalling of multilateral negotiations on environmental goods and services that were launched as part of the Doha Round in 2001. While there were a number of views on what should be considered as an ‘environmental good’ as well as on negotiating modalities, the talks saw a number of environmentally preferable products (EPPs) including natural fibres being proposed for inclusion. New Zealand, for instance, included products based on end-use or disposal characteristics such as organic fertilizers, soaps made from natural oils and biodegradable sacks and bags (including those made from jute). The United States included seven products from a list of 152 potential EPPs that were previously identified by UNCTAD (UNCTAD, 1995). These included sisal and other textile fibres from raw agave, yarn of vegetable textile fibres, jute sacks and bags as well as twines, ropes and cables made of sisal and similar fibres (WTO, 2019). The European Union and a few other members proposed various vegetable textiles fibres, pulp of natural fibres derived from recovered fibrous cellulosic material and not chemically treated, paper and paperboard items and Japan proposed recycled paper. Other notable examples of EPPs proposed by Switzerland include: (a) ceramic articles; (b) natural polymers (e.g., alginic acid); (c) modified natural polymers (e.g. hardened proteins and chemical derivatives of natural rubber); (d) natural rubber, balata, gutta-percha, guayule,
26 MATERIAL SUBSTITUTES TO ADDRESS MARINE PLASTIC POLLUTION AND SUPPORT A CIRCULAR ECONOMY:
chicle and similar natural gums; (e) agglomerated cork; and (f) natural fibres such as flax, jute and agave. In addition, many countries also proposed conventional plastic items with environmental applications as well as polystyrene waste and scrap and other plastic waste and scrap for recycling. All these products and materials could be of potential interest to consider for future initiatives including for a plurilateral EGA as well.
Despite this, Doha round talks on environmental goods stalled given the overall challenge of reaching an agreement on several other negotiating mandates. Defining and classifying environmental goods threw up specific challenges, and sensitivities also arose around the impact of liberalization on domestic manufacturing and services sectors. Lack of perceived export opportunities resulted in less than proactive engagement on the part of many developing countries. Issues such as non-tariff measures and questions of dealing with technological change and technology transfer were also not addressed, although certain proposals on addressing non-tariff measures on all industrial goods were made in the context of WTO Non-Agricultural Market Access negotiations (UNEP, 2018).
6.2. Other trade-related measuresIn addition to specifically including natural substitutes to plastic as part of market access package within negotiations, four other trade-related measures could be supportive of the overall scale-up and diffusion of bio-based and biodegradable substitutes to conventional plastic.
6.2.1. Greater clarity and visibility of conventional plastic substitutes within the Harmonized System
It may be a good option to further review the extent to which plastic substitutes are clearly reflected within the Harmonized System (HS). While a number of natural fibres, such as jute, coir and sisal, as well as some derived products and polylactic acid (a biopolymer) may have their own specific HS-6 subheadings, this may not be the case with a number of other plastic substitutes (e.g., chitosan). Identification of certain niche categories of alternative natural materials and bio-based polymers at the HS 6-digit subheading is desirable as it easily facilitates global comparison of trade flows, but it may be difficult to implement. The World Customs Organization (WCO) sets a trade volume threshold of US$50 million for a product group to obtain a HS-6-digit subheading, and US$100
million threshold to obtain a 4-digit subheading. However, in previous review cycles of the WCO (that take place every 5 years), exceptions have been made for social and environmental reasons.34 There have also been additions and amendments of categories and HS 6-digit subheadings to help countries comply with their obligations under the multilateral environmental agreements to combat illicit trafficking in endangered species. This could provide countries with an opportunity to propose specific amendments as they deem appropriate at the WCO to ensure better visibility for natural materials and bio-based polymers as production and trade begin to scale-up.
6.2.2. Trade and investment-related initiatives on plastics recovery, recycling and compositing
Plastics-related waste management, recovery and recycling involve the deployment of technologies combined with the provision of services. It is necessary for countries to have adequate number of facilities that can adequately treat both conventional as well as bio-based polymers separately to enable an ecosystem that facilitates recycling and recovery of conventional plastic as well as to promote greater use of non-conventional substitutes such as bio-based polymers. There may be a role for private sector to provide such services in developing countries as well. In that regard, trade negotiations on environmental services may be as important to pursue as those on environmental goods. Trade in environmental services normally takes place through the following modes of delivery:
a. Mode 1: Cross-border trade in services (e.g., the provision of environmental consulting services through the internet);
b. Mode 2: The movement of consumers abroad to consume a service in the country of origin (e.g., environmental services industry professionals attending a paid training or university programme abroad);
c. Mode 3: Commercial presence involving the establishment of a foreign environmental service provider in the host country (e.g., a German or French wastewater treatment company establishing a subsidiary in China to deliver services); and
d. Mode 4: Temporary movement of natural persons abroad to deliver a service in the host country (e.g. temporary movement of Indian professionals to install air-pollution control equipment in a factory in Bangladesh).

27ISSUES AND OPTIONS FOR TRADE POLICYMAKERS
Both as part of the WTO General Agreement on Trade in Services (GATS) ‘built-in’ agenda on services liberalization as well as in subsequent regional trade agreements (RTAs), several countries have tabled market access offers on various types of environmental services. The classification approaches on environmental services followed have been Services Sectoral Classification List (also called W/120) issued by the WTO Services Trade Council and is based on the United Nations’ Central Product Classification (CPC). The W/120 list contains 12 categories, four of which are specific to environmental services: (i) sewerage services, (ii) refuse disposal services, (iii) sanitation and similar services, and (iv) other (cleaning services for exhaust gases, noise abatement services, nature and landscape protection, and other environment services not elsewhere classified).
Other members such as the European Union have proposed more updated classifications. The European Union’s proposed classification system comprised ‘core’ services that could be classified as ‘purely’ environmental and correspond to environmental media (such as air, water, solid and hazardous waste, noise, etc.), in addition to a ‘cluster’ of services such as design, engineering, R&D and consulting with an environmental end-use (Claro et al. 2007). Presently, Members are free to make use of their own classification and can also specify and limit liberalization to distinct sub-sectors such as “plastics recovery and recycling” within a broader category such as “Solid and Hazardous Waste Management.” If they liberalize the entire solid and hazardous waste management sector, then plastics recovery and recycling would presumably automatically be included. Members can also specify conditions associated with the liberalization of a service sector. For example, they can require that training be provided to domestic workforce in using certain technologies or can also specify the type of technologies that companies need to utilize to provide the service. Further research could be conducted on how environmental services liberalization has worked on the ground and whether it has also led to the creation of new and better recovery, recycling and waste management facilities for conventional and bio-based polymers.
At the WTO, requests and offers for market access in various environmental services sectors have been made, both under the multilateral Doha round of WTO negotiations as well as under plurilateral negotiations on a Trade in Services Agreement (TiSA) that was
being negotiated by 23 WTO members,35accounting for 70 per cent of world trade in services (European Commission, 2016). These have included requests and offers applying to broad service categories such as solid waste management. They do not, however, to the best of the authors’ knowledge (given the confidential nature of many requests and offers) contain specific requests, offers or carve-out clauses pertaining to plastics-related services. No binding commitments have yet been made under the WTO Doha round or under TiSA on environmental services.
On the other hand, “a large number of RTAs, namely 101 agreements include specific commitments on the liberalisation of environmental services” (Monteiro, 2016). A complete review of the environmental services commitments encountered in RTAs was outside the scope of this paper, but a preliminary analysis conducted at the WTO shows that specific commitments already made have covered environmental services such as “sewage services, refuse disposal services, sanitation services, cleaning of exhaust gases, noise abatement services, nature and landscape protection services, and other environmental protection services” (Monteiro, 2016). Under the positive list method to services liberalization, only the services sectors and the matters covered by liberalization or open to partner countries are included in the scheduling list (Setiawan, 2018). In some cases, environmental services commitments are ‘GATS plus’. Under the Mexico–Costa Rica RTA, for instance, Mexico has fully liberalized trade in environmental services, except for horizontal limitations on public services or public utilities, which were completely excluded from its GATS schedule.
Some RTAs follow a ‘negative list’ approach. In such cases, “all covered sectors and sub-sectors are assumed to be liberalised, unless non-conforming measures are incorporated in the annex to the RTA. In other words, an environmental service is assumed to be liberalised, unless it is explicitly listed in the RTA.” In a number of RTAs, some specific environmental services, such as “the provision of water supply, wastewater services, solid and hazardous waste management, and sanitation services, are subject to some restrictions and included on negative lists.” The reservations that countries include take various forms, and have included references to the existence of a public monopoly, nationality requirements, concession requirements, or an obligation for foreign service
28 MATERIAL SUBSTITUTES TO ADDRESS MARINE PLASTIC POLLUTION AND SUPPORT A CIRCULAR ECONOMY:
providers to establish a local commercial presence (Monteiro, 2016). Tables A10 and A11 provide an overview of RTAs from the ASEAN region, noting those that follow a positive or negative list approach.
6.2.3. Attracting foreign investment for plastic substitutes
Smaller developing countries including LDCs could consider incentives that could attract foreign investment to build manufacturing capacity and support new innovative products from raw natural fibres, such as food-grade packaging and non-plastic substitutes for synthetic materials used in the interiors of cars. As in other sectors, however, investors may still need certain pre-conditions such as political stability and a predictable regulatory regime. There could also be scope for South–South investment flows given the similarity of raw materials and conditions that might prevail. Bilateral investment agreements and eventually a multilateral investment framework could be a good vehicle for supporting the development of an attractive regime for investors. Countries may also wish to assess the scope for improving their domestic investment regimes and regulatory frameworks to attract foreign investors.
6.2.4. Technical and technology co-operation, assistance and capacity building measures
In order to build both supply-side capacities for the production of natural substitutes in addition to enabling developing countries and LDCs to access technologies and know-how as well as introduce regulatory frameworks (such as on worker safety and health), pursuing technical and technology co-operation, assistance and capacity building measures are important. These will be required as part of a holistic response to not just dealing with conventional plastic
and bio-based polymer waste, but also on setting up modern re-use, recovery and recycling systems that will be essential to reduce marine pollution and enable a circular economy. Access to technologies and know-how may happen through greater liberalization of services but then again, they may not if various other market and regulatory factors that encourage investors are not present. Further, technologies also need to be appropriate to the needs, priorities and realities of developing countries as well.
A clearer understanding of the dynamics of how trade as well as additional factors such as intellectual property policies and licensing can drive technology adoption and diffusion within the plastics-related environmental services. In addition, a better understanding of what ecosystems for recovery, recycling and re-use work or not in different country contexts will also be desirable for better policy formulation. The role of the private sector will be critical and existing initiatives could be leveraged further with the specific aim of technologies and know-how not only to enable better recycling and disposal of conventional polymers, but also substituting plastics using fully compostable materials that are as versatile and close to the desired end-use characteristics of single-use plastics. Initiatives such as WIPO Green, an online platform for technology exchange that connects providers and seekers of environmentally friendly technologies, is one example of collaborative initiative that can directly benefit the private sector. The platform assembles technologies ranging from prototypes to marketable products at various stages of development in a single place. The technologies listed on the platform are reportedly available for license, collaboration, joint ventures and sale. The platform includes eco-friendly technologies as well as technology ‘needs’ in its database (WIPO, 2021).
29ISSUES AND OPTIONS FOR TRADE POLICYMAKERS
7. CONCLUSION AND RESEARCH GAPS
Plastic substitutes can prove to be reliable substitutes to conventional polymers for many types of end-uses. At the same time, they can face a number of opportunities as well as challenges for scale-up depending on the material under consideration. These relate to factors such as costs, physical properties, and versatility of use as well as environmental impacts at the production, use and disposal compared to conventional polymers. For most developing countries, traditional materials such as natural fibres may represent the ‘lowest-hanging fruit’ for substitution given that they are producers of many of the related natural feedstocks which also provide opportunities for exports and jobs including in rural areas. Further, many developing countries may lack the widespread industrial composting facilities that are required to deal with bio-based polymers, which do not biodegrade in the natural environment. Single-use packaging as well as textiles, which are a major source of plastic pollution, could be particularly amenable to the use of natural materials. At the same time scaling up the production and trade in natural materials could also have land-use, food security and other environmental implications such as pollution and energy use. As far as possible, it may be preferable to rely on agricultural and other plant waste as compared to food crops.
Regarding wood and forestry for cellulose, care should be taken as far as possible to acquire such material from certified sustainable sources. Tariff and NTBs still need to be addressed by developing countries to take full advantage of market access opportunities for many traditional materials such as natural fibres. Unilateral, bilateral, regional and plurilateral trade initiatives can play a positive role in this regard. In particular, by liberalizing trade in natural materials, trade policy can play a role in levelling the playing field particularly given the cost-advantages that conventional polymers enjoy (quite often due to fossil-fuel subsidies provided upstream).
The time horizon for implementation will vary depending on the type of trade initiative and some may represent good opportunities for an ‘early harvest’, whereas a multilateral deal involving all WTO members will need a long-term perspective. However, in additional to trade liberalization for natural materials, several other supportive measures if taken can have
a positive impact and further strengthen benefits. These could include enabling greater clarity and visibility of conventional plastic substitutes within the Harmonized System, pursuing trade and investment-related initiatives related to plastics recovery, recycling and composting under environmental services negotiations and pursuing technical and technology co-operation, assistance and capacity building measures. These will enable developing countries in particular to establish a proper ecosystem comprising regulations, infrastructure, technology and know-how to enable effective recovery, recycling and composting where possible for conventional plastics and bio-based polymers as well as safe collection and disposal of plastic waste through solid waste management systems (which services trade and investment flows can also help strengthen).
Looking ahead, there are a number of information and knowledge gaps that need to be addressed in order to inform sound and effective policymaking around plastics substitutes. These include (but are not limited to) the following:• To what extent can better clarity and visibility be
provided for alternative materials (natural materials, bio-based polymers as well as ecofriendly additives) as well as products manufactured from them within the Harmonized System? This could help trade officials during negotiations as well as officials, researchers and others in better monitoring and tracking trade-flow data for these materials and products.
• To what extent are the necessary regulations and infrastructure (such as industrial composting facilities) available for bio-based polymers across countries and particularly in developing countries? Do plastic pollution hotspots have access to adequate recovery, recycling and disposal facilities for conventional polymers? Can a mapping be done of such facilities worldwide? What lessons or best practices can be learnt from specific country experiences? This could also help with formulating strategies for these countries with regard to trade and investment in environmental services such as solid waste management systems to deal with plastic wastes and bio-based polymers as well as enable a better channeling of technical assistance efforts.
• To what extent has trade liberalization and foreign investment enabled developing countries to have access to technologies and know how required for effective management of plastic wastes as well

30 MATERIAL SUBSTITUTES TO ADDRESS MARINE PLASTIC POLLUTION AND SUPPORT A CIRCULAR ECONOMY:
as to handle bio-based polymers? What roles do
intellectual property regimes and licensing issues
play? Are there lessons that can be learnt from
actual country experiences in this regard?
• What impacts will the European Union circular
economy action plan have on plastics and
packaging industries across the world? Will the European Union standards become the global normal as supply chains adjust to them? What opportunities will it open for developing countries for use of different types of plastic substitutes? What compliance-related challenges will it bring for developing country exporters?
31ISSUES AND OPTIONS FOR TRADE POLICYMAKERS
ReferencesBarrowclough D and Birkbeck C Deere (2020). Transforming the global plastics economy: The political economy
and governance of plastics production and pollution. Global Economic Governance Programme. Working Paper No.142. Available at https://www.geg.ox.ac.uk/publication/transforming-global-plastics-economy.
Barrowclough D, Birkbeck C Deere and Christen J (2020). Global trade in plastics: insights from the first life-cycle trade database. UNCTAD Research Paper No. 53 (UNCTAD/SER.RP/2020/12) Available at https://unctad.org/system/files/official-document/ser-rp-2020d12_en.pdf (accessed 4 February 2021).
Deere Birkbeck C and Sugathan M (2021). How Can International Trade Policy Help Tackle Plastics Pollution? Policy Options and Pathways, Graduate Institute Global Governance Centre and Forum on Trade, Environment & the SDGs (TESS): Geneva.
Chang K (2013). Policy developments affecting jute and hard fibres markets and their implications for production and trade. FAO Commodity and Trade Policy Research Working Paper No. 43: 4–5. Available at http://www.fao.org/3/i3573e/i3573e.pdf.
Claro et al. (2007). Trade in environmental goods and services and sustainable development: Domestic considerations and strategies for WTO negotiations. Policy Discussion Paper. Geneva: International Centre for Trade and Sustainable Development. Available at http://egs.apec.org/uploads/docs/ICTSD_TradeInEnvironmentalGoodsAndServices.pdf.
ECTC (2020). Biodegradable plastic and world biopolymers market 2019--2020. See https://ect-center.com/blog/bio-based polymers-market-2019#rec177415149.
European Bioplastics (2019). Bioplastics market data 2019. Available at https://docs.european-bioplastics.org/publications/market_data/Report_Bioplastics_Market_Data_2019.pdf.
European Commission (2016). Trade in services agreement factsheet. Available at https://trade.ec.europa.eu/doclib/docs/2016/september/tradoc_154971.doc.pdf.
European Commission (2018). Knowledge for policy. Bioplastic. See https://knowledge4policy.ec.europa.eu/glossary-item/bioplastic_en.
European Union (2020). Circular economy action plan. See https://ec.europa.eu/environment/strategy/circular-economy-action-plan_en.
FAO (2019). Current market situation and medium-term outlook for jute and kenaf; sisal and henequen; abaca and coir. Available at http://www.fao.org/fileadmin/templates/est/COMM_MARKETS_MONITORING/Jute_Hard_Fibres/Documents/IGG_40/19-CRS_1_Current_Situation_and_Outlook_01.pdf.
FAO (2018). Jute, kenaf, sisal abaca, coir and allied fibres. Statistical bulletin. See http://www.fao.org/fileadmin/templates/est/COMM_MARKETS_MONITORING/Jute_Hard_Fibres/Documents/Final_Statistical_Bulletin_2018_for_PWS.pdf.
Gallo F et al. (2018). Marine litter plastics and microplastics and their toxic chemicals components: the need for urgent preventive measures. Environmental Sciences Europe. 30(1): 13. Available at https://www.ncbi.nlm.nih.gov/pmc/articles/PMC5918521/.
ICTSD (2016). Ministerial talks to clinch environmental goods agreement hit stumbling block. Bridges Weekly, 8 December 2016. Geneva: International Centre for Trade and Sustainable Development. Available at https://ictsd.iisd.org/bridges-news/bridges/issue-archive/ministerial-talks-to-clinch-environmental-goods-agreement-hit.
Inkwood Research (2019). Global polylactic acid market forecast: 2019–2028. Available at https://www.inkwoodresearch.com/reports/polylactic-acid-market/.
Lackner M (2015). Bioplastics - biobased plastics as renewable and/or biodegradable alternatives to petroplastics. Kirk-Othmer Encyclopedia of Chemical Technology. Available at https://www.researchgate.net/publication/276060634.
Monteiro JA (2016). Typology of environment-related provisions in regional trade agreements. Working Paper ERSD-2016-13. WTO: Geneva. Available at https://www.econstor.eu/bitstream/10419/145110/1/866032118.pdf.
Mordor Intelligence (2021). Bio-polylactic acid (PLA) market – growth, trends, covid-19 impact, and forecast (2021-2026). Available at https://www.mordorintelligence.com/industry-reports/bio-polylactic-acid-pla-market.
OECD (2018). Improving plastics management: Trends, policy responses, and the role of international co-operation and trade. OECD Environment Policy Papers. No. 12. OECD Publishing: Paris. Available at https://doi.org/10.1787/c5f7c448-en.
32 MATERIAL SUBSTITUTES TO ADDRESS MARINE PLASTIC POLLUTION AND SUPPORT A CIRCULAR ECONOMY:
Packaging Insights (2020). EU Circular Economy Action Plan re-intensifies drive for eco-friendly packaging. Available at https://www.packaginginsights.com/news/eu-circular-economy-action-plan-reintensifies-drive-for-sustainable-packaging.html.
Setiawan S (2018). Negative list in services liberalisation for ASEAN developing countries. International Journal of Economics and Financial Issues. 8(5): 11–20. Available at https://ideas.repec.org/a/eco/journ1/2018-05-3.html.
Stakeholders in Methyl Bromide Reduction (STIMBER) (2021). FAQs: Phytosanitary fumigation for export logs and timber products. Available at http://www.stimbr.org.nz/methyl-bromide-faqs.html.
The Pew Charitable Trusts and SYSTEMIQ (2020). Breaking the plastic wave: A comprehensive assessment of pathways towards stopping ocean plastic pollution. Available at https://pew.org/32KPsgf.
Transport and Environment (2015). Transport and environment briefing: Environmental goods agreement. Available at https://www.transportenvironment.org/publications/briefing-environmental-goods-agreement.
UNCTAD (1995). Environmentally preferable products (EPPs) as a trade opportunity for developing countries. UNCTAD/COM/70. Geneva. Available at https://unctad.org/system/files/official-document/unctadcom70.pdf.
UNCTAD (2019). Revitalizing South--South trade cooperation for development. See https://unctad.org/news/revitalizing-south-south-trade-cooperation-development.
UNCTAD (2020). Global trade in plastics: insights from the first life-cycle trade database. UNCTAD Research Paper No. 53, UNCTAD/SER.RP/2020/12. Available at https://unctad.org/system/files/official-document/ser-rp-2020d12_en.pdf.
UNEP (2017). Exploring the potential for adopting alternative materials to reduce marine plastic litter. Available at https://www.unenvironment.org/resources/report/exploring-potential-adopting-alternative-materials-reduce-marine-plastic-litter.
UNEP (2018). Single-use plastics: A roadmap for sustainability. Available at https://www.unep.org/resources/report/single-use-plastics-roadmap-sustainability.
UNEP (2018). Trade in environmentally sound technologies: Implications for developing countries. See https://wedocs.unep.org/bitstream/handle/20.500.11822/27595/TradeEnvTech.pdf?sequence=1&isAllowed=y.
UNGA (2017). Our ocean, our future: Call for action. Resolution 71/312 adopted on the 6th of July 2017. Available at https://digitallibrary.un.org/record/1291421?ln=en.
United Nations (2015). Sustainable Development Goals. See https://www.un.org/sustainabledevelopment/sustainable-development-goals/.
United States Customs and Border Protection (2021). Generalized System of Preferences (GSP). Available at https://www.cbp.gov/trade/priority-issues/trade-agreements/special-trade-legislation/generalized-system-preferences.
Vögtlander J, van der Lugt P and Brezet H (2010). The sustainability of bamboo products for local and Western European applications. LCAs and land-use. Journal of Cleaner Production. 18 (13): 1260–1269. Available at https://doi.org/10.1016/j.jclepro.2010.04.015 as cited in UNEP (2017).
WIPO (2021). WIPO GREEN – The marketplace for sustainable technology. See https://www3.wipo.int/wipogreen/en/.
WTO (2017). WTO members adopt report on food safety agreement. WTO News. 13–14 July. Available at https://www.wto.org/english/news_e/news17_e/sps_13jul17_e.htm.
WTO (2019). Synthesis of submissions on environmental goods. TN/TE/W/63. Available at https://docs.wto.org/dol2fe/Pages/FE_Search/FE_S_S009-DP.aspx?language=E&CatalogueIdList=78474,50662,61291,48084,64432&CurrentCatalogueIdIndex=1&FullTextHash=&HasEnglishRecord=True&HasFrenchRecord=True&HasSpanishRecord=True.
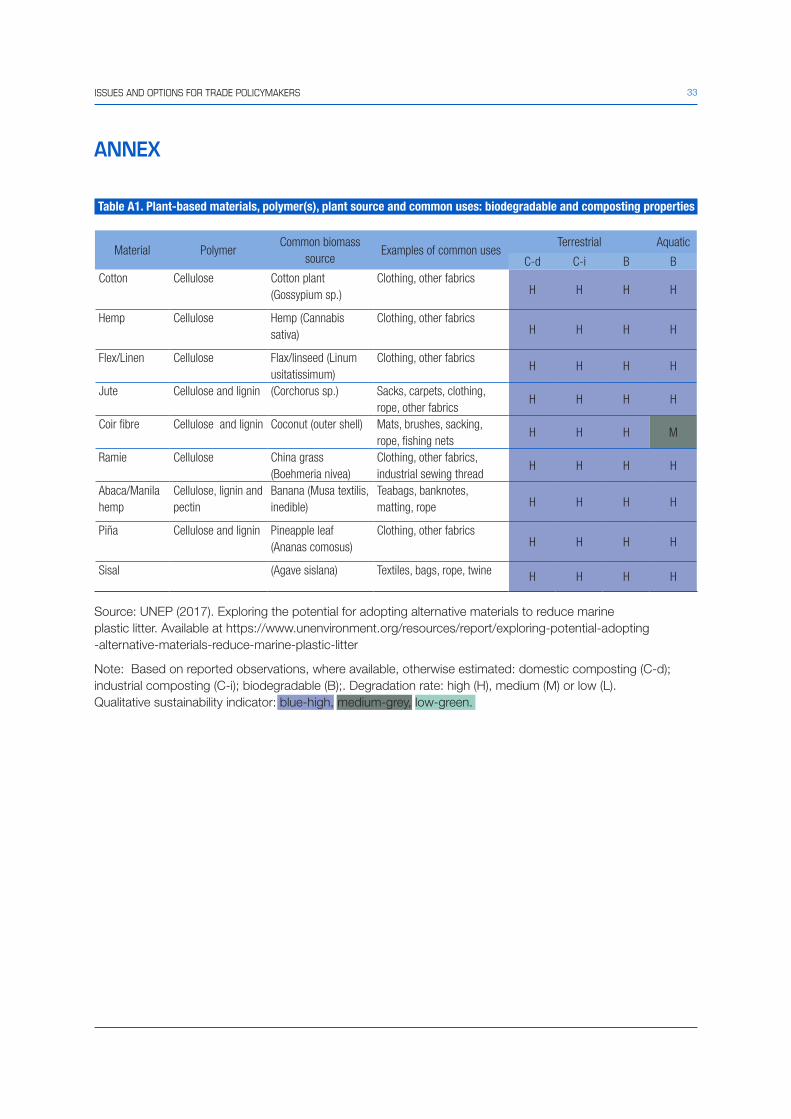
33ISSUES AND OPTIONS FOR TRADE POLICYMAKERS
ANNEX
Table A1. Plant-based materials, polymer(s), plant source and common uses: biodegradable and composting properties
Material PolymerCommon biomass
sourceExamples of common uses
Terrestrial Aquatic
C-d C-i B BCotton Cellulose Cotton plant
(Gossypium sp.)Clothing, other fabrics
H H H H
Hemp Cellulose Hemp (Cannabis sativa)
Clothing, other fabrics H H H H
Flex/Linen Cellulose Flax/linseed (Linum usitatissimum)
Clothing, other fabricsH H H H
Jute Cellulose and lignin (Corchorus sp.) Sacks, carpets, clothing, rope, other fabrics
H H H H
Coir fibre Cellulose and lignin Coconut (outer shell) Mats, brushes, sacking, rope, fishing nets
H H H M
Ramie Cellulose China grass (Boehmeria nivea)
Clothing, other fabrics, industrial sewing thread
H H H H
Abaca/Manila hemp
Cellulose, lignin and pectin
Banana (Musa textilis, inedible)
Teabags, banknotes, matting, rope H H H H
Piña Cellulose and lignin Pineapple leaf (Ananas comosus)
Clothing, other fabrics H H H H
Sisal (Agave sislana) Textiles, bags, rope, twine H H H H
Source: UNEP (2017). Exploring the potential for adopting alternative materials to reduce marine plastic litter. Available at https://www.unenvironment.org/resources/report/exploring-potential-adopting -alternative-materials-reduce-marine-plastic-litter
Note: Based on reported observations, where available, otherwise estimated: domestic composting (C-d); industrial composting (C-i); biodegradable (B);. Degradation rate: high (H), medium (M) or low (L). Qualitative sustainability indicator: blue-high, medium-grey, low-green.
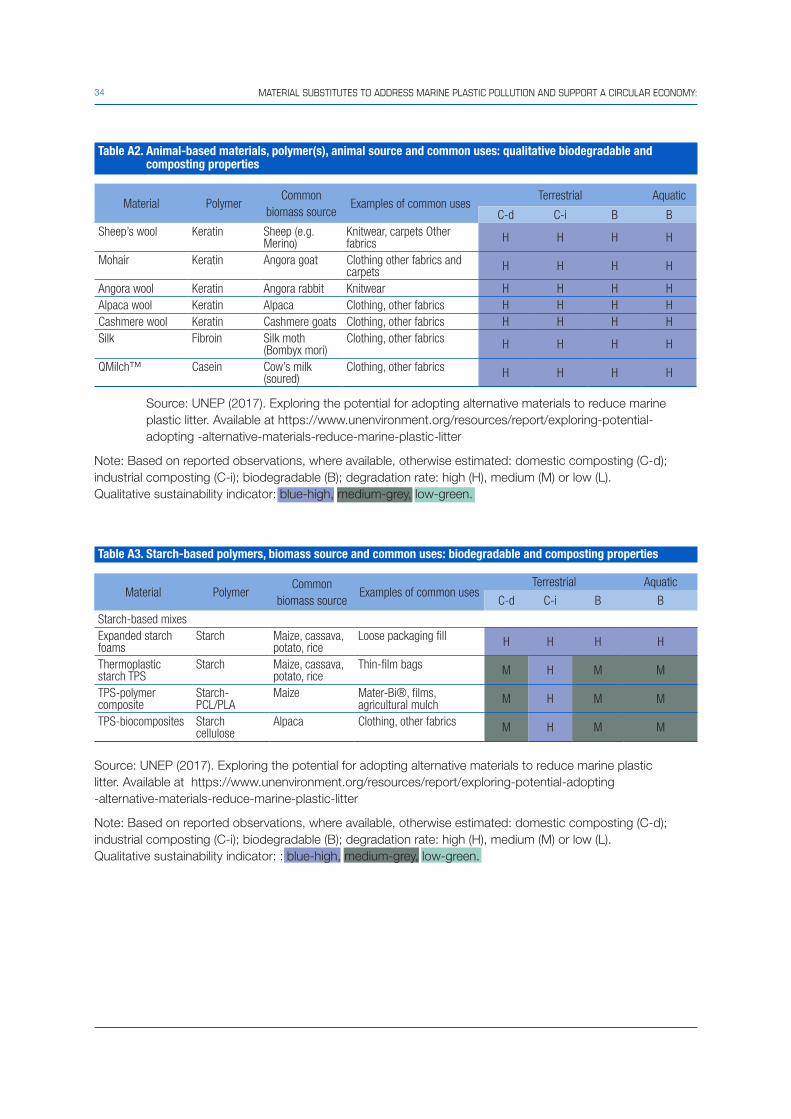
34 MATERIAL SUBSTITUTES TO ADDRESS MARINE PLASTIC POLLUTION AND SUPPORT A CIRCULAR ECONOMY:
Table A2. Animal-based materials, polymer(s), animal source and common uses: qualitative biodegradable and composting properties
Material PolymerCommon
biomass sourceExamples of common uses
Terrestrial Aquatic
C-d C-i B BSheep’s wool Keratin Sheep (e.g.
Merino)Knitwear, carpets Other fabrics H H H H
Mohair Keratin Angora goat Clothing other fabrics and carpets H H H H
Angora wool Keratin Angora rabbit Knitwear H H H HAlpaca wool Keratin Alpaca Clothing, other fabrics H H H HCashmere wool Keratin Cashmere goats Clothing, other fabrics H H H HSilk Fibroin Silk moth
(Bombyx mori)Clothing, other fabrics H H H H
QMilch™ Casein Cow’s milk (soured)
Clothing, other fabrics H H H H
Source: UNEP (2017). Exploring the potential for adopting alternative materials to reduce marine plastic litter. Available at https://www.unenvironment.org/resources/report/exploring-potential-adopting -alternative-materials-reduce-marine-plastic-litter
Note: Based on reported observations, where available, otherwise estimated: domestic composting (C-d); industrial composting (C-i); biodegradable (B); degradation rate: high (H), medium (M) or low (L). Qualitative sustainability indicator: blue-high, medium-grey, low-green.
Table A3. Starch-based polymers, biomass source and common uses: biodegradable and composting properties
Material PolymerCommon
biomass sourceExamples of common uses
Terrestrial Aquatic
C-d C-i B B
Starch-based mixesExpanded starch foams
Starch Maize, cassava, potato, rice
Loose packaging fill H H H H
Thermoplastic starch TPS
Starch Maize, cassava, potato, rice
Thin-film bags M H M M
TPS-polymer composite
Starch-PCL/PLA
Maize Mater-Bi®, films, agricultural mulch M H M M
TPS-biocomposites Starch cellulose
Alpaca Clothing, other fabrics M H M M
Source: UNEP (2017). Exploring the potential for adopting alternative materials to reduce marine plastic litter. Available at https://www.unenvironment.org/resources/report/exploring-potential-adopting -alternative-materials-reduce-marine-plastic-litter
Note: Based on reported observations, where available, otherwise estimated: domestic composting (C-d); industrial composting (C-i); biodegradable (B); degradation rate: high (H), medium (M) or low (L). Qualitative sustainability indicator: : blue-high, medium-grey, low-green.
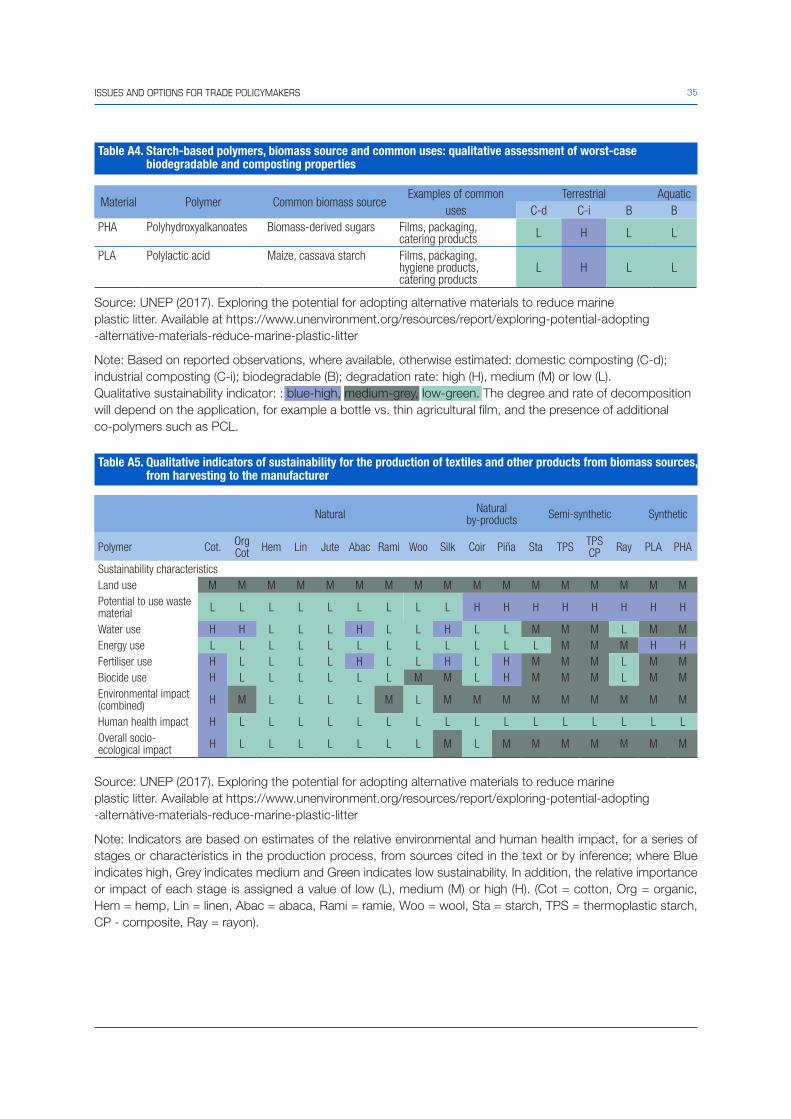
35ISSUES AND OPTIONS FOR TRADE POLICYMAKERS
Table A4. Starch-based polymers, biomass source and common uses: qualitative assessment of worst-case biodegradable and composting properties
Material Polymer Common biomass sourceExamples of common
usesTerrestrial Aquatic
C-d C-i B BPHA Polyhydroxyalkanoates Biomass-derived sugars Films, packaging,
catering products L H L L
PLA Polylactic acid Maize, cassava starch Films, packaging, hygiene products, catering products
L H L L
Source: UNEP (2017). Exploring the potential for adopting alternative materials to reduce marine plastic litter. Available at https://www.unenvironment.org/resources/report/exploring-potential-adopting -alternative-materials-reduce-marine-plastic-litter
Note: Based on reported observations, where available, otherwise estimated: domestic composting (C-d); industrial composting (C-i); biodegradable (B); degradation rate: high (H), medium (M) or low (L). Qualitative sustainability indicator: : blue-high, medium-grey, low-green. The degree and rate of decomposition will depend on the application, for example a bottle vs. thin agricultural film, and the presence of additional co-polymers such as PCL.
Table A5. Qualitative indicators of sustainability for the production of textiles and other products from biomass sources, from harvesting to the manufacturer
Natural Natural by-products Semi-synthetic Synthetic
Polymer Cot. Org Cot Hem Lin Jute Abac Rami Woo Silk Coir Piña Sta TPS TPS
CP Ray PLA PHA
Sustainability characteristicsLand use M M M M M M M M M M M M M M M M MPotential to use waste material L L L L L L L L L H H H H H H H H
Water use H H L L L H L L H L L M M M L M MEnergy use L L L L L L L L L L L L M M M H HFertiliser use H L L L L H L L H L H M M M L M MBiocide use H L L L L L L M M L H M M M L M MEnvironmental impact (combined) H M L L L L M L M M M M M M M M M
Human health impact H L L L L L L L L L L L L L L L LOverall socio-ecological impact H L L L L L L L M L M M M M M M M
Source: UNEP (2017). Exploring the potential for adopting alternative materials to reduce marine plastic litter. Available at https://www.unenvironment.org/resources/report/exploring-potential-adopting -alternative-materials-reduce-marine-plastic-litter
Note: Indicators are based on estimates of the relative environmental and human health impact, for a series of stages or characteristics in the production process, from sources cited in the text or by inference; where Blue indicates high, Grey indicates medium and Green indicates low sustainability. In addition, the relative importance or impact of each stage is assigned a value of low (L), medium (M) or high (H). (Cot = cotton, Org = organic, Hem = hemp, Lin = linen, Abac = abaca, Rami = ramie, Woo = wool, Sta = starch, TPS = thermoplastic starch, CP - composite, Ray = rayon).

36 MATERIAL SUBSTITUTES TO ADDRESS MARINE PLASTIC POLLUTION AND SUPPORT A CIRCULAR ECONOMY:
Table A6. Qualitative indicators of sustainability for the production of textiles and other products from biomass sources during manufacture
Natural Natural by-products Semi-synthetic Synthetic
Polymer Cot. Org Cot Hem Lin Jute Abac Rami Woo Silk Coir Piña Sta TPS TPS
CP Ray PLA PHA
Sustainability characteristicsWater use M M M M M M M M M M M M M M M M MEnergy use L L L L L L L L L L L M M M H H HChemical Processes M M M M M M M M M M M M M M H H H
Waste production L L L L L L L L L L L L L L M L LHuman health impact L L L L L L L L L L L L L L H L L
Environmental health Impact L L L L L L L L L L L L L L M L L
Source: UNEP (2017). Exploring the potential for adopting alternative materials to reduce marine plastic litter. Available at https://www.unenvironment.org/resources/report/exploring-potential -adopting-alternative-materials-reduce-marine-plastic-litter
Note: Indicators are based on estimates of the relative environmental and human health impact, for a series of stages or characteristics in the production process, from sources cited in the text or by inference; where Blue indicates high, Grey indicates medium and Green indicates low sustainability. In addition, the relative importance or impact of each stage is assigned a value of low (L), medium (M) or high (H). (Cot = cotton, Org = organic, Hem = hemp, Lin = linen, Abac = abaca, Rami = ramie, Woo = wool, Sta = starch, TPS = thermoplastic starch, CP - composite, Ray = rayon).
Table A7. Qualitative indicators of sustainability for the production of textiles and other products from biomass sources during use and at the end-of-life
Natural Natural by-products Semi-synthetic Synthetic
Polymer Cot. Org Cot Hem Lin Jute Abac Rami Woo Silk Coir Piña Sta TPS TPS
CP Ray PLA PHA
Sustainability characteristicsCompostable-d H H H H H H H H H H H H M M H L LCompostable-i H H H H H H H H H H H H H H H H HAnaerobic digestion H H H H H H H H H H H H H H H H H
Generation of fibres H H H H H H H H H H M M M M H M M
Entry to ocean via wastewater H H H H H H H H H H M M M M H M M
Biodegradable in sea H H H H H H H H H H H H M M H L L
Overall environment impact in ocean
L L L L L L L L L L L L M M L H H
Source: UNEP (2017). Exploring the potential for adopting alternative materials to reduce marine plastic litter. Available at https://www.unenvironment.org/resources/report/exploring -potential-adopting-alternative-materials-reduce-marine-plastic-litter
Note: Indicators are based on estimates of the relative environmental and human health impact, for a series of stages or characteristics in the production process, from sources cited in the text or by inference; where
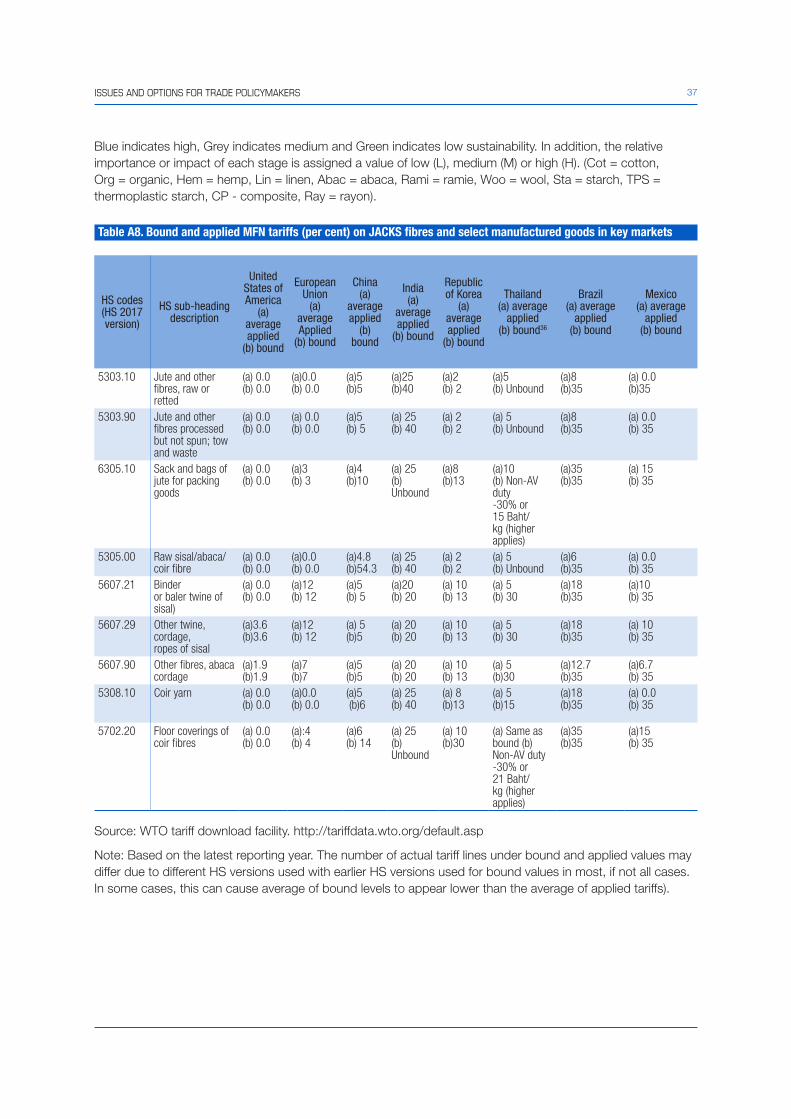
37ISSUES AND OPTIONS FOR TRADE POLICYMAKERS
Blue indicates high, Grey indicates medium and Green indicates low sustainability. In addition, the relative importance or impact of each stage is assigned a value of low (L), medium (M) or high (H). (Cot = cotton, Org = organic, Hem = hemp, Lin = linen, Abac = abaca, Rami = ramie, Woo = wool, Sta = starch, TPS = thermoplastic starch, CP - composite, Ray = rayon).
Table A8. Bound and applied MFN tariffs (per cent) on JACKS fibres and select manufactured goods in key markets
HS codes (HS 2017 version)
HS sub-heading description
United States of America
(a) average applied
(b) bound
European Union
(a) average Applied
(b) bound
China(a)
average applied
(b) bound
India(a)
average applied
(b) bound
Republic of Korea
(a) average applied
(b) bound
Thailand(a) average
applied(b) bound36
Brazil(a) average
applied(b) bound
Mexico(a) average
applied(b) bound
5303.10 Jute and other fibres, raw orretted
(a) 0.0(b) 0.0
(a)0.0(b) 0.0
(a)5(b)5
(a)25(b)40
(a)2(b) 2
(a)5(b) Unbound
(a)8(b)35
(a) 0.0(b)35
5303.90 Jute and other fibres processed but not spun; tow and waste
(a) 0.0(b) 0.0
(a) 0.0(b) 0.0
(a)5(b) 5
(a) 25(b) 40
(a) 2(b) 2
(a) 5(b) Unbound
(a)8(b)35
(a) 0.0(b) 35
6305.10 Sack and bags of jute for packing goods
(a) 0.0(b) 0.0
(a)3(b) 3
(a)4(b)10
(a) 25(b) Unbound
(a)8(b)13
(a)10(b) Non-AV duty-30% or 15 Baht/kg (higher applies)
(a)35(b)35
(a) 15(b) 35
5305.00 Raw sisal/abaca/coir fibre
(a) 0.0(b) 0.0
(a)0.0(b) 0.0
(a)4.8(b)54.3
(a) 25(b) 40
(a) 2(b) 2
(a) 5(b) Unbound
(a)6(b)35
(a) 0.0(b) 35
5607.21 Binderor baler twine of sisal)
(a) 0.0(b) 0.0
(a)12(b) 12
(a)5(b) 5
(a)20(b) 20
(a) 10(b) 13
(a) 5(b) 30
(a)18(b)35
(a)10(b) 35
5607.29 Other twine, cordage,ropes of sisal
(a)3.6(b)3.6
(a)12(b) 12
(a) 5(b)5
(a) 20(b) 20
(a) 10(b) 13
(a) 5(b) 30
(a)18(b)35
(a) 10(b) 35
5607.90 Other fibres, abaca cordage
(a)1.9(b)1.9
(a)7(b)7
(a)5(b)5
(a) 20(b) 20
(a) 10(b) 13
(a) 5(b)30
(a)12.7(b)35
(a)6.7(b) 35
5308.10 Coir yarn (a) 0.0(b) 0.0
(a)0.0(b) 0.0
(a)5 (b)6
(a) 25(b) 40
(a) 8(b)13
(a) 5(b)15
(a)18(b)35
(a) 0.0(b) 35
5702.20 Floor coverings of coir fibres
(a) 0.0(b) 0.0
(a):4(b) 4
(a)6(b) 14
(a) 25(b) Unbound
(a) 10(b)30
(a) Same as bound (b) Non-AV duty-30% or 21 Baht/kg (higher applies)
(a)35(b)35
(a)15(b) 35
Source: WTO tariff download facility. http://tariffdata.wto.org/default.asp
Note: Based on the latest reporting year. The number of actual tariff lines under bound and applied values may differ due to different HS versions used with earlier HS versions used for bound values in most, if not all cases. In some cases, this can cause average of bound levels to appear lower than the average of applied tariffs).
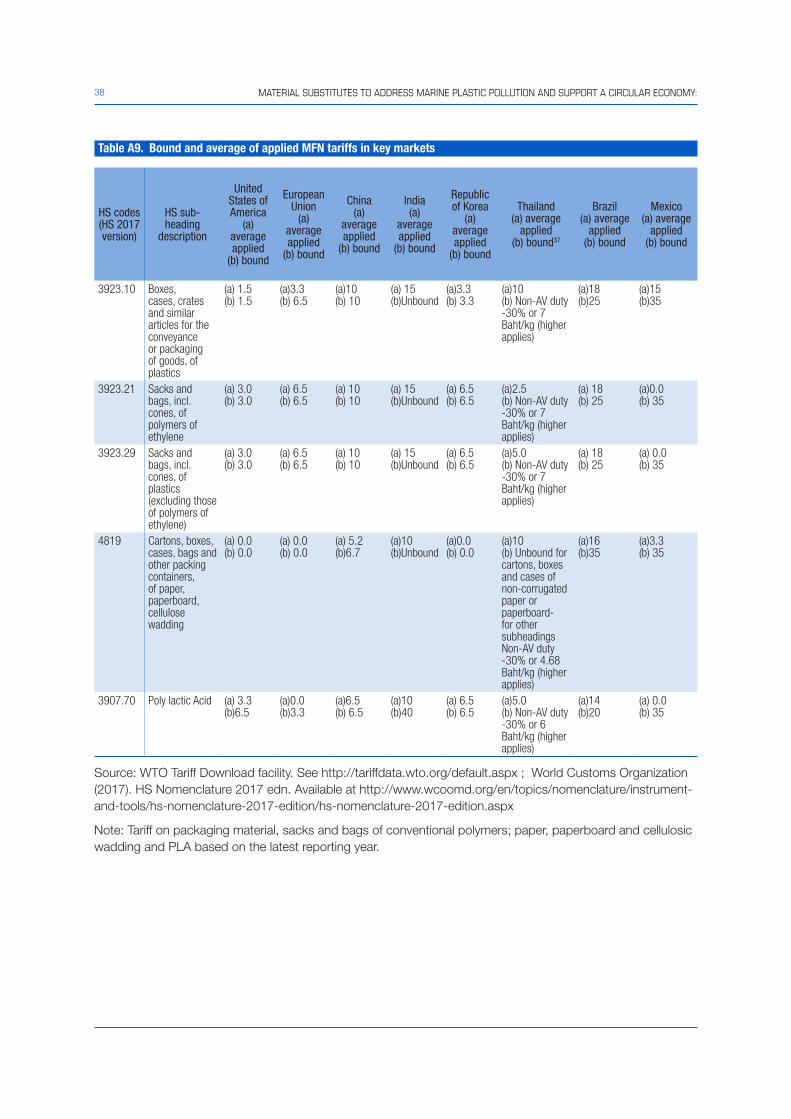
38 MATERIAL SUBSTITUTES TO ADDRESS MARINE PLASTIC POLLUTION AND SUPPORT A CIRCULAR ECONOMY:
Table A9. Bound and average of applied MFN tariffs in key markets
HS codes (HS 2017 version)
HS sub-heading
description
United States of America
(a) average applied
(b) bound
European Union
(a) average applied
(b) bound
China(a)
average applied
(b) bound
India(a)
average applied
(b) bound
Republic of Korea
(a) average applied
(b) bound
Thailand(a) average
applied(b) bound37
Brazil(a) average
applied(b) bound
Mexico(a) average
applied(b) bound
3923.10 Boxes, cases, crates and similar articles for the conveyance or packaging of goods, of plastics
(a) 1.5(b) 1.5
(a)3.3(b) 6.5
(a)10(b) 10
(a) 15(b)Unbound
(a)3.3(b) 3.3
(a)10(b) Non-AV duty-30% or 7 Baht/kg (higher applies)
(a)18(b)25
(a)15(b)35
3923.21 Sacks and bags, incl. cones, of polymers of ethylene
(a) 3.0(b) 3.0
(a) 6.5(b) 6.5
(a) 10(b) 10
(a) 15(b)Unbound
(a) 6.5(b) 6.5
(a)2.5(b) Non-AV duty-30% or 7 Baht/kg (higher applies)
(a) 18(b) 25
(a)0.0(b) 35
3923.29 Sacks and bags, incl. cones, of plastics (excluding those of polymers of ethylene)
(a) 3.0(b) 3.0
(a) 6.5(b) 6.5
(a) 10(b) 10
(a) 15(b)Unbound
(a) 6.5(b) 6.5
(a)5.0(b) Non-AV duty-30% or 7 Baht/kg (higher applies)
(a) 18(b) 25
(a) 0.0(b) 35
4819 Cartons, boxes, cases, bags and other packing containers, of paper, paperboard, cellulose wadding
(a) 0.0(b) 0.0
(a) 0.0(b) 0.0
(a) 5.2(b)6.7
(a)10(b)Unbound
(a)0.0(b) 0.0
(a)10(b) Unbound for cartons, boxes and cases of non-corrugated paper or paperboard-for other subheadings Non-AV duty-30% or 4.68 Baht/kg (higher applies)
(a)16(b)35
(a)3.3(b) 35
3907.70 Poly lactic Acid (a) 3.3(b)6.5
(a)0.0(b)3.3
(a)6.5(b) 6.5
(a)10(b)40
(a) 6.5(b) 6.5
(a)5.0(b) Non-AV duty-30% or 6 Baht/kg (higher applies)
(a)14(b)20
(a) 0.0(b) 35
Source: WTO Tariff Download facility. See http://tariffdata.wto.org/default.aspx ; World Customs Organization (2017). HS Nomenclature 2017 edn. Available at http://www.wcoomd.org/en/topics/nomenclature/instrument-and-tools/hs-nomenclature-2017-edition/hs-nomenclature-2017-edition.aspx
Note: Tariff on packaging material, sacks and bags of conventional polymers; paper, paperboard and cellulosic wadding and PLA based on the latest reporting year.
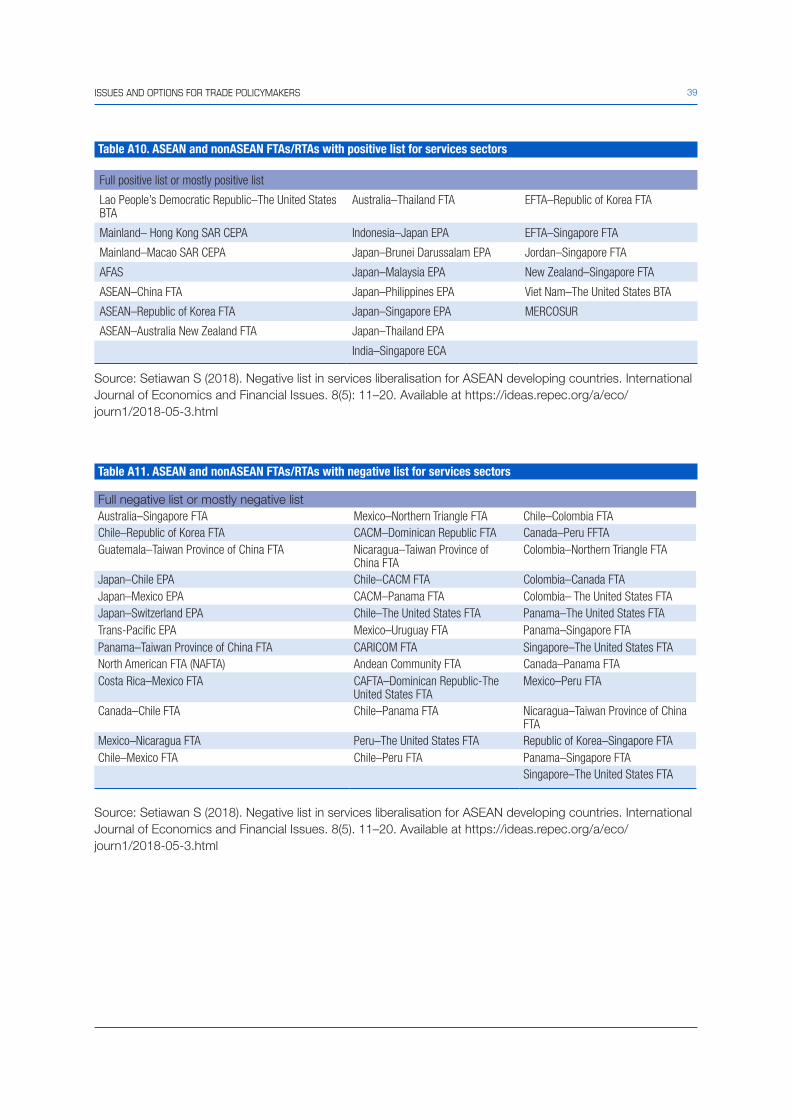
39ISSUES AND OPTIONS FOR TRADE POLICYMAKERS
Table A10. ASEAN and nonASEAN FTAs/RTAs with positive list for services sectors
Full positive list or mostly positive list
Lao People’s Democratic Republic–The United States BTA
Australia–Thailand FTA EFTA–Republic of Korea FTA
Mainland– Hong Kong SAR CEPA Indonesia–Japan EPA EFTA–Singapore FTA
Mainland–Macao SAR CEPA Japan–Brunei Darussalam EPA Jordan–Singapore FTA
AFAS Japan–Malaysia EPA New Zealand–Singapore FTA
ASEAN–China FTA Japan–Philippines EPA Viet Nam–The United States BTA
ASEAN–Republic of Korea FTA Japan–Singapore EPA MERCOSUR
ASEAN–Australia New Zealand FTA Japan–Thailand EPA
India–Singapore ECA
Source: Setiawan S (2018). Negative list in services liberalisation for ASEAN developing countries. International Journal of Economics and Financial Issues. 8(5): 11–20. Available at https://ideas.repec.org/a/eco/journ1/2018-05-3.html
Table A11. ASEAN and nonASEAN FTAs/RTAs with negative list for services sectors
Full negative list or mostly negative listAustralia–Singapore FTA Mexico–Northern Triangle FTA Chile–Colombia FTAChile–Republic of Korea FTA CACM–Dominican Republic FTA Canada–Peru FFTAGuatemala–Taiwan Province of China FTA Nicaragua–Taiwan Province of
China FTAColombia–Northern Triangle FTA
Japan–Chile EPA Chile–CACM FTA Colombia–Canada FTAJapan–Mexico EPA CACM–Panama FTA Colombia– The United States FTAJapan–Switzerland EPA Chile–The United States FTA Panama–The United States FTATrans-Pacific EPA Mexico–Uruguay FTA Panama–Singapore FTAPanama–Taiwan Province of China FTA CARICOM FTA Singapore–The United States FTANorth American FTA (NAFTA) Andean Community FTA Canada–Panama FTACosta Rica–Mexico FTA CAFTA–Dominican Republic-The
United States FTAMexico–Peru FTA
Canada–Chile FTA Chile–Panama FTA Nicaragua–Taiwan Province of China FTA
Mexico–Nicaragua FTA Peru–The United States FTA Republic of Korea–Singapore FTAChile–Mexico FTA Chile–Peru FTA Panama–Singapore FTA
Singapore–The United States FTA
Source: Setiawan S (2018). Negative list in services liberalisation for ASEAN developing countries. International Journal of Economics and Financial Issues. 8(5). 11–20. Available at https://ideas.repec.org/a/eco/journ1/2018-05-3.html

40 MATERIAL SUBSTITUTES TO ADDRESS MARINE PLASTIC POLLUTION AND SUPPORT A CIRCULAR ECONOMY:
Table A12. Assessing the uptake and integration of circular economy in the European Union FTAs
Agreement Status Relevance in the context of circular economy (CE)
Southern African Development Community – Economic Partnership Agreement (SADC–EPA)
In force since February 2018
No mention of CE or any relevant measures
Bosnia and Herzegovina – Stabilisation and Association Agreement (SAA)
In force since June 2015
Cooperation policies – Environment: – Parties shall establish cooperation, which could centre on the development of strategies to significantly reduce local, regional and trans-boundary air and water pollution, including waste and chemicals, to establish a system for efficient, clean, sustainable and renewable production and consumption of energy, and to execute environmental impact assessment and strategic environmental assessment
Georgia – Association Agreement (AA)
In force since July 2016
Trade and sustainable development (TSD) chapter: – Call to facilitate the removal of obstacles to trade or investment concerning goods and services of particular relevance to climate change mitigation, such as energy efficient products and services. May include the adoption of appropriate technologies and the promotion of standards that respond to environmental and economic needs and minimize technical obstacles to trade– Agreement to promote trade in goods that contribute to enhanced social conditions and environmentally sound practices, including goods that are the subject of voluntary sustainability assurance schemes such as fair and ethical trade schemes and eco-labels – Promotion of private and public certification, traceability and labelling schemes, including eco-labelling
Republic of Moldova – Association Agreement (AA)
In force since July 2016
Trade and sustainable development (TS) chapter: – Agreement to promote trade in goods that contribute to enhanced social conditions and environmentally sound practices, including goods that are the subject of voluntary sustainability assurance schemes such as fair and ethical trade schemes, eco-labels, and certification schemes for natural resource-based products – Promotion of private and public certification, traceability and labelling schemes, including eco-labelling
Republic of Korea – FTA In force since July 2016
Trade and sustainable development (TSD) chapter: – Parties shall strive to facilitate and promote trade and foreign direct investment in environmental goods and services, including environmental technologies, sustainable renewable energy, energy efficient products and services and eco-labelled goods, including through addressing related non-tariff barriers– Parties shall strive to facilitate and promote trade in goods that contribute to sustainable development, including goods that are the subject of schemes such as fair and ethical trade and those involving corporate social responsibility and accountability
Comprehensive Trade Agreement with Colombia, Peru and Ecuador (CTA)
Partly in place – provisionally applied since July 2013
Trade and sustainable development (TSD) title: – Considering the global objective of a rapid transition to low-carbon economies, Parties will promote the sustainable use of natural resources and will promote trade and investment measures that promote and facilitate access, dissemination and use of best available technologies for clean energy production and use, and for mitigation of and adaptation to climate change
Central America – Association Agreement (AA)
Partly in place – provisionally applied since 2013
Cooperation part: – Cooperation shall in particular address: […] the fight against pollution of fresh and marine waters, air and soil, including through the sound management of waste […] – Cooperation may involve measures such as: […] promoting sustainable production and consumption patterns, including through the sustainable use of ecosystems, services and goodsTrade part, TSD title: – Parties shall endeavour to facilitate and promote trade in products that respond to sustainability considerations, including products that are the subject of schemes such as fair and ethical trade schemes, eco-labelling, organic production, and including those schemes involving corporate social responsibility and accountability

41ISSUES AND OPTIONS FOR TRADE POLICYMAKERS
Agreement Status Relevance in the context of circular economy (CE)
Cuba – Political Dialogue and Cooperation Agreement
Partly in place – provisionally applied since 2017
Cooperation part: – Cooperation shall in particular address […] the fight against the pollution of fresh and marine waters, air and soil, including through the sound management of waste […] – Cooperation may involve measures such as: […] promoting sustainable production and consumption patterns, including through the sustainable use of ecosystems, services and goods. Trade and Trade cooperation partTrade and SD article: – Parties agree to cooperate in supporting the development of an enabling framework for trade in goods and services contributing to sustainable development, including through the dissemination of corporate social responsibility practices
Kazakhstan – Enhanced Partnership and Cooperation Agreement
Partly in place – provisionally applied since May 2016
Trade and Business title, Trade & SD chapter: – Parties agree to promote the use of sustainability assurance schemes, such as fair and ethical trade or eco-labellingCooperation title: – Cooperation shall be pursued in […] waste management (cooperation in the area of environment)– Parties shall cooperate in […] productivity and efficiency of resource use (Cooperation in the area of industry)
Eastern and Southern Africa (ESA) – interim Economic Partnership Agreement
Partly in place – provisionally applied since May 2012
Economic and development cooperation chapter: – Parties agree to cooperate in […] supporting the production and facilitate trade of goods and services for which eco-labelling is important; waste management
Ukraine – Association Agreement
Partly in place – provisionally applied since January 2016
Trade and SD chapter: – Parties shall strive to facilitate and promote trade and foreign direct investment in environmental goods, services and technologies, sustainable renewable-energy and energy-efficient products and services, and eco-labelled goods, including through addressing related non-tariff barriersCooperation title: – Cooperation shall aim at preserving, protecting, improving, and rehabilitating the quality of the environment, […], prudent and rational utilisation of natural resources, in the areas of: […] waste and resource management
Singapore – FTA Pending – signed in October 2018, awaiting ratification
Trade and SD chapter: – Parties shall pay special attention to facilitating the removal of obstacles to trade or investment concerning climate-friendly goods and services, such as sustainable renewable energy goods and related services and energy efficient products and services
Viet Nam – FTA Pending – texts agreed on in July 2018, awaiting agreement by the Council
Trade and SD chapter: – Parties may work together in […] sharing information and experience about trade-related aspects concerning the definition and implementation of green growth strategies and policies, including but not limited to sustainable production and consumption, climate change mitigation and adaptation, and environmentally sound technology
Mercosur Association Agreement
Under negotiation since 2016
Trade and SD chapter (European Union proposal): – Parties shall (…) facilitate trade and investment in environmental goods and services, including those of particular relevance for climate change mitigation such as sustainable renewable energy and energy efficient products and services, through inter alia addressing related non-tariff barriers, (…) promote trade in goods that contribute to enhanced social conditions and environmentally sound practices, including goods that are the subject of voluntary sustainability assurance schemes such as fair and ethical trade schemes and eco-labels
The United States – Transatlantic Trade and Investment Partnership (TTIP)
Negotiations launched in 2013, stopped in 2016
Trade and SD chapter (European Union proposal, 2015): – Parties shall (…) cooperate to promote globally the environmentally sound management of all types of waste, reduction of waste generation and using waste as a resource; take effective measures and cooperate to combat globally illegal shipments of all types of waste– Parties shall consult and cooperate on areas that may include (…) sustainable consumption and production; strategies and policies to promote trade contribution to resource efficiency, the green economy and the circular economy, including eco-innovation, and promoting participation in relevant international instruments
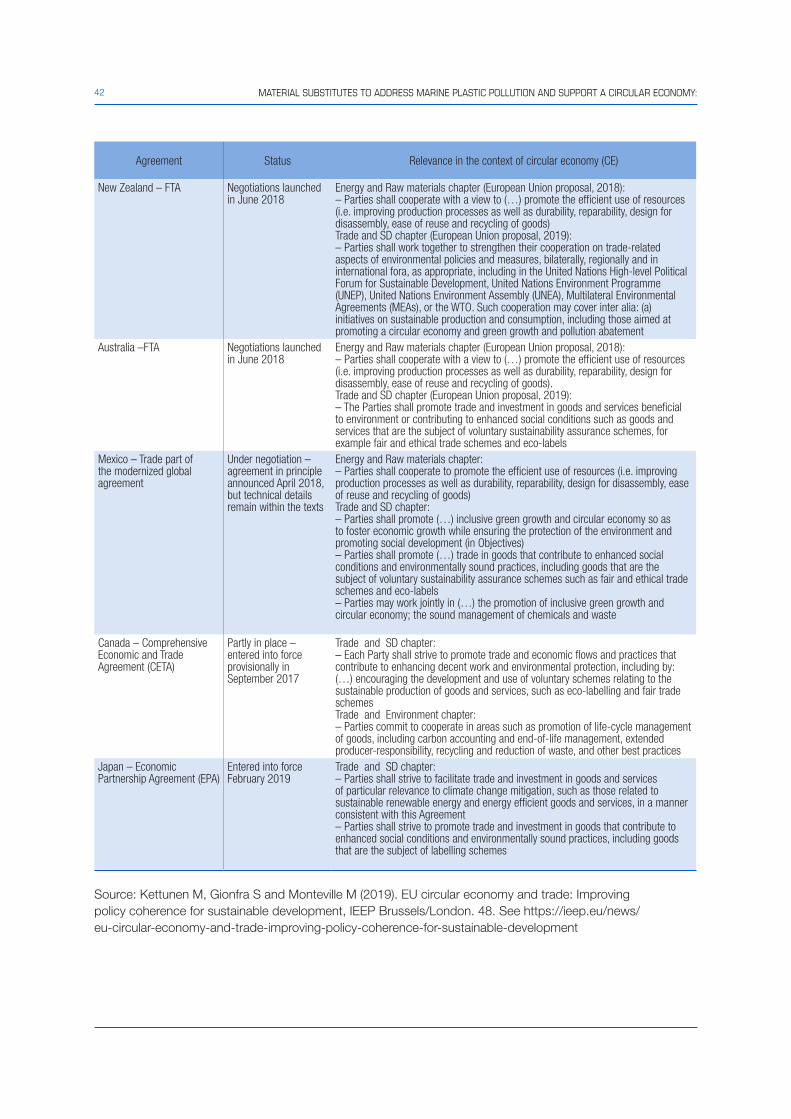
42 MATERIAL SUBSTITUTES TO ADDRESS MARINE PLASTIC POLLUTION AND SUPPORT A CIRCULAR ECONOMY:
Agreement Status Relevance in the context of circular economy (CE)
New Zealand – FTA Negotiations launched in June 2018
Energy and Raw materials chapter (European Union proposal, 2018): – Parties shall cooperate with a view to (…) promote the efficient use of resources (i.e. improving production processes as well as durability, reparability, design for disassembly, ease of reuse and recycling of goods)Trade and SD chapter (European Union proposal, 2019): – Parties shall work together to strengthen their cooperation on trade-related aspects of environmental policies and measures, bilaterally, regionally and in international fora, as appropriate, including in the United Nations High-level Political Forum for Sustainable Development, United Nations Environment Programme (UNEP), United Nations Environment Assembly (UNEA), Multilateral Environmental Agreements (MEAs), or the WTO. Such cooperation may cover inter alia: (a) initiatives on sustainable production and consumption, including those aimed at promoting a circular economy and green growth and pollution abatement
Australia –FTA Negotiations launched in June 2018
Energy and Raw materials chapter (European Union proposal, 2018): – Parties shall cooperate with a view to (…) promote the efficient use of resources (i.e. improving production processes as well as durability, reparability, design for disassembly, ease of reuse and recycling of goods). Trade and SD chapter (European Union proposal, 2019): – The Parties shall promote trade and investment in goods and services beneficial to environment or contributing to enhanced social conditions such as goods and services that are the subject of voluntary sustainability assurance schemes, for example fair and ethical trade schemes and eco-labels
Mexico – Trade part of the modernized global agreement
Under negotiation – agreement in principle announced April 2018, but technical details remain within the texts
Energy and Raw materials chapter: – Parties shall cooperate to promote the efficient use of resources (i.e. improving production processes as well as durability, reparability, design for disassembly, ease of reuse and recycling of goods)Trade and SD chapter: – Parties shall promote (…) inclusive green growth and circular economy so as to foster economic growth while ensuring the protection of the environment and promoting social development (in Objectives)– Parties shall promote (…) trade in goods that contribute to enhanced social conditions and environmentally sound practices, including goods that are the subject of voluntary sustainability assurance schemes such as fair and ethical trade schemes and eco-labels– Parties may work jointly in (…) the promotion of inclusive green growth and circular economy; the sound management of chemicals and waste
Canada – Comprehensive Economic and Trade Agreement (CETA)
Partly in place – entered into force provisionally in September 2017
Trade and SD chapter: – Each Party shall strive to promote trade and economic flows and practices that contribute to enhancing decent work and environmental protection, including by: (…) encouraging the development and use of voluntary schemes relating to the sustainable production of goods and services, such as eco-labelling and fair trade schemesTrade and Environment chapter: – Parties commit to cooperate in areas such as promotion of life-cycle management of goods, including carbon accounting and end-of-life management, extended producer-responsibility, recycling and reduction of waste, and other best practices
Japan – Economic Partnership Agreement (EPA)
Entered into force February 2019
Trade and SD chapter: – Parties shall strive to facilitate trade and investment in goods and services of particular relevance to climate change mitigation, such as those related to sustainable renewable energy and energy efficient goods and services, in a manner consistent with this Agreement– Parties shall strive to promote trade and investment in goods that contribute to enhanced social conditions and environmentally sound practices, including goods that are the subject of labelling schemes
Source: Kettunen M, Gionfra S and Monteville M (2019). EU circular economy and trade: Improving policy coherence for sustainable development, IEEP Brussels/London. 48. See https://ieep.eu/news/eu-circular-economy-and-trade-improving-policy-coherence-for-sustainable-development
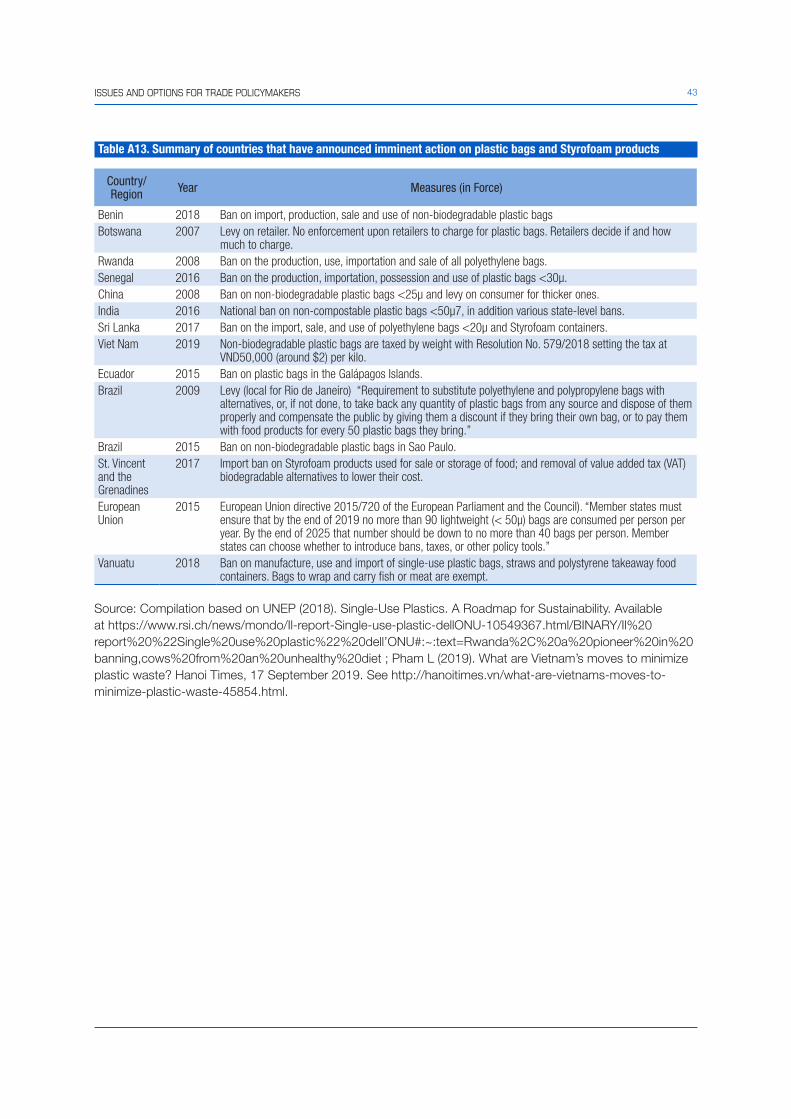
43ISSUES AND OPTIONS FOR TRADE POLICYMAKERS
Table A13. Summary of countries that have announced imminent action on plastic bags and Styrofoam products
Country/Region Year Measures (in Force)
Benin 2018 Ban on import, production, sale and use of non-biodegradable plastic bagsBotswana 2007 Levy on retailer. No enforcement upon retailers to charge for plastic bags. Retailers decide if and how
much to charge.Rwanda 2008 Ban on the production, use, importation and sale of all polyethylene bags.Senegal 2016 Ban on the production, importation, possession and use of plastic bags <30µ.China 2008 Ban on non-biodegradable plastic bags <25μ and levy on consumer for thicker ones.India 2016 National ban on non-compostable plastic bags <50μ7, in addition various state-level bans.Sri Lanka 2017 Ban on the import, sale, and use of polyethylene bags <20µ and Styrofoam containers.Viet Nam 2019 Non-biodegradable plastic bags are taxed by weight with Resolution No. 579/2018 setting the tax at
VND50,000 (around $2) per kilo.Ecuador 2015 Ban on plastic bags in the Galápagos Islands.Brazil 2009 Levy (local for Rio de Janeiro) “Requirement to substitute polyethylene and polypropylene bags with
alternatives, or, if not done, to take back any quantity of plastic bags from any source and dispose of them properly and compensate the public by giving them a discount if they bring their own bag, or to pay them with food products for every 50 plastic bags they bring.”
Brazil 2015 Ban on non-biodegradable plastic bags in Sao Paulo.St. Vincent and the Grenadines
2017 Import ban on Styrofoam products used for sale or storage of food; and removal of value added tax (VAT) biodegradable alternatives to lower their cost.
European Union
2015 European Union directive 2015/720 of the European Parliament and the Council). “Member states must ensure that by the end of 2019 no more than 90 lightweight (< 50µ) bags are consumed per person per year. By the end of 2025 that number should be down to no more than 40 bags per person. Member states can choose whether to introduce bans, taxes, or other policy tools.”
Vanuatu 2018 Ban on manufacture, use and import of single-use plastic bags, straws and polystyrene takeaway food containers. Bags to wrap and carry fish or meat are exempt.
Source: Compilation based on UNEP (2018). Single-Use Plastics. A Roadmap for Sustainability. Available at https://www.rsi.ch/news/mondo/Il-report-Single-use-plastic-dellONU-10549367.html/BINARY/Il%20report%20%22Single%20use%20plastic%22%20dell’ONU#:~:text=Rwanda%2C%20a%20pioneer%20in%20banning,cows%20from%20an%20unhealthy%20diet ; Pham L (2019). What are Vietnam’s moves to minimize plastic waste? Hanoi Times, 17 September 2019. See http://hanoitimes.vn/what-are-vietnams-moves-to-minimize-plastic-waste-45854.html.
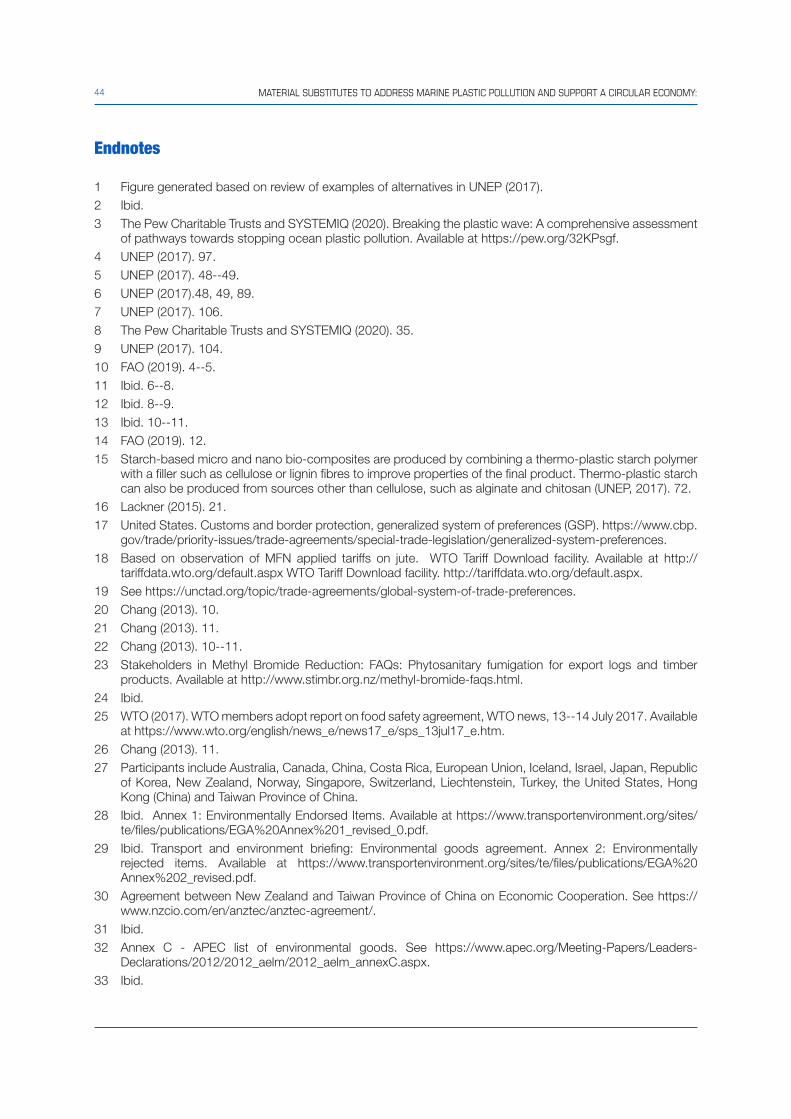
44 MATERIAL SUBSTITUTES TO ADDRESS MARINE PLASTIC POLLUTION AND SUPPORT A CIRCULAR ECONOMY:
Endnotes
1 Figure generated based on review of examples of alternatives in UNEP (2017).2 Ibid.3 The Pew Charitable Trusts and SYSTEMIQ (2020). Breaking the plastic wave: A comprehensive assessment
of pathways towards stopping ocean plastic pollution. Available at https://pew.org/32KPsgf. 4 UNEP (2017). 97. 5 UNEP (2017). 48--49.6 UNEP (2017).48, 49, 89. 7 UNEP (2017). 106. 8 The Pew Charitable Trusts and SYSTEMIQ (2020). 35. 9 UNEP (2017). 104.10 FAO (2019). 4--5. 11 Ibid. 6--8.12 Ibid. 8--9.13 Ibid. 10--11.14 FAO (2019). 12.15 Starch-based micro and nano bio-composites are produced by combining a thermo-plastic starch polymer
with a filler such as cellulose or lignin fibres to improve properties of the final product. Thermo-plastic starch can also be produced from sources other than cellulose, such as alginate and chitosan (UNEP, 2017). 72.
16 Lackner (2015). 21.17 United States. Customs and border protection, generalized system of preferences (GSP). https://www.cbp.
gov/trade/priority-issues/trade-agreements/special-trade-legislation/generalized-system-preferences.18 Based on observation of MFN applied tariffs on jute. WTO Tariff Download facility. Available at http://
tariffdata.wto.org/default.aspx WTO Tariff Download facility. http://tariffdata.wto.org/default.aspx.19 See https://unctad.org/topic/trade-agreements/global-system-of-trade-preferences.20 Chang (2013). 10. 21 Chang (2013). 11.22 Chang (2013). 10--11.23 Stakeholders in Methyl Bromide Reduction: FAQs: Phytosanitary fumigation for export logs and timber
products. Available at http://www.stimbr.org.nz/methyl-bromide-faqs.html.24 Ibid.25 WTO (2017). WTO members adopt report on food safety agreement, WTO news, 13--14 July 2017. Available
at https://www.wto.org/english/news_e/news17_e/sps_13jul17_e.htm.26 Chang (2013). 11. 27 Participants include Australia, Canada, China, Costa Rica, European Union, Iceland, Israel, Japan, Republic
of Korea, New Zealand, Norway, Singapore, Switzerland, Liechtenstein, Turkey, the United States, Hong Kong (China) and Taiwan Province of China.
28 Ibid. Annex 1: Environmentally Endorsed Items. Available at https://www.transportenvironment.org/sites/te/files/publications/EGA%20Annex%201_revised_0.pdf.
29 Ibid. Transport and environment briefing: Environmental goods agreement. Annex 2: Environmentally rejected items. Available at https://www.transportenvironment.org/sites/te/files/publications/EGA%20Annex%202_revised.pdf.
30 Agreement between New Zealand and Taiwan Province of China on Economic Cooperation. See https://www.nzcio.com/en/anztec/anztec-agreement/.
31 Ibid.32 Annex C - APEC list of environmental goods. See https://www.apec.org/Meeting-Papers/Leaders-
Declarations/2012/2012_aelm/2012_aelm_annexC.aspx.33 Ibid.
45ISSUES AND OPTIONS FOR TRADE POLICYMAKERS
34 For example, “New text was added to subheading 0106.12 to identify separately not only whales and dolphins, but a new group of endangered marine mammals requiring close monitoring (i.e., seals, sea lions and walruses).” See WTO (2010). Committee on market access: Minutes of the meeting, 29 April 2010. G/MA/M/51. Available at https://docsonline.wto.org/dol2fe/Pages/SS/DirectDoc.aspx?filename=t%3A%2Fg%2Fma%2Fm51.doc&.
35 The 23 TiSA members comprise Australia, Canada, Chile, Colombia, Costa Rica, the European Union, Iceland, Israel, Japan, Liechtenstein, Mauritius, Mexico, New Zealand, Norway, Pakistan, Panama, Peru, Republic of Korea, Switzerland, Turkey, the United States, Hong Kong (China) and Taiwan Province of China.
36 In many cases, Thailand’s tariff schedule provides for alternative duties. “An alternative duty involves the choice between an ad valorem and a specific rate; the higher of the two is applied provided the WTO tariff binding commitments are met.” WTO (2008), Thailand Trade Policy Review. Report by the Secretariat-Revision, 6 February 2008. WT/TPR/S/191/Rev1. p. 50, footnote 28.
37 In many cases, Thailand’s tariff schedule provides for alternative duties. “An alternative duty involves the choice between an ad valorem and a specific rate; the higher of the two is applied provided the WTO tariff binding commitments are met.” See WTO (2008), Thailand Trade Policy Review. Report by the Secretariat-Revision, 6 February 2008. WT/TPR/S/191/Rev1. p. 50, footnote 28. https://docs.wto.org/dol2fe/Pages/SS/directdoc.aspx?filename=Q:/WT/TPR/S191R1-03.pdf&Open=True.