Embed Size (px)
Citation preview
MATERIAL AND
METHODS
64
3.1. Culture media, microbial strains and cell lines used in the study:
All the chemicals and reagents used in the present study, were of analytical
grade and procured from Amersham Biosciences, Glaxo India Ltd., Himedia, Merck,
Qualigens Fine Chemicals, Ranbaxy Labs Ltd., SD Fine Chemicals, Sigma Aldrich,
Sisco Research Labs. Pvt. Ltd., Unisons Pharma, Baddi etc.
3.1.1. Preparation of culture media:
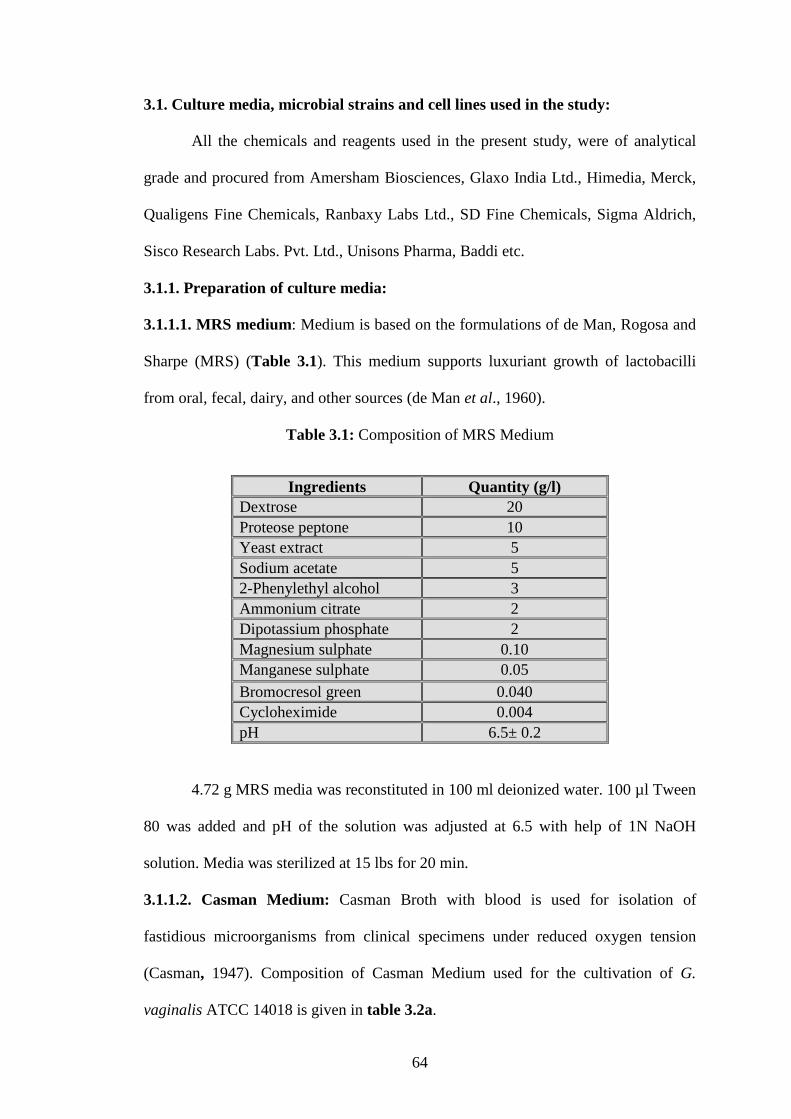
3.1.1.1. MRS medium: Medium is based on the formulations of de Man, Rogosa and
Sharpe (MRS) (Table 3.1). This medium supports luxuriant growth of lactobacilli
from oral, fecal, dairy, and other sources (de Man et al., 1960).
Table 3.1: Composition of MRS Medium
Ingredients Quantity (g/l) Dextrose 20 Proteose peptone 10 Yeast extract 5 Sodium acetate 5 2-Phenylethyl alcohol 3 Ammonium citrate 2 Dipotassium phosphate 2 Magnesium sulphate 0.10 Manganese sulphate 0.05 Bromocresol green 0.040 Cycloheximide 0.004 pH 6.5± 0.2
4.72 g MRS media was reconstituted in 100 ml deionized water. 100 µl Tween
80 was added and pH of the solution was adjusted at 6.5 with help of 1N NaOH
solution. Media was sterilized at 15 lbs for 20 min.
3.1.1.2. Casman Medium: Casman Broth with blood is used for isolation of
fastidious microorganisms from clinical specimens under reduced oxygen tension
(Casman, 1947). Composition of Casman Medium used for the cultivation of G.
vaginalis ATCC 14018 is given in table 3.2a.

65
Table 3.2a: Composition of Casman’s Medium
Ingredients Quantity (g/l) Proteose peptone 10.00 Tryptose 10.00 Sodium chloride 5.00 Beef extract 3.00 Dextrose 0.500 Corn starch 1.00 Nicotinamide 0.05 p-amino benzoic acid(PABA) 0.05 Gardnerella vaginalis selective supplement 1ml Defibrinated blood 5% v/v
2.96 g Casman Media was reconstituted in 100 ml deionized water and was
heated to boiling temperature to dissolve the medium completely. Media was
sterilized by autoclaving at 15 lbs pressure (121°C) for 15 minutes. It was cooled to
50°C and 5% defibrinated blood of 5% sterile blood was added aseptically.
G. vaginalis ATCC 14018 Selective Supplement: An antibiotic supplement is
recommended for the selective isolation of Gardnerella vaginalis which consists of
gentamycin sulphate, nalidixic acid and amphotericin B (Table 3.2b).
Table 3.2b: Antibiotic selective supplement
Antibiotic selective supplement Quantity (mg/l)
Gentamycin sulphate 2.0 Nalidixic acid 15.0 Amphotericin B 1.0
Contents of 1 vial were rehydrated aseptically with 2 ml of sterile distilled
water. 500 ml of sterile, molten, cooled (45-50°C) Casman’s Media with 5%
defibrinated blood was aseptically added it to.
3.1.1.3. Nutrient Agar: This is an undefined medium used for the general cultivation
and maintenance of bacteria kept in laboratory culture collection. Nutrient media

66
contain all the elements that most bacteria need for growth and are non-selective.
Composition of Nutrient Agar is given in table 3.3.
Table 3.3: Composition of Nutrient Agar
Ingredients Quantity (g/l) Peptic digest of animal tissue 5.0 Sodium chloride 5.0 Beef extract 1.5 Yeast extract 1.5 Agar 15 pH 7.0 ± 0.2
1.3 g of Nutrient agar was added to 100ml of distilled water. pH was adjusted
to 7.0 with 1N NaOH solution. Media was sterilized by autoclaving at 121ºC at 15 psi
for 20 min.
3.1.1.4. Brain Heart Infusion Medium: Brain Heart Infusion Broth is employed for
the propagation of fastidious pathogenic cocci and other organisms associated with
blood culture work and allied pathological investigations (Dowell et al., 1974).
Composition of Brain Heart Infusion Medium is given in table 3.4.
Table 3.4: Composition of Brain Heart Infusion Medium
Ingredients Quantity (g/l) Calf Brains, Infusion from 200 Beef Heart, Infusion from 250 Proteose Peptone 10.0 Dextrose 2.0 Sodium Chloride 5.0 Disodium Phosphate 2.5 pH 7.4 ± 0.2
3.76 g of media was added to 100ml of distilled water and pH was adjusted to
7.0 with 1N NaOH solution. Media was sterilized by autoclaving at 121ºC at 15 psi
pressure for 20 min. For best results, the medium should be used on the day it was
prepared, otherwise, it should be boiled or steamed for a few minutes and then cooled
before use.
67
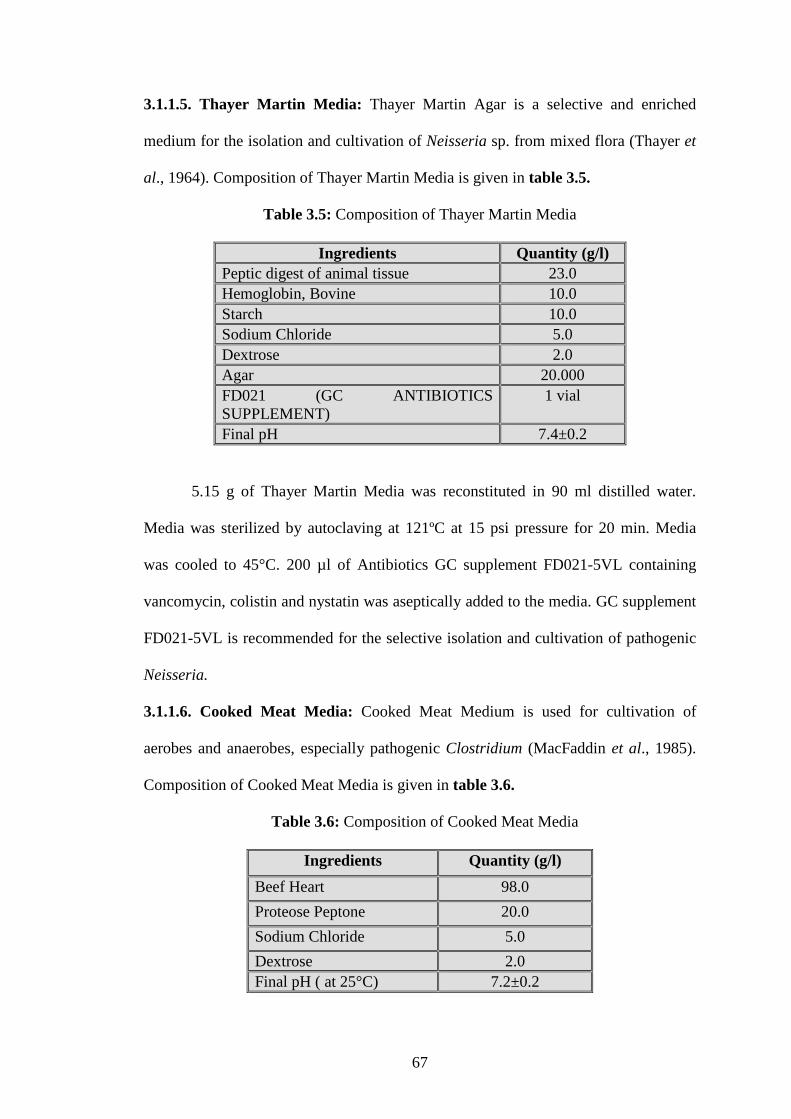
3.1.1.5. Thayer Martin Media: Thayer Martin Agar is a selective and enriched
medium for the isolation and cultivation of Neisseria sp. from mixed flora (Thayer et
al., 1964). Composition of Thayer Martin Media is given in table 3.5.
Table 3.5: Composition of Thayer Martin Media
Ingredients Quantity (g/l) Peptic digest of animal tissue 23.0 Hemoglobin, Bovine 10.0 Starch 10.0 Sodium Chloride 5.0 Dextrose 2.0 Agar 20.000 FD021 (GC ANTIBIOTICS SUPPLEMENT)
1 vial
Final pH 7.4±0.2
5.15 g of Thayer Martin Media was reconstituted in 90 ml distilled water.
Media was sterilized by autoclaving at 121ºC at 15 psi pressure for 20 min. Media
was cooled to 45°C. 200 µl of Antibiotics GC supplement FD021-5VL containing
vancomycin, colistin and nystatin was aseptically added to the media. GC supplement
FD021-5VL is recommended for the selective isolation and cultivation of pathogenic
Neisseria.
3.1.1.6. Cooked Meat Media: Cooked Meat Medium is used for cultivation of
aerobes and anaerobes, especially pathogenic Clostridium (MacFaddin et al., 1985).
Composition of Cooked Meat Media is given in table 3.6.
Table 3.6: Composition of Cooked Meat Media
Ingredients Quantity (g/l)
Beef Heart 98.0
Proteose Peptone 20.0
Sodium Chloride 5.0
Dextrose 2.0 Final pH ( at 25°C) 7.2±0.2

68
12.5 g of media was added to 100ml of distilled water and mixed thoroughly.
It was allowed to stand for 15 min until all the particles were thoroughly wetted.
Media was sterilized by autoclaving at 121ºC at 15 psi pressure for 20 min.
3.1.1.7. Yeast Extract Peptone Dextrose Media: Yeast Extract Peptone Dextrose
Media is used for cultivation of fungal sp. especially Candida (Shermann, 1991).
Composition of Yeast Extract Peptone Dextrose Media is given in table 3.7.
Table 3.7: Composition of Yeast Extract Peptone Dextrose Media
Ingredients Quantity (g/l) Bactopeptone 20 Dextrose 20 Yeast extract 10 Uracil 0.1 Adenine 0.1 Tryptophan 0.1
Bacto-agar 20
5.5 g of media was added to 100ml of distilled water and mixed thoroughly. It
was allowed to stand for 15 minutes until all the particles were thoroughly hydrated.
Media was sterilized by autoclaving at 121ºC at 15 psi pressure for 20 min.
3.1.1.8. Mac-Conkey Broth: Mac-Conkey Broth is recommended for the selective
enrichment and enumeration of coliforms (McCrady, 1939). It is a differential
medium recommended for the selective isolation and differentiation of lactose
fermenting and lactose non-fermenting enteric bacilli. Composition of Mac-Conkey
Broth is given in table 3.8.
Table 3.8: Composition of Mac-Conkey Broth
Ingredients Quantity (g/l) Peptone 17 Lactose 10 Bile salts 1.5 Sodium chloride 0.03 Neutral red 0.001 pH 7.4± 0.2
69
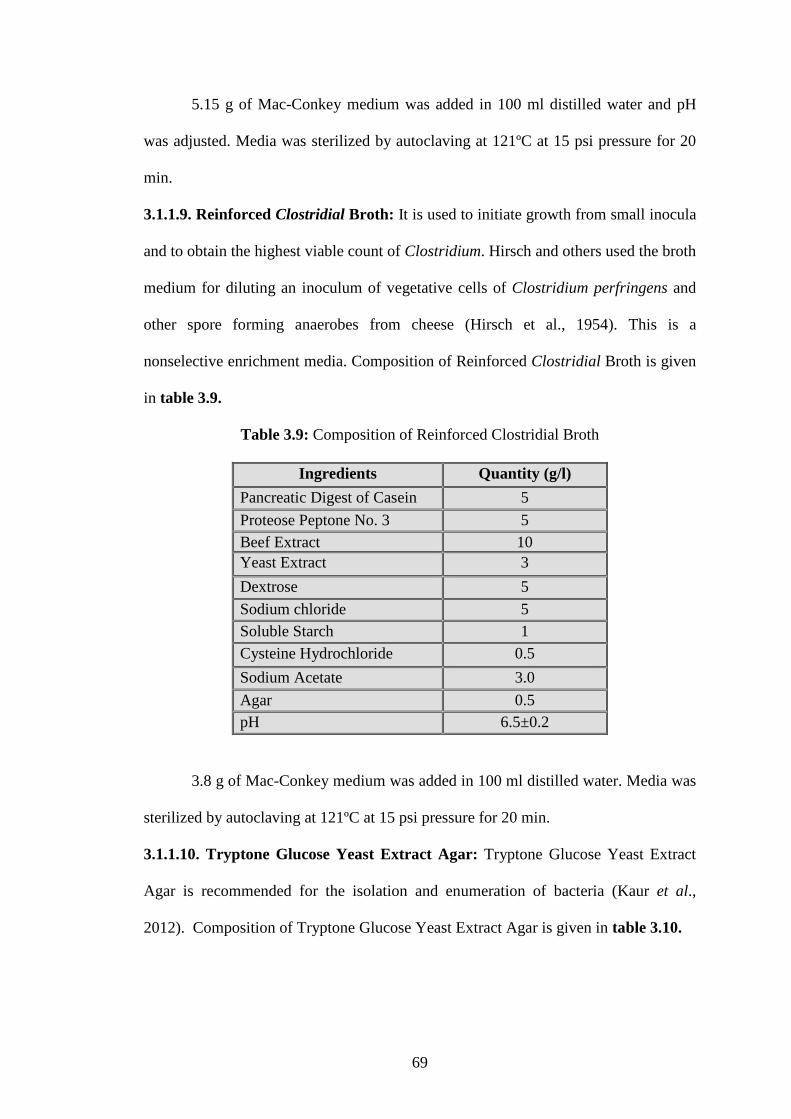
5.15 g of Mac-Conkey medium was added in 100 ml distilled water and pH
was adjusted. Media was sterilized by autoclaving at 121ºC at 15 psi pressure for 20
min.
3.1.1.9. Reinforced Clostridial Broth: It is used to initiate growth from small inocula
and to obtain the highest viable count of Clostridium. Hirsch and others used the broth
medium for diluting an inoculum of vegetative cells of Clostridium perfringens and
other spore forming anaerobes from cheese (Hirsch et al., 1954). This is a
nonselective enrichment media. Composition of Reinforced Clostridial Broth is given
in table 3.9.
Table 3.9: Composition of Reinforced Clostridial Broth
Ingredients Quantity (g/l)
Pancreatic Digest of Casein 5
Proteose Peptone No. 3 5 Beef Extract 10 Yeast Extract 3
Dextrose 5
Sodium chloride 5 Soluble Starch 1 Cysteine Hydrochloride 0.5
Sodium Acetate 3.0
Agar 0.5 pH 6.5±0.2
3.8 g of Mac-Conkey medium was added in 100 ml distilled water. Media was
sterilized by autoclaving at 121ºC at 15 psi pressure for 20 min.
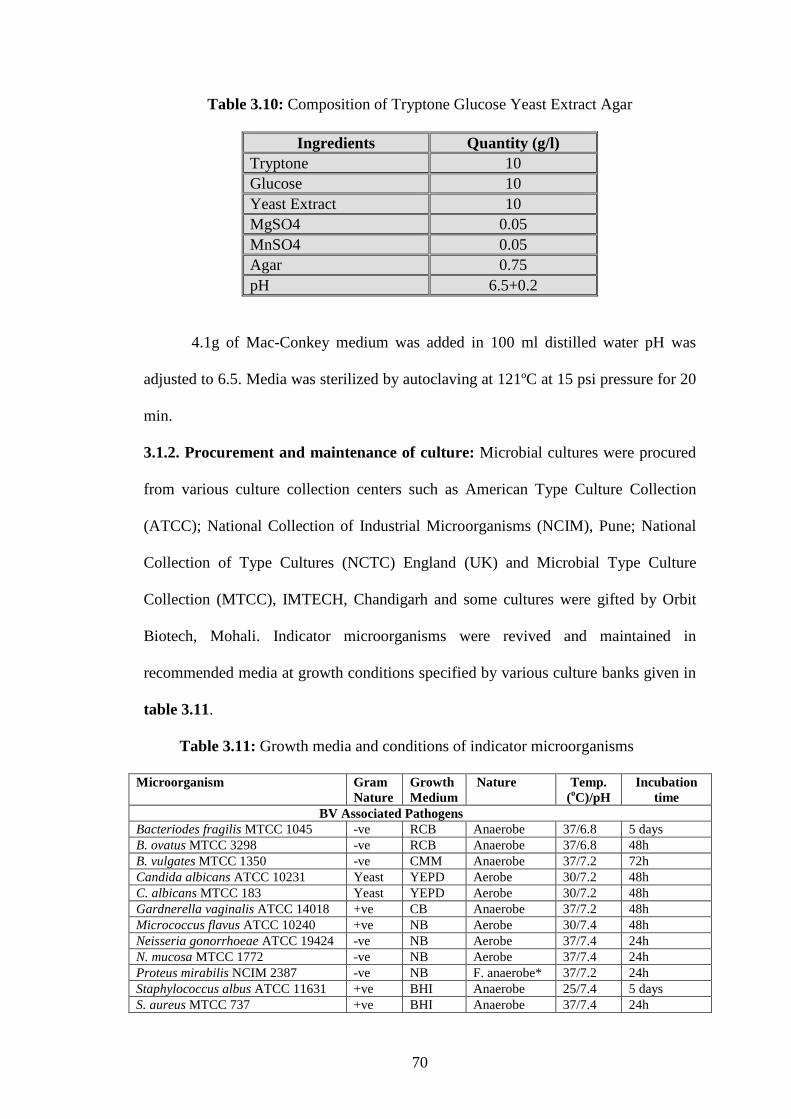
3.1.1.10. Tryptone Glucose Yeast Extract Agar: Tryptone Glucose Yeast Extract
Agar is recommended for the isolation and enumeration of bacteria (Kaur et al.,
2012). Composition of Tryptone Glucose Yeast Extract Agar is given in table 3.10.
70
Table 3.10: Composition of Tryptone Glucose Yeast Extract Agar
Ingredients Quantity (g/l) Tryptone 10 Glucose 10 Yeast Extract 10 MgSO4 0.05 MnSO4 0.05 Agar 0.75 pH 6.5+0.2
4.1g of Mac-Conkey medium was added in 100 ml distilled water pH was
adjusted to 6.5. Media was sterilized by autoclaving at 121ºC at 15 psi pressure for 20
min.
3.1.2. Procurement and maintenance of culture: Microbial cultures were procured
from various culture collection centers such as American Type Culture Collection
(ATCC); National Collection of Industrial Microorganisms (NCIM), Pune; National
Collection of Type Cultures (NCTC) England (UK) and Microbial Type Culture
Collection (MTCC), IMTECH, Chandigarh and some cultures were gifted by Orbit
Biotech, Mohali. Indicator microorganisms were revived and maintained in
recommended media at growth conditions specified by various culture banks given in
table 3.11.
Table 3.11: Growth media and conditions of indicator microorganisms
Microorganism Gram Nature
Growth Medium
Nature Temp. (oC)/pH
Incubation time
BV Associated Pathogens Bacteriodes fragilis MTCC 1045 -ve RCB Anaerobe 37/6.8 5 days B. ovatus MTCC 3298 -ve RCB Anaerobe 37/6.8 48h B. vulgates MTCC 1350 -ve CMM Anaerobe 37/7.2 72h Candida albicans ATCC 10231 Yeast YEPD Aerobe 30/7.2 48h C. albicans MTCC 183 Yeast YEPD Aerobe 30/7.2 48h Gardnerella vaginalis ATCC 14018 +ve CB Anaerobe 37/7.2 48h Micrococcus flavus ATCC 10240 +ve NB Aerobe 30/7.4 48h Neisseria gonorrhoeae ATCC 19424 -ve NB Aerobe 37/7.4 24h N. mucosa MTCC 1772 -ve NB Aerobe 37/7.4 24h Proteus mirabilis NCIM 2387 -ve NB F. anaerobe* 37/7.2 24h Staphylococcus albus ATCC 11631 +ve BHI Anaerobe 25/7.4 5 days S. aureus MTCC 737 +ve BHI Anaerobe 37/7.4 24h

71
S. aureus NCTC 7447 +ve BHI Anaerobe 37/7.4 24h Streptococcus agalactiae NCIM 2401 +ve MRS Aerobe 37/6.5 48h S. faecalis MTCC 459 +ve MRS Aerobe 37/6.5 48h S. pyogenes NCTC 10869 +ve BHI Aerobe 37/7.4 48h S. thermophilus MTCC 1928 +ve MRS Aerobe 40/6.5 28h General Human Pathogens Bacillus subtilis ATCC 6633 +ve NB Aerobe 37/7.4 24h Clostridium perfringens MTCC 450 +ve RCB Anaerobe 37/6.8 48h Escherichia coli BL21 DE3 MTCC 1679
-ve NB F. anaerobe 37/7.2 24h
E. coli DH5α MTCC 1652 -ve NB F. anaerobe 37/7.2 24h E. coli KL16 MTCC 1650 -ve NB F. anaerobe 37/7.2 24h Enterococcus faecalis (Lab isolate) +ve MRS F. anaerobe 37/6.5 24h E. faecalis (NDRI isolate) +ve MRS F. anaerobe 37/6.5 24h E. faecalis ATCC 29212 +ve MRS F. anaerobe 37/6.5 24h Klebsiella pneumoniae NCIM 2883 -ve NB F. anaerobe 30/7.2 24h K. pneumoniae NCIM 2401 -ve NB F. anaerobe 30/7.2 24h Leuconostoc mesenteroides MTCC 107
+ve MRS Aerobe 25/6.5 48h
Listeria monocytogenes MTCC 657 +ve BHI Aerobe 37/7.4 24h Pseudomonas aeruginosa ATCC 10662
+ve NB Aerobe 30/7.4 24h
Salmonella typhi NCTC 5760 -ve BHI F. anaerobe 37/7.4 24h Vibrio cholera ATCC 14104 -ve NB Aerobe 37/7.4 24h Yersinia enterocolitica MTCC 861 -ve BHI F.anaerobe 30/7.2 12h Non-Pathogenic Microorganisms Lactobacillus brevis MTCC 1750 +ve MRS F. anaerobe 30/7.4 24h L. bulgaricus NCDC 253 +ve MRS F. anaerobe 37/6.5 24h L. casei NCIM 2651 +ve MRS F.anaerobe 37/6.5 24h L. helveticus NCIM 2126 +ve MRS F.anaerobe 37/6.5 24h L. leichmanni NCIM 2027 +ve MRS F. anaerobe 37/6.5 24h L. pentosus NCIM 2669 +ve MRS F. anaerobe 37/6.5 24h L. plantarum NCIM 2912 +ve MRS F. anaerobe 37/6.5 24h Lactococcus lactis subsp. cremoris MTCC 1484
+ve MRS Aerobe 20/6.5 24h
Pediococcus acidilactici LB 42 +ve MRS Aerobe 30/6.5 24h F. anaerobe*- Facultative anaerobe
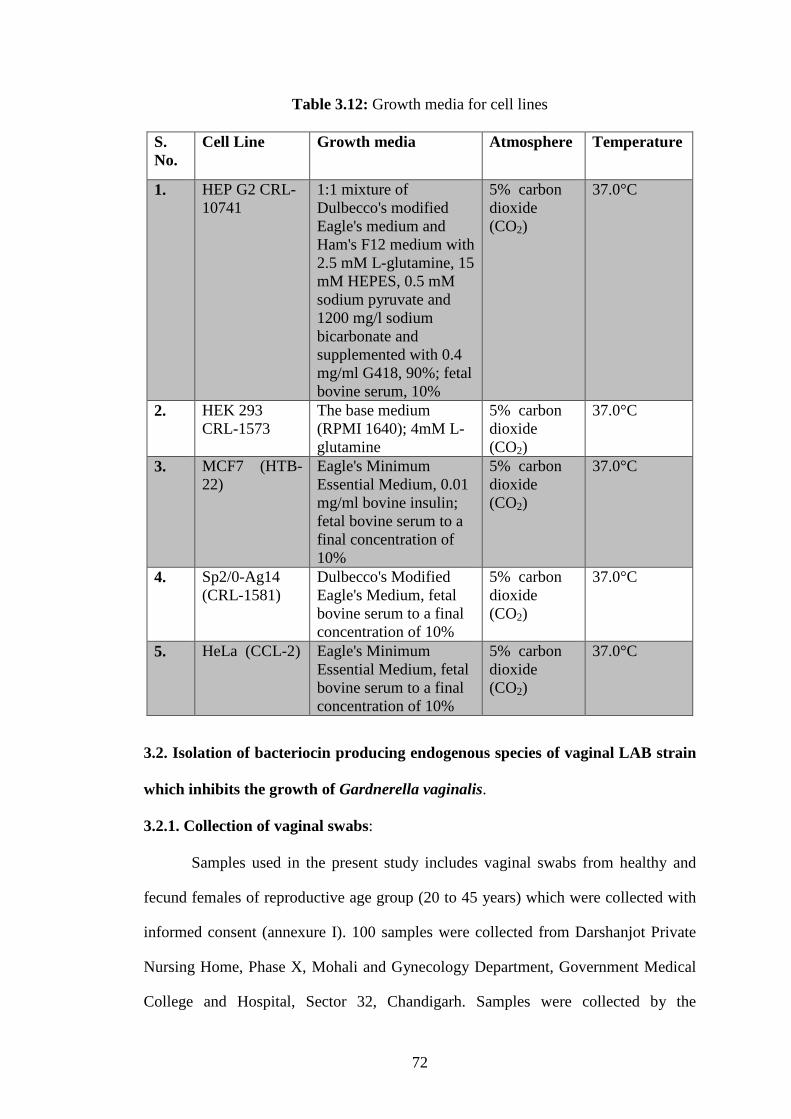
3.1.3. Procurement and maintenance of cancerous cell lines: Cell lines were
procured from NCIM, Pune and few of them were gifted by Dr. Sanyog Jain, NIPER,
Mohali. Cell lines were revived and maintained in recommended media at growth
conditions specified by various culture banks given in table 3.12.
72
Table 3.12: Growth media for cell lines
S. No.
Cell Line Growth media Atmosphere Temperature
1. HEP G2 CRL-10741
1:1 mixture of Dulbecco's modified Eagle's medium and Ham's F12 medium with 2.5 mM L-glutamine, 15 mM HEPES, 0.5 mM sodium pyruvate and 1200 mg/l sodium bicarbonate and supplemented with 0.4 mg/ml G418, 90%; fetal bovine serum, 10%
5% carbon dioxide (CO2)
37.0°C
2. HEK 293 CRL-1573
The base medium (RPMI 1640); 4mM L-glutamine
5% carbon dioxide (CO2)
37.0°C
3. MCF7 (HTB-22)
Eagle's Minimum Essential Medium, 0.01 mg/ml bovine insulin; fetal bovine serum to a final concentration of 10%
5% carbon dioxide (CO2)
37.0°C
4. Sp2/0-Ag14 (CRL-1581)
Dulbecco's Modified Eagle's Medium, fetal bovine serum to a final concentration of 10%
5% carbon dioxide (CO2)
37.0°C
5. HeLa (CCL-2) Eagle's Minimum Essential Medium, fetal bovine serum to a final concentration of 10%
5% carbon dioxide (CO2)
37.0°C
3.2. Isolation of bacteriocin producing endogenous species of vaginal LAB strain
which inhibits the growth of Gardnerella vaginalis.
3.2.1. Collection of vaginal swabs:
Samples used in the present study includes vaginal swabs from healthy and
fecund females of reproductive age group (20 to 45 years) which were collected with
informed consent (annexure I). 100 samples were collected from Darshanjot Private
Nursing Home, Phase X, Mohali and Gynecology Department, Government Medical
College and Hospital, Sector 32, Chandigarh. Samples were collected by the

73
Gynecologist using sterilized ear buds and transferred immediately to sterilized
normal saline (NaCl). Guidelines of Institutional Ethical Committee (IEC) vide
reference no. IEC/IRB N: 005 were strictly followed during sample collection.
3.2.2. Cultivation of LAB microflora of the samples:
LAB microflora present in vaginal samples were cultivated in MRS medium
pH 6.5 at 37ºC for 24 hours. Appearance of yellow color in broth indicates presence
of acid producing bacterial strains. Samples were subcultured thrice before
proceeding with bacterial isolation and bacteriocin activity assays. LAB strains were
isolated on MRS agar plates using pure culture techniques (Old et al., 1970).
3.2.3. Isolation of the bacteriocin producing LAB:
Pure cultures were isolated from the above isolates by quadrant streaking on
MRS agar plates (Old et al., 1970). Isolates were purified by repeated streaking and
were used for screening of bacteriocin producing LAB strains.
3.2.4. Bacteriocin activity assays:
Bacteriocinogenic activity of vaginal LAB isolates was assayed using
following methods:
3.2.4.1. Agar-Spot Assay: Agar-spot assay was carried out by with little
modifications was followed to assay the Bac+ activity of the isolated cultures (Sarkar
and Banerjee, 1996). Plates of MRS agar (1% w/v agar) were allowed to set
overnight, spotted with 18h old producing cultures (3-5 spots per plate) and incubated
at 37°C for 24h. TGE supplemented with 0.75% (w/v) agar termed TGE soft agar,
was tempered to 45°C and seeded with 18h old 105-106 cfu/ml indicator strain. The
number of cells was determined, using haemocytometer and microscope under 45X
magnification. The spotted plates were heat treated and overlaid with 4-6 ml of the
seeded TGE soft agar, incubated at 30°C for 24h and observed for inhibition zones.
Inhibition was scored positive, if the width of the clear zone around the colonies of
the producing strain was 0.5 mm or larger with indicator bacteria used in study.

74
3.2.4.2. Agar Well Diffusion Assay: Bacteriocin activity assay associated with the
isolated cultures was done in accordance to the standard protocol with little
modifications (Toba et al., 1991). Isolated cultures, with positive results in agar-spot
test against the respective indicator bacteria, were tested for the antibacterial activity
in neutralized cell free supernatants (CFS) by well diffusion assay. CFS of 24h old
culture was neutralized to pH 6.5 with 1N NaOH and heat treated in boiling water
bath for 5 min. MRS bottom agar plates were overlaid with TGE soft agar seeded with
18h old culture with 105-106 cfu/ml indicator bacteria. Wells of 6mm diameter cut
with sterile cork borer were filled with 50µl of the CFS. Plates were kept at 4°C for
1h to allow diffusion of CFS out of the wells. Plates were then incubated at 37°C for
24h and the antimicrobial activity of supernatant was detected and quantitated by
measuring the width of the clear zones around the wells in the resultant lawn culture.
3.2.4.3. Spot-on-Lawn Assay: Spot-on lawn assay was carried out by spotting 5µl of
CFS and dilutions prepared on MRS 1% (w/v) bottom agar and overlaid with TGE
0.75% (w/v) soft agar pre-seeded with approximately 106 cfu/ml of P. acidilactici
LB42 indicator strain. Assay plates were incubated at 37°C for 24h. The titre was
expressed as the reciprocal of the highest dilution showing a definite zone of
inhibition/lysis in the resultant lawn culture (Pucci et al., 1988). Titre multiplied with
dilution factor i.e. 200, so as to get total activity units per ml of the sample.
3.2.4.4. Disc diffusion assay: 1% selective media agar plates were prepared and
mixed with 30µl of 24 hour old indicator culture in 0.75% soft agar. Discs of
approximately 6mm diameter were placed on agar plates and spotted with 5µl of CFS
or purified bacteriocin or antibiotic suspension in various assays. Plates were
incubated at 37°C for 24 h and the inhibition zones around the discs were observed
(Jorgensen et al., 2007).
75
3.3. Study of antibiotic susceptibility of the vaginal LAB isolates:
Antibiotic susceptibility of human vaginal LAB isolates was studied at
different concentrations of some commonly prescribed antibiotics (2 to 8 µg/ml) to
BV patients. Ampicillin, amoxicillin, amoxicillin and clavalanic acid, azithromycin,
ciprofloxacin, co-trimoxazole, erythromycin, gentamycin, metronidazole, nalidixic
acid, ofloxacin, penicillin, rimphicin, tetracycline, tinidazole and vancomycin
susceptibility of LAB isolates was evaluated by agar well diffusion (Toba et al., 1991)
and disc diffusion methods (Jorgensen et al., 2007; Kaur et al., 2012).
MRS bottom agar plates were pre-seeded with 18h old 105-106 cfu/ml
indicator bacteria. Wells of 6mm diameter cut with sterile cork borer were filled with
100µl of antibiotic suspension made in the range from 2 to 8 µg/ml. Plates were kept
at 4°C for 1h to allow diffusion of antibiotics out of the wells and were then incubated
at 30°C for 24h. The antibiotic sensitivity activity of isolates was detected and
quantitated by measuring the width of the clear zones around the wells in the resultant
lawn culture. Similarly, disc diffusion assay was performed with different
concentrations of antibiotics.
3.4. Study of Antimicrobial range of bacteriocin produced by LAB isolates:
Antimicrobial activity of bacteriocins produced by LAB isolates was
characterized using spot-on-lawn and well diffusion method (Pucci et al., 1988; Toba
et al., 1991). Microorganisms were divided into two categories i.e general human
pathogens and non-pathogens (table 3.11). General human pathogens used in the
study in the were Bacillus subtilis ATCC6633, Clostridium perfringens MTCC450,
Escherichia coli BL21 (DE3) MTCC1679, MTCC1652 and MTCC1650,
Enterococcus faecalis (Lab isolate), ATCC29212, Klebsiella pneumoniae NCIM2883,
NCIM2401, Leuconostoc mesenteroides MTCC107, Listeria monocytogenes

76
MTCC657, Pseudomonas aeruginosa ATCC10662, Salmonella typhi NCTC5760,
Vibrio cholera ATCC14104 and Yersinia enterocolitica MTCC861. Non-pathogenic
microorganisms assayed in the study included Lactobacillus brevis MTCC1750, L.
bulgaricus NCDC253, L. casei NCIM2651, L. helveticus NCIM2126, L. leichmanni
NCIM2027, L. pentosus NCIM2669, L. plantarum NCIM2912, Lactococcus lactis
subsp. cremoris MTCC1484 and Pediococcus acidilactici LB-42.
3.5. Identification of the bacteriocin producing anti-Gardnerella vaginalis LAB
isolate:
Characterization of the bacteriocin producing LAB isolates was carried out in
two steps:
3.5.1. Identification of microorganism at Generic Level:
Bacteriocin producing strains isolated from healthy human vaginal was
identified and characterized biochemically as per “Bergey’s Manual of Determinative
Bacteriology” – 9th Edition. As the isolation of LAB strains was carried out by
enrichment culture technique using MRS modified broth (supplemented with 3%
NaCl and 0.01% cycloheximide), only those strains were allowed to grow, that
belongs to genera viz. Lactococcus, Pediococcus, Lactobacillus etc. Different
morphological and biochemical properties studied include:
1. Gram-Staining: The Gram staining was carried out as per instructions given
with the Gram Staining Kit (Hi-media).
2. Morphological Examination: Gram stained slides of the producer strains
were viewed at 100X magnification under oil immersion and the most
common appearance of the cells and their predominant arrangements was
observed using binocular microscope.
3. Micro-Aerophilic Nature: 10ml MRS broth (pH 6.5) in the test tubes and
100 ml MRS broth in 250 ml flasks were inoculated with producer strains at

77
1% (v/v) inoculums and incubated at 37°C for 24h. Growth was observed by
taking OD of 1ml aliquot of the culture at 600nm after appropriate dilutions of
the pelleted cells with normal saline, using UV-VIS spectrophotometer (E.
Merck).
4. Motility: A drop of culture was poured on a sterile and clean glass slide.
Cover slip was placed on the culture drop and viewed under the microscope at
45X magnification and observed for wriggling movements of cells.
5. Growth at Different Temperatures: Growth pattern of LAB isolates at
different temperatures reflected a good picture of the putative bacterial species
present in the culture. MRS broth were inoculated at 1% (v/v) inoculums from
bacteriocin produced LAB isolate. Initial pH of the media was set 6.5 using
1N NaOH or diluted HCl. Samples were incubated at three different
temperatures viz. 10°, 20°, 30°, 37°, 40° and 60° C for 24h. OD600 was
measured using a UV-VIS spectrophotometer after 24h culturing and diluting
the pelleted cells with 1N saline.
6. Growth at different pH: MRS broths were adjusted to pH 4.2, 7.5, 8.5 and
9.6, 11 autoclaved and inoculated at 1% (v/v) inoculums of the producing
strain. After 24h of the incubation at 37°C, growth was measured by taking
OD of 500µl pelleted cells at 600 nm using a UV-VIS spectrophotometer as
described earlier.
7. Growth in the presence of 6.5% NaCl: MRS broth (pH 6.5) was prepared
and NaCl was added so as to get a final concentration of 6.5%. It was
inoculated with 1% (v/v) inoculums of the producer strain and incubated at
37°C for 24h. After incubation was over, growth was compared with controls
lacking inoculums, by measuring OD600 after making appropriate dilutions of
cultured cells of control and test samples with 1N saline.

78
8. Growth with 40% Bile : To MRS broth (pH 6.5), bile salt mixture was added
at final concentration of 40% (w/v) and inoculated using 1% (v/v) inoculums
of the producer isolate. It was inoculated along with a control lacking
inoculums at 37°C for 24h and growth was compared with that of control by
measuring OD600 using UV-VIS spectrophotometer, after diluting cultures
with 1N saline according to the requirement.
9. Catalase Reaction: The reaction was carried out using methodology as
described by Smibert and Krieg (1994). To 0.5 ml culture broth of each
producer strain, an equal volume of 3% H2O2 was added and observed for
bubbling immediately after the addition of H2O2 and after 5 min of H2O2
addition. Bubbling in the reaction indicates a positive catalase activity.
10. Oxidase test: Oxidase test was performed by adding tetramethyl paraphenyl
diamino dihydrochloride to a test tube containing 24h old culture (Kaur et al.,
2012).
11. Sugar fermentation profile: The sugar fermentation profile of isolate was
checked for glucose (1%), lactose (5%), mannitol (1%), sucrose (1%), dulcitol
(1%), rhamnose (1%), sorbitoland (1%), xylose (1%) and trehalose (1%) by
adding 1 ml of Andrades indicator in MRS broth containing inverted
Durham’s tube (Kaur et al., 2012).
12. Indole test: Indole test was performed using peptone water. Peptone water
was inoculated and incubated overnight. After 24h Kovac’s reagent was added
and color was observed (Kaur et al., 2012).
13. Methyl Red test: Methyl-Red test was carried out to study the ability of strain
to perform mixed-acid fermentation. Organisms that perform mixed-acid
fermentation produce enough acid to overcome the buffering capacity of the
79
broth, so a decrease in pH results. After incubation, the pH indicator methyl
red is added to the broth. Methyl red is red at pH below 4.4 (this would be a
positive result) and yellow at pH above 6.0. An orange color indicates an
intermediate pH and would be considered a negative result (Kaur et al., 2012).
14. Voges-Proskaeur test: It was performed by inoculating in glucose phosphate
medium. Production of ammonia from arginine was assessed in arginine broth.
Arginine deamination was detected using Thornley’s semi solid medium
(Kaur et al., 2012).
15. Lactic acid production by HPLC: Lactic acid production was determined by
HPLC on C18 reverse phase column by maintaining flow rate of 0.8ml/min
using phosphate buffer (pH 2.4) in PDA 214 nm detector and compared with
C-18 reverse phase chromatogram of pure lactic acid (Kaur et al., 2012).
16. Lactic acid production by GC: Lactic acid production was also analyzed by
gas chromatography using polyethylene glycol (PEG) column and flame
ionization detector. Detector temperature 250oC, injector 150oC, oven
temperature 150oC (Kaur et al., 2012).
3.5.2. Characterization of LAB Isolates at Species Level:
The 16SrRNA gene sequencing of the selected HV6b isolate was carried out
by Bangalore Genei Private Limited, Bangalore, India. 16SrRNA gene sequence was
uploaded to Genbank database and the strain was deposited with MTCC culture bank,
India.
3.6. Study of localization of genes responsible for bacteriocin production in Anti-
Gardnerella LAB isolate:
3.6.1 Isolation of Plasmid DNA:
3.6.1.1 Principle: Bacterial plasmids exist as ccc molecules having –ve super helical
twists. In plasmid isolation most of procedures make use of the closed circular form
80
of bacterial plasmids and their small size in reaction to bacterial chromosome. EDTA
is included in plasmid isolation procedures as chelate metal ions and thus inhibit
cation dependent nucleases. In isolation procedure, first step is to lyse the cells by
treating them with EDTA and lysozyme which breakdown the cell wall. The outer
membrane is disrupted by EDTA and thus allows lysozyme to degrade the
mucopeptide layer of the cell wall so that sphaeroblasts are formed. Sphaeroblasts in
an isoosmotic solution are then lyzed by adding a lysis reagent. Alkaline conditions
(pH 12-12.5) which denature linear DNA molecule and do not denature ccc
molecules. DNA precipitates, when the cell extract is neutralized at high salt
concentration due to reassociation of long ss DNA molecules occur at multiple sites to
form an insoluble mass. Cellular RNA and most of the proteins also precipitates
because of presence of SDS during reaction (Birnboin and Doly, 1979; Menon et al.,
2009).
3.6.1.2. Principle of Alkaline extraction method:
Preparation of Solutions for Plasmid Extraction:
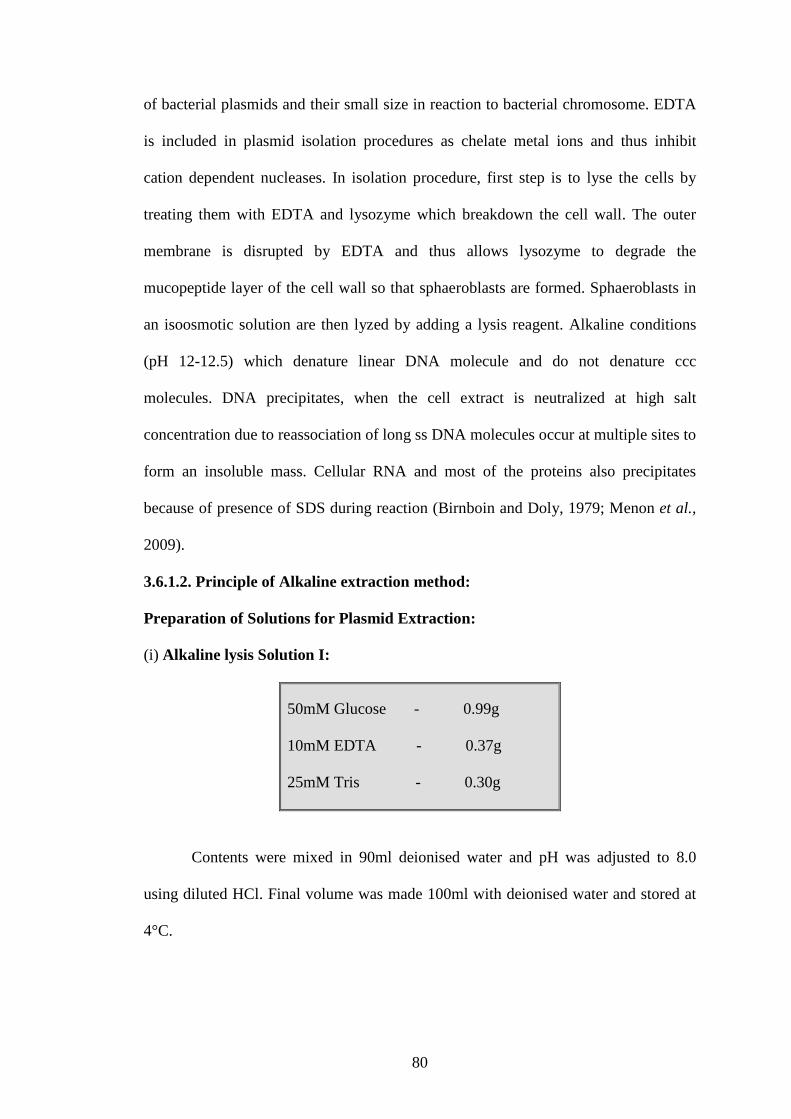
(i) Alkaline lysis Solution I:
50mM Glucose - 0.99g
10mM EDTA - 0.37g
25mM Tris - 0.30g
Contents were mixed in 90ml deionised water and pH was adjusted to 8.0
using diluted HCl. Final volume was made 100ml with deionised water and stored at
4°C.
81
(ii) Lysozyme Stock Solutions:
100mg of lysozyme was added to 1ml of solution I to prepare lysozyme stock
I and its 10µl aliquot (containing 1mg lysozyme) was further diluted 10 times in
solution I, to prepare lysozyme stock II. Lysozyme stock II was freshly prepared at
the time of use.
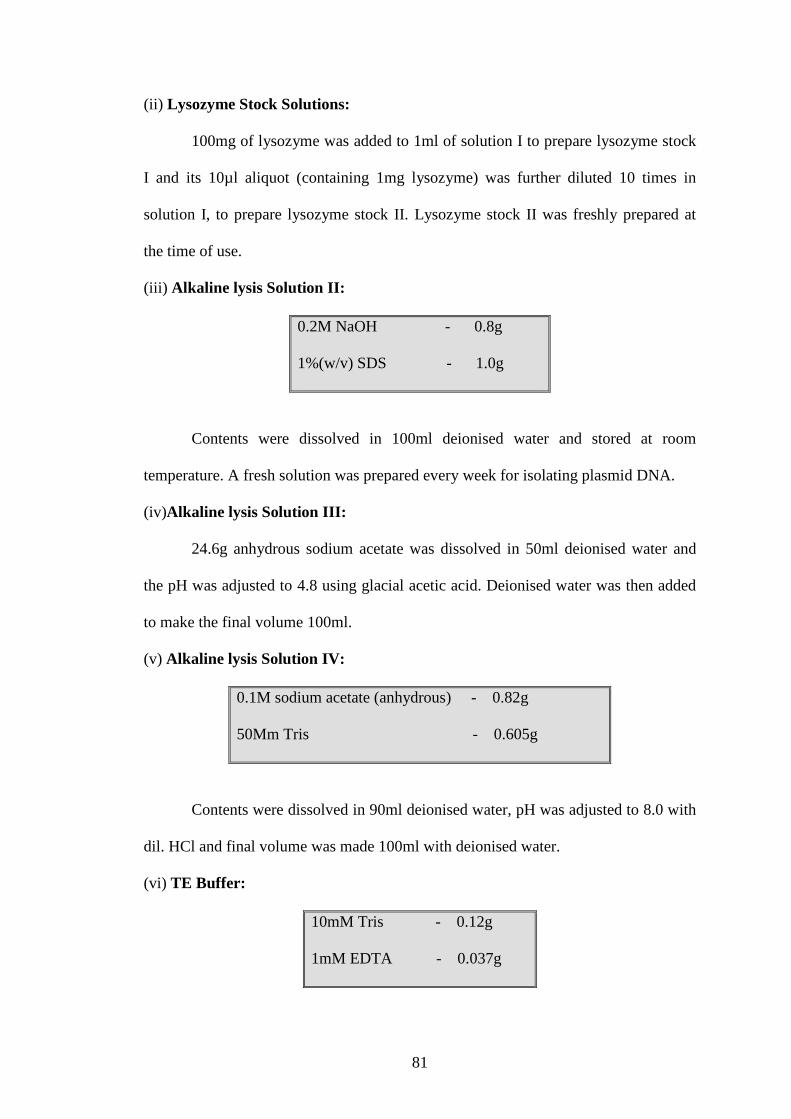
(iii) Alkaline lysis Solution II:
0.2M NaOH - 0.8g
1%(w/v) SDS - 1.0g
Contents were dissolved in 100ml deionised water and stored at room
temperature. A fresh solution was prepared every week for isolating plasmid DNA.
(iv)Alkaline lysis Solution III:
24.6g anhydrous sodium acetate was dissolved in 50ml deionised water and
the pH was adjusted to 4.8 using glacial acetic acid. Deionised water was then added
to make the final volume 100ml.
(v) Alkaline lysis Solution IV:
0.1M sodium acetate (anhydrous) - 0.82g
50Mm Tris - 0.605g
Contents were dissolved in 90ml deionised water, pH was adjusted to 8.0 with
dil. HCl and final volume was made 100ml with deionised water.
(vi) TE Buffer:
10mM Tris - 0.12g
1mM EDTA - 0.037g
82
Contents were dissolved in 90ml of deionised water and pH was adjusted to
7.5 with dil. HCl. Final volume was raised to 100ml.
3.6.1.3. Procedure:
L. fermentum HV6b was grown in MRS broth for 16-18h. Cells were
harvested by centrifugation of 3ml culture broths in eppendrofs for 5min at 5000rpm
in a microfuge centrifuge (Tarsons). Pellets were resuspended in 100µl of solution I
and 20µl of lysozyme stock II with a final lysozyme concentration of 2mg/ml.
Eppendrofs were kept in dry ice for 15 min after a gentle vortexing. 200µl of solution
II was added and the contents were mixed by inverting and again kept in dry ice for
another 5 min.150µl of solution III was added and the contents were gently mixed by
inverting and incubated the eppendrofs in dry ice for a time period of 30 min. After
the incubation was over, cell debris and fragments of bacterial chromosome attached
to cell envelop were removed by centrifugation at 4°C for 5 min at a full speed, “A
Clearing Spin”. Clear supernatant was separated in a fresh tube and 1ml of chilled
ethanol was added to the samples, which were kept in dry ice for 5-10 min and then
centrifuged at full speed for 10 min at 4°C. Supernatant was removed carefully and
pellet was resuspended in 100µl of solution IV. 1ml chilled ethanol was added to each
eppendrofs. Samples were vortexed, kept in dry ice for 5 min and then centrifuged for
5 min at 4°C. Supernatants were discarded and the pellet were washed twice with
400µl of chilled ethanol. The eppendrofs were centrifuged at 4°C for 5 min, the
supernatants were discarded. Pellets were allowed to get dry in a desiccator and the
resuspended in 30µl of TE buffer. All the plasmid preparations were stored at -20°C.
3.6.2. Curing of Plasmid DNA:
Curing of plasmid DNA was accomplished through the growth in the presence
of ethidium bromide. 1% (v/v) inoculums of L. fermentum HV6b (18 hour old

83
culture) was added to sterile MRS broth containing 20µg of ethidium bromide per ml.
After incubation at 37°C for 24h, sub culturing was carried out using 1% (v/v)
inoculums in MRS broth lacking ethidium bromide and it was incubated for another
24h at 37°C. Then the culture was serially diluted and plated onto MRS agar plates,
which were incubated at 37°C for 24h. Colonies were selected at random and tested
for their Bac- characterstics (Batish and Gupta, 1992). Cured HV6b derivatives were
then grown in MRS broth and plasmid isolation was carried out as described above.
Analysis of Bac+ L. fermentum HV6b and cured HV6b derivatives was carried out by
agarose gel electrophoreses along with that of a standard plasmid MW marker
(Novagen).
3.6.3. Agarose Gel Electrophoresis:
3.6.3.1. Principle: Agarose gel electrophoresis method is used to measure the
molecular size of DNA, RNA and plasmid molecules. Negatively charged plasmid
DNA molecules are separated on agarose gel matrix according to their molecular
weight upon electrophoresis. The position of plasmid DNA in the agarose gel is
visualized by staining the gel with low concentration of a fluorescent intercalating dye
like ethidium bromide. Smaller molecules move faster and migrate farther than larger
ones because the migrate ion rates of plasmid DNA molecules are inversely
proportional to the logarithms of the molecular weights. This method is frequently
performed to determine the size of an unknown Plasmid DNA fragment by comparing
it with plasmid DNA ladders of known size. A standard curve can be obtained by
plotting the molecular size of the fragments of the marker against the reciprocal of
their respective mobility. The relative mobility (Rf) of the plasmid DNA ladder
depends upon the log of its relative molecular weight. The Rf value can be determined
after dividing the distance traveled by the DNA by distance traveled by tracking dye.
The molecular size of the test sample can be obtained from the standard curve
(Sambrook and Russel, 2001).
84
Agarose gel is transparent and is the material of choice for electroplating
nucleic acids. Ethidium bromide was either added to gel or to buffer after the run was
over. It gets intercalated between the stacked bases and emits orange fluorescence
when UV light falls on it. Thus, nucleic acid bands can be easily viewed. Molecular
weight determination of unknown DNA fragment/plasmid can be carried out easily
against a ladder of known marker standard plasmid MW marker.
3.6.3.2. Preparation of Solutions:
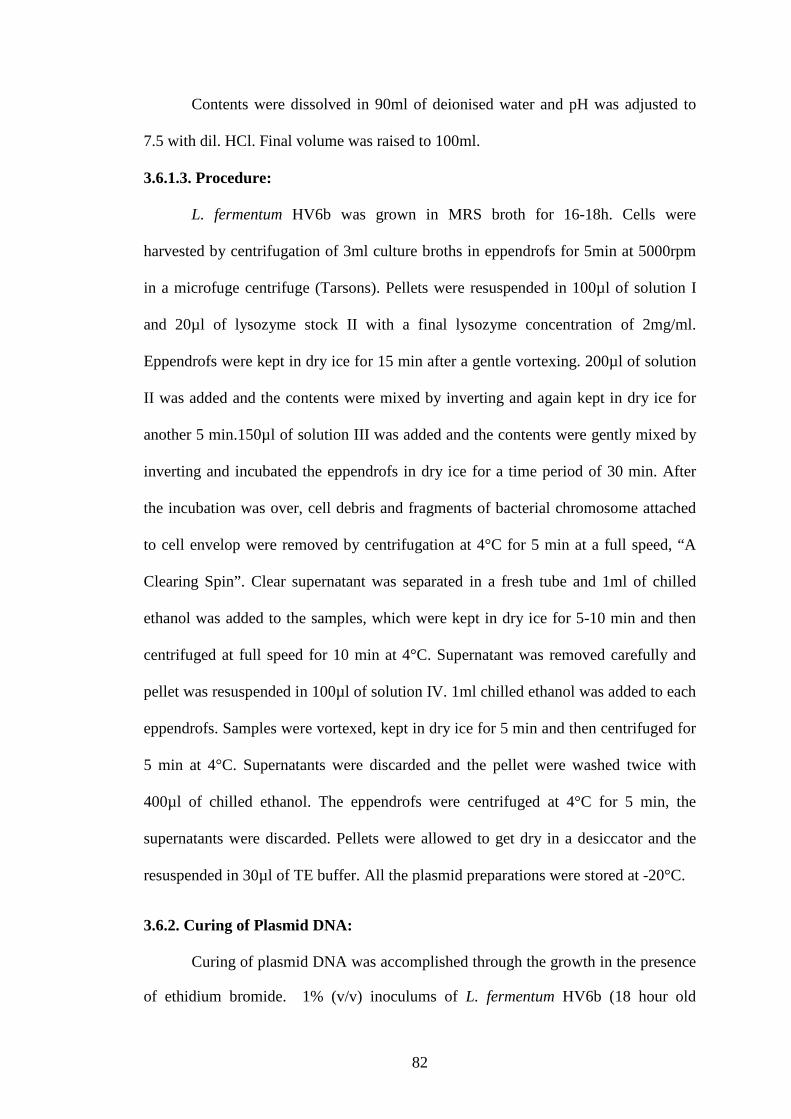
(i) Tris Borate EDTA (TBE) Buffer (10X):
0.89 M Tris base - 21.6 g
0.89M Boric acid - 11.0 g
0.02M Na2-EDTA.2H2O - 1.86 g
pH - 8.3
Contents were dissolved in 150ml deionised water and the final volume was
raised to 200ml. The 10X buffer was diluted 10 times deionized water to prepare
working 1X TBE buffer.
(ii) 0.6% (w/v) Agarose:
0.6g Agarose was dissolved by heating in 100ml 1X TBE buffer.
(iii) 10mg/ml (w/v) Ethidium Bromide:
10mg ethidium bromide was dissolved in 1ml deionised water and stored in dark and
cool place.
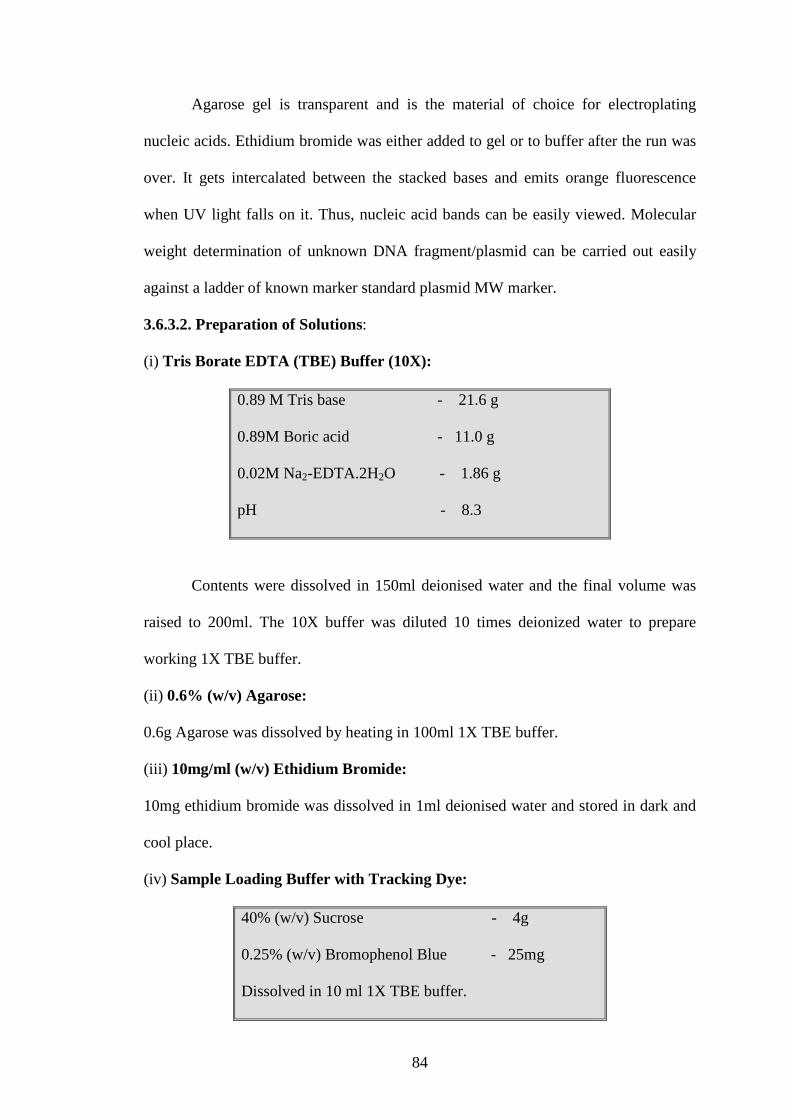
(iv) Sample Loading Buffer with Tracking Dye:
40% (w/v) Sucrose - 4g
0.25% (w/v) Bromophenol Blue - 25mg
Dissolved in 10 ml 1X TBE buffer.
85
3.6.3.3. Procedure:
The gel casting tray was sealed with cello tape. 0.6% agarose gel was prepared
by heating. Ethidium bromide was added to it after cooling down the gel to 45°C, at a
concentration of 5µg/ml of the gel. The gel was poured in casting tray, comb was
inserted carefully, air bubbles were removed using micropipette and it was then
allowed to set for 30min. Cello tape sealing and the comb were removed with care
and the gel was placed in tank filled with 1x the tank buffer. Apparatus was connected
to the power supply. Samples were loaded after mixing them with an equal proportion
of sample loading buffer and electrophoresis was carried out at 50V for 1.5-2h. The
gel was then viewed and photographed by placing it on a UV transilluminator.
3.7. Mode of action of the purified bacteriocin:
3.7.1. Growth inhibition assay: To study mode of action of bacteriocin produced by
the L. fermentum HV6b, the most sensitive indicator bacteria i.e. G. vaginalis was
selected. Strain G. vaginalis was inoculated at 1% (v/v) in Casman media along with
selective media and incubated for 4-5 hours at 37°C. In the meanwhile, 1ml aliquots
of freshly grown cultures were prepared in the sterile eppendrofs. Whole experiment
was carried out in duplicate sets containing control, 100µg/ml to 500µg/ml of purified
bacteriocin treated cultures. After, incubation at 37°C for 24h, log cfu/ml and OD600,
were analyzed for 1 ml of culture broth using normal saline as a blank using UV-VIS
spectrophotometer for colony counting, appropriately diluted samples in (0.85 %
NaCl) were spread plated onto Casman agar (1.0% w/v) plates and incubated at 37°C
for 24h. After 24h colonies were enumerated and data was recorded as log cfu/ml and
OD600 were plotted against concentration of bacteriocin used (Kim et al., 2000).
3.7.2. Scanning Electron Microscope (SEM) studies: The control and treated cells
of the BV pathogen G. vaginalis were examined by SEM to visualize any
86
morphological change that occurred in the cells following exposure to bacteriocin
50µg/ml produced by human vaginal isolate HV6b. Method used for SEM was
slightly different from that described in a previous publication (Parhusip and
Sitanggang ., 2011). G. vaginalis cell suspension was prepared in distilled water and it
was treated with pure bacteriocin at a concentration of 50µg/ml. Suspension was kept
for 90 min at 37ºC in a hydrated chamber and then centrifuged at 10,000 rpm for 2
min at 4ºC. The bacterial samples were washed gently and treated successively with
2% glutaraldehyde solution, 2% tannic acid solution, buffer solution (0.1M sodium
cacodylate containing 10 mM MgSO4; pH 6.7) and 1% osmium tetraoxide solution.
Each specimen was dehydrated using sequential exposure per ethanol concentrations
ranging from 50 - 100%. Cell pellet was dissolved in minimum quantity of ethanol
and a drop of it was transferred to poly-L-lysine-treated silicon wafer chips, which
were kept for 30 min in a hydrated chamber for the cells to adhere. Chips were
viewed at 10kV accelerating voltage in a Hitachi S-4300 field emission scanning
electron microscope and images of the bacteriocin treated cells for topography
contrast were collected at different magnifications.
3.7.3. Atomic Absorption Spectrophotometer (AAS) Analysis: Leakage of
potassium ions (K+) and calcium ions (Ca2+) from bacteriocin treated G. vaginalis
cells was quantified with AAS (Parhusip and Sitanggang, 2011).
3.7.3.1. Principle: AAS is a spectroanalytical procedure for the quantitative
determination of chemical elements employing the absorption of optical radiation
(light) by free atoms in the gaseous state. This technique is used for determining the
concentration of a particular element (the analyte) in a given sample. Analyte content
is established from the relation between the measured absorbance and the analyze
concentration and therefore relies on the Beer-Lambert Law (Lambert, 1760; Beer,
1852; Walsh, 1955, 1973).
87
3.7.3.2. Preparation of calibration curve for K+ and Ca2+ ions: For the preparation
of calibration curve of potassium standard solution of 2% HNO3 was used for AAS of
1000 µg/ml strength and for calcium standard solution was used of 1000 mg/ml
strength and were dissolved in de-ionized water and different dilutions 25 µg/ml to
120 µg/ml were prepared for both the ions. Wavelength of light used in this
experiment was 766.5 nm for K+ and 422.7 nm for Ca2+.
3.7.3.3. Methodology: G. vaginalis was activated in Casman media containing
selective media and incubated for 12 h at 37°C. Freshly activated bacteria were
collected by centrifuging the broth at 4, 032 g force (rotating at 6 000 rpm; radius of
rotor 100 mm) for 15 min. Cells were then washed for several times using deionized
water and finally resuspended in 10 ml deionized water in a reaction tube for each
bacterial strain. Into the tube, a known concentration of bacteriocin was added and
then incubated for 24 h. The quantification method of those cations followed the
procedure of Prashar (2003), where the suspension was then analyzed to determined
K+ at 766.5 nm using AAS instrument (AAS type flame photometer GBC Avanta
PM), and quantified using a standard calibration curve of potassium ion. Similarily,
Ca2+ efflux at 422.7 nm.
3.8. Production and purification of the bacteriocin produced by L. fermentum
HV6b:
3.8.1. Bacteriocin production studies: To study the production of bacteriocin
produced by L. fermentum HV6b in 1l MRS medium. The media having an initial pH
6.5, were inoculated at 1% (v/v) using an overnight grown producer culture and
incubated at 37oC for 24h. 1ml sample were drawn from both the culture broths after
every 4h and the changes in growth, pH of medium and bacteriocin activity were
studied:-
88
3.8.1.1 Preparation of Growth Curve: In order to find out the phase of the culture
associated with bacteriocin production, growth curve of the human vaginal LAB
isolate was prepared. Above drawn sample was centrifuged at 7,000 rpm for 5 min,
the pellet was resuspended in 1ml normal saline and OD was measured at 600nm
using a UV-VIS spectrophotometer. At the end of incubation, OD600 was plotted
against incubation time (h) to construct growth curve of the human vaginal LAB.
3.8.1.2 Variation in pH: Fall in pH due to acid production is an important factor that
starts and regulates bacteriocin secretion in the culture broth. Variation in pH was also
studied each sampling using a pH meter (E. Merck).
3.8.1.3 Calculation of bacteriocin activity (AU/ml): CFS was subjected to a heat
treatment in boiling water bath for 5 min in order to kill the cells left in the
supernatant and then spot-on-lawn assay was performed to calculate AU/ml. Serial
dilutions of CFS up to 1:200 dilution were prepared in sterile deionised water and
spotted on to a freshly overlaid lawn of the indicator P. acidilactici LB42 (Coventry
et al., 1995) and incubated at 37°C for 18-200h. Titre of the bacteriocin was then
calculated as the reciprocal of the highest dilution giving positive inhibition and the
titre was multiplied by dilution factor i.e. 200 to calculate AU/ml.
3.8.2. Production and Purification of the bacteriocin produced by L. fermentum:
Methodology given by Yang et al. (1992) was followed to purify bacteriocin
produced by L. fermentum HV6b by Adsorption-Desorption method. Fermenticin
HV6b was purified by following the original methodology of pH-dependent
adsorption and desorption on to the producer cells that involved three important steps:
(i) Preparation of cells for bacteriocin adsorption.
(ii) Bacteriocin adsorption by the producer cells of L. fermentum.
(iii) Extraction of adsorbed bacteriocin from producer cells.
89
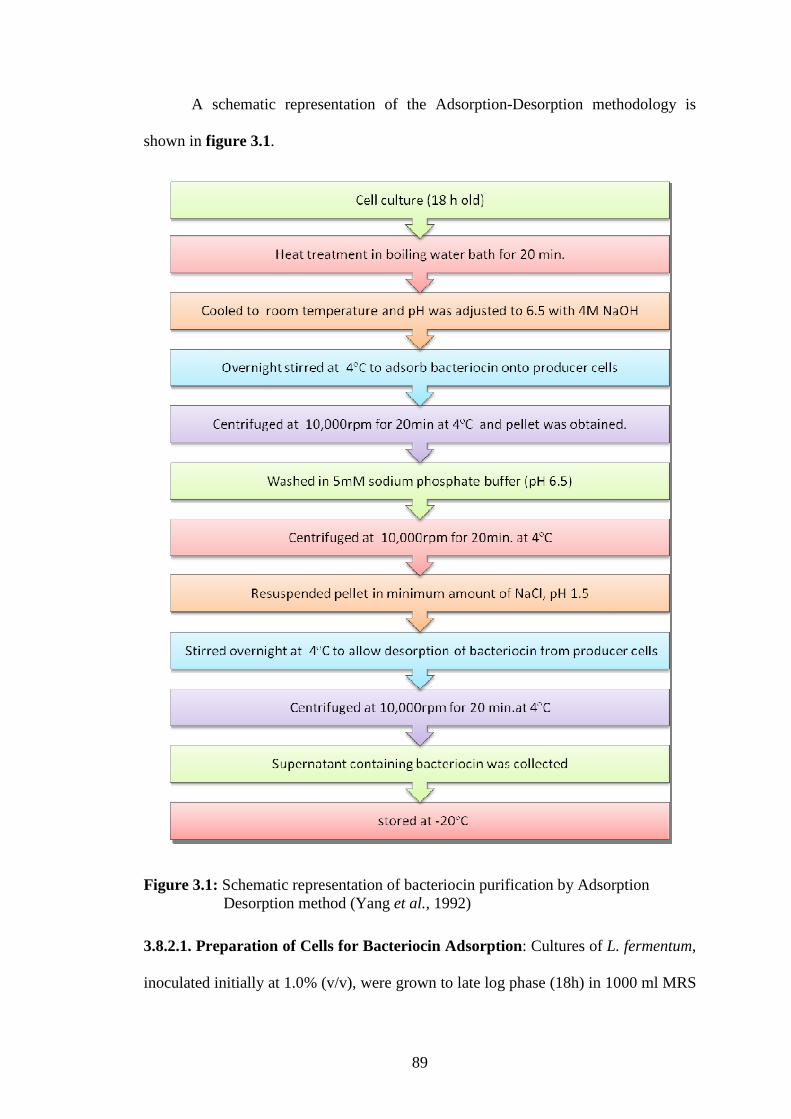
A schematic representation of the Adsorption-Desorption methodology is
shown in figure 3.1.
Figure 3.1: Schematic representation of bacteriocin purification by Adsorption Desorption method (Yang et al., 1992)
3.8.2.1. Preparation of Cells for Bacteriocin Adsorption: Cultures of L. fermentum,
inoculated initially at 1.0% (v/v), were grown to late log phase (18h) in 1000 ml MRS
90
broth supplemented with 0.2% (v/v) Tween 80 (pH6.5), at 37°C. After the incubation
was over, culture broth was heated for 20 min in a boiling water bath, to inactivate
proteases and to kill cells. Culture broth after heat treatment, were allowed to cool
down to room temperature and pH was adjusted to 6.5 with 4M NaOH. An aliquot of
the sample was taken, centrifuged and serially diluted. 5µl of CFS and each dilution
was spotted on to a lawn of indicator bacteria i.e. G. vaginalis ATCC 14018 and
activity units per ml were calculated. OD of the sample was also measured at 280 nm
to quantify the amount of protein present in it.
3.8.2.2. Bacteriocin Adsorption by the Producer Cells: After adjusting the pH of
the cell suspension, it was kept overnight on magnetic stirrer at 4°C with slow stirring
in order to facilitate adsorption of the bacteriocin molecules that were secreted out in
the broth, back on to the producer cells. Cells were harvested by centrifugation at
9000 rpm for 20 min at 4°C, so as to remove the bacteriocin adsorbed on to the dead
cells from the culture liquor. CFS was kept for the estimation of the bacteriocin
AU/ml not adsorbed on to the cells. Cell pellet was washed twice in 5mM sodium
phosphate buffer (pH 6.5).
3.8.2.3. Extraction of Adsorbed Bacteriocin from Producer Cells: Pellet was
resuspended in 10ml 100mM NaCl adjusted to pH 1.5 with 5% (v/v) phosphoric acid.
The suspension was stirred overnight at 4°C and the cells were harvested by
centrifugation at 9000rpm for 30 min. Supernatant was filtered sterilized by passing it
through 0.45 µm filters and was stored at -20°C for further experimentation. An
aliquot of the purified bacteriocin preparation was taken. It was adjusted to pH 6.5
and OD280 was measured in order to calculate increase in specific activity after
purification following the adsorption- desorption method. Total AU/ml were
calculated after serially diluting the sample up to 1:6000 times dilution.
91
3.8.2.4. Standard Curve of Protein: 200mg BSA was dissolved in 100ml normal
saline. BSA dilutions ranging from 100-1000 µg/ml were prepared in normal saline
and OD was measured at 280 nm, using UV-VIS spectrophotometer (E. Merck).
Absorbance values were plotted against different BSA concentrations and thus BSA
standard curve was prepared (Lowry et al., 1951). To calculate protein concentration
in an unknown sample viz. CFS, crude protein and purified protein, samples were
diluted with normal saline according to the requirement and OD was measured.
Protein concentration was then calculated from the standard curve.
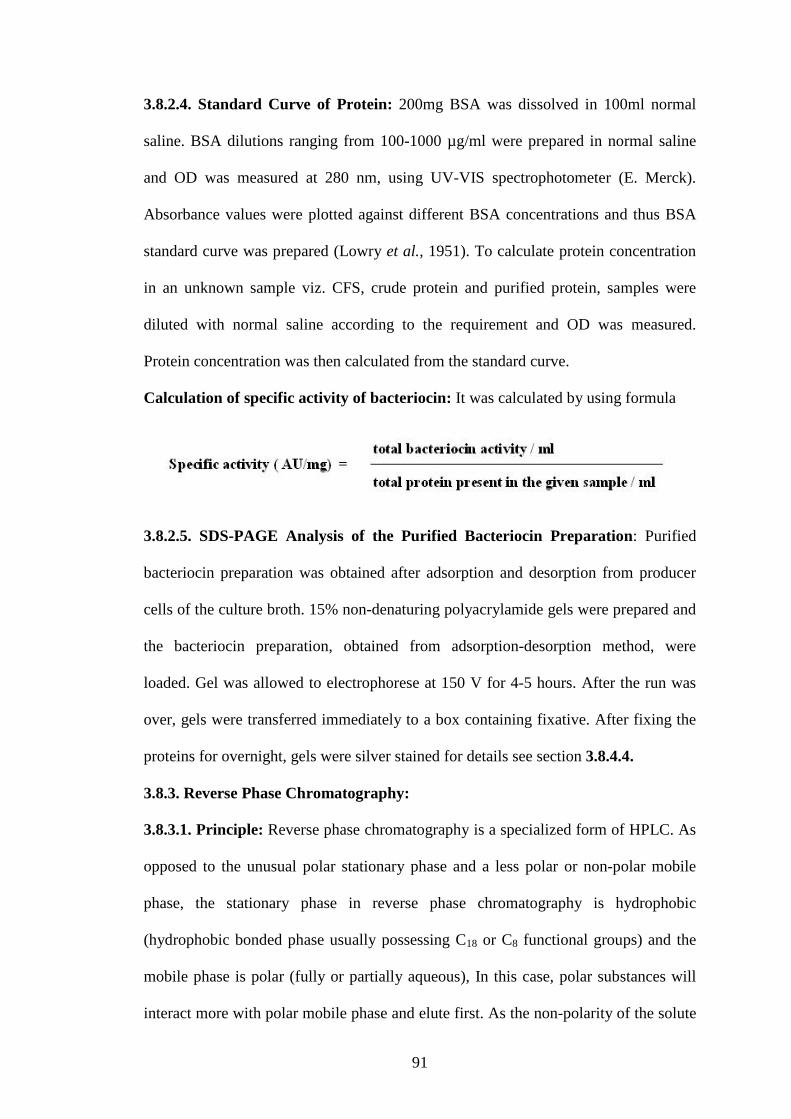
Calculation of specific activity of bacteriocin: It was calculated by using formula
3.8.2.5. SDS-PAGE Analysis of the Purified Bacteriocin Preparation: Purified
bacteriocin preparation was obtained after adsorption and desorption from producer
cells of the culture broth. 15% non-denaturing polyacrylamide gels were prepared and
the bacteriocin preparation, obtained from adsorption-desorption method, were
loaded. Gel was allowed to electrophorese at 150 V for 4-5 hours. After the run was
over, gels were transferred immediately to a box containing fixative. After fixing the
proteins for overnight, gels were silver stained for details see section 3.8.4.4.
3.8.3. Reverse Phase Chromatography:
3.8.3.1. Principle: Reverse phase chromatography is a specialized form of HPLC. As
opposed to the unusual polar stationary phase and a less polar or non-polar mobile
phase, the stationary phase in reverse phase chromatography is hydrophobic
(hydrophobic bonded phase usually possessing C18 or C8 functional groups) and the
mobile phase is polar (fully or partially aqueous), In this case, polar substances will
interact more with polar mobile phase and elute first. As the non-polarity of the solute

92
component increases, their retention time will also increase, since they will interact
more with the non-polar stationary phase. The reverse phase is therefore, more useful
for separation of non-polar solutes. Water, an extremely polar solvent becomes the
weakest elute here. Methanol and acetonitrile are stronger elute than water. Solvents
of intermediate eluting strength can be obtained by mixing one of these solvents with
water. The driving force for the retention of a component is not its interaction with the
stationary phase but the effect of the mobile phase in forcing the component on to the
hydrocarbon bonded stationary phase. Moreover, this squeezing out is proportional to
the non-polar surface area of the solute, thus homologs show a good resolution by
RPC. When the sample has many components covering the wide range of polarity, a
gradient elution has to be carried for optimum resolution. These gradients are
prepared by continuously decreasing the polarity of the eluting solvent. This can be
achieved by gradually increasing the content of organic solvent in water/ organic
solvent mixture (Molnár et al., 1976).
3.8.3.2. Methodology: Freshly prepared purified bacteriocin preparation as obtained
by adsorption-desorption method was analyzed by reverse phase chromatography,
using C-18 Waters column and a 4.6*250mm C18 column. After equilibration of the
column with solvent (70% .1 % trifluoro acetic acid and Acetonitrile), at a flow rate
of .8ml/min, peptides were eluted using the same solvent. Peptides were monitored
spectrophotometrically at 280 nm. Fraction peak was collected manually in vials and
assayed foe bacteriocin activity. Active fractions were separated by carrying out spot-
on-lawn assay with 5µl aliquots of column effluent spotted on to MRS 1%(w/v)
bottom agar plates overlaid with Casman soft agar seeded with 106 cfu/ml indicator
bacteria G. vaginalis 14018. Total AU/ml was calculated after serially diluting the
sample to 1:6000 times with sterile deionized water.
93
3.8.4. Molecular Weight Estimation Using SDS-PAGE:
3.8.4.1. Principle: Polyacrylamide gel is prepared by polymerizing acrylamide
(H2C=CH-CO-NH2) and a small quantity of cross-linking agent,
methylenebisacrylamide (H2C=CH-CO-NH)2-CH2 (bis), in the presence of catalyst,
ammonium persulphate. TEMED is also added to initiate and control polymerization.
A direct contact of air with the gel should be avoided, because oxygen is a potent
inhibitor of polymerization.
SDS is a detergent that readily binds to protein. At pH 7.0 in the presence of
1% (w/v) SDS and 2-mercaptoethanol, proteins dissociate into subunits and bind large
quantities of the detergent. At pH 7.0, most proteins bind at about 1.4g of SDS per
gram of protein which completely masks the natural charge of protein giving a
constant charge to mass ratio and hence the relative mobility depends on its size. A
plot of log10 molecular weight versus relative mobility gives a straight line and thus
the molecular weight of unknown protein is determined by comparing its mobility
with a series of reference protein standards (Shapiro et al., 1967).
Molecular sieving effect of PAG can easily be amended just by altering the
electrophoretic mobility of the glycine buffer system, at pH 8.9 is greater than that of
the protein, so that the buffer boundary always runs ahead of the molecules being
separated. Bromophenol blue is incorporated in to the gels as a marker that marks the
boundary between glycinate and chloride ions. Acrylamide being toxic should be
handled with care, particularly avoiding its contact with the skin. Vertical slab gel
PAGE apparatus (BIORAD, INDIA) was used for the molecular weight analysis of
bacteriocin (Kaur et al., 2003).
3.8.4.2. Preparation of reagents: All the solutions were prepared in deionized water
and stored in dark bottles at 4°C.

94
(a) Tris-Glycine Buffer: It is a concentrated solution of Tris-Glycine-SDS in
distilled/deionized water, especially intended for use as the running buffer in SDS-
PAGE of proteins.
Tris - 6g/l
Glycine - 28.8g/l
pH - 8.9
Diluted up to 1 liter with deionised water filtered and stored at 4°C. Working
Tris-Glycine buffer was prepared by diluting the stock solution to 2 liters with
deionised water.
(b) 30% Acrylamide Stock Solution: Polyacrylamide gels are prepared by the free
radical polymerization of acrylamide and the cross linking agent N N’ methylene bis
acrylamide. Auto-polymerization of acrylamide takes place when it is dissolved in
water due to joining molecules together by head on tail fashion to form long single-
chain polymers. Gel formation requires linking various chains together.
Bisacrylamide is the most frequently used cross linking agent for polyacrylamide gels.
Chemically it can be thought of as two acrylamide molecules coupled head to head at
their non-reactive ends. Bisacrylamide can crosslink two polyacrylamide chains to
one another, thereby resulting in a gel.
Acrylamide - 30g
Bis-acrylamide - 0.4g
Water - 50ml
95
The contents were dissolved by stirring in 50ml deionised water and final
volume was made up to 100ml using deionized water. The solution was stored at 4°C
in the dark.
(c) 1M Tris-HCl Buffer: The Cl- ions from Tris-HCl, move much more quickly in
the electric field and they form an ion front that migrates ahead of the glycine. The
separation of Cl- from the Tris counter-ion (which is now moving towards the
cathode) creates a narrow zone with a steep voltage gradient that pulls the glycine
along behind it, resulting in two narrowly separated fronts of migrating ions; the
highly mobile Cl- front, followed by the slower, mostly neutral glycine front.
Tris - 12.1g
Water - 80ml
pH was adjusted to 8.9 with with dil. HCl and deionized water added to make
final volume 100ml and stored at 4°C.
(d) Sample Loading Buffer:
Sucrose - 5g
Bromophenol Blue - 0.01g
Working Tris-Glycine Buffer - 10ml
Contents were mixed properly by vortexing and then stored at 4°C.
(e) Fixative: Fixation prevents diffusion of proteins, thus keeping the protein bands
sharp and resolved during the staining process. In addition, fixation removes gel
buffer components, most importantly SDS, which may interfere in the staining
process. In some cases, fixatives are used which modify the proteins to enhance the
staining reaction. Fixative was prepared in deionised water.
96
Methanol - 50%
Glacial Acetic Acid - 12%
(f) 10% (w/v) Ammonium Persulphate Solution (APS): APS is a source of free
radicals and is often used as an initiator for gel formation. One hundred mg
ammonium persulphate was added to 1ml deionized water. Use of freshly prepared
ammonium persulphate solution is recommended.
(g)TEMED: After adding TEMED and APS your gel will polymerize fairly quickly,
so do not add these until you are sure you are ready to pour.
(h) 10% (w/v) Sodium Dodecyl Sulphate Solution (SDS): SDS is an anionic
detergent applied to protein sample to linearize proteins and to impart a negative
charge to linearized proteins. In most proteins, the binding of SDS to the polypeptide
chain imparts an even distribution of charge per unit mass, thereby resulting in a
fractionation by approximate size during electrophoresis. One gram of SDS added to
10ml deionised water was allowed to dissolve.
(i) 50% ethanol: It was used for storage of gels.
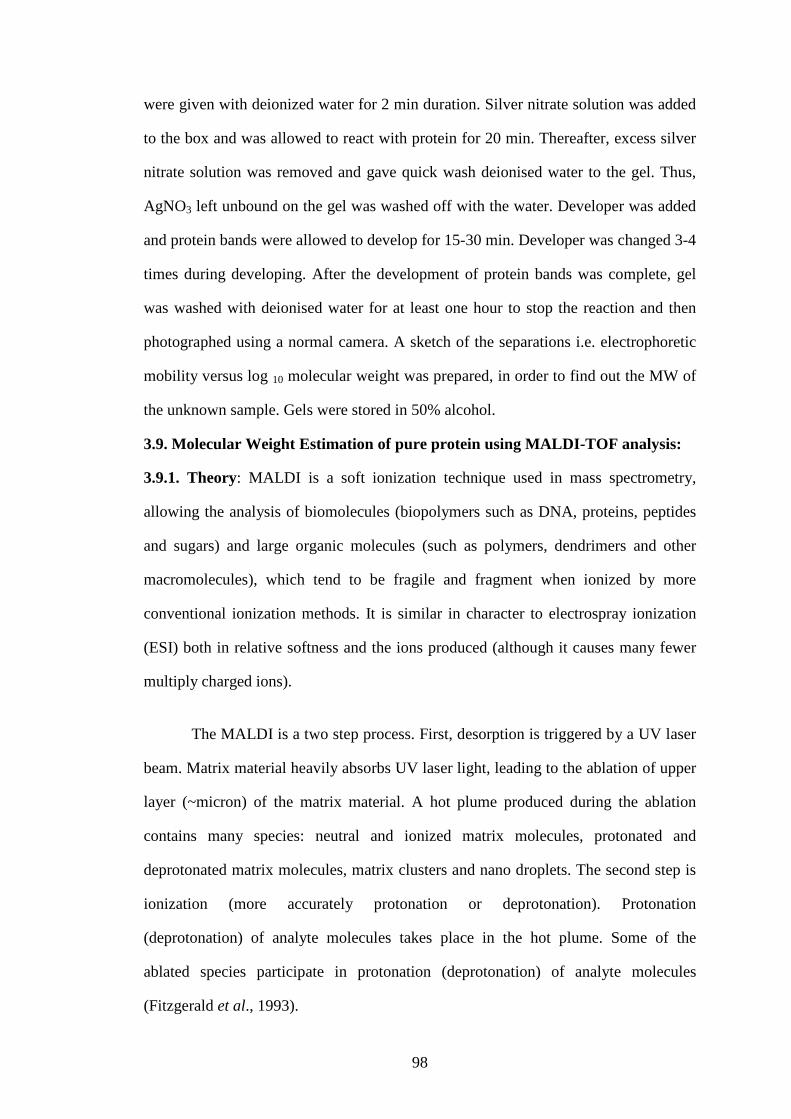
Table 3.13: Composition of 15% gel for 5ml solution
COMPONENTS RESOLVING GEL(15%) STACKING GEL(5%) 30 % Acrylamide 350 µl 850 µl 1.5M Tris (pH8.8) 1820 µl - 1M Tris (pH6.8) - 630 µl Distilled water 1537 µl 3400 µl 10% SDS 70 µl 50 µl 10% APS 70 µl 50 µl TEMED 2.8 µl 5 µl
3.8.4.3. Methodology used:
Glass plates were placed one on the other with spacers in between them. Two
slides and bottom of plates were sealed with cello tape and allowed to bake at 80°C
97
for 30min. Plates were then allowed to cool down to room temperature before pouring
PAG mixture. Separating gel (15%) was prepared according to composition given in
table 3.13. All the reagents were mixed properly except TEMED and deaerated under
vacuum for15 min. APS and TEMED were added to PAG mixture and swirled gently
to mix for initiating polymerization. Solution was poured immediately within stacked
plates with care and overlaid it with deionized water and allowed it to polymerize for
30 min. Overlay solution was rinsed off the after the polymerization was over.
Similarly, stacking gel (5%), over the separating gel. Comb was inserted, immediately
being careful not to allow air bubbles to become trapped under the teeth, overlaid it
with deionized water and allowed it to polymerize for another 30 min. Then, cello
tape seal was removed from bottom of the plates and excess water was rinsed out so
as to connect upper and lower buffer reservoirs through gel. Comb was removed
carefully and the PAGE apparatus was assembled. Tank buffer was poured and the
electrodes were connected to power supply. Samples (crude bacteriocin preparation as
obtained by adsorption-desorption method and MW marker) were mixed with sample
loading buffer in the ratio of 1:1 and loaded on to the wells. Then, the electrophoresis
was carried out at 150V for 4-5h. After the run was over, gel was detached from
plates and transferred to a box containing fixative. Gel was allowed to fix overnight.
3.8.4.4. Ionic Silver Staining of the Gel:
Ionic Silver Staining of the Gel:
Gels were stained by ionic silver staining method for visualization of protein
pattern bands. Gels were kept on a roacker during staining (Gromova et al., 2006).
After an overnight fixation, gel was given three consecutive washings with deionised
water for 20 min each. Then the gel placed in the oxidizing solution and kept for 5
min, the oxidizing solution was removed from staining box and two more washings
98
were given with deionized water for 2 min duration. Silver nitrate solution was added
to the box and was allowed to react with protein for 20 min. Thereafter, excess silver
nitrate solution was removed and gave quick wash deionised water to the gel. Thus,
AgNO3 left unbound on the gel was washed off with the water. Developer was added
and protein bands were allowed to develop for 15-30 min. Developer was changed 3-4
times during developing. After the development of protein bands was complete, gel
was washed with deionised water for at least one hour to stop the reaction and then
photographed using a normal camera. A sketch of the separations i.e. electrophoretic
mobility versus log 10 molecular weight was prepared, in order to find out the MW of
the unknown sample. Gels were stored in 50% alcohol.
3.9. Molecular Weight Estimation of pure protein using MALDI-TOF analysis:
3.9.1. Theory: MALDI is a soft ionization technique used in mass spectrometry,
allowing the analysis of biomolecules (biopolymers such as DNA, proteins, peptides
and sugars) and large organic molecules (such as polymers, dendrimers and other
macromolecules), which tend to be fragile and fragment when ionized by more
conventional ionization methods. It is similar in character to electrospray ionization
(ESI) both in relative softness and the ions produced (although it causes many fewer
multiply charged ions).
The MALDI is a two step process. First, desorption is triggered by a UV laser
beam. Matrix material heavily absorbs UV laser light, leading to the ablation of upper
layer (~micron) of the matrix material. A hot plume produced during the ablation
contains many species: neutral and ionized matrix molecules, protonated and
deprotonated matrix molecules, matrix clusters and nano droplets. The second step is
ionization (more accurately protonation or deprotonation). Protonation
(deprotonation) of analyte molecules takes place in the hot plume. Some of the
ablated species participate in protonation (deprotonation) of analyte molecules
(Fitzgerald et al., 1993).
99
3.9.2. Procedure: MALDI-TOF mass spectrometry was carried-out for MW analysis
of purified fermentin HV6b. Mass spectra were obtained in the positive ion mode,
with an accelerating voltage of 25 KV. One microliter of the pure protein (without
trypsin digestion) was mixed with 1µl of matrix (10mg of sinapinic acid and 0.1% 4-
hydroxy-α-cyanocinnamic acid in 1 ml of distilled water) and 0.3 µl of this mixture
was applied to the Teflon-coated plate (Fitzgerald et al., 1993). BSA was used for
calibration.
3.10. Characterization of the bacteriocin produced:
Fermenticin HV6b produced by human vaginal isolate L. fermentum HV6b
MTCC No. 10770 was characterized and its inhibitory properties were studied against
the most sensitive indicator bacteria, i.e G. vaginalis ATCC 14018. Agar well
diffusion Assay (Pucci et al, 1988) and Spot-on-lawn Assay (Toba et al., 1991) were
followed to characterized fermenticin HV6b for its physiochemical properties:
3.10.1. Sensitivity of bacteriocin to various enzymes: Purified bacteriocin
preparation (as obtained after Adsorption desorption method) from L. fermentum, BV
was treated with various enzyme including proteinase K, trypsin, α-chymotrypsin
(Alpay-Karaoglu et al., 2003). Enzymes stocks were prepared in 50mM phosphate
buffer (pH 7.0) and were added to the reaction mixture to obtain a final concentration
of 3mg/ml. The mixture was incubated at 37°C for 3h. At the end of the incubation,
all the samples were subjected to heat treatment in a boiling water bath for 5 min in
order to inactivate the enzymes and the residual activity of the bacteriocins, was
assayed using spot-on-lawn method.
3.10.2. Thermostability of the bacteriocin produced: Crude bacteriocin preparation
of the strain of L. fermentum HV6b was heated at 100°C for 5, 10, 15, 20 min and at
121°C for 20min. Heat treatment at 100°C was given in a boiling water bath and that
of 121°C, was given in an autoclave at 15psi. Residual bacteriocinogenic activity was
then assayed using spot-on-lawn assay.

100
3.10.3. Sensitivity of the bacteriocin to pH changes: Crude bacteriocin preparation
of L. fermentum HV6b was adjusted to different pH values ranging from 1.0 to 10,
using 5% phosphoric acid, 1N NaOH and dil. HCl. Controls were prepared using
above bacteriocin preparations. After adjusting pH samples were kept at room
temperature for 1h and assayed by spot on lawn method.
3.10.4. Stability of the bacteriocin during refrigerated storage at -20C: For a
bacteriocin to be used as biopreservative, it is essential to have a considerable stability
towards storage conditions. In order to check the stability of the fermenticin HV6b
bacteriocin produced by L. fermentum towards refrigeration conditions, the crude
bacteriocin preparation (prepared by adsorption-desorption method, Yang et al., 1992)
was stored at -20°C for about 3 months. Serial dilutions of the crude bacteriocin
preparation was prepared in sterile deionised water up to a dilution of 1:1000 and the
bacteriocin activity were assayed using spot-on-lawn and agar well diffusion methods
after every 15 days interval.
3.10.4.1. C18 reverse phase HPLC: HPLC of the freshly purified bacteriocin
preparation was carried out. To study the stability of the bacteriocin during storage at
-20°C, RPC was again carried out after 2 and 3 months of refrigerated storage.
Degradation pattern were observed on RP- HPLC for fermenticin HV6b after storing
bacteriocin at different time intervals till 8 months to one year. For a detailed
methodology see section no. 3.7.4.
3.10.5. Circular dichroism spectroscopy: Circular dichroism (CD) spectroscopy
measures differences in the absorption of left-handed polarized light versus right-
handed polarized light which arise due to structural asymmetry. The capacity of CD to
give a representative structural signature makes it a powerful tool in modern
biochemistry with applications. Circular dichroism is exhibited by biological
101
molecules, because of their dextrorotary and levorotary components. Even more
important is that a secondary structure will also impart a distinct CD to its respective
molecules. Therefore, the alpha helix of proteins and the double helix have CD
spectral signatures representative of their structures. It determines whether a protein is
folded, and if so characterizing its secondary structure, tertiary structure, and the
structural family to which it belongs Structural elements are more clearly
distinguished since their recorded bands do not overlap extensively at particular
wavelengths as they do. The far CD spectrum of proteins can reveal important
characteristics of their secondary structure. CD spectra can be readily used to estimate
the fraction of a molecule that is in the alpha-helix conformation, the beta-sheet
conformation, the beta-turn conformation, or some other (e.g. random coil)
conformation (Kawai et al., 2004).
3.10.5.1. Methodology used: Circular dichroism was carried out to understand
conformation of fermenticin HV6b. CD model no. J-815, with a band width 0.5 nm
and response period of 1 sec at standard sensitivity was used. Measurement range
included 350 - 200 nanometres, data pitch of 1nm, with a scanning speed of 50
nm/min at room temperature. Elga water was used as solvent in CD studies of
fermenticin HV6b.
3.10.6. Peptide mass fingerprinting of fermenticin HV6b by MALDI-TOF:
In peptide sequencing, selected ion components are either positive (M+H)+ or
negative (M-H)- ions. The selected ions will pass into the collision cell, there are three
different types of bonds that can fragment along the amino acid backbone: NH-CH,
CH-CO, and CO-NH. For each of these fragments, the charge can be maintained by
either the N or C-terminal fragment. There are actually six different types of
fragments that can be formed. The mass difference between two fragments of the

102
same type is indicative of a particular amino acid. Peptide mass fingerprinting was
carried out with help of two techniques after trypsinsation or trypsin digestion of pure
protein sample. After confirming purity of protein on single band on SDS-PAGE
and/as a on single peak on HPLC chromatogram of C-18 column reverse phase
chromatography
3.10.6.1. Preparation of reagents:
a) 50 mM ammonium bicarbonate: 0.1 g of ammonium bicarbonate was dissolved
in 20 ml of 30% Acetonitrile.
b) 30% v/v Acetonitrile: 30ml of acetonitrile was dissolved in 70 ml of distilled
water.
c) 1% trifluoroacetic acid: 1ml TFA was dissolved in 9ml of distilled water.
3.10.6.2. Trypsin digestion: 1mg trypsin was dissolved in 1ml of 50 mM of
ammonium bicarbonate in 30% acetonitrile was mixed with added in 2 µl of 1%
trifluoroacetic acid in trypsin vial and incubated at 37oC for 18 h. Sample was
centrifuged with trypsin solution for digestion at 9500 rpm for 20 sec and supernatant
was collected.
3.10.6.3. MALDI-TOF analysis of Trypsin digested protein: MALDI-TOF mass
spectrometry was done Brukers Daltonics Maldi TOF. Mass spectra were obtained in
the positive ion mode, with an accelerating voltage of 25 KV. One microliter of the
trypsin digested protein was mixed with 1µl of matrix (10mg of sinapinic acid and
0.1% 4-hydroxy-α-cyanocinnamic acid in 1 ml of distilled water) and 0.3 µl of this
mixture was applied to the Teflon-coated plate. BSA was used for calibration
(Sommerer et al., 2007). Initially as a precursor and product ion, a mass fingerprinting
can occur where through further analysis and investigation the fragments of ions can
be pieced together to determine a peptide sequence. Since it is known that amino acid
103
backbone fragments among the NH-CH, CH-CO, and CO-NH bonds, each type of
bond can give rise to six different type of species, and these can then be pieced
together to provide peptide fragmentation (Sommerer et al., 2007).
3.11. Study of therapeutic potential of the isolate in vitro against opportunistic
pathogens of vaginal ecosystem:
3.11.1. In vitro inhibition of vaginal pathogens by fermentcin HV6b:
Antimicrobial activity of bacteriocins produced by LAB isolates was characterized
using spot-on-lawn and well diffusion method (Pucci et al., 1988; Toba et al., 1991).
BV associated pathogens included Bacteriodes fragilis MTCC1045, MTCC3298 and
MTCC1350, Candida albicans ATCC10231 and MTCC183, Gardnerella vaginalis
ATCC14018, Micrococcus flavus ATCC10240, Neisseria gonorrhoeae ATCC19424,
N. mucosa MTCC1772, Proteus mirabilis NCIM2387, Staphylococcus albus
ATCC11631, S. aureus MTCC737 and NCTC7447, Streptococcus agalactiae
NCIM2401, S. faecalis MTCC459, S. pyogenes NCTC10869 and S. thermophilus
MTCC1928 used to study inhibition of these vaginal pathogens by fermenticin HV6b.
3.11.2. Biomedical application on cancer cell lines:
3.11.2.2. Tissue models for testing anticancerous activity of fermenticin HV6b:
Protocol: Tissues were seeded in culture flasks containing DMEM and RPMI-1640
medium with 10% fetal bovine serum and 100 µg/ml penicillin and streptomycin, and
cultured in a humidified 5% CO2 incubator at 37oC. After reaching 80% confluence,
cells were passaged and cultured. Spent culture medium was discarded. The cell layer
was rinsed with 0.25% (w/v) trypsin- 0.53 mM EDTA solution to remove all traces of
serum which may contain trypsin inhibitor. 6.0 to 8.0 ml of growth medium was
added and cells were aspirated by gently pipetting. Tissues were exposed to different
concentration of fermenticin HV6b ranging from 0.1µg/ml,1µg/ml and 10µg/ml for

104
24 and 48 hours. For exposure time over 24 hours, the tissues were fed with fresh
assay media. After the required exposure time, MTT assay was used to determine
overall cell viability. Cell counts of tissue models were checked using
haemocytometer (Kumar et al., 2012).
3.11.2.2.1 Properties of Cell lines used in the study:
1. HEP G2 CRL-10741
Growth properties: Adherent
Organism: Homo sapiens
Deposited as human morphology: Epithelial
Source Organ: Liver
Disease: Hepatocellular carcinoma
Growth medium for culturing: A 1:1 mixture of Dulbecco's modified Eagle's
medium and Ham's F12 g/l medium with 2.5 mM L-glutamine, 15 mM HEPES, 0.5
mM sodium pyruvate and 1200 sodium bicarbonate and supplemented with 0.4 mg/ml
G418, 90%; fetal bovine serum, 10%
Atmosphere: air, 95%; carbon dioxide (CO2), 5%
Temperature: 37 °C
Growth Conditions: These cells are slow to attach after subculture. Allow 4 to 5
days for reattachment.
Subcultivation ratio: A subcultivation ratio of 1:4 to 1:6 is recommended
Medium Renewal: Every 2 to 3 days
Freeze medium: Complete growth medium supplemented with 5% (v/v) DMSO
Storage temperature: liquid nitrogen vapor phase.
2. HeLa (CCL-2)
Adherent organism: Homo sapiens
105
Morphology: Epithelial
Organ: Cervix
Disease: Adenocarcinoma
Cell Type: Epithelial
Growth medium: The base medium for this cell line is ATCC-formulated Eagle's
Minimum Essential Medium, Catalog No. 30-2003. To make the complete growth
medium, add the following components to the base medium: fetal bovine serum to a
final concentration of 10%.
Atmosphere: air, 95%; carbon dioxide (CO2), 5%
Temperature: 37 °C
Subcultivation ratio: A subcultivation ratio of 1:2 to 1:6 is recommended .
Medium renewal: 2 to 3 times per week Preservation
Freeze medium: Complete growth medium supplemented with 5% (v/v) DMSO
Storage temperature: liquid nitrogen vapor phase.
3. MCF7 (HTB-22)
Adherent Organism: Homo sapiens
Morphology: epithelial
Organ: mammary gland; breast
Disease: adenocarcinoma
Derived from metastatic site: pleural effusion
Cell Type: epithelial
Growth medium: The base medium for this cell line is ATCC-formulated Eagle's
Minimum Essential Medium, Catalog No. 30-2003. To make the complete growth
medium, add the following components to the base medium: 0.01 mg/ml bovine
insulin; fetal bovine serum to a final concentration of 10%.
106
Atmosphere: air, 95%; carbon dioxide (CO2), 5%
Temperature: 37 °C
Subcultivation Ratio: A subcultivation ratio of 1:2 to 1:6 is recommended
4. Sp2/0-Ag14 (CRL-1581)
Organism: Mus musculus (B cell); Mus musculus (myeloma) deposited as mouse (B
cell); mouse (myeloma)
Morphology: Lymphoblast
Source organ: Spleen
Strain: BALB/c
Cell type: Hybridoma, B lymphocyte;
Growth medium: The base medium for this cell line is ATCC-formulated Dulbecco's
Modified Eagle's Medium, Catalog No. 30-2002. To make the complete growth
medium, add the following components to the base medium: fetal bovine serum to a
final concentration of 10%.
Temperature: 37 °C Subculturing:
Medium Renewal: Add fresh medium every 2 to 4 days (depending on cell density)
Freeze medium: Complete growth medium 95%; DMSO, 5%
Storage temperature: liquid nitrogen vapor phase
Subcultivation Ratio: A subcultivation ratio of 1:2 to 1:6 is recommended
5. HEK 293 (CRL-1573.3)
Organism: Human Embryonic Kidney
Morphology: rounded
Source: Organ: Kidney
Age: fetus
Cell Type: hybridoma: endothelial, epithelial, or fibroblasts.
107
Growth medium: ells should be grown in a complete SFMII growth medium
supplemented with 4mM L-glutamine. To make the complete growth medium, add
the following components to the base medium: fetal bovine serum to a final
concentration of 10%.
Temperature: 37 °C Subculturing:
Medium Renewal: Add fresh medium every 2 to 4 days (depending on cell density)
Freeze medium: Complete growth medium 95%; DMSO, 5%
Storage temperature: liquid nitrogen vapor phase
Subcultivation Ratio: A subcultivation ratio of 1:2 to 1:6 is recommended
3.11.2.3. MTT viability assay:
The MTT assay was carried out according to the protocol given by Mosmann
(1983). The viability of the cells exposed to bacteriocin, was measured as a direct
proportion of the breakdown of yellow compound tetrazolium to dark blue water
insoluble formazan. Only the metabolically active cells can show this reaction which
can be solubilized with DMSO and then quantified. The absorbance of formazon
directly correlates with the number of viable cells. The liquid in the plate wells was
combined with the liquid from the tissue. Mixture is then assayed
spectrophotometrically at 540nm using 96 wells plate ELISA reader to determine
level of tetrazolium degradation.
3.11.2.4. DNA fragmentation:
Cells (1 X 10⁵) were cultured for 24 h, treated with 1·0 mg/ml fermenticin
HV6b for 48 h, and then lysed with 250 µl lysis buffer. After incubation at 37oC for
90 mins, 200 µg/ml proteinase K was added and incubated again for 60 mins at 50oC.
Lithium chloride (0.2%w/v) was added to assist cell lysis and as an inhibitor of
nucleases. After incubation, suspension was centrifuged at 13,000 rpm for 3 mins,
108
aqueous phase was transferred to fresh tube containing deproteinizing mixture of
phenol, chloroform and isoamyl alcohol (25:24:1) and again centrifuged at 3,000 rpm
for 3 min. DNA was precipitated from the aqueous phase with 3 volumes of chilled
ethanol containing 0.3 M sodium acetate at 4oC. Samples were subjected to
electrophoresis in 1% w/v agarose gel using TBE buffer at 50V and visualized on a
UV transilluminator (Kumar et al., 2013).
3.12. Effect of fermenticin HV6b on G. vaginalis adhesion to HeLa cell lines:
HeLa, a cervical cancer cell line was cultured in MEM supplemented with
10% fetal calf serum (FCS) at 37ºC in 5% CO2 Cells were washed by differential
centrifugation three times in 20ml of MEM at 800rpm for 10 min. The cells were
resuspended in 10ml of MEM and filtered through a membrane filter with a pore size
of 8 µm (Millipore). Cells were resuspended in essential medium and adjusted to final
concentration of 2×10⁴ washed epithelial cells per ml, as counted by
haemocytometer counting chamber.
G. vaginalis grown on Casman agar was suspended in phosphate-buffered
saline; pH 7.2 and washed three times in 20ml of phosphate-buffered saline by
centrifugation at 2500 rpm. After resuspension of bacteria in phosphate buffer saline,
the cell counts were adjusted to 108 cfu/ml using haemocytometer. For positive
control, one ml of bacterial suspension was mixed with 1ml of HeLa cell suspension
so that a ratio of 5×10³ bacteria per HeLa cell can be achieved. Suspension was
incubated aerobically on a rocker at 37oC for 30 min (pH 7.2) and diluted 1:2 in
phosphate buffer saline. Now, in test samples three different concentrations 100µg/ml,
500 µg/ml of fermenticin HV6b were added to G. vaginalis infected HeLa cells. HeLa
cells were then washed to remove nonadherent bacteria by differential centrifugation
at 800 rpm and filtered it through 8 µm (Millipore) membrane filter. For transferring
the cells to slides, membranes were gently pressed against the glass slides.
109
Cells attached with slides were fixed with 95% ethanol for 15 min and air
dried and Gram stained. The number of bacteria adherent to HeLa cells were counted
under a light microscope (Olympus Stereozoom Microscope 1,000X). In each
experiment, 50 HeLa cells were studied after 60 and 90 minutes of bacteriocin
exposure, and triplicates determinations were performed ( Mårdh and Westtöm,
1976).
3.13. Semen sample collection and analysis:
Partially purified fermenticin HV6b preparation was used as spermicide to test
its effect on motility and immobilization of human spermatozoa. Two semen samples
were collected from healthy volunteers in sterile wide-mouth polypropylene
containers with a screw cap by self-masturbation on the day of experimentation.
Within 1h of collection, samples were dispensed. By mixing a drop of diluted
spermicide with a drop of semen and examining under microscope, an approximation
is obtained to the highest bacteriocin concentration that does immobilize spermatozoa
in 2 min, and the series of dilutions to be used in the test are made in a range below
this point. Total sperm count was calculated using a compound microscope (Olympus,
100X) after dilution (1:50) of the semen in normal saline. The sperm suspensions
were made in small glass tubes, one tube being required for each concentration of the
spermicide. The suspensions were made by adding 0.5 ml of semen to each tube of
saline or spermicide solution. Samples were placed in an incubator at 37°C for 15 to
30 min to reach that temperature. The percent sperm motility was determined by the
progressive (forward) and non-progressive (vibrating and zig-zag) movement of
sperm observed in a compound microscope. The sperm count was calculated using
Newbauer haemocytometer from a count of between 100-200 sperms using randomly
selected (100X) (Sutyak et al., 2008).

110
3.13.1. Treatment of spermatozoa with fermenticin HV6b:
Sutyak test (2008) was used to determine the effect of purified bacteriocin
fermenticin HV6b on the motility of human spermatozoa with little modifications
(Sutyak et al., 2008). To measure the effect of fermenticin HV6b on sperm mobility
and aggregation after 30 sec exposure time to different concentrations of bacteriocin
ranging from 50 to 200µg/ml of diluted semen sample. The motilities of human
spermatozoa cells from random high magnification fields (100X) of the sample were
determined in duplicate using atomic force microscope. Results were evaluated
according to WHO grade system and motilities of sperms are divided into four
different grades (Wilson, 2005). Grade a sperms have progressive motility. These are
the strongest and swim fast in a straight line. Grade b sperms also exhibit forward
movement but tend to travel in a curved or crooked motion. Grade c sperms show
non-progressive motility because they do not move forward despite the fact that they
move their tails and Grade d sperms are immotile and fail to move at all.
3.14. Sensitivity analysis of G. vaginalis: fermenticin HV6b vs antibiotics:
Antibiotic susceptibility G. vaginalis was studied against different
concentrations (20 to 80 µg/ml) of some commonly prescribed antibiotics to BV
patients including ampicillin, amoxicillin, amoxicillin and clavalanic acid,
azithromycin, ciprofloxacin, co-trimoxazole, erythromycin, gentamycin,
metronidazole, nalidixic acid, ofloxacin, penicillin, rimphicin, tetracycline, tinidazole
and vancomycin by agar well diffusion method and disc diffusion method.
1. Agar well diffusion method: The original methodology was modified a little and
was then used to assay antibiotic sensitivity of G. vaginalis (Sarkar and Banerjee,
1996). The drugs commonly used for the treatment of bacterial vaginiosis. These
drugs have been procured from Unisons Pharma Baddi. Five dilutions of those drugs
were made and filled in the wells on the culture plates of G. vaginalis in Casman
111
medium seeded with 18h old 105-106 cfu/ml cells. Wells of 6mm diameter cut with
sterile cork borer were filled with 100µl of the antibiotic solution. Plates were kept at
4°C for 1h to allow diffusion of antibiotics out of the wells and incubated at 30°C for
24h. The antibiotic sensitivity activity of isolates was detected and quantitated by
measuring the width of the clear zones around the wells in the resultant lawn culture.
2. Disc diffusion method: Disc diffusion method 1% Casman media agar plates were
prepared and then mix 30µl of 24 hour old G. vaginalis in 0.75% soft agar and mixed
well and spread gently on selective agar plate. Then discs containing above enlisted
antibiotics were placed on petri plates and 5 µl antibiotic dilution was spotted on
them. Plates were incubated at 37°C for 24 hours and the inhibition zones were
observed for metronidazole, metronidazole H, tinidazole, amoxicillin +clavulanic
acid, cefaxime, amoxicillin, ciprofloxacin, erythromycin, co-trimoxazole, tetracycline,
azithromycin, miconazole, rifampicin (Jorgensen et al., 2007).


![Download [2.96 MB]](https://img.dokumen.tips/doc/110x75/5873c7231a28ab29048c054c/download-296-mb.jpg)

